Velocity-resolved hot water emission detected toward HL Tau with the Submillimeter Array
Abstract
Using the Submillimeter Array (SMA) on Mauna Kea, the HO 102,9–93,6 transition (=1863 K) at 321.2 GHz has been detected toward the embedded low-mass protostar HL Tau. The line centroid is blue-shifted by 15 km s-1 with respect to the source velocity, and it has a of 20 km s-1. The emission is tentatively resolved and extends 3–4′′ over the sky (2 beams), or 500 AU at the distance of Taurus. The velocity offset, and to a lesser degree the spatial extent of the emission, shows that the line originates in the protostellar jet or wind. This result suggests that at least some water emission observed toward embedded sources, and perhaps also disk sources, with Herschel and Spitzer contains a wind or jet component, which is crucial for interpreting these data. These pathfinder observations done with the SMA opens a new window to studying the origin of water emission with e.g. ALMA, thus providing new insights into where water is in protostellar systems.
Subject headings:
astrochemistry — ISM: jets and outflows — line: profiles — stars: formation — stars: winds, outflows1. Introduction
Water plays a key role in the formation of stars and planets. It is one of the dominant coolants of warm and hot molecular gas (3001500 K, e.g., Karska et al. 2013), for example in star-forming regions. Furthermore, water is an excellent probe of dense shocked gas in embedded protostellar systems (e.g. Kristensen et al. 2013). During later evolutionary stages, water may play a key role in planet formation (Stevenson & Lunine 1988) and it may trace the radiation environment and gas density in disks (Bethell & Bergin 2009). See van Dishoeck et al. (2014) for a full review. The main isotopolog of water, HO, is difficult to observe from the ground because of the blocking atmosphere, and primarily maser transitions and highly excited rovibrational transitions at infrared wavelengths have been observed so far (e.g. Menten & Melnick 1991, Salyk et al. 2008, Pontoppidan et al. 2010). Space telescopes, such as the Spitzer Space Telescope (Gallagher et al. 2003) and Herschel Space Observatory (Pilbratt et al. 2010), made observations of rotationally excited water technically feasible, although these missions all lack the spatial and spectral resolution required to precisely pinpoint the origin of water emission.
Water emission may serve as an evolutionary tracer of young stellar objects (YSOs). During the embedded stages, water is uniquely associated with shocks and outflow activity and no detected emission is coming from the disk or envelope (e.g Herczeg et al. 2012, Karska et al. 2014). At later evolutionary stages, the disk appears to dominate the picture: these sources often do not have any detectable outflow activity associated with them, although the sources are still accreting (e.g. Carr & Najita 2008, Hogerheijde et al. 2011, Riviere-Marichalar et al. 2012). Particularly, for disk sources, the hot water detected by both Spitzer and Herschel seemingly originates in the inner AU of the disk, where it is hot enough that all water is sublimated from the grains, and where the gas is dense enough that the lines are excited (Riviere-Marichalar et al. 2012, Howard et al. 2013, Fedele et al. 2013). This scheme raises a number of questions, for example, when does water switch from being a shock tracer to a disk tracer? And if the more evolved sources are still accreting (i.e. also ejecting) material, how certain is the interpretation that the hot water is coming from the inner disk and not a shock?
HL Tau shows characteristics of both deeply embedded YSOs (envelope, molecular outflow) and disk sources (spatially resolved, Keplerian disk) and is clearly intermediate in evolutionary stage between the so-called Class I and II stages (ALMA Partnership et al. 2015, and references therein). Herschel-PACS detected hot HO emission (=818–707, 63.32 m, =1071 K) toward this source (Riviere-Marichalar et al. 2012). Because of the low spectral and spatial resolution (100 km s-1 and 94, respectively), interpreting the origin of emission is not straightforward and requires a model. Riviere-Marichalar et al. (2012) interpreted the emission as coming from the inner disk (1–3 AU), but a wind origin cannot be excluded111“Wind” here refers to anything that is launched from or near the protostar, whereas “outflow” is reserved for cold ( K) entrained material.. New observations of water emission from the system are required to break this degeneracy.
The HO 102,9–93,6 transition at 321.226 GHz (/=1863 K) is located on the shoulder of the deep atmospheric H2O absorption feature caused by the 42,2–51,5 transition at 325.1 GHz (/=454 K). The 102,9–93,6 transition itself is not affected by atmospheric conditions as the lower-level energy (1846 K) is too high to be excited under normal conditions. However, because of its proximity to the 325 GHz absorption feature, excellent atmospheric conditions are required to observe this water line. The line has previously been observed and detected toward high-mass star-forming regions and AGB stars (e.g. Menten & Melnick 1991, Patel et al. 2007, Hirota et al. 2014) where it is a well-known maser, but it has not been detected toward low-mass YSOs.
We here report on the detection of HO emission toward the embedded disk source HL Tau. Section 2 contains the observational details and results are presented and analyzed in Section 3. The results are discussed and summarized in Section 4.
2. Observations
HL Tau (RA=04h31m3844, dec=+18∘13′576) was observed on Dec. 18, 2013 with the SMA in the compact configuration. The receivers were tuned to the HO 102,9–93,6 transition at 321.226 GHz, and the transition was placed in chunk 1 of the upper sideband. The amount of precipitable water vapor in the atmosphere was low, PWV1 mm (0.06), throughout the night. Six antennas were available in the array at the time of observation. The absolute flux was calibrated against observations of Ganymede, and observations of 3c454.3 were used for bandpass calibration. The quasars 3c120 and 0510180 were used as gain calibrators.
Data were reduced and imaged in CASA 4.1 (Common Astronomy Software Applications; McMullin et al. 2007). Data from the upper IF band (323–325 GHz) were too close to the 325.1 GHz water absorption feature and were flagged because the was too low on all calibrators. The data reduction followed the standard steps of calibrating the bandpass, followed by calibrating the phase and finally the absolute flux. The continuum was imaged first and HL Tau appears as a point source in the SMA compact configuration, consistent with recent ALMA observations at similar frequencies (ALMA Partnership et al. 2015). Because of its high continuum flux density (2 Jy beam-1) the data were self-calibrated and the solution was mapped onto the line channels. After calibration, the continuum was subtracted from the complex visibilities. The line data were imaged with a natural weighting to maximize at the expense of spatial resolution. The resulting beam size is 3023 (PA=62∘).
3. Results and analysis
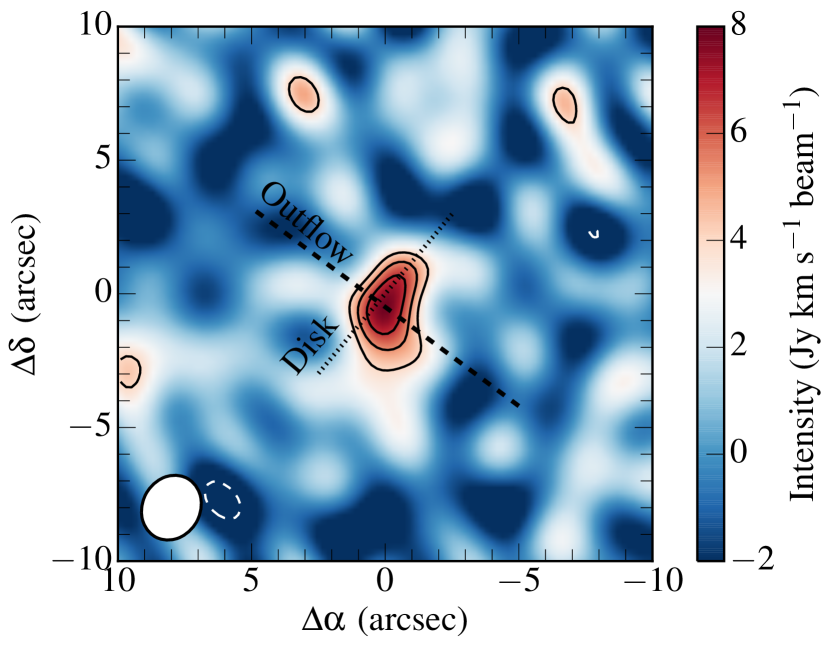
HO 102,9–93,6 is detected towards HL Tau, and a map of integrated emission is shown in Fig. 1, where emission is integrated from –22.5 to 10 km s-1. The noise level in the map is 1.2 Jy km s-1 beam-1 when measured in emission-free regions222All quoted uncertainties are rms uncertainties and do not include systematic uncertainties, such as the absolute calibration uncertainty which is estimated to be 20%.. Emission is tentatively extended to the south of the source over a region of 3–4′′ or 500 AU at the distance of Taurus (140 pc; e.g. Torres et al. 2009), where the extended emission is at the 3–4 level. The extended emission falls between the directions of the disk and outflow (Carrasco-González et al. 2009); because of the low significance of this southern extension, we exclude it from further analysis. Observations with better sensitivity are needed to confirm the reality of any spatial extent beyond the size of the SMA beam.
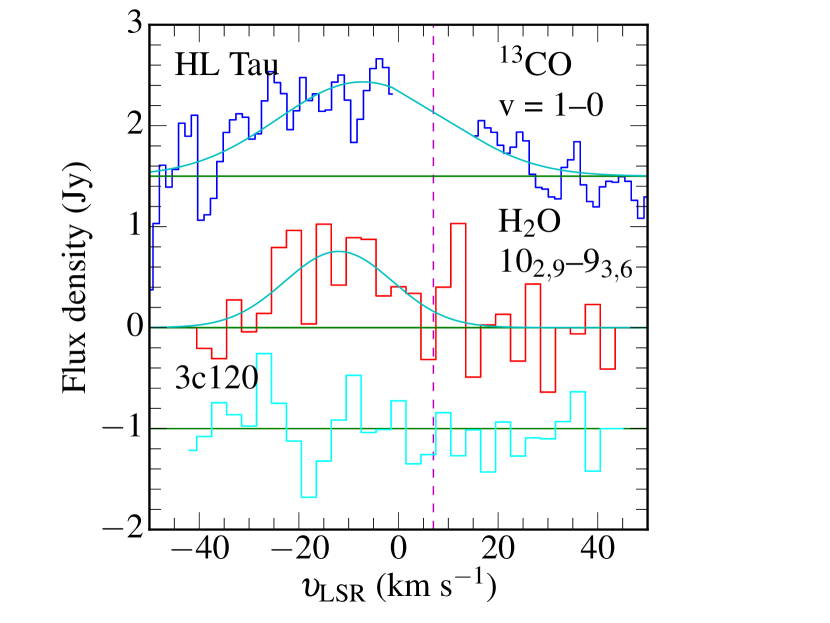
The spectral profile extracted over the emitting region shows that the line profile is broad, =256 km s-1, and blue-shifted by 193 km s-1 from the source velocity (=7.00.2 km s-1 based on ALMA observations of a number of high-density gas tracers; ALMA Partnership et al. 2015) (Table 1; Fig. 2). The noise level in the spectrum, when measured over emission-free channels (15 km s-1) is 0.4 Jy in 3 km s-1 channels. The integrated intensity over the entire emitting region is 183 Jy km s-1, corresponding to a 6 detection.
To verify that the line is not an artifact of the bandpass calibration, the complex gain calibrators were imaged in the same way as HL Tau. The emission feature is not present toward either calibrator (see spectrum of the strongest gain calibrator 3c120; Fig. 2) and we conclude the emission is not reduction-related. Furthermore, when plotting just the vector-averaged spectrum before cleaning, the line is detected at the same significance as in the cleaned image, and therefore the line is not introduced as an image artifact.
Because of the apparent offset in velocity, the Splatalogue database333http://splatalogue.net was checked for other potential sources of emission. No other likely candidate is present. The 13CH3OH 105,6–114,7 transition at 321.203 GHz (=260 K) falls close to the source velocity, but 13CH3OH has not been detected toward any source similar to HL Tau, and so we exclude this remote possibility.
The 321 GHz water transition has previously been detected toward high-mass star-forming regions and AGB stars (Menten et al. 1990, Patel et al. 2007, Hirota et al. 2014), but never toward a low-mass YSO. The previous detections are, to the best of our knowledge, all masering where the brightness temperature is well in excess of 200 K. The brightness temperature is 10 K toward HL Tau, but since the emitting region is only very tentatively resolved, the actual brightness temperature may be much higher. However, the large line width (25 km s-1) suggests that emission is thermal rather than masing, as the latter typically show line widths of 1–2 km s-1 (e.g. Patel et al. 2007).
With interferometric observations, signals with large spatial extent (specifically, larger than that probed by the shortest baselines) are filtered out. In this case, the emission from the excited H2O line observed with PACS is confined to the central pixel (Riviere-Marichalar et al. 2012), measuring 9494, and so it is unlikely that the even higher-excited water line presented here should be extended beyond the PACS spaxel. In addition, in the SMA compact configuration, spatial scales from 2–20′′ are recovered and spatial filtering is therefore not an issue.
A similar line profile is observed in co-added rovibrational 13CO transitions at 4.7 m (Herczeg et al. 2011, 3000 K), see Table 1; Fig. 2, where the CO emission is compact and spatially unresolved at 02 resolution (30 AU). The authors attribute the lack of extended emission to the high critical density of the CO transitions, 51012 cm-3. For comparison, the critical density of the H2O transition is only 104 cm-3 and so it is likely that the vibrationally excited CO is confined to a comparatively small region near the protostar.
| (km s-1) | (km s-1) | (Jy km s-1) | |
|---|---|---|---|
| H2O 102,9–93,6 | 25(6) | –12(3) | 18(3) |
| 13CO, = 1–0bbFrom Herczeg et al. (2011). | 40(4) | –7(6) |
3.1. Comparison to radiative transfer models
A good test to assess the origin of the 321 GHz emission, as well as assessing if the emission arises in the same region as the 63 m emission, is to estimate the local excitation conditions of the two lines. In the following, this is done in two ways: first assuming local thermodynamic equilibrium (LTE), second using the non-LTE isothermal code RADEX.
Carr & Najita (2011) and Salyk et al. (2011) took a similar approach for analyzing the highly excited water lines observed toward a large sample of classical T Tauri stars with Spitzer. Under the assumption of LTE, they found that emission typically originates in warm gas with 5–600 K with a high column density (1018 cm-2) and small emitting radius (1 AU). Modeling of the 63 um water emission line with the disk chemistry code ProDiMo (Woitke et al. 2009), as well as comparison of line fluxes with Spitzer-based LTE models, suggests this line originates from a slightly larger emitting region with radius 3 AU (Riviere-Marichalar et al. 2012).
The high flux of the 321 GHz line excludes this line and the 63 m emission being in LTE; the value of / is higher for the 321 GHz line than the 63 m line, in spite of also being higher. The critical density of water lines is typically so high, compared to the ambient density, that the levels are sub-thermally populated. In this case, the critical densities are 104 cm-3 and 1010 cm-3 for the 321 GHz and 63 m transitions, respectively, at 500 K. Thus, it is possible that the 321 GHz transition is more efficiently excited, in spite of the higher level energy (1800 vs. 1070 K).
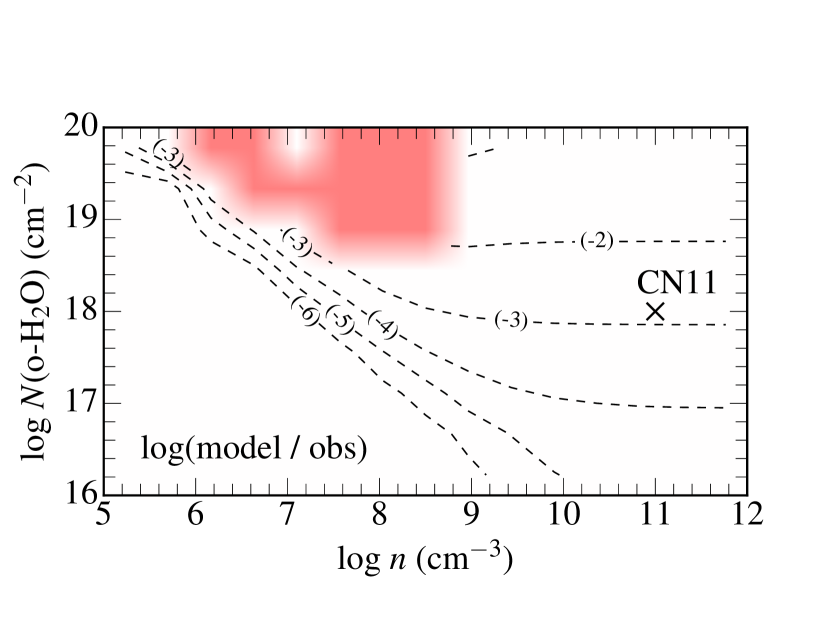
To test if a non-LTE, but isothermal, solution exists for the observed fluxes, the non-LTE radiative transfer code RADEX is used (van der Tak et al. 2007) to attempt reproducing the observed line ratio of (3.30.6)10-3. The collisional rate coefficients calculated by Faure & Josselin (2008) are used in both cases because these include highly excited rotational states as well as rovibrational states; similar results are obtained if the collisional rates from Daniel et al. (2011) are used. A constant line width of 25 km s-1 is used in these calculations, and a grid spanning (o-H2O)=1013–1020 cm-2, (H2)=105–1012 cm-3, and =200–5000 K was calculated. The observed flux ratio is not found anywhere in this large grid. Figure 3 shows an example of modeled line ratios vs. the observed one, and the models fall short by orders of magnitude in this grid. There are three likely explanations for this discrepancy: (i) the model is inadequate, (ii) the 321 GHz line is masering, or (iii) the lines do not share a common physical origin. The actual reason may of course also be a combination of these. Each explanation is detailed below.
The model may be inadequate. The line opacities calculated by the model are very high, often 100 at high column densities, and the model assumptions no longer apply. Naturally, this mostly applies to the high-column-density regime where a solution, if it exists, is most likely to be found.
The non-LTE code takes masering into account when calculating the level populations and resulting line intensities, but does not include amplification along the masering path. Models with (o-H2O)1019 cm-2 and (H2)=106–109 cm-3 showed negative line opacities, –1, and are thus masing. These values are consistent with an analysis based on the masering constraints presented by Neufeld & Melnick (1990). However, the large observed line width, 25 km s-1, is unlike typical maser emission which shows line widths of 1 km s-1 (Patel et al. 2007). Given the low of the line, it cannot be ruled out that the profile consists of an ensemble of narrow maser features; indeed water masers are often observed toward Class I objects in the known 22 GHz maser transition (e.g. Furuya et al. 2003). Only observations with significantly higher sensitivity, such as with ALMA, will be able to exclude this possibility.
Finally, the two lines may not share a common origin and an isothermal solution is therefore not appropriate. As noted above, the critical density of the 321 GHz line is significantly lower than that of the 63 m line by six orders of magnitude. It is therefore possible that the 321 GHz line is predominantly excited in a hot low-density environment, whereas the 63 m line requires a denser, possibly cooler, environment. On the other hand, the 13CO line, with a critical density two orders of magnitude higher than that of the 63 m water line, shows a similar line profile to the 321 GHz line, suggesting that these two originate in the same medium. This further suggests that density is not the critical parameter in exciting these transitions, but rather temperature which argues in favor of an isothermal solution.
The 13CO emission is interpreted as originating in a disk wind which is unresolved at 02 resolution (30 AU) (Herczeg et al. 2011). The 13CO column density is not measured toward HL Tau because of the relatively low of the individual rovibrational lines, but similar sources show total 12CO column densities of 1019 cm-2 over emitting radii of 1–4 AU. If the vibrationally excited CO originates in the same component as H2O, this sets an upper limit on the H2O column density. In the case that all oxygen not locked up in CO is driven into H2O, the H2O column density is at most 1.31019 cm-2. This upper limit implies that if the 13CO and 321 GHz water emission originate in the same physical region, as suggested by the similarity in line profile, then the water is either masing or the simple isothermal non-LTE model is inadequate. An observation of both the 325 GHz para-HO line (=51,5–42,2, =470 K) and the 321 GHz line with ALMA would be able to break this degeneracy. The lower-exited line has a critical density similar to the 321 GHz line (105 cm-3) but obviously a significantly lower upper-level energy and so the ratio of these two line strengths would probe the temperature dependence of the excitation.
4. Discussion
4.1. Origin of emission
The PACS water emission from Class II sources has previously been interpreted as originating in the inner hot disk (1–3 AU) where the temperature exceeds 600 K (Riviere-Marichalar et al. 2012, Howard et al. 2013), mainly due to a lack of spatial extent in the PACS data. Emission in these observations is always confined to the central 9494 PACS spaxel (typically 1300 AU), and is only seen toward sources with known jets or winds.
The observed line profile of the 321 GHz emission shows an offset of 20 km s-1 from the source velocity. If such an offset is caused by Keplerian rotation in the inner disk at a radius of 1–3 AU, then the stellar mass would be 0.5–1.5 . This stellar mass is consistent with what has been inferred previously (Sargent & Beckwith 1991). However, if the emission originates in a disk, the line profile should be symmetric unless something is hiding the red-shifted counterpart. The disk inclination with respect to the line of sight is estimated to be 40∘ (Kwon et al. 2011, ALMA Partnership et al. 2015) and so the red-shifted counterpart should be visible. Even in the very inner disk where the dust is optically thick at sub-mm wavelengths (ALMA Partnership et al. 2015), the surface layers of the entire disk are visible and not just the blue-shifted side. The velocity offset of the line implies an origin outside of the disk.
Similar line profiles have been observed toward other sources, in particular the more embedded Class 0 sources (Kristensen et al. 2013), in emission from H2O and light hydrides. The Herschel-HIFI observations are interpreted as originating in dissociative wind shocks close to the protostar, where the dissociation is caused by external UV radiation. HL Tau drives a molecular outflow (e.g. Cabrit et al. 1996, Lumbreras & Zapata 2014, ALMA Partnership et al. 2015) as well as an optical jet (e.g. Movsessian et al. 2007) and so it is likely that the observed H2O emission is related to one of these components. Indeed, wind models by Panoglou et al. (2012) and Yvart et al. (2016) predict that a significant fraction of Class I/II winds are molecular. The data presented here do not have high enough to constrain the type of wind (see Agra-Amboage et al. 2014, for a description of different wind types, as well as their diagnostics).
If the emission is caused by a protostellar wind, the red-shifted lobe of the wind still needs to be hidden. A possibility is that the disk opacity is so high at 321 GHz that the other side is hidden. The recent ALMA high-resolution data (ALMA Partnership et al. 2015) show that this is indeed the case, at least for the inner 10 AU or so but likely extending out to and including the first dust ring at a radius of 20 AU. At larger distances the dust is optically thin, with the exception of a more distant ring at 80 AU. These radii put natural limits on the extent of the emitting region which must be smaller than the optically thick dust, i.e. 20 AU.
4.2. Implications for hot water in protostellar systems
At most 10% of the detected 321 GHz water emission toward HL Tau can be assigned to a disk origin, a number which is based on the upper limit of detectable emission centered at the source velocity and for an assumed linewidth of 10 km s-1. HL Tau is intermediate in evolutionary stage between Class I and II YSOs. Therefore, the potential implications for interpretation of Spitzer and Herschel water detections from more evolved T Tauri stars is important and, as yet, unclear. Furthermore, this source drives a strong outflow and jet. Thus, it is possible that HL Tau represents an earlier stage in the evolution where the water in the inner disk is less abundant, and water is predominantly associated with the outflow whereas more evolved sources do indeed have water-rich inner disks.
Future observations at higher sensitivity and angular resolution will be required to pin down the origin of highly excited water emission more accurately. However, these observations already open a new window for studying hot water from the ground, particularly where the water emission is coming from (inner disk vs. wind) and thus ultimately where water is located in protostellar systems and how much there is of it.
References
- Agra-Amboage et al. (2014) Agra-Amboage, V., Cabrit, S., Dougados, C., et al. 2014, A&A, 564, A11
- ALMA Partnership et al. (2015) ALMA Partnership, Brogan, C. L., Pérez, L. M., et al. 2015, ApJ, 808, L3
- Bethell & Bergin (2009) Bethell, T., & Bergin, E. 2009, Science, 326, 1675
- Cabrit et al. (1996) Cabrit, S., Guilloteau, S., Andre, P., et al. 1996, A&A, 305, 527
- Carr & Najita (2008) Carr, J. S., & Najita, J. R. 2008, Science, 319, 1504
- Carr & Najita (2011) Carr, J. S., & Najita, J. R. 2011, ApJ, 733, 102
- Carrasco-González et al. (2009) Carrasco-González, C., Rodríguez, L. F., Anglada, G., & Curiel, S. 2009, ApJ, 693, L86
- Daniel et al. (2011) Daniel, F., Dubernet, M.-L., & Grosjean, A. 2011, A&A, 536, A76
- van Dishoeck et al. (2014) van Dishoeck, E. F., Bergin, E. A., Lis, D. C., & Lunine, J. I. 2014, Protostars and Planets VI, 835
- Faure & Josselin (2008) Faure, A., & Josselin, E. 2008, A&A, 492, 257
- Fedele et al. (2013) Fedele, D., Bruderer, S., van Dishoeck, E. F., et al. 2013, A&A, 559, A77
- Furuya et al. (2003) Furuya, R. S., Kitamura, Y., Wootten, A., Claussen, M. J., & Kawabe, R. 2003, ApJS, 144, 71
- Gallagher et al. (2003) Gallagher, D. B., Irace, W. R., & Werner, M. W. 2003, in Proc. SPIE, Vol. 4850, IR Space Telescopes and Instruments, ed. J. C. Mather, 17–29
- Herczeg et al. (2011) Herczeg, G. J., Brown, J. M., van Dishoeck, E. F., & Pontoppidan, K. M. 2011, A&A, 533, A112
- Herczeg et al. (2012) Herczeg, G. J., Karska, A., Bruderer, S., et al. 2012, A&A, 540, A84
- Hirota et al. (2014) Hirota, T., Kim, M. K., Kurono, Y., & Honma, M. 2014, ApJ, 782, L28
- Hogerheijde et al. (2011) Hogerheijde, M. R., Bergin, E. A., Brinch, C., et al. 2011, Science, 334, 338
- Howard et al. (2013) Howard, C. D., Sandell, G., Vacca, W. D., et al. 2013, ApJ, 776, 21
- Karska et al. (2013) Karska, A., Herczeg, G. J., van Dishoeck, E. F., et al. 2013, A&A, 552, A141
- Karska et al. (2014) Karska, A., Kristensen, L. E., van Dishoeck, E. F., et al. 2014, A&A, 572, A9
- Kristensen et al. (2013) Kristensen, L. E., van Dishoeck, E. F., Benz, A. O., et al. 2013, A&A, 557, A23
- Kwon et al. (2011) Kwon, W., Looney, L. W., & Mundy, L. G. 2011, ApJ, 741, 3
- Lumbreras & Zapata (2014) Lumbreras, A. M., & Zapata, L. A. 2014, AJ, 147, 72
- McMullin et al. (2007) McMullin, J. P., Waters, B., Schiebel, D., Young, W., & Golap, K. 2007, in Astronomical Data Analysis Software and Systems XVI (ASP Conf. Ser. 376), ed. R. A. Shaw, F. Hill, & D. J. Bell, 127
- Menten & Melnick (1991) Menten, K. M., & Melnick, G. J. 1991, ApJ, 377, 647
- Menten et al. (1990) Menten, K. M., Melnick, G. J., & Phillips, T. G. 1990, ApJ, 350, L41
- Movsessian et al. (2007) Movsessian, T. A., Magakian, T. Y., Bally, J., et al. 2007, A&A, 470, 605
- Neufeld & Melnick (1990) Neufeld, D. A., & Melnick, G. J. 1990, ApJ, 352, L9
- Panoglou et al. (2012) Panoglou, D., Cabrit, S., Pineau Des Forêts, G., et al. 2012, A&A, 538, A2
- Patel et al. (2007) Patel, N. A., Curiel, S., Zhang, Q., et al. 2007, ApJ, 658, L55
- Pilbratt et al. (2010) Pilbratt, G. L., Riedinger, J. R., Passvogel, T., et al. 2010, A&A, 518, L1
- Pontoppidan et al. (2010) Pontoppidan, K. M., Salyk, C., Blake, G. A., & Käufl, H. U. 2010, ApJ, 722, L173
- Riviere-Marichalar et al. (2012) Riviere-Marichalar, P., Ménard, F., Thi, W. F., et al. 2012, A&A, 538, L3
- Salyk et al. (2008) Salyk, C., Pontoppidan, K. M., Blake, G. A., et al. 2008, ApJ, 676, L49
- Salyk et al. (2011) Salyk, C., Pontoppidan, K. M., Blake, G. A., Najita, J. R., & Carr, J. S. 2011, ApJ, 731, 130
- Sargent & Beckwith (1991) Sargent, A. I., & Beckwith, S. V. W. 1991, ApJ, 382, L31
- Stevenson & Lunine (1988) Stevenson, D. J., & Lunine, J. I. 1988, Icarus, 75, 146
- Torres et al. (2009) Torres, R. M., Loinard, L., Mioduszewski, A. J., & Rodríguez, L. F. 2009, ApJ, 698, 242
- van der Tak et al. (2007) van der Tak, F. F. S., Black, J. H., Schöier, F. L., Jansen, D. J., & van Dishoeck, E. F. 2007, A&A, 468, 627
- Woitke et al. (2009) Woitke, P., Kamp, I., & Thi, W.-F. 2009, A&A, 501, 383
- Yvart et al. (2016) Yvart, W., Cabrit, S., Pineau des Forêts, G., & Ferreira, J. 2016, A&A, 585, A74