The origin of the UV/optical lags in NGC 5548
Abstract
The new multi-wavelength monitoring campaign on NGC 5548 shows clearly that the variability of the UV/optical lightcurves lags by progressively longer times at longer wavelengths, as expected from reprocessing of an optically thick disk, but that the timescales are longer than expected for a standard Shakura-Sunyaev accretion disc. We build a full spectral-timing reprocessing model to simulate the UV/optical lightcurves of NGC 5548. We show that disc reprocessing of the observed hard X-ray lightcurve produces optical lightcurves with too much fast variability as well as too short a lag time. Supressing the fast variability requires an intervening structure preventing the hard X-rays from illuminating the disc. We propose this is the disc itself, perhaps due to atomic processes in the UV lifting the photosphere, increasing the scale-height, making it less dense and less able to thermalise, so that it radiates low temperature Comptonised emission as required to produce the soft X-ray excess. The outer edge of the puffed-up Comptonised disc region emits FUV flux, and can illuminate the outer thin blackbody disc but while this gives reprocessed variable emission which is much closer to the observed UV and optical lightcurves, the light travel lags are still too short to match the data. We reverse engineer a solution to match the observations and find that the luminosity and temperature of the lagged emission is not consistent with material at the light travel lag distance responding to the irradiating flux (either FUV or X-ray) from the AGN. We conclude that the UV/optical lags of NGC 5548 are not the light travel time from X-ray reprocessing, nor the light travel time from FUV reprocessing, but instead could be the timescale for the outer blackbody disc vertical structure to respond to the changing FUV illumination.
keywords:
Black hole physics, accretion, X-rays: galaxies, galaxies: Seyfert, galaxies: individual: NGC 5548.1 Introduction
The emission from Active Galactic Nuclei (AGN) is typically variable, with faster variability seen at shorter wavelengths. This variability can be used as a tool to probe the surrounding structures, with reverberation mapping of the broad line region being an established technique. However, the same techniques can be used to probe the structure of the accretion flow itself. Hard X-ray illumination of the disc should produce a lagged and smeared thermal reprocessing signal. Larger radii in the disc produce lower temperature emission, so this disc reprocessing picture predicts longer lags at longer wavelengths. Such differential lags are now starting to be seen (Sergeev et al. 2005; McHardy et al. 2014; Edelson et al. 2015; Fausnaugh et al. 2015; McHardy et al. 2016) confirming qualitatively that we are indeed seeing reprocessing from radially extended, optically thick material, as expected from a disc.
However, quantitatively, the picture runs into difficulties. It has long been known that the implied size-scales are larger by a factor of a few compared to the expected sizes from a Shakura-Sunyaev disc (e.g. Cackett, Horne & Winkler 2007). Independent size-scale estimates from microlensing also imply that the optical/UV emission region is larger than expected by a similar factor (e.g. Morgan et al. 2010). Yet the optical/UV spectrum shows a strong rise to the blue, and can be fairly well fit by the emission expected from the outer disc regions in a Shakura-Sunyaev model (e.g. Jin et al. 2012; Capellupo et al. 2015), though there are discrepancies in detail (e.g. Davis, Woo & Blaes 2007).
Thus qualitatively the disc reprocessing picture appears sound, yet quantitatively it fails to match the data. This is perhaps not surprising for several reasons. Irradiation can change the structure of the disc e.g. by flaring it, as well as by changing the local heating (Cunningham 1976). Secondly, the spectra of AGN are clearly not simply a disc. The hard X-ray corona itself must be powered by accretion, pointing to a change from a pure Shakura-Sunyaev disc structure in the inner regions (e.g. Done et al. 2012). There is also the generic additional component seen in AGN, the soft X-ray excess, which again points to some change in disc structure which is not captured by the simple Shakura-Sunyaev equations (e.g. Gierlinski & Done 2004; Porquet et al. 2004).
Here we use the unprecedented SWIFT and HST lightcurves collected by the 2014 campaign on NGC 5548, which spans 120 days with sampling of 0.5 days, across 9 continuum bands from V to hard X-rays (Edelson et al. 2015). On long (month-year) timescales, the optical and X-ray lightcurves are well correlated, but the optical lightcurves show more variability than the hard X-rays, ruling out the simplest reprocessing models as accounting for all the optical variability in this source (Uttley et al. 2003, see also Arevalo et al 2008; 2009). However on day timescales the optical lightcurves lag behind the X-rays, with lag times increasing with wavelength as expected of disc reprocessing, and this is sampled in unprecedented detail by the 2014 campaign lightcurves. We use these to quantitatively test disc reprocessing models using a full model of illumination and reprocessing, with the aim to reproduce both the spectrum and variability of the source.
We first examine traditional disc reprocessing models and confirm that these cannot explain the lag timescales of the optical/UV lightcurves of NGC 5548. However, these quantitative models reveal another more fundamental conflict, which is that the UV and optical lightcurves cannot be produced by reprocessing of the observed hard X-ray flux. Disc reprocessing smears the variability by a similar timescale to the lag. The UV and optical are lagged by 1-2 days, but are much smoother than the hard X-ray lightcurve, with no sign of the rapid 1-2 day variability seen in the X-rays (see also Arevalo et al. 2008 and the discussion of variability in Lawrence 2012). This clearly shows that the fast hard X-ray variability is not seen by the outer disc, so not only are the observed X-rays not the driver for reprocessing, but the outer disc must be shielded from the observed X-rays. Instead, the FUV (represented by the HST lightcurve) is a much better match to the observed smoothness of the optical/UV lightcurves of NGC 5548. We incorporate these two aspects together in a model where the soft X-ray excess is produced from the inner regions of a moderately thickened disc which emits optically thick Compton (hence we name it the Comptonised disc) and which shields the outer blackbody (BB) disc from direct hard X-ray illumination from the central corona. The observed difference between the FUV and soft X-ray lightcurves clearly shows that this is not a single component, so we assume that the outer regions of the thickened Comptonised disc structure produce the FUV which can illuminate the outer thin BB disc. However, this still predicts light travel time lags which are shorter than observed. Increased flaring of the outer BB disc does not help because these large radii regions with the required long lag times are too cool to contribute significant optical flux due to their large area.
We explore the suggestion that the longer than expected lags come from the contribution of the classic BLR (H line) to the optical and UV emission (Korista & Goad 2001), but this does not work either as these do not contribute enough lagged flux. Since all known models fail, we reverse engineer a geometry which can fit both spectral and variability constraints. We use the observed optical lags in the different wavelength bands to constrain the luminosity and temperature of blackbody components at different lag times. We find the observations can be well matched by a single blackbody component lagged by 6 days behind the FUV irradiation, consistent with reprocessing on a population of clouds interior to the classic BLR as suggested by Lawrence (2012). However, the derived area of the reprocessor at this light travel time distance is far too small to intercept enough of the AGN luminosity (either FUV, X-ray or total) to give the observed luminosity of the lagged component. We conclude that the reprocessing timescale is not set by the light travel time. Interestingly, the temperature of the required lagged component is close to K, which is the trigger for the onset of the dramatic disc instability connected to hydrogen ionisation (see e.g. Lasota 2001) so it could instead be linked to the changing structure of the disc at this point.
Fundamentally, the time lags give us the wrong answers because the reverberation signal is not from a thin BB disc responding on the light travel time to illumination of either X-rays or FUV. We suggest it is instead from the inner edge of the thin BB disc changing its structure in response to an increase in FUV illumination and expanding on the vertical timescale to join the larger scale height Comptonised disc region.
2 Energetics of Disk Illumination and Reprocessing
For all models we fix (as used by Edelson et al. 2015, from Pancoast et al. 2014: see also their Erratum 2015). This is similar to the Denny et al. (2010) estimate of , though a factor of smaller than the Bentz et al. (2010) estimate of . We also fix distance Mpc, and spin , and assume an inclination angle of .
The unabsorbed, dereddened broadband spectrum of NGC 5548 from Summer 2013 is shown in Mehdipour et al. (2015). The X-ray flux is very hard, with photon index , and the X-rays dominate the energy output of the source, peaking in at ergs cm-2 s-1 at 100 keV. The simultaneous optical/UV spectrum looks similar to that expected from an outer thin BB disc (though its shape is subtly different: Mehdipour et al. 2015). The flux in UVW1 (at around 5 eV) has ergs cm-2 s-1.
We use the optxagnf model in xspec to find reasonable physical parameters for the accretion flow. This assumes that the mass accretion rate is constant with radius, with fully relativistic Novikov-Thorne emissivity per unit area, , with dimensionless radius for , but that this energy is dissipated in a (colour temperature corrected) BB disc only down to some radius , with the remainder split between powering an optically thick Compton component (which provides the soft X-ray excess emission) and an optically thin Compton component, which models the hard X-ray coronal emission. This code calculates the angle averaged spectrum, so we boost the normalisation by a factor to roughly account for our assumed inclination angle. If we assume that all the power within goes to make the hard X-ray corona (), we find that we can match the UVW1 and X-ray flux for with .
This does not necessarily mean that the geometrically thin BB disk itself is not present below , only that the accretion power is not dissipated within this structure (Svensson & Zdziarski 1994; Petrucci et al 2010). However, there is additional information in the hard X-ray spectrum which does point to this conclusion. An optically thick BB disc cannot be present underneath an isotropically emitting corona in this object, as such a disc will intercept around half of the hard X-ray flux, giving a strong Compton hump which is not present in the NuSTAR data (see spectrum in Mehdipour et al. 2015 and Ursini et al. 2015). Thermalisation of the non-reflected emission also produces too many seed photons for the X-ray source to remain hard (Haardt & Maraschi 1991; 1993; Stern et al. 1995; Malzac et al. 2005; Petrucci et al. 2013). Together, these imply that either the X-ray source is very anisotropic, or the disc truly truncates for sources with hard X-ray spectra.
Black hole binaries similarly show hard X-ray spectra and small Compton hump in their low/hard state, but here there are clear limits on the possible anisotropy from comparing sources with different binary inclination angles (Heil, Uttley & Klein-Wolt 2015). This argues strongly for true truncation of the BB accretion disc, as does the currently popular Lense-Thirring precession model for the origin of the low frequency QPO’s seen in high inclination binary systems (Ingram, Done & Fragile 2009). Hence we assume the BB disc is truly truncated in these low luminosity AGN (see also Petrucci et al. 2013; Noda 2016).
The irradiation pattern strongly depends on the relative geometry of the hard X-ray source and BB disc. In the black hole binaries, there is evidence from the complex pattern of energy dependent lags that the hard X-ray source is somewhat radially extended (Kotov, Churazov & Gilfanov 2001; Ingram & Done 2012), as is also expected if it is some form of hot, radiatively inefficient accretion flow such as an advection dominated accretion flow (Narayan & Yi 1995). We assume that the extended hard X-ray source has volume emissivity and neglect light-bending and red/blueshifts to work out the irradiating flux as in the appendix of Zycki et al (1999), i.e.
| (1) |
where is the distance from the hard X-ray source to the disc surface element, is the angle between the source and normal to the disc, and is the fraction of coronal hard X-ray luminosity () which thermalises. We set in this section in order to see the maximum irradiation flux. We then assume that
| (2) |
and model the resulting optically thick disc emission at this radius as a (colour temperature corrected) blackbody. However, the colour temperature correction makes very little difference for the black hole mass, mass accretion rate and used here, as the disc peaks at 5.5 eV (Å) so is too cool for the colour temperature correction to be significant.
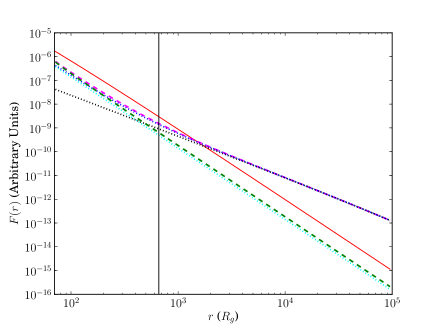 |
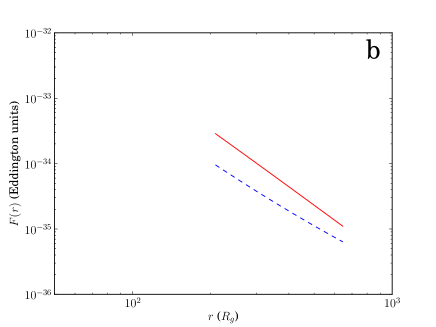
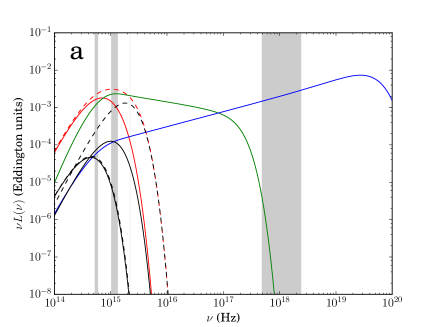
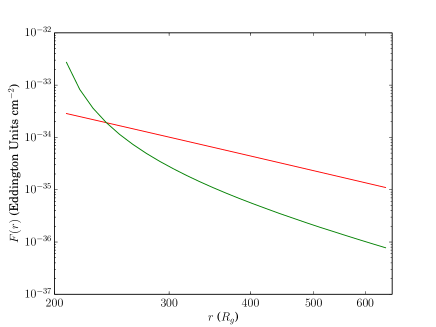
We first assume the extended X-ray source illuminates a flat BB disc (formally, we give this disc constant height of ). The green dashed line in Fig.1 shows the resulting irradiation flux per unit area on the equatorial plane. This is at large , similar to the intrinsic gravitational flux dissipation (red), and is around 10-20% of the intrinsic flux at each radius. We compare this to the mathematically simpler form of a lamppost at height (cyan dotted line, where ) illuminating the BB disc, and show that the two are comparable at all disc radii. This is important as it shows that using lamppost illumination is not necessarily the same as assuming that the source is a lamppost (compact source on the spin axis). The more physical extended source geometry is identical in its illumination properties to the mathematically simpler lamppost.
It is unlikely that the BB disc remains flat under illumination. Cunningham (1976) shows that the disc structure responds to illumination, and can form a flared disc with height , where is the disc height at its outer radius . We show the resulting illumination for an extended X-ray source (Fig.1, magenta dashed line), and a lamppost source of height (blue dotted line) and a central source (: black dotted line) for a flared disc with at . Clearly, irradiation can dominate over gravitational energy release for such a flared disc, but only at large radii.
Crucially, irradiation changes the predicted lag-wavelength profile of the BB disc. The standard argument for a lag time comes from assuming that the wavelength at which the disc peaks at each radius is . Hence . However, in the irradiation dominated region, the emissivity , so the lags are no longer expected to go as but as .
Fig.1 shows irradiation only gives which is substantially different to at , so all our irradiation models predict for . The self-gravity radius for a disc with these parameters is only 660 (black vertical line: Laor & Netzer 1989, using Shakura-Sunyaev ), so that truncating the BB disc at this point means that irradiation never dominates, and there is only a factor of between the flared and flat disc illumination fluxes at .
In the following reprocessing models we wish to maximise irradiation. We therefore use the lamppost at illuminating a flared BB disc (Fig.1, blue dotted line; illumination pattern identical to an extended source spherical source with ) in all subsequent models.
2.1 Calculation of Cross Correlation Functions
Throughout the paper we compare lags between lightcurves by calculating the cross correlation function (CCF). For two lightcurves and , which are evenly sampled on time so , the CCF as a function of lag time is defined as:
| (3) |
where the sum is over all data which contribute to the lag measurement, so there are a smaller number of points for longer lags. The averages, (), and measured variances (), and error bar variances (), are also recalculated for each over the range of data used. With this definition, then implies complete correlation.
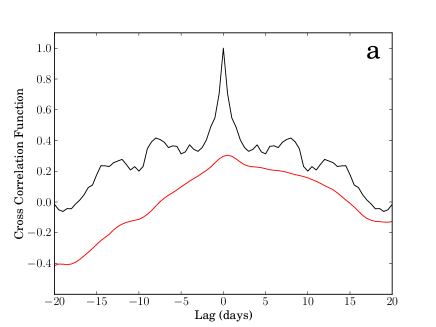
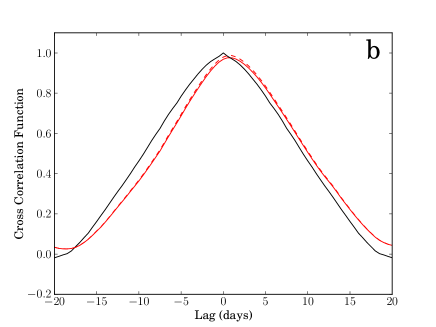
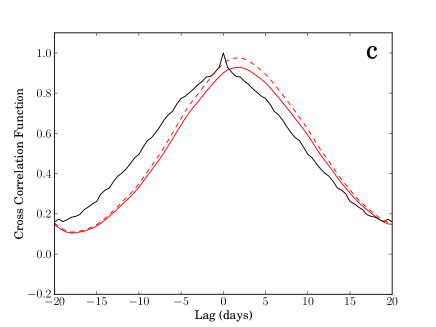
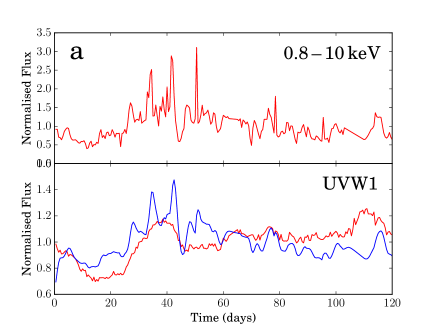
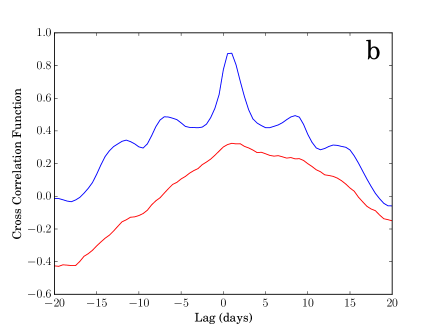
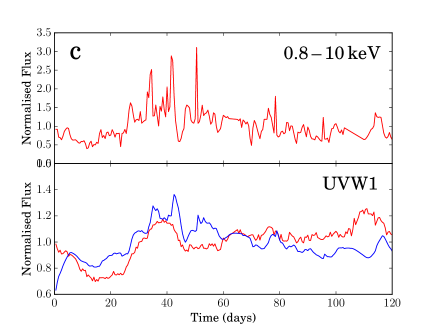
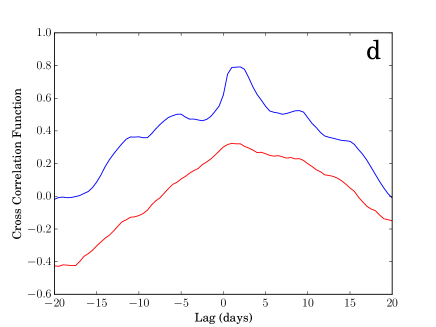
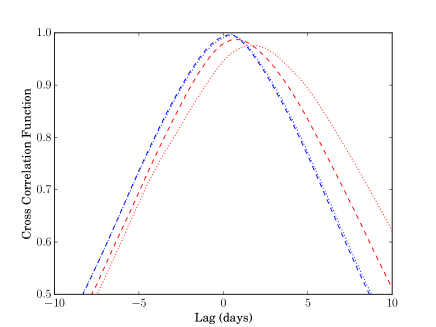
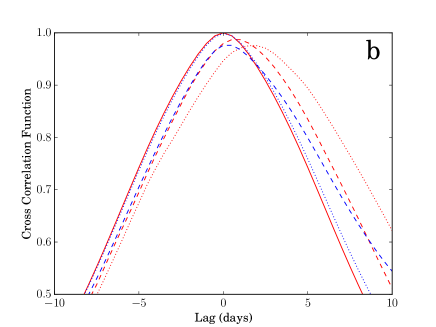
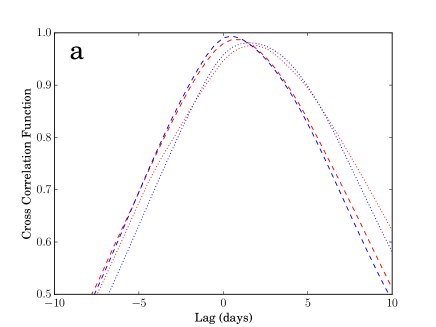
However, real data are not exactly evenly sampled. Interpolation is often used to correct for this, but this can be done in multiple ways (Gaskell & Peterson 1987). The red solid lines in Fig.2 shows the interpolated CCF, computed by linearly interpolating both lightcurves onto a grid of d spacing and then resampling to produce evenly sampled lightcurves with d. This interpolation scheme introduces correlated errors, and it is not simple to correct for these so we first set . The correlation is very poor between the hard X-ray and FUV lightcurve (Fig.2a), while the FUV and UVW1 are consistent with almost perfect correlation with a lag of days (Fig.2b). The correlation without considering the error bar variance is slightly worse between FUV and V band, while the lag is somewhat longer (Fig.2c).
The neglect of the error bar variance can suppress the correlation, so we first investigate how much of the lack of correlation in Fig.2a-c is due to this. We assess the size of this effect by calculating the autocorrelation function (ACF). For an evenly sampled lightcurve with independent errors, the error bars are correlated only at zero lag, giving an additional spike at zero on top of the intrinsic ACF shape. The interpolated lightcurves have correlated errors on timescales of the interpolation, so instead of a spike at zero lag, these form a component with width on top of the intrinsic ACF. We show the ACF of the interpolated UVW1 and V band lightcurves as the solid black lines in Fig.2b&c, respectively. We do not show the ACF of the FUV lightcurve as this has such small errors and such good sampling that there is negligible error bar variance in this lightcurve. We fit the ACFs with two Gaussians, one broad to model the intrinsic ACF, and one narrow to represent the correlated errors, both of which should peak at zero lag. This gives the value of that must be subtracted in order for the broad Gaussian to peak at unity. For UVW1 we find that , and for the V band we find . We subtract this correlated error variance to get the error corrected interpolated correlation function (Fig.2b&c, dashed red lines). The effect is quite small for the (already very good) FUV–UVW1 correlation, but makes a noticeable difference to the FUV–V band cross-correlation. The intrinsic variability in the V band lightcurve is then consistent with an almost perfect correlation with the variable FUV lightcurve, but with a day lag (see also McHardy et al. 2014; Edelson et al. 2015; Fausnaugh et al. 2015).
 |
 |
 |
In Fig.2a we show the hard X-ray ACF (black line). It is not possible to apply the Gaussian fitting method to the hard X-ray ACF as the fast varying hard X-rays show an intrinsic peak of correlated variability on d timescales (Noda 2016) that cannot easily be separated from the effects of any correlated errors. However, we calculate the error bar variance of the hard X-ray lightcurve from the data and find it is roughly . This is negligible and cannot explain the poor correlation shown by the hard X-ray–FUV CCF, indicating that the poor correlation between the hard X-ray and FUV lightcurves is intrinsic to the process.
3 Lightcurves and Spectra from Blackbody Disc Reprocessing Hard X-ray Emission
Not all the irradiating flux will thermalize, as some part will be reflected. The reflection albedo depends on the ionization state of the disc, but for such a hard spectrum it varies only from (neutral) to (completely ionised), giving . We choose in all subsequent models.
 |
 |
 |
 |
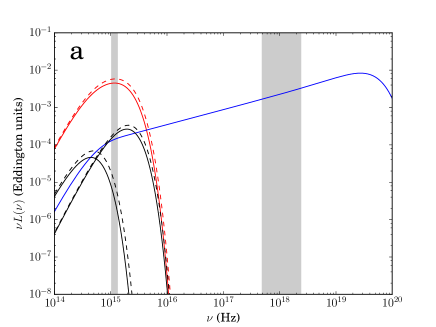
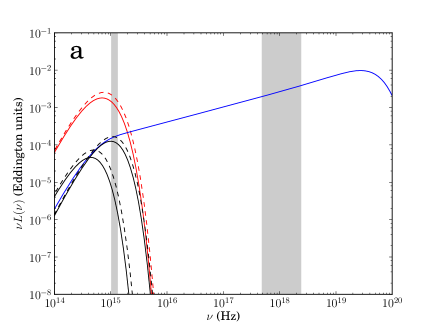
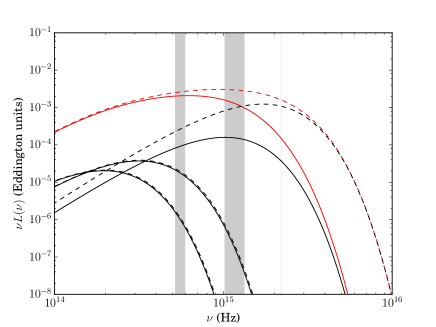
We first explore the scenario in Section 2, where a flared BB disc with scale-height 0.1 on its outer edge extends inwards from the self gravity radius at down to , with the flow then forming a hot corona whose illumination can be approximated by a point source at height above the black hole. The solid red line in Fig.3a shows the intrinsic BB disc emission that results from gravitational heating alone. The dashed red line shows the total disc emission including additional heating by the illuminating corona. For illustrative purposes we also show the emission from two individual annuli in black, with the lower energy example corresponding to the emission from and the higher energy example corresponding to the emission from the innermost disc radius at . Again solid lines show the intrinsic emission from gravitational heating alone and dashed lines show the total emission including reprocessing.
 |
 |
 |
 |
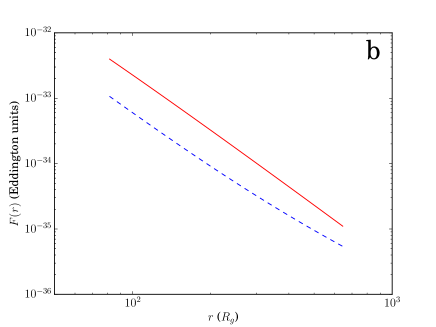
The dashed red line in Fig.3a shows that reprocessing makes very little difference to the total BB disc luminosity. This is because the disc is dominated everywhere by the intrinsic emission (red solid line in Fig.3b) rather than by reprocessing (blue dashed line in Fig.3b), and even increasing to its maximum plausible value of cannot overcome this. Reprocessing does have slightly more effect at larger radii (because the BB disc is flared), but the disc emission is dominated by the smallest radii.
So far we have considered the steady state or time-averaged spectrum. In order to know how fluctuations in the hard X-ray flux will produce changes in the UV/optical emission from the BB disc, we must quantify how well each disc radius can respond to and reproduce changes in the illuminating continuum. For each annulus in the disc we calculate its transfer function following Welsh & Horne (1991). This accounts for light travel time distances to different radii within the annulus and different azimuths within each radius. The transfer function, , for a given radius, , describes what fraction of the reprocessed flux from that radius has a given time delay, , with respect to the illuminating continuum. The fluctuations in the reprocessed flux from a given annulus is then:
| (4) |
This causes the effective temperature of the annulus to vary as:
| (5) |
The fluctuations in a given spectral band (e.g. UVW1) are then the sum of the fluctuations in the emission from each annulus contributing flux to that band. Fluctuations in reprocessed flux change the relative contributions of individual annuli to the total band flux. An increase in reprocessed flux increases the temperature of the annulus. This both increases the luminosity of the annulus and shifts the peak of its blackbody spectrum to higher energies. This may shift the peak emission from smaller radii out of the bandpass and shift more of the emission from larger radii, which usually peak below the bandpass, to higher energies and so increase their contribution to the total band flux. As such it is not appropriate to assume a band is always dominated by emission from any one radius. By calculating the effective temperature and corresponding blackbody spectrum from each annulus at each timestep our code accounts for this. We neglect any fluctuations in the intrinsic BB disc emission so that the only source of disc variability is the reprocessed fluctuations.
 |
 |
 |
 |
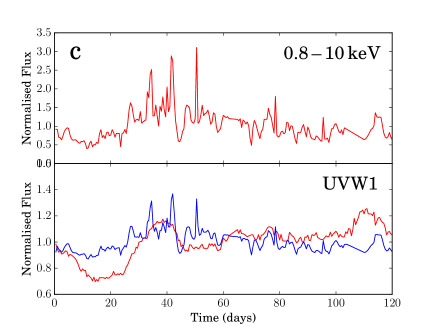
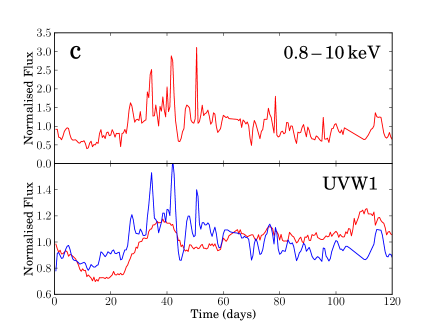
For our coronal power law fluctuations we use the hard X-ray light curve of NGC 5548 presented by Edelson et al. (2015), interpolated as described in the previous subsection to produce an evenly sampled input lightcurve with d. We input this into our disc reprocessing model and this allows us to calculate a model UVW1 light curve, which we can then compare to the observed data. We show our results in Fig.3c (bottom panel), where the red line shows the observed UVW1 lightcurve and the blue line shows our predicted UVW1 lightcurve using this model. For reference we also show the input hard X-ray lightcurve (top panel). Our simulated UVW1 light curve clearly fails to reproduce both the amplitude of fast variability (much more in the model than in the data) and the overall long term shape of the observed UVW1 lightcurve (especially the dip in the observed lightcurve at 18 days and the rise at 110 days).
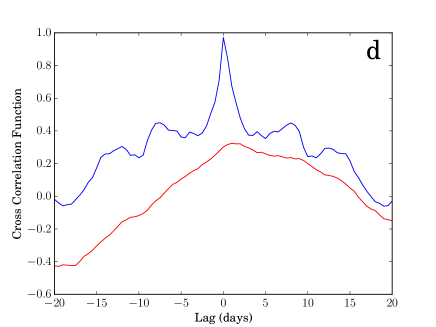
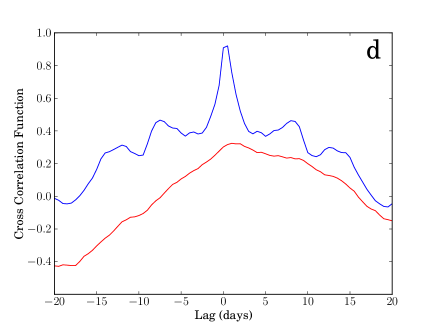
In Fig.3d we show the cross correlation function (CCF) of the simulated UVW1 lightcurve with respect to the hard X-ray lightcurve (blue), compared to the CCF of the observed UVW1 lightcurve with respect to the hard X-ray lightcurve (red). A positive lag indicates the UVW1 band lagging the hard X-rays. The predicted CCF is strongly peaked with almost perfect correlation at close to zero lag, and is quite symmetric. The observed CCF has none of the well correlated, narrow component at lags day, but is instead quite poorly correlated, and asymmetric with a peak indicating that the UVW1 band lags behind the hard X-rays by d (Edelson et al. 2015).
Clearly, this is not a viable model of the UVW1 lightcurve. The data require more reprocessing at longer lags, and less reprocessing at shorter lags. Certainly the inner disc produces the shortest time lags, so truncating the BB disc at a larger radius could supress some of the fast variability. We explore this in the next section.
3.1 Increasing Disc Truncation
We rerun our model with the BB disc truncated at a much larger radius, such that . Such a large truncation radius for such a low mass accretion rate AGN is consistent with the observed trend in local AGN for to anticorrelate with (Jin et al 2012; Done et al 2012). We show the results of using this larger truncation radius in Fig.4. The key difference in the spectrum is that the hottest parts of the BB disc are no longer present, with the energy instead giving a slight increase in the normalisation of the hard X-ray Comptonisation component. The small disc component gives a significantly lower UVW1 flux, so the variable components from both the direct Comptonisation component and its reprocessed UV flux now contribute a higher fraction of the UVW1 band.
The model can now better reproduce the observed amplitude of UVW1 band long term flux variations (blue lightcurve in Fig.4c, especially the dip at 18 days). However our simulated UVW1 lightcurve still has much more fast variability than is seen in the real UVW1 lightcurve. The simulated UVW1 lightcurve clearly looks like the hard X-ray light curve from which it was produced. Yet the observed UVW1 lightcurve looks quite different to the observed hard X-ray lightcurve.
This is shown clearly in Fig.4d where we compare the CCFs. The CCF peak from our simulated lightcurve has shifted to d rather than the close to zero-peaked CCF of the previous model, but the lag is still not as long as in the observed CCF, and the model UVW1 lightcurve is much more correlated with the hard X-ray lightcurve. This is seen at all lags, but the problem is especially evident on short lag times, showing quantitatively that the model UVW1 lightcurve has much more of the fast variability seen in the hard X-ray lightcurve than the real data.
Edelson et al. (2015) commented that the lags they measure are much longer than expected from reprocessing on a standard BB disc, i.e. the radii that should show peak emission in the UVW1 band are much smaller than the radii implied by the light travel time delayed response of emission in that band. This would suggest that the accretion disc around NGC 5548 is not a standard BB disc. Somehow the same emission is produced at a larger radius than standard BB disc models predict.
We test this by altering our disc transfer functions such that the reprocessing effectively occurs at twice (Fig.5a&b) and then four times (Fig.5c&d) the radius at which a standard BB disc would produce that emission. In theory this should improve our simulated lightcurves, as reprocessing at larger radii smooths out fast fluctuations so should reduce the amount of high frequency power in the lightcurve.
 |
|
However, Fig.5a shows that an effective radius twice that of a standard BB disc does not smooth the simulated lightcurve enough. An effective radius four times that of a standard BB disc does a better job (Fig.5c), but comparison of the CCFs (Fig.5d) illustrates that this is still not a good match to the data. An effective radius four times that of a standard BB disc may be required to sufficiently reduce the high frequency power in the lightcurve, but this then gives light travel time lags that are too long. The peak lag of the observed CCF is roughly d, while the peak lag from the model lightcurve extends from d. The observed smoothing timescale is much longer than the lag timescale, and this cannot be replicated by light travel time smoothing, as light travel time effectively ties the smoothing to the lag timescale. For this reason, doubling the black hole mass to match the Bentz et al. (2010) estimate does not solve the problem of transmitting too much high frequency power into the optical. Increasing the disc inclination angle increases the amount of smoothing, however this effect is negligible even when setting (an unreasonably large angle for a Seyfert 1 such as NGC 5548) and likewise cannot reduce the high frequency power in the model optical lightcurves.
Moreover, the model lightcurves are all far more correlated with the hard X-ray lightcurve, on all timescales, than the observed lightcurve is. Even in Fig.5d the peak correlation coefficient between the hard X-rays and the model UVW1 lightcurve is , while between the hard X-rays and the observed lightcurve it is only .
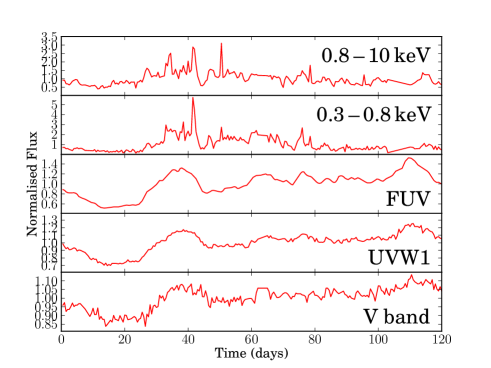
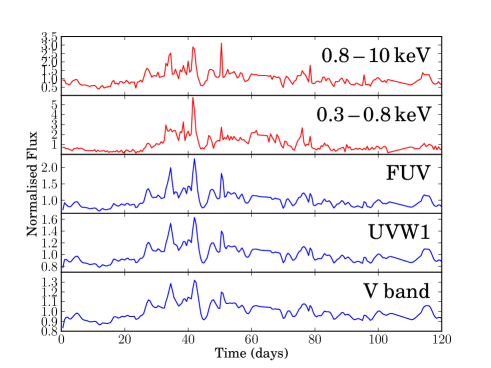
Fig.6 further illustrates this. In the left panel we show the observed lightcurves — from top to bottom, hard X-rays, soft X-rays, FUV, UVW1 and V band. In the right panel we again show the observed hard and soft X-ray lightcurves, followed by our model FUV, UVW1 and V band lightcurves using the standard BB disc model. It is clear that reprocessing the hard X-ray lightcurve off a standard BB disc size-limited by the self-gravity radius produces UV and optical lightcurves that look like the original hard X-ray lightcurve. The hard X-ray flares (e.g. at 42 days) are slightly more smoothed in the longer wavelength bands, but they are still clearly recognisable.
By contrast the observed UV and optical lightcurves lack any short term flares and show additional longer timescale variability that is not present in the hard X-ray lightcurve (e.g. the dip between d). The FUV to V band lightcurves are clearly well correlated with one another, with peak CCFs with respect to the FUV of (Edelson et al. 2015) and the increasing lags with increasing wavelength suggest reprocessing is a key linking factor. But they are much less well correlated with the hard X-rays (with a peak CCF of only ). The left panel of Fig.6 shows there is a clear break in properties between the observed X-ray and UV–optical lightcurves. The right panel shows that, if the hard X-rays are the source of illuminating flux, this cannot occur.
There are really only two ways out of this impasse. Either the hard X-ray lightcurve is not a good tracer of the illuminating flux, or the BB accretion disc is shielded from being illuminated by the hard X-rays. The former is plainly a possibility, as the hard X-ray lightcurve from 0.8-10 keV is not at the peak of the hard X-ray emission and Noda et al. (2011) show that there can be a fast variable steep power law component. Mehdipour et al. (2015) and Ursini et al. (2015) show that the hard X-ray variability encompasses both a change in normalisation and in spectral index, with the spectrum softening as the source brightens. A hard X-ray lightcurve at 100 keV would be a better direct tracer of the total hard X-ray flux, but until this is available, we estimate this using the intrinsic power law spectral index and normalisation derived by Mehdipour et al. (2015). These are binned on 10 day intervals to get enough signal to noise, so it is not a sensitive test of the model, but assuming that the spectral cut-off remains fixed at 100 keV this still does not give a good match to the FUV lightcurve. We conclude that it is more likely that the reprocessing region is shielded from the hard X-ray illumination, and consider below how this might also shed light on the origin of the soft X-ray excess.
4 Lightcurves and Spectra from Blackbody Disc Reprocessing FUV Emission
 |
 |
 |
 |
 |
 |
The broadband spectrum of NGC 5548 presented by Mehdipour et al. (2015) shows that a two component BB disc + hard power law model is clearly not sufficient to fit its spectrum. This source shows a strong soft X-ray excess above the keV power law which can be well fit with an additional low temperature, optically thick Compton component, though this is not a unique interpretation. It can also be well fit in the 0.3-10 keV bandpass with highly smeared, partially ionized reflection (Crummy et al. 2006). However, with the advent of NuSTAR and other high energy instruments, it is now clear that the reflection interpretation does not give such a good fit to the data up to 50-100 keV for AGN with hard X-ray spectra (e.g. Matt et al. 2014; Boissay et al. 2014). Hence we assume that the optically thick Compton component, which produces the soft X-ray excess, is an additional intrinsic continuum component.
To include this, we now assume that the BB disc truncates at as before, but that the remaining gravitational power inwards of this radius is split between two coronal components: the hard power law and the optically thick Compton component. We fix the temperature and optical depth of the optically thick Compton component to keV and (Mehdipour et al. 2015). This component then peaks in the UV as required by the spectrum. By reducing the fraction of coronal energy in the hard power law to , i.e. of the coronal energy goes instead into powering the optically thick Compton component, we are again able to match the ratio of found by Mehdipour et al. (2015), with , which we could not do previously with a substantially truncated disc and no optically thick Compton component. In Fig.7a we show this new model spectrum, with the optically thick Compton component shown in green.
While the origin of this emission is not well understood, it is clearly not from a standard disc. This component takes over from the standard BB disc in the UV, which may not be a coincidence as the substantial atomic opacity in the UV can cause changes in the disc structure compared to a Shakura-Sunyaev disc which incorporates only plasma opacities of electron scattering and free-free absorption. In particular, UV line driving has the potential to lift the disc photosphere (e.g. Laor & Davis 2014). The copious hard X-ray emission in this object should quickly over-ionise any potential UV line driven wind, which would result in the material falling back down again without being expelled from the system. This scenario has the potential to effectively increase the scale-height of the disc, decreasing its density (Jiang, Davis & Stone 2016). This decreases its true opacity, hence increasing the effective colour temperature correction (e.g. Done et al. 2012). Alternatively, UV temperatures are also linked to the onset of the dramatic disc instability connected to hydrogen ionisation (Lasota 2001; Hameury et al. 2009; Coleman et al 2016). Whatever the origin, the total optical depth of the disc to electron scattering at the UV radii is probably of order 10-100 (Laor & Netzer 1989), so the optically thick Compton emission in this picture is coming from the disc itself, with the emission not quite able to thermalise to standard BB emission because of the increased scale-height of the disc due to the UV radiation pressure and/or the onset of the hydrogen ionisation instability. We therefore refer to the optically thick Compton component as the ‘Comptonised disc’, to distinguish it from the outer BB disc.
 |
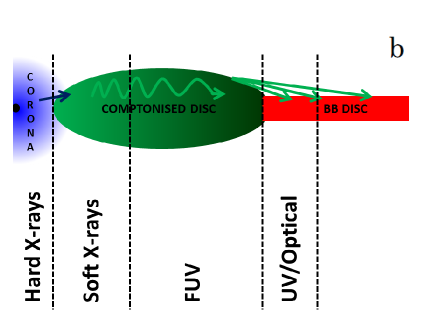
The break in properties between the soft X-ray and FUV lightcurve show clearly that the Comptonised disc is itself stratified rather than being a single spectral component as in Mehdipour et al. (2015). We show our potential geometry in Fig.7b, where the soft X-ray emission comes from the inner regions of this large scale-height flow, which still cannot illuminate the outer BB disc, while the FUV is produced at larger radii and can illuminate the outer BB disc.
We model this FUV illumination by assuming a cylinder of material located at a particular radius (), with a particular height (). This changes the illumination pattern, so we can no longer use the approximation of an on-axis point source. We calculate the reprocessed flux at a given BB disc radius by dividing the ‘surface’ of the wall into elements (azimuthally — — and vertically — ) and summing the flux contribution from each element:
| (6) |
This new illumination pattern intensifies the illumination on radii close to but for it becomes indistinguishable from the case of a lamppost point source. We set and , implying a scale-height for the outer edge of the Comptonised disc of , which should be sufficient to obscure the hard X-ray emission. The resulting illumination profile is shown in Fig.8 (green line).
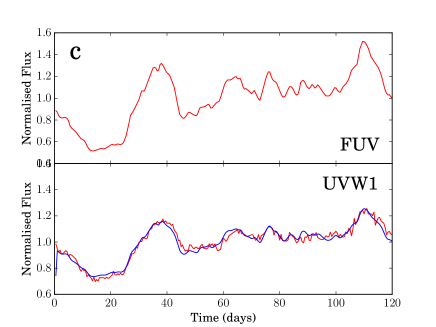
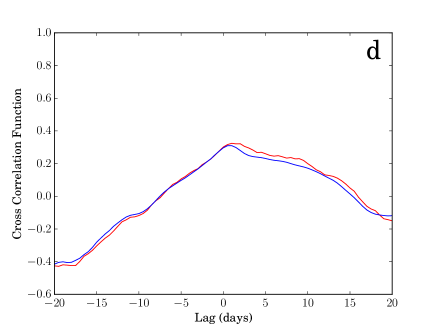
In Fig.7c&d we compare the resulting model UVW1 lightcurve with the observations. We now find a much better match to the behaviour of the observed UVW1 lightcurve, matching the amplitude of fluctuations and reproducing the shape of the UVW1/hard X-ray CCF.
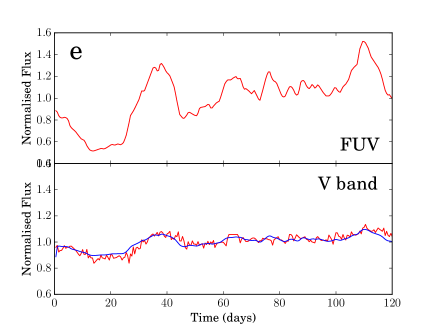
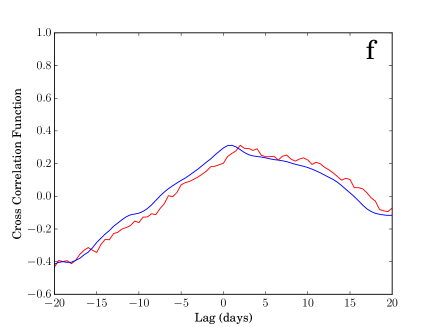
In Fig.7e&f we also compare our model V band lightcurve with the data. We find a good match to the amplitude of the observed fluctuations, but the model V band CCF with respect to the hard X-rays (blue) is not lagging by as much as the real V band lightcurve (red). This mismatch is more evident when comparing the model UVW1 and V band CCFs with respect to the FUV. Fig.9 shows that both the model UVW1 (blue dashed) and V band (blue dotted) CCFs with respect to the FUV peak at close to zero lag, while the real UVW1 (red dashed) and V band (red dotted) CCFs are significantly shifted away from zero lag.
Thus while reprocessing the FUV gives lightcurves which are a much better match to the data, the response of our model lightcurves is too fast. The observed V band lag behind the FUV lightcurve is d (Edelson et al 2015). For a black hole mass of , this means the reprocessed V band flux must be emitted roughly away from wherever the FUV emission occurs. The observed UVW1 lag is d, implying it is emitted at a distance of from the FUV emission. In our model we assume the FUV emission is supplied by the outer edge of the Comptonised disc at . However, regardless of the exact location of the FUV emission, the observed lightcurves imply that the reprocessed V band flux must be emitted further away from the FUV continuum than the reprocessed UVW1 flux. So far we have used a BB disc truncated at the self-gravity radius of as our reprocessor. Clearly this does not provide a large enough span of reprocessing radii. We now rerun our model with a larger outer radius for the BB disc, to see if we can reproduce the observed length of the V band lag.
 |
 |
 |
 |
4.1 Increasing Outer Disc Radius
We increase the outer radius of the BB disc to and rerun our FUV reprocessing simulation. We find that increasing the outer radius of the BB disc makes no difference to the length of our simulated V band lag. Fig.10 illustrates why.
A d V band lag requires the V band to be dominated by reprocessed flux emitted from (for a like NGC 5548). Fig.10 shows that BB disc annuli at these large radii are simply too cool to contribute significant flux to the V band. This is due to their large area. Illumination by the FUV continuum simply cannot raise their temperature enough to make them contribute significantly to the V band, let alone dominate its flux. The dashed lines in Fig.10 show how little the illumination increases the total BB disc flux at these very large radii.
The amount of FUV flux intercepted by large disc radii can be increased by increasing the BB disc flaring, i.e. by increasing . The larger the outer disc scale-height, the more illuminating flux the annulus intercepts, the greater the heating and the more V band flux it contributes. We set but this produces a negligible increase. The heating flux is simply spread over too large an area.
In order for a reprocessor located at () to contribute significant V band flux it must have a small area. Clearly disc annuli are not suitable for this since the area of the annulus is constrained to scale with its radius as . An obvious source of small area reprocessors at large radii are the broad line region (BLR) clouds. In the next section we investigate the possibility that the observed optical lags are due to reprocessing of the FUV emission, not by a BB disc, but by BLR clouds.
4.2 Broad Line Region Clouds Reprocessing FUV Emission
 |
BLR clouds absorb UV continuum emission and re-emit the energy as optical lines/recombination continua. Clearly these do contribute to the observed flux, and are lagged by the size-scale of the BLR. We first explore if this contamination by the BLR can influence the lags, as suggested by Korista & Goad (2001).
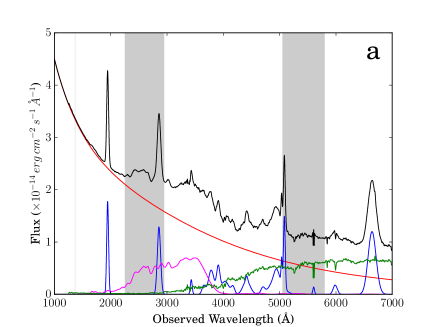
Mehdipour et al. (2015) show the UV/optical spectrum taken during the campaign. We reproduce this in Fig.11a (M. Mehdipour, private communication), with the continuum bands superimposed. The UVW1 band contains a substantial amount of blended FeII and Balmer continuum (Fig.11a, magenta line) as well as a broad MgII emission line (Fig.11a, blue line). The strongest line contribution to V band comes from the narrow [OIII] emission line (Fig.11a, blue line), with a small contribution from the wing of H.
We conduct a simple test to determine whether this BLR line contamination could explain the observed optical lags. The FUV is dominated by continuum emission, so we assume the continuum component varies as the FUV lightcurve, so that there are no real continuum lags. H lags the continuum in this source by roughly 15 days (Peterson et al. 2002), though this does change with flux, spanning 4-20 days (Cackett & Horne 2005; Bentz et al. 2010). We assume that all the BLR emission components (eg. FeII/Balmer blend, MgII and H) are a lagged and smoothed version of the FUV lightcurve, where the lag and smoothing timescale is d, while the narrow [OIII] emission line is constant on the timescale of our observations. Finally, we dilute this by the required amount of constant host galaxy component (Mehdipour et al. 2015) to get the full spectrum as a function of time. Integrating this over the UVW1 and V bands gives the simulated lightcurves for this model. Fig.11b shows the CCFs of these with respect to the FUV band lightcurve (blue), in comparison with the CCFs of the real lightcurves (red), with the UVW1 band as the dashed lines, and the V band as dotted. The red solid line shows the CCF of the FUV lightcurve with itself, i.e. the FUV autocorrelation function.
Both model CCFs peak at zero, whereas the observed CCFs have peaks offset from zero. This is because the flux contribution from broad lines is simply not large enough to shift the CCF peaks away from zero in either UVW1 or V band. Furthermore, UVW1 contains more broad line contamination than V band, and as a result the UVW1 model CCF (blue dashed line) is more positively skewed than the V band CCF, which is almost identical to the FUV ACF (compare blue dotted and red solid lines). This is in clear contrast to the data, where the V band lightcurve contains less line contamination than UVW1 and yet shows a longer lag than UVW1. The UVW1 and V band lags therefore cannot be explained through contamination by lagged broad line emission.
5 Thermal Reprocessing
So far, we have worked forwards from a geometric model of the spectrum and its reprocessed emission, then calculated the resulting timing properties and compared these to the observations. Now we take the opposite approach. We begin by matching the timing properties of the source (specifically the lightcurve amplitudes and CCFs) and use these to infer the spectral components and then the geometry.
We begin by matching the shape of the UVW1 and V band CCFs. The peak lag (i.e. the lag at which the CCF is a maximum) of the observed UVW1 lightcurve with respect to the observed FUV lightcurve is d. The CCF of the FUV lightcurve with respect to itself (i.e. the FUV autocorrelation) peaks at zero, as there is no lag between the two lightcurves. The CCF of the FUV lightcurve lagged and smoothed by one day with respect to the original FUV lightcurve will peak at d. This is not the only way a CCF peak at d can be produced. If a lightcurve consists of equal amplitude contributions from two lightcurves, one of which is the original un-lagged FUV lightcurve and the other of which is the FUV lightcurve lagged and smoothed by d, then the CCF of this composite lightcurve with respect to the original FUV lightcurve will be the sum of the two CCFs — the un-lagged FUV with respect to itself and the d-lagged FUV with respect to the unlagged-FUV — so that the resulting CCF will peak, not at d or d, but at d. More generally, any composite lightcurve CCF will be the sum of the component lightcurve CCFs weighted by the fraction of the total band flux coming from each lightcurve that is correlated with the reference lightcurve. In this way, we can constrain the flux contributions of variable components with different lags to a given band by matching the peak and shape of the CCF.
We use sixteen variable component lightcurves: the original FUV lightcurve, the FUV lightcurve lagged and smoothed by d, the FUV lightcurve lagged and smoothed by d, the FUV lightcurve lagged and smoothed by d, e.t.c, up to a maximum lag of d. We then combine these component lightcurves to simulate model UVW1 and V band lightcurves and then compare the CCFs of these model lightcurves to the observed CCFs. We systematically adjust the component lightcurve contributions and select the fractional contributions which produce the smallest difference () between model and observed CCFs, where . Since UVW1 and V band are spectrally close (and the blackbodies we will fit to the components are broad in comparison), we require both bands to contain the same lagged components (although the fractional contributions of these components in each band will differ).
We find the best fitting model under these constraints requires UVW1 and V band to contain a contribution from the original FUV lightcurve, plus a contribution from the FUV lightcurve lagged and smoothed by d. Table 1 lists the corresponding fractional contributions ( and ), while Fig.12a shows the resulting model CCFs (blue), compared to the observed CCFs (red), where UVW1 CCFs are shown with dashed lines and V band CCFs with dotted lines. The model V band CCF peaks at d, in agreement with the data. The UVW1 CCF peaks at d, again in agreement with the data.
Matching the CCFs allows us to constrain the lagged, i.e. variable, flux contributions to the UVW1 and V bands. If the UVW1 and V bands contained only these variable components then they would have equal amplitude fluctuations. The observed FUV, UVW1 and V band lightcurves shown in Fig.12b in solid, dashed and dotted red lines, respectively, clearly do not have equal amplitude. The amplitude decreases with increasing wavelength, implying the fluctuations are being increasingly diluted by a constant component. Matching the amplitude of our simulated UVW1 and V band lightcurves to the observations allows us to constrain the fractional contribution of this constant component () to each band.
In reality this constant component has two possible sources: intrinsic BB disc flux and flux from the host galaxy. The spectral decomposition in Mehdipour et al. (2015) (Fig.11a) shows that the contribution of the host galaxy to the UVW1 band is negligible, hence we can assume all the constant flux in the UVW1 band is supplied by intrinsic BB disc emission (i.e. , ). In contrast, the spectrum in Mehdipour et al. (2015) shows that the flux contributions of the intrinsic BB disc continuum and the host galaxy are roughly equal in the V band, i.e. . Each band therefore has contributions from a maximum of six spectral components, with the proportions of each listed in Table 1.
Having established the flux contributions of each temporal component to each band, we can now begin finding spectral components that can provide these flux levels in each band.
| UVW1 | V band | |
|---|---|---|
| 0.395 | 0.189 | |
| 0.105 | 0.111 | |
| 0.500 | 0.700 | |
| 0.500 | 0.350 | |
| 0.000 | 0.350 |
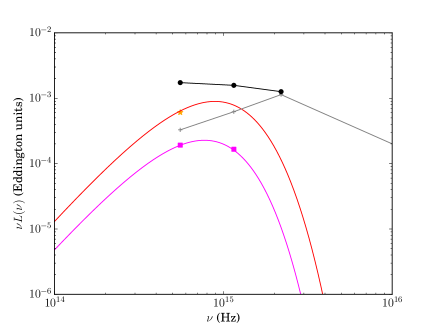 |
We begin with intrinsic BB disc emission. We introduce a standard BB disc (red line, Fig.13), truncated at with , as is required by the energetically constrained spectral decomposition shown in Fig.7a. This is the sole provider of constant flux in the UVW1 band. Since we know the fractional contribution of constant flux to the UVW1 band (; Table 1), this tells us the total UVW1 band flux is (central black point, Fig.13). From Fig.6a&b in Mehdipour et al. (2015) we can derive the ratio of dereddened FUV flux – UVW1 flux (), and the ratio of (deredenned but still including host galaxy) V band flux — UVW1 flux (). From our total UVW1 band flux we can therefore calculate the total FUV and total V band flux (right hand and left hand black points, Fig. 13). We know from Table 1 that the fraction of intrinsic BB disc flux in the V band is , i.e. , which requires , in order to not over-predict the V band disc flux.
Using the total band fluxes and the fractional contributions in Table 1 we can similarly constrain the UVW1 and V band flux levels of the d lagged component (magenta squares, Fig.13). We then construct a blackbody spectrum that can supply these flux levels, shown in Fig.13 by the magenta line. A blackbody spectral component has two parameters: its temperature and its area. The temperature defines the frequency of the blackbody peak, while the temperature and emitting area together determine the luminosity of the blackbody. We adjust the temperature until the peak is placed such that we can match the ratio of that component’s UVW1 to V band flux. We then adjust the area of the blackbody reprocessor to give the blackbody the appropriate luminosity.
The grey crosses in Fig.13 show the flux level of the component which varies as the observed FUV lightcurve (the flux level in the FUV band is found by subtracting the flux contributions of the other components from the total FUV flux). The spectral shape of this component is qualitatively similar to the Comptonised disc component shown in Fig.7a. Although the un-lagged component dominates in the FUV band, there is some contamination from the lagged blackbodies. We recalculate the FUV lightcurve including this contamination to check that it does not affect the CCF peak lags and find its effect is negligible.
Separating the variability of the source into its different components and constraining the contribution of these components to different bands, has allowed us to constrain the spectrum of the reprocessor. Assuming this reprocessor is a blackbody emitter, allowed us to constrain its temperature ( K) and emitting area ( cm2 implying a luminosity ergs s-1). The radial location of the reprocessor is constrained by its lag time i.e. it must be located six light days from the central source, which is for NGC 5548 with . Hence we can derive the covering factor, , of the reprocessor, since . This is tiny and further underlines why the reprocessor cannot be a disc, which has a huge area at these radii.
A possible source of small area reprocessors at large radii could be dense clumps originating in a dust-driven disc wind just like the broad line emitting clouds (Czerny et al. 2015), which are too dense to emit broad lines so instead reprocess the illuminating flux as thermal emission (see also Lawrence 2012). Knowing the covering fraction, it is clear that this material only intercepts 0.2% of the illuminating flux. This is far too small to produce the observed luminosity required for the lagged component, given the observed bolometric luminosity of the source (; Mehdipour et al. 2015).
Hence we can rule out the lag originating from the reprocessing of irradiating flux, where the reprocessing makes blackbody radiation and the lag is from the light travel time. Such a model fails on energetic grounds. A blackbody reprocessor at large radii (, as required by the lag times) must have a small area (ie. covering fraction), if it is to emit at a high enough temperature to contribute significant flux to UVW1 and V band, which means it cannot intercept sufficient illuminating flux to reprocess and heat it to this required temperature.
It seems more likely that the lag is not simply from light travel time delays, but is instead lengthened by some response of the disc structure to the changing illuminating flux.
5.1 An Alternative Explanation for the UV/Optical Lags
So far we have assumed the FUV regions of the puffed-up, optically thick, Comptonised disc region illuminate some separate reprocessor — either a standard BB disc or optically thick BLR clouds. Having shown that neither reprocessor can produce the observed lags, we suggest that perhaps light travel time lags from an illuminating source to an external reprocessor are not involved at all; perhaps the lags instead represent the lag time for the BB disc vertical structure to respond to changes in the FUV illumination.
In this scenario, the hard X-rays heat the inner (soft X-ray emitting) edge of the puffed-up Comptonised disc and this causes a heating wave, which dissipates outwards. From examination of the observed lightcurves (Fig.6) we know this heating wave must quickly lose the high frequency power of the hard X-rays, and it must also include some intrinsic fluctuations produced within the Comptonised disc itself. We speculate that an increase in the hard X-ray flux produces a stronger heating wave, which dissipates outwards through the Comptonised disc. When this heating wave reaches the outer edge of the Comptonised disc, this increases the FUV illumination of the surrounding BB disc. This illumination is concentrated on the innermost BB disc radii adjacent to the Comptonised disc. These BB disc radii respond to the increase in illumination by expanding upwards, becoming less dense and less able to thermalise, so they may switch from emitting BB radiation to emitting via optically thick Compton — the Comptonised disc region has essentially expanded outwards. When the hard X-ray flux decreases, there is less heating of the Comptonised disc region and perhaps its outer radii can then cool and return to emitting BB. The Comptonised disc region is effectively breathing in and out in response to the X-ray heating of its inner edge. We suggest this expanding and contracting of the puffed-up Comptonised disc region, ie. this movement of the transition radius between Comptonised disc and BB disc, is then the cause of the interband UV–optical lags. The lag times should therefore reflect the response time of the disc vertical structure to changing irradiation.
The fastest response timescale of the disc is the dynamical timescale. This sets both the orbital timescale, and the timescale on which the vertical structure responds to loss of hydrostatic equilibrium. The latter seems more appropriate for the physical mechanism we envisage, but this is 32 days for a mass of at . It is only as short as 6 days for . Hameury et al. (2009) calculate the effect of the disc instability for an AGN, but their illumination geometry is for a central source rather than the larger scale height FUV illumination envisaged here. More detailed simulations are required to see if such a mechanism is feasible and if so, how to determine the radius more precisely from the timescale.
6 Conclusions
We have built a full disc reprocessing model in an attempt to simulate the simultaneous multi-wavelength lightcurve data presented by Edelson et al. (2015), assuming the UV/optical variability seen in NGC 5548 is due to reprocessing of higher energy radiation by a BB accretion disc. This higher energy radiation is traditionally assumed to be the hard X-ray power law, produced at small accretion flow radii. We find that reprocessing of the hard X-rays by a standard BB accretion disc cannot replicate the observed UV/optical lightcurves or their lags with respect to the illuminating X-rays. Specifically the simulated lightcurves reproduce too much of the hard X-ray high frequency power and the light travel lag times are too short.
One obvious answer to increase the amount of smoothing and increase the light travel lag times would appear to be to make the BB accretion disc larger. The first reason this is not an option is a constraint from the spectral energy distribution of NGC 5548. We have limited the size of our model accretion disc to the self-gravity radius. We could relax this condition and allow the BB disc to extend to larger radii, but this would cause the disc spectrum to extend to lower energies. By contrast, the observed spectrum of NGC 5548, as shown by Mehdipour et al. (2015), clearly does not show such emission. The peak UV/optical emission occurs in the UVW1 bandpass and the emission below this energy rapidly drops off. With an outer disc radius at the self-gravity radius, we already slightly overpredict the lowest energy fluxes. However, we modelled this directly, and find that the radii required to smooth the reprocessed hard X-ray lightcurve to a level matching the data is so large that the resulting lag times are too long to be compatible with the observations.
We are then driven to a scenario where the reprocessor cannot directly see the hard X-rays. This requires some source of material with sufficient scale-height that it can block the optical emitting regions’ view of the hard X-rays. The obvious candidate for this is the extra component required to fit the soft X-ray excess.
There is much debate over the physical origin of this component. We envisage a scenario where it is produced in an optically thick Comptonising region at larger radii than the central hard X-rays. UV/FUV emission produced in this region lifts material out of the plane of the accretion flow, where it is illuminated by the hard X-ray flux, which overionises the material. The resultant loss of UV opacity means it falls back down, resulting in a region with scale-height sufficient to prevent the hard X-rays illuminating the outer BB disc. The soft X-ray emission could come from the inner radii of this Comptonised disc region, while the lowest energy FUV emission could come from its largest radii.
One problem with complete shielding is that the observed FUV and hard X-ray lightcurves are significantly correlated, though the correlation is quite poor. One possibility to incorporate some feedback between the two regions is if hard X-rays illuminate the inner edge of the Comptonised disc region and these fluctuations then dissipate outwards through the Comptonised disc until they reach the outer FUV emitting regions, which then illuminate the surrounding BB disc. It is then dissipation of the hard X-ray fluctuations through the Comptonised disc component that causes the loss of high frequency power, not light travel time smoothing. This dissipation process has to be extremely fast, however the viscous timescale in the Comptonised section of the disc should be faster than in a standard Shakura-Sunyaev BB disc.
We show that a model where the FUV emission (represented by the Hubble band lightcurve) provides the illumination gives a much better match to the shape of the observed optical lightcurves. However, our model response is still too fast at the longest wavelengths. The observed V band lag in NGC 5548 is d behind the FUV emission, which requires the reprocessed V band flux to be emitted at radii for this source. However BB disc annuli at these large radii are too cool to contribute significant flux to the V band, which is instead dominated by hotter emission from smaller BB disc radii with shorter lag times. The heating effect of the illuminating flux makes very little difference, as large disc annuli have enormous area. The illuminating flux is simply spread over too large an area, so barely changes the temperature of the annulus and certainly cannot heat the annulus enough for it to contribute significant V band flux. In order for the illuminating flux to heat a reprocessor at these large radii enough to contribute to the V band requires the reprocessor to have a small area.
We use the UV/optical lightcurves and cross correlation functions to constrain the amount of reprocessed flux with different lag times in the UVW1 and V bands and find a combination of unlagged FUV lightcurve and FUV lightcurve lagged by 6d can fit both bands. Assuming this 6d-lag reprocessed flux is blackbody emission, we then estimated the temperature and covering factor of the blackbody reprocessor and find K and . This tiny covering factor rules out the BB disc as the source of the reprocessed emission. We consider the possibility that this emission may arise from optically thick BLR clouds that are too dense to emit via line emission so instead reprocess the FUV flux as thermal blackbody emission. However this scenario is ruled out on energetic grounds — the inferred covering factor is too small for the reprocessor to intercept sufficient illuminating flux to heat it to the required temperature.
We conclude that the UV/optical lightcurves of NGC 5548 are not consistent with reprocessing of the hard X-rays by a BB accretion disc, but can instead be explained by reprocessing of the FUV emission where the lag is not a light travel time. We propose the continuum lags of NGC 5548 are entirely generated by the ‘puffed-up’ Comptonised disc region of the accretion flow: the inner (soft X-ray emitting) edge of this region is heated by the hard X-rays, producing heating waves which dissipate outwards. The outer (UV/optical emitting) edge of the Comptonised disc then expands and contracts, in both radius and height, in response to the passage of these heating waves and it is this behaviour which produces the continuum lags. The model still requires the presence of a standard outer Shakura-Sunyaev BB accretion disc, but this is a mostly constant component.
Ultimately, whatever the origin of the lags in NGC 5548, the datasets now available contain much more information than is encapsulated in a single lag time measurement. We urge full spectral–timing modelling of these data in order to extract all the new physical information on the structure and geometry of the accretion flow which is now within reach.
7 Acknowledgements
EG and CD acknowledge funding from the UK STFC grants ST/I001573/1 and ST/L00075X/1. CD acknowledges Missagh Mehdipour for multiple very helpful conversations and data, and Hagai Netzer for discussions about thermalisation. We thank the referee for their detailed report which made us assess the energetics of our original reverse engineered model with small clouds, and hence change the conclusions of our paper.
References
- [Arévalo et al.(2008)] Arévalo, P., Uttley, P., Kaspi, S., et al. 2008, MNRAS, 389, 1479
- [Bentz et al.(2010)] Bentz, M. C., Walsh, J. L., Barth, A. J., et al. 2010, ApJ, 716, 993
- [Boissay et al.(2014)] Boissay, R., Paltani, S., Ponti, G., et al. 2014, A&A, 567, A44
- [Cackett et al.(2007)] Cackett, E. M., Horne, K., & Winkler, H. 2007, MNRAS, 380, 669
- [Capellupo et al.(2015)] Capellupo, D. M., Netzer, H., Lira, P., Trakhtenbrot, B., & Mejía-Restrepo, J. 2015, MNRAS, 446, 3427
- [Coleman et al.(2016)] Coleman, M. S. B., Kotko, I., Blaes, O., Lasota, J.-P., & Hirose, S. 2016, MNRAS, 462, 3710
- [Crummy et al.(2006)] Crummy, J., Fabian, A. C., Gallo, L., & Ross, R. R. 2006, MNRAS, 365, 1067
- [\citeauthoryearCunningham1976] Cunningham C., 1976, ApJ, 208, 534
- [\citeauthoryearCzerny et al.2015] Czerny B., et al., 2015, AdSpR, 55, 1806
- [Davis et al.(2007)] Davis, S. W., Woo, J.-H., & Blaes, O. M. 2007, ApJ, 668, 682
- [Denney et al.(2010)] Denney, K. D., Peterson, B. M., Pogge, R. W., et al. 2010, ApJ, 721, 715
- [\citeauthoryearDone et al.2012] Done C., Davis S. W., Jin C., Blaes O., Ward M., 2012, MNRAS, 420, 1848
- [\citeauthoryearEdelson et al.2015] Edelson R., et al., 2015, ApJ, 806, 129
- [Fausnaugh et al.(2015)] Fausnaugh, M. M., Denney, K. D., Barth, A. J., et al. 2015, arXiv:1510.05648
- [Gaskell & Peterson(1987)] Gaskell, C. M., & Peterson, B. M. 1987, ApJS, 65, 1
- [Gierliński & Done(2004)] Gierliński, M., & Done, C. 2004, MNRAS, 349, L7
- [Haardt & Maraschi(1991)] Haardt, F., & Maraschi, L. 1991, ApJ, 380, L51
- [Haardt & Maraschi(1993)] Haardt, F., & Maraschi, L. 1993, ApJ, 413, 507
- [Hameury et al.(2009)] Hameury, J.-M., Viallet, M., & Lasota, J.-P. 2009, A&A, 496, 413
- [Heil et al.(2015)] Heil, L. M., Uttley, P., & Klein-Wolt, M. 2015, MNRAS, 448, 3348
- [Ingram et al.(2009)] Ingram, A., Done, C., & Fragile, P. C. 2009, MNRAS, 397, L101
- [Ingram & Done(2012)] Ingram, A., & Done, C. 2012, MNRAS, 419, 2369
- [Jiang et al.(2016)] Jiang, Y.-F., Davis, S. W., & Stone, J. M. 2016, ApJ, 827, 10
- [\citeauthoryearJin, Ward, & Done2012] Jin C., Ward M., Done C., 2012, MNRAS, 425, 907
- [Korista & Goad(2001)] Korista, K. T., & Goad, M. R. 2001, ApJ, 553, 695
- [Kotov et al.(2001)] Kotov, O., Churazov, E., & Gilfanov, M. 2001, MNRAS, 327, 799
- [\citeauthoryearLaor & Netzer1989] Laor A., Netzer H., 1989, MNRAS, 238, 897
- [Lasota(2001)] Lasota, J.-P. 2001, New A Rev., 45, 449
- [Lawrence(2012)] Lawrence, A. 2012, MNRAS, 423, 451
- [Malzac et al.(2005)] Malzac, J., Dumont, A. M., & Mouchet, M. 2005, A&A, 430, 761
- [Matt et al.(2014)] Matt, G., Marinucci, A., Guainazzi, M., et al. 2014, MNRAS, 439, 3016
- [\citeauthoryearMcHardy et al.2014] McHardy I. M., et al., 2014, MNRAS, 444, 1469
- [McHardy et al.(2016)] McHardy, I., Connolly, S., Peterson, B., et al. 2016, arXiv:1601.00215
- [\citeauthoryearMehdipour et al.2015] Mehdipour M., et al., 2015, A&A, 575, A22
- [Morgan et al.(2010)] Morgan, C. W., Kochanek, C. S., Morgan, N. D., & Falco, E. E. 2010, ApJ, 712, 1129
- [Narayan & Yi(1995)] Narayan, R., & Yi, I. 1995, ApJ, 452, 710
- [Noda et al.(2011)] Noda, H., Makishima, K., Uehara, Y., Yamada, S., & Nakazawa, K. 2011, PASJ, 63, 449
- [Noda(2016)] Noda, H. 2016, X-ray Studies of the Central Engine in Active Galactic Nuclei with Suzaku, Springer Theses. ISBN 978-981-287-720-8. Springer Science+Business Media Singapore, 2016.,
- [\citeauthoryearNovikov & Thorne1973] Novikov I. D., Thorne K. S., 1973, blho.conf, 343
- [Pancoast et al.(2014)] Pancoast, A., Brewer, B. J., Treu, T., et al. 2014, MNRAS, 445, 3073
- [Pancoast et al.(2015)] Pancoast, A., Brewer, B. J., Treu, T., et al. 2015, MNRAS, 448, 3070
- [Petrucci et al.(2010)] Petrucci, P. O., Ferreira, J., Henri, G., Malzac, J., & Foellmi, C. 2010, A&A, 522, A38
- [Petrucci et al.(2013)] Petrucci, P.-O., Paltani, S., Malzac, J., et al. 2013, A&A, 549, A73
- [Porquet et al.(2004)] Porquet, D., Reeves, J. N., O’Brien, P., & Brinkmann, W. 2004, A&A, 422, 85
- [Sergeev et al.(2005)] Sergeev, S. G., Doroshenko, V. T., Golubinskiy, Y. V., Merkulova, N. I., & Sergeeva, E. A. 2005, ApJ, 622, 129
- [Stern et al.(1995)] Stern, B. E., Poutanen, J., Svensson, R., Sikora, M., & Begelman, M. C. 1995, ApJ, 449, L13
- [Svensson & Zdziarski(1994)] Svensson, R., & Zdziarski, A. A. 1994, ApJ, 436, 599
- [Ursini et al.(2015)] Ursini, F., Boissay, R., Petrucci, P.-O., et al. 2015, A&A, 577, A38
- [\citeauthoryearWelsh & Horne1991] Welsh W. F., Horne K., 1991, ApJ, 379, 586
- [Zycki et al.(1999)] Zycki, P. T., Done, C., & Smith, D. A. 1999, MNRAS, 305, 231