11email: arnas.drazdauskas@tfai.vu.lt 22institutetext: INAF - Osservatorio Astrofisico di Arcetri - Largo Enrico Fermi 5, I-50125 Firenze, Italy
22email: randich@arcetri.astro.it 33institutetext: INAF - Osservatorio Astronomico di Bologna, Via Ranzani 1, I-40127 Bologna, Italy
33email: angela.bragaglia@oabo.inaf.it
The extent of mixing in stellar interiors: the open clusters Collinder 261 and Melotte 66††thanks: Based on observations collected at ESO telescopes under Guaranteed Time Observation programmes 071.D-0065, 072.D-0019, and 076.D-0220.
Abstract
Context. Determining carbon and nitrogen abundances in red giants provides useful diagnostics to test mixing processes in stellar atmospheres.
Aims. Our main aim is to determine carbon-to-nitrogen and carbon isotope ratios for evolved giants in the open clusters Collinder 261 and Melotte 66 and to compare the results with predictions of theoretical models.
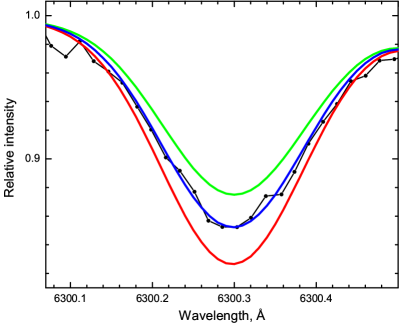
Methods. High-resolution spectra were analysed using a differential model atmosphere method. Abundances of carbon were derived using the Swan (0,1) band head at 5635.5 Å. The wavelength interval 7940–8130 Å, which contains CN features, was analysed to determine nitrogen abundances and carbon isotope ratios. The oxygen abundances were determined from the [O i] line at 6300 Å.
Results. The mean values of the elemental abundances in Collinder 261, as determined from seven stars, are: (s.d.), , . The mean ratio is , considering four red clump stars and 18 for one star above the clump. The mean C/N ratios are and 1.74, respectively. For the five stars in Melotte 66 we obtained: (s.d.), , . The and C/N ratios are and , respectively.
Conclusions. The and C/N ratios of stars in the investigated open clusters were compared with the ratios predicted by stellar evolution models. The mean values of ratios in Collinder 261 and Melotte 66 agree well with models of thermohaline-induced extra-mixing for the corresponding stellar turn-off masses of about 1.1–1.2 . The mean C/N ratios are not decreased as much as predicted by the model in which the thermohaline- and rotation-induced extra-mixing act together.
Key Words.:
stars: abundances – stars: horizontal branch – stars: evolution – open clusters and associations: individual: Cr 261, Mel 661 Introduction
Determining carbon and nitrogen abundances, together with isotopic ratios, in red giants provides useful diagnostic data to test mixing processes in stellar atmospheres. Observations provided evidence of the first dredge-up (Iben 1965), which brought the CN-processed material up to the surface of low-mass stars when they reached the bottom of the red giant branch (RGB). Interestingly, they also indicated the presence of extra-mixing, which happens later on the giant branch (Gilroy 1989; Luck 1994; Gratton et al. 2000; Tautvaišienė et al. 2000, 2005, 2010; Smiljanic et al. 2009, 2016; Mikolaitis et al. 2010, 2011a, 2011b, 2012, etc.).
Ideas about the mechanisms of extra-mixing have been proposed by a number of theoreticians, since the standard first dredge-up model alone was not able to account for the surface abundances that had been determined spectroscopically (see the reviews by Chanamé et al. 2005; Charbonnel 2006 and the papers by Cantiello & Langer 2010; Charbonnel & Lagarde 2010; Denissenkov 2010; Lagarde et al. 2011; Wachlin et al. 2011; Angelou et al. 2012; Lagarde et al. 2012; Lattanzio et al. 2015, and references therein). Theoretical models of thermohaline- and rotation-induced extra-mixing are currently being intensively developed. The influence of thermohaline mixing and rotation varies in stars of different masses and metallicities, and still needs more observational data to be robustly modelled.
The determination of CNO abundances and ratios in open clusters offers many advantages. We analyse stars that have the same age, metallicity, and origin. Their distance and age, hence the mass and evolutionary status, can be determined more precisely than for field stars, at least in the pre-Gaia era. In clusters, we have homogeneous star samples, with the same initial composition, in particular the CNO elements. Thus changes in their abundances are related to internal processes of stellar evolution.
In the present work, we have determined abundances of carbon, nitrogen and oxygen, and carbon isotopic ratios in evolved stars of the open clusters Collinder 261 and Melotte 66. The new results of these two old open clusters with low turn-off masses (i.e. 1.1–1.2 , given their old age), taken together with the results of previous studies, are used to evaluate the theoretical models of extra-mixing.
The first survey of the open cluster Collinder 261 (Cr 261) was made by Bergh & Hagen (1975). They determined it was a rich cluster with a diameter of 8 arc minutes. Phelps et al. (1994) provided the first CCD photometry and claimed Cr 261 was one of the oldest clusters, although no precise age was given. A very old age was confirmed by later studies (Mazur et al. 1995 suggested 5 Gyr, Gozzoli et al. 1996 gave a range of 7–11 Gyr, and Bragaglia & Tosi 2006 preferred an age of 6 Gyr).
The low-resolution spectroscopic study by Friel (1995) determined a metallicity , which was updated to by Friel et al. (2002), based on 21 stars. Friel et al. (2003) analyse four stars with high-resolution spectroscopy and determine . The following high-resolution spectroscopic studies determine a slightly higher metal content. Carretta et al. (2005) investigate six red clump and RGB stars and find for the five warmer stars. De Silva et al. (2007) also determine . Sestito et al. (2008) obtain spectra with two UVES setups (see later), but base their results mostly on the bluer ones. They determine for seven RGB and red clump stars. We use the spectra of both their setups.
The only study of CNO elements and carbon isotope ratios in Collinder 261 was performed by Mikolaitis et al. (2012). Using high resolution FEROS spectra of the six stars previously investigated by Carretta et al. (2005), they determine a mean carbon-to-nitrogen ratio of . The average value of was determined in four giants, and in two clump stars. Their results agree with the theoretical cool-bottom processing model proposed by Boothroyd & Sackmann (1999) and with the thermohaline-induced mixing model computed by Charbonnel & Lagarde (2010)
The first mention of Melotte 66 (Mel 66) can be found in the work by Eggen & Stoy (1962). They performed a photographic photometry for 20 stars. King (1964) made a suggestion that this cluster is one of the oldest in our Galaxy. Various authors quote rather similar ages, ranging from 4 to 7 Gyr (Hawarden 1976; Anthony-Twarog et al. 1979; Gratton 1982; Friel & Janes 1993; Kassis et al. 1997). In the present paper we assume the age of Kassis et al. (1997), i.e. 4 Gyr.
The photometric analyses of Melotte 66 consistently provide low values for its metallicity, about dex (Hawarden 1976; Dawson 1978; Geisler & Smith 1984; Twarog et al. (1995)). This was confirmed by moderate-resolution (Friel & Janes 1993 determined from four giants) and by high-resolution spectroscopy (Gratton & Contarini 1994 determined from two giants). The most recent investigation was carried out by Sestito et al. (2008) using high-resolution spectra of six giants with mean .
There are no previous investigations of CNO abundances or ratios for this cluster. In particular, we use the spectra of the five stars that are considered members and are not fast rotators.

2 Observations and method of analysis
The multi-object instrument FLAMES (Fiber Large Array Multi-Element Spectrograph, Pasquini et al. 2002) on the Unit 2 of the Very Large Telescope (UT2/VLT, European Southern Observatory, Chile) was used to observe the target clusters. High-resolution spectra of five giants in Mel 66 and seven in Cr 261 were obtained using the UVES (Ultraviolet and Visual Echelle Spectrograph, Dekker et al. 2000) with a resolving power of 47 000. The clusters were observed with both the RED580 (wavelength range ) and RED860 (wavelength range ) configurations. Details of observations and reductions are presented by Sestito et al. (2008).
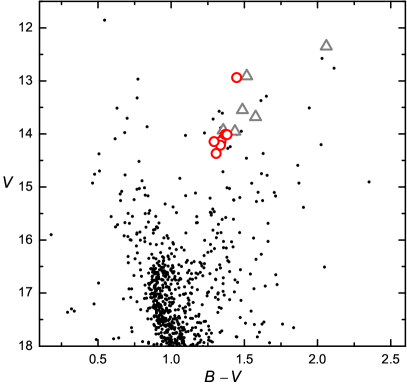
The main atmospheric parameters for the target stars were derived spectroscopically by Sestito et al. (2008). For convenience, we present these atmospheric parameters in Table 1. Two stars of Melotte 66 were excluded from our analysis since one is a fast rotator and one is not a secure member, based on its radial velocity. Figs. 1 and 2 show the colour-magnitude diagrams of the analysed stars in both clusters. We analysed the spectra using a differential analysis technique. All calculations are differential with respect to the Sun. Solar element abundance values were taken from Asplund et al. (2005). Spectral synthesis was used for all abundance determinations, as well as for ratio calculations. The program BSYN, developed at the Uppsala University, was used for spectral syntheses. A set of plane-parallel, one dimensional, hydrostatic, constant flux LTE model atmospheres were taken from the MARCS stellar model atmosphere and flux library111http://marcs.astro.uu.se/ (Gustafsson et al. 2008). The Vienna Atomic Line Data Base (VALD, Piskunov et al. 1995) was used in preparing input data for the calculations. Atomic oscillator strengths for the main spectral lines analysed in this study were taken from an inverse solar spectrum analysis (Gurtovenko & Kostyk 1989).
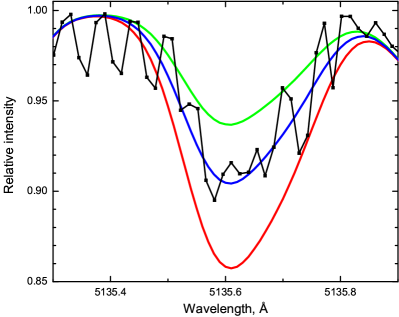
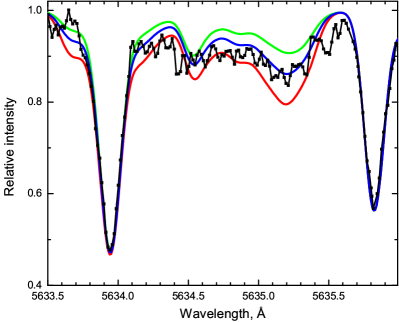
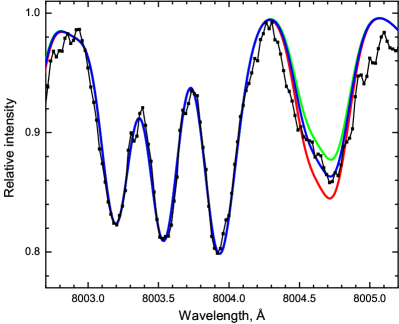
To determine the carbon abundance in all stars we used two regions: the Swan (0,1) band heads at 5135.5 Å and 5635.2 Å. We used the same molecular data of as Gonzalez et al. (1998). The oxygen abundance was derived from a synthesis of the forbidden [O i] line at 6300 Å. The values for and isotopic line components, which blend with the oxygen line, were taken from Johansson et al. (2003). The interval 7980-8010 Å, which contains strong CN features, was used to determine nitrogen abundance and ratios. The ratio was obtained from the feature at 8004.7 Å. The CN molecular data for this wavelength interval were provided by Bertrand Plez.
All the synthetic spectra were calibrated to the solar spectrum by Kurucz (2005) to make the analysis differential to the Sun. Figures 3–6 display examples of spectrum syntheses for the programme stars. The best-fit abundances were determined by eye.
| Cr 261 | log | [Fe/H] | ||||
|---|---|---|---|---|---|---|
| Star | K | km s-1 | mag | mag | ||
| RGB02∗ | 4350 | 1.70 | 1.25 | +0.12 | 12.94 | 1.45 |
| RGB05 | 4600 | 2.00 | 1.24 | +0.14 | 14.14 | 1.34 |
| RGB06 | 4500 | 2.30 | 1.18 | +0.16 | 14.01 | 1.37 |
| RGB07 | 4546 | 2.15 | 1.20 | +0.18 | 14.01 | 1.38 |
| RGB09 | 4720 | 2.05 | 1.27 | +0.04 | 14.21 | 1.34 |
| RGB10 | 4700 | 2.35 | 1.20 | +0.20 | 14.37 | 1.31 |
| RGB11 | 4670 | 2.15 | 1.13 | +0.09 | 14.15 | 1.29 |
| Mel 66 | log | [Fe/H] | ||||
| Star | K | km s-1 | mag | mag | ||
| 1346 | 4750 | 2.00 | 1.17 | 14.59 | 1.23 | |
| 1493 | 4770 | 2.15 | 1.20 | 14.68 | 1.29 | |
| 1785 | 4770 | 2.05 | 1.20 | 14.59 | 1.24 | |
| 1884 | 4750 | 2.45 | 1.23 | 14.71 | 1.19 | |
| 2218 | 4850 | 2.39 | 1.25 | 14.48 | 1.19 |
burning stars. The identifications are taken from Sestito et al. (2008).
Uncertainties can be divided into two categories. Firstly, there are errors that affect each line individually. Fitting of individual lines depends on several factors, including uncertainties on atomic parameters, continuum placement variations, and the fitting of synthetic spectra to each line. Secondly, there are errors that affect all measured lines simultaneously, such as uncertainties in the stellar atmospheric parameters used.
Table 2 shows a relation between the abundance estimates [El/Fe] and assumed uncertainties of the atmospheric parameters in the programme star Mel 66 1493. Considering the given deviations from the parameters used, we see that the abundances are not affected strongly.
Since abundances of C, N, and O are also bound together by molecular equilibrium in the stellar atmospheres, we investigated further how an error in one of them typically affects the abundance determination of another. Thus causes and ; causes and ; has no effect on either the carbon or the oxygen abundances.
|
3 Results and discussion
The abundances of carbon, nitrogen, and oxygen relative to iron [El/Fe]333We use the customary spectroscopic notation [X/Y]. and (the line-to-line scatter), as well as C/N and 12C/13C ratios, are listed in Table 3.
The average values and dispersions around the mean values in the six stars of Collinder 261 are the following: (standard deviation), , and . From five stars in Melotte 66, we obtained: , , and .
The mean ratio in four clump stars of Collinder 261 is and 18 in the first ascent giant Cr 261 RGB02. The mean C/N ratio is equal to in the clump stars and in Cr 261 RGB02. Our results agree well with Mikolaitis et al. (2012). Their and C/N values for two clump stars are and , respectively. The mean and C/N values for the four first ascent giants in their paper is and , respectively.
Our analysis confirms that the ratio in the first ascent giants of Collinder 261 is lower than in the more evolved clump stars that we investigated. The clump stars accumulated all chemical composition changes that took place during their evolution along the giant branch and the helium flash. Similar differences between first ascent giants, even though they lie above the RGB luminosity bump, and clump stars have been previously observed in other open clusters (M 67, Tautvaišienė et al. 2000; NGC 7789, Tautvaišienė et al. 2005; NGC 3532, Smiljanic et al. 2009; NGC 2506, Mikolaitis et al. 2011a).
The mean and C/N ratios in the clump stars of Melotte 66 are and , respectively. These values can be compared to the solar value of C/N ratio which is equal to 4.07, as calculated from the solar abundances presented by Asplund et al. (2005), and to the ratio which is 86.8 (Scott et al. 2006).
The and C/N ratios of the clump stars in the two sample clusters were compared with the values predicted by stellar evolution models. Among the most recent models there is the so-called thermohaline model of extra-mixing (Charbonnel & Lagarde 2010). This model of thermohaline-instability-induced mixing is based on the ideas of Eggleton et al. (2006), Ulrich (1972), Charbonnel & Zahn (2007), and Kippenhahn et al. (1980). Eggleton et al. (2006) found a mean molecular weight () inversion in their stellar evolution model, occurring after the so-called luminosity bump on the RGB, when the hydrogen-burning shell reaches the chemically homogeneous part of the envelope. The -inversion is produced by the reaction , as predicted in Ulrich (1972). It does not occur earlier, because the magnitude of the -inversion is low and negligible compared to a stabilising -stratification. Charbonnel & Zahn (2007) computed stellar evolution models, including the ideas of Kippenhahn et al. (1980), who extended Ulrich’s equations to the case of a non-perfect gas. Charbonnel & Zahn (2007) also introduced a double diffusive instability called thermohaline convection and showed its importance in the chemical evolution of red giants. This mixing connects the convective envelope with the external wing of the hydrogen-burning shell and induces surface abundance modifications in evolved stars (Charbonnel & Lagarde 2010).
The calculation of this model was extended to metal-deficient stars by Lagarde et al. (2012), who further added the effects of rotation-induced mixing (considering the star rotation on the zero-age main sequence). Typical initial ZAMS rotation velocities were chosen, depending on the stellar mass and based on observed rotation distributions in young open clusters (Gaige 1993). The convective envelope was supposed to rotate as a solid body through the evolution. The transport coefficients for chemicals associated with thermohaline and rotation-induced mixing were simply added in the diffusion equation and the possible interactions between the two mechanisms were not considered. The rotation-induced mixing modifies the internal chemical structure of main sequence stars, although its signatures are revealed only later in the stellar evolution.
| Star | [C/Fe] | [C/Fe] | [N/Fe] | [N/Fe] | [O/Fe] | [O/Fe] | C/N | 12C/ | Evol. |
| Collinder 261 | |||||||||
| RGB02 | 0.04 | 0.16 | 0.02 | 0.05 | 1.74 | 18 | g | ||
| RGB05 | 0.04 | 0.05 | 0.05 | 2.19 | 8 | c | |||
| RGB06 | 0.05 | 0.29 | 0.04 | 0.09 | 0.05 | 1.26 | 13 | c | |
| RGB07 | 0.01 | 0.20 | 0.02 | 0.01 | 0.05 | 1.48 | – | c | |
| RGB09 | 0.07 | 0.25 | 0.02 | 0.05 | 1.38 | 12 | c | ||
| RGB10 | 0.03 | 0.17 | 0.01 | 0.05 | 1.70 | – | c | ||
| RGB11 | 0.01 | 0.17 | 0.03 | 0.05 | 1.58 | 12 | c | ||
| Average: | |||||||||
| Melotte 66 | |||||||||
| 1346 | 0.02 | 0.13 | 0.03 | 0.13 | 0.05 | 1.41 | 8 | c | |
| 1493 | 0.01 | 0.12 | 0.04 | 0.20 | 0.05 | 1.95 | 8 | c | |
| 1785 | 0.01 | 0.10 | 0.05 | 0.10 | 0.05 | 1.86 | 6 | c | |
| 1884 | 0.01 | 0.28 | 0.03 | 0.22 | 0.05 | 1.66 | – | c | |
| 2218 | 0.01 | 0.23 | 0.07 | 0.14 | 0.05 | 1.45 | 10 | c | |
| Average: |
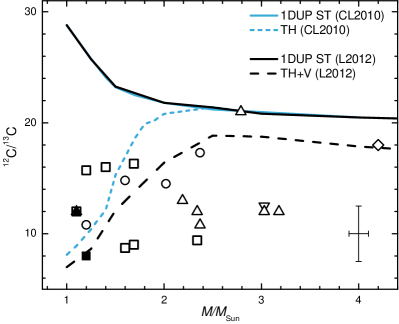
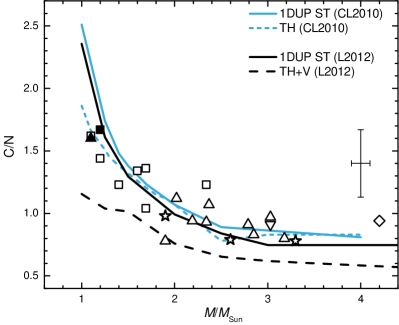
The mean values of and C/N ratios in clump stars are presented in Figs. 7 and 8, together with graphical representations of the above mentioned models. The turn-off mass of Collinder 261 is about 1.1 (Bragaglia & Tosi 2006) and that of Melotte 66 about 1.2 (Sestito et al. 2008). Results for clump stars of other open clusters are also displayed. They were taken from Tautvaišienė et al. (2015), Katime Santrich et al. (2013), Mikolaitis et al. (2010, 2011a, 2011b, 2012), Smiljanic et al. (2009), Tautvaišienė et al. (2000, 2005), Luck (1994), and Gilroy (1989). To produce the average values shown in the figures, we used only red clump stars, since they provide information on the final composition changes after all the evolution along the red giant branch.
The average values of ratios in clump stars of Collinder 261 and Melotte 66 agree well with models of extra-mixing (both thermohaline- and thermohaline+rotation-induced mixing since they are quite similar for the corresponding stellar turn-off masses of about 1.1–1.2 ). The value of Melotte 66 is lower than that of Collinder 261 since the metallicity of this cluster is lower by about 0.5 dex. For stars of larger turn-off masses, the theoretical extra-mixing values start approaching the dredge-up model, while the observational ratios remain quite low.
The C/N ratios are much less sensitive to mixing processes, but the figure suggests that the observational results agree with the trend of the thermohaline-induced extra-mixing model or the dredge-up model, which are very similar. The model in which the thermohaline- and rotation-induced extra-mixing act together lies lower than the observational values that were determined in our work for Collinder 261 and Melotte 66, as well as in previous studies of open clusters.
This study shows that mixing processes in evolved giants should be further investigated, both observationally and theoretically.
Acknowledgements.
This research has made use of the WEBDA database (operated at the Department of Theoretical Physics and Astrophysics of the Masaryk University, Brno), of SIMBAD (operated at CDS, Strasbourg), of VALD (Kupka et al. 2000), and of NASA’s Astrophysics Data System. Bertrand Plez (University of Montpellier II) and Guillermo Gonzalez (Washington State University) were particularly generous in providing us with atomic data for CN and C2 molecules, respectively. This work was partly supported (AD, GT, ŠM) by the grant from the Research Council of Lithuania (MIP-082/2015). Partial support was received (AB, SR) from the Italian PRIN MIUR 2010-2011, project ”The Chemical and Dynamical Evolution of the Milky Way and Local Group Galaxies”.References
- Angelou et al. (2012) Angelou, G. C., Stancliffe, R. J., Church, R. P., Lattanzio, J. C., & Smith, G. H. 2012, ApJ, 749, 128
- Anthony-Twarog et al. (1979) Anthony-Twarog, B. J., Twarog, B. A. & McClure, R. D. 1979, ApJ, 233, 188
- Asplund et al. (2005) Asplund, M., Grevesse, N. & Sauval, A. J. 2005, Cosmic Abundances as Records of Stellar Evolution and Nucleosynthesis, 336, 25
- Bergh & Hagen (1975) van den Bergh, S. and Hagen, G. L. 1975, AJ, 80, 11
- Boothroyd & Sackmann (1999) Boothroyd, A. I., & Sackmann, I. J. 1999, ApJ, 510, 232
- Bragaglia & Tosi (2006) Bragaglia A. & Tosi M. 2006, AJ, 131, 1544
- Cantiello & Langer (2010) Cantiello, M., & Langer, N. 2010, A&A, 521, A9
- Carretta et al. (2005) Carretta, E., Bragaglia, A., Gratton, R. G. & Tosi, M. 2005, A&A, 441, 131
- Chanamé et al. (2005) Chanamé, J., Pinsonneault, M., & Terndrup, D. M. 2005, ApJ, 631, 540
- Charbonnel (2006) Charbonnel, C. 2006, EAS Publications Series, 19, 125
- Charbonnel & Zahn (2007) Charbonnel, C., & Zahn, J.-P. 2007, A&A, 467, L15
- Charbonnel & Lagarde (2010) Charbonnel, C., & Lagarde, N. 2010, A&A, 522, A10
- Dawson (1978) Dawson, D. W. 1978. AJ, 83, 1424
- Dekker et al. (2000) Dekker, H., D’Odorico, S., Kaufer, A., Delabre, B., & Kotzlowski, H. 2000, in Society of Photo-Optical Instrumentation Engineers (SPIE) Conference Series, Vol. 4008, Optical and IR Telescope Instrumentation and Detectors, ed. M. Iye & A. F. Moorwood, 534
- Denissenkov (2010) Denissenkov, P. A. 2010, ApJ, 723, 563
- De Silva et al. (2007) De Silva, G. M., Freeman, K. C., Asplund, M., Bland-Hawthorn, J., Bessell, M. S. & Collet, R. 2007, AJ, 133, 1161
- Eggen & Stoy (1962) Eggen, O. J. & Stoy, R. H. 1962, Royal Greenwich Observatory Bulletins, 53, 7
- Eggleton et al. (2006) Eggleton, P. P., Dearborn, D. S. P. & Lattanzio, J. C. 2006, Science, 314, 1580
- Friel (1995) Friel, E. D. 1995, ARA&A, 33, 381
- Friel & Janes (1993) Friel, E. D. & Janes, K. A. 1993, A&A, 267, 75
- Friel et al. (2002) Friel, E. D., Janes, K. A., Tavarez, M., Scott, J., Katsanis, R., Lotz, J., Hong, L. & Miller, N. 2002, AJ, 124, 2693
- Friel et al. (2003) Friel, E. D., Jacobson, H. R., Barrett, E., Fullton, L., Balachandran, S. C. & Pilachowski, C. A. 2003, AJ, 126, 2372
- Gaige (1993) Gaige, Y. 1993, A&A, 269, 267
- Geisler & Smith (1984) Geisler, D. P. & Smith, V. V. 1984, PASP, 96, 871
- Gilroy (1989) Gilroy, K. K. 1989, ApJ, 347, 835
- Gonzalez et al. (1998) Gonzalez, G., Lambert, D. L., Wallerstein, G., Rao, N. K., Smith, V. V., McCarthy, J. K. 1998, ApJS, 114, 133
- Gozzoli et al. (1996) Gozzoli, E., Tosi, M., Marconi, G. & Bragaglia, A. 1996, MNRAS, 283, 66
- Gratton (1982) Gratton, R. G. 1982, ApJ, 257, 640
- Gratton & Contarini (1994) Gratton, R. G. & Contarini, G. 1994, A&A, 283, 911
- Gratton et al. (2000) Gratton, R.G., Sneden, C., Carretta, E., & Bragaglia, A. 2000, A&A, 345, 169
- Gurtovenko & Kostyk (1989) Gurtovenko, E. A., & Kostyk, R. I. 1989, in Izdatelsvo Naukova Dumka, Kiev
- Gustafsson et al. (2008) Gustafsson, B., Edvardsson, B., Eriksson, K. et al. 2008, A&A, 486, 951
- Hawarden (1976) Hawarden, T. G. 1976, MNRAS, 174, 471
- Iben (1965) Iben, I., Jr. 1965, ApJ, 142, 1447
- Johansson et al. (2003) Johansson, S., Litzén, U., Lundberg, H., & Zhang, Z. 2003, ApJ, 584, L107
- Kassis et al. (1997) Kassis, M., Janes, K. A., Friel, E. D. & Phelps, R. L. 1997, AJ, 113, 1723
- Katime Santrich et al. (2013) Katime Santrich, O. J.; Pereira, C. B.; Drake, N. A. 2013, A&A, 554, 2
- King (1964) King, I. R. 1964, Royal Greenwich Observatory Bulletins, 82, 106
- Kippenhahn et al. (1980) Kippenhahn, R., Ruschenplatt, G., & Thomas, H.-C. 1980, A&A, 91, 175
- Kupka et al. (2000) Kupka, F. G., Ryabchikova, T. A., Piskunov, N. E., Stempels, H. C., & Weiss, W. W. 2000, Baltic Astronomy, 9, 590
- Kurucz (2005) Kurucz, R. L. 2005, Mem. S.A.It. Suppl., 8, 189
- Lagarde et al. (2011) Lagarde, N., Charbonnel, C., Decressin, T., & Hagelberg, J. 2011, A&A, 536, A28
- Lagarde et al. (2012) Lagarde, N., Decressin, T., Charbonnel, C., Eggenberger, P., Ekström, S., & Palacios, A. 2012, A&A, 543, A108
- Lattanzio et al. (2015) Lattanzio, J. C., Siess, L., Church, R. P., et al. 2015, MNRAS, 446, 2673
- Luck (1994) Luck, R. E. 1994, ApJS, 91, 309
- Mazur et al. (1995) Mazur, B., Krzeminski, W. & Kaluzny, J. 1995, MNRAS, 273, 59
- Mikolaitis et al. (2011a) Mikolaitis, Š., Tautvaišienė, G., Gratton, R., Bragaglia, A., & Carretta, E. 2011a, MNRAS, 413, 2199
- Mikolaitis et al. (2011b) Mikolaitis, Š., Tautvaišienė, G., Gratton, R., Bragaglia, A., & Carretta, E. 2011b, MNRAS, 416, 1092
- Mikolaitis et al. (2010) Mikolaitis, Š., Tautvaišienė, G., Gratton, R., Bragaglia, A., & Carretta, E. 2010, MNRAS, 407, 1866
- Mikolaitis et al. (2012) Mikolaitis, Š., Tautvaišienė, G., Gratton, R., Bragaglia, A. & Carretta, E. 2012, A&A, 541, A137
- Pasquini et al. (2002) Pasquini, L., Avila, G., Blecha, A. et al. 2002, The Messenger, 110, 1
- Phelps et al. (1994) Phelps, R. L., Janes, K. A. & Montgomery, K. A. 1994, AJ, 107, 1079
- Piskunov et al. (1995) Piskunov, N. E., Kupka, F., Ryabchikova, T. A., Weiss, W. W., & Jeffery, C. S. 1995, A&AS, 112, 525
- Scott et al. (2006) Scott, P. C., Asplund, M., Grevesse, N., & Sauval, A. J. 2006, A&A, 456, 675
- Sestito et al. (2008) Sestito, P., Bragaglia, A., Randich, S., Pallavicini, R., Andrievsky, S. M. & Korotin, S. A. 2008, A&A, 488, 943
- Smiljanic et al. (2009) Smiljanic, R., Gauderon, R., North, P., et al. 2009, A&A, 502, 267
- Smiljanic et al. (2016) Smiljanic, R., Romano, D., Bragaglia, A., et al. 2016, arXiv:1602.03289
- Tautvaišienė et al. (2000) Tautvaišienė, G., Edvardsson, B., Tuominen, I., & Ilyin, I. 2000, A&A, 360, 499
- Tautvaišienė et al. (2005) Tautvaišienė, G., Edvardsson, B., Puzeras, E., & Ilyin, I. 2005, A&A, 431, 933
- Tautvaišienė et al. (2010) Tautvaišienė, G., Edvardsson, B., Puzeras, E., Barisevičius, G., & Ilyin, I. 2010, MNRAS, 409, 1213
- Tautvaišienė et al. (2015) Tautvaišienė, G., Drazdauskas, A., Mikolaitis, Š. et al. 2015, A&A, 573, 55
- Twarog et al. (1995) Twarog, B. A., Twarog, B. J. A. & Hawarden, T. G. 1995, PASP, 107, 1215
- Ulrich (1972) Ulrich, R. K. 1972, ApJ, 172, 165
- Wachlin et al. (2011) Wachlin, F. C., Miller Bertolami, M. M., & Althaus, L. G. 2011, A&A, 533, A139