Water ice at the surface of HD 100546 disk
Abstract
We made near infrared multicolor imaging observations of a disk around Herbig Be star HD100546 using Gemini/NICI. K (2.2 m), H2O ice (3.06 m), and L’(3.8 m) disk images were obtained and we found the 3.1 m absorption feature in the scattered light spectrum, likely due to water ice grains at the disk surface. We compared the observed depth of the ice absorption feature with the disk model based on Oka et al. (2012) including water ice photodesorption effect by stellar UV photons. The observed absorption depth can be explained by the both disk models with/without photodesorption effect within the measurement accuracy, but slightly favors the model with photodesorption effects, implying that the UV photons play an important role on the survival/destruction of ice grains at the Herbig Ae/Be disk surface. Further improvement on the accuracy of the observations of the water ice absorption depth is needed to constrain the disk models.
Subject headings:
circumstellar matter — stars: pre-main sequence — protoplanetary disks
1. Introduction
Water ice is believed to play many important roles in the planet formation theories. For example, ice enhances the surface density of solid material in the cold outer part of a protoplanetary disk, which promotes the formation of massive cores of gaseous planets (e.g., Hayashi et al., 1985). Thus the ice sublimation/condensation front called snowline, is considered to be the boundary of the forming regions of the terrestrial and Jovian planets. Snowline is also suggested as a possible forming site of the planetesimals (Brauer et al., 2008). Furthermore, icy planetesimals or comets may bring water to the Earth (e.g., Morbidelli et al., 2000). Recently, numerous water vapor emission lines have been detected in protoplanetary disks (e.g., Carr & Najita, 2008; Salyk et al., 2008), and the position of snow line is inferred from the modeling (Zhang et al., 2013). On the other hand, observations of water ice distribution in the disk are limited at this moment. Crystalline H2O ice emission features at 44 and 62 m have been found for several Herbig Ae/Be stars (Malfait et al., 1999; Meeus et al., 2001), but the limited angular resolution in far-infrared wavelengths hampers us to obtain ice distribution. While near-infrared (NIR) water ice absorption toward edge-on disks is reported (Pontoppidan et al., 2005; Terada et al., 2007), the ice absorption is formed at somewhere through line of sight, thus it is still not straightforward to derive its radial distribution in the disk.
Inoue et al. (2008) proposed a new observational way to investigate the radial distribution of ice in face-on disks. They showed that ice absorption should also be imprinted in the light scattered by icy grains and that multi-wavelength imaging in NIR wavebands, including H2O band at 3.1 m, is a useful tool to constrain the ice distribution in the disk. Honda et al. (2009) applied this method to the circumstellar disk around a Herbig Fe star HD 142527, and showed that the water ice grains present in a disk surface at a radial distance of 140 AU. On the other hand, Oka et al. (2012) calculated the stability and distribution of water ice grains in the disk surface considering the photodesorption (photosputtering) process by UV irradiation. They showed that the water ice grains can be rapidly destroyed at the disk surface around A/B type stars due to UV photo desorption processes. Although Honda et al. (2009) already detected the water ice grains in the disk surface around F-type star HD142527, it would be interesting to observe the water ice grains in the disk surface around A/B type stars to check the prediction by Oka et al. (2012).
In this paper, we showed the observations of water ice grains in the disk surface around Herbig Be star HD100546, and discuss the presence/stability of water ice grains in the disk surface. Part of our data was already published in Currie et al. (2014) focusing the planet candidate (Quanz et al., 2013)
2. Observations and Data Reduction
Direct imaging observations of the Herbig Be star HD 100546 using K band filter (central wavelength = 2.20 m, and width = 0.33 m), H2O ice filter ( = 3.06 m, = 0.15 m) and L’ band filter ( = 3.78 m, = 0.70 m) were performed using the NICI (Near Infrared Coronagraphic imager ; Chun et al., 2008) on the Gemini South Telescope on March 31, 2012. We fixed the instrument rotator during the observations of both object and PSF (point-spread function) reference stars to fix the pupil and to obtain the stable PSF patterns. A full width at half maximum (FWHM) of 0.10′′ was achieved at all the wavelength using the instrument AO system. The central region close to the central star was saturated, however, the outer part (r 0.22′′) is not saturated and can be used for disk observations.
The total exposure times were 1672 s, 3192 s, and 2128 s for K, H2O ice, and L’, respectively. As a PSF reference star, we observed HR 4977 (A0V) just before/after HD 100546. HD 105116 (K band) and BS4638 (H2O ice and L’ band) was observed as a photometric standard star. The mean flux density for BS 4638 at 3.06 m was estimated by scaling the Kurucz’s stellar model atmosphere ( = 19500 K, = 3.95, solar metallicity) to match the flux density in K (Soubiran et al., 2010). The calculated flux density was 5.87 Jy at 3.06 m. Observation parameters are summarized in Table 1.
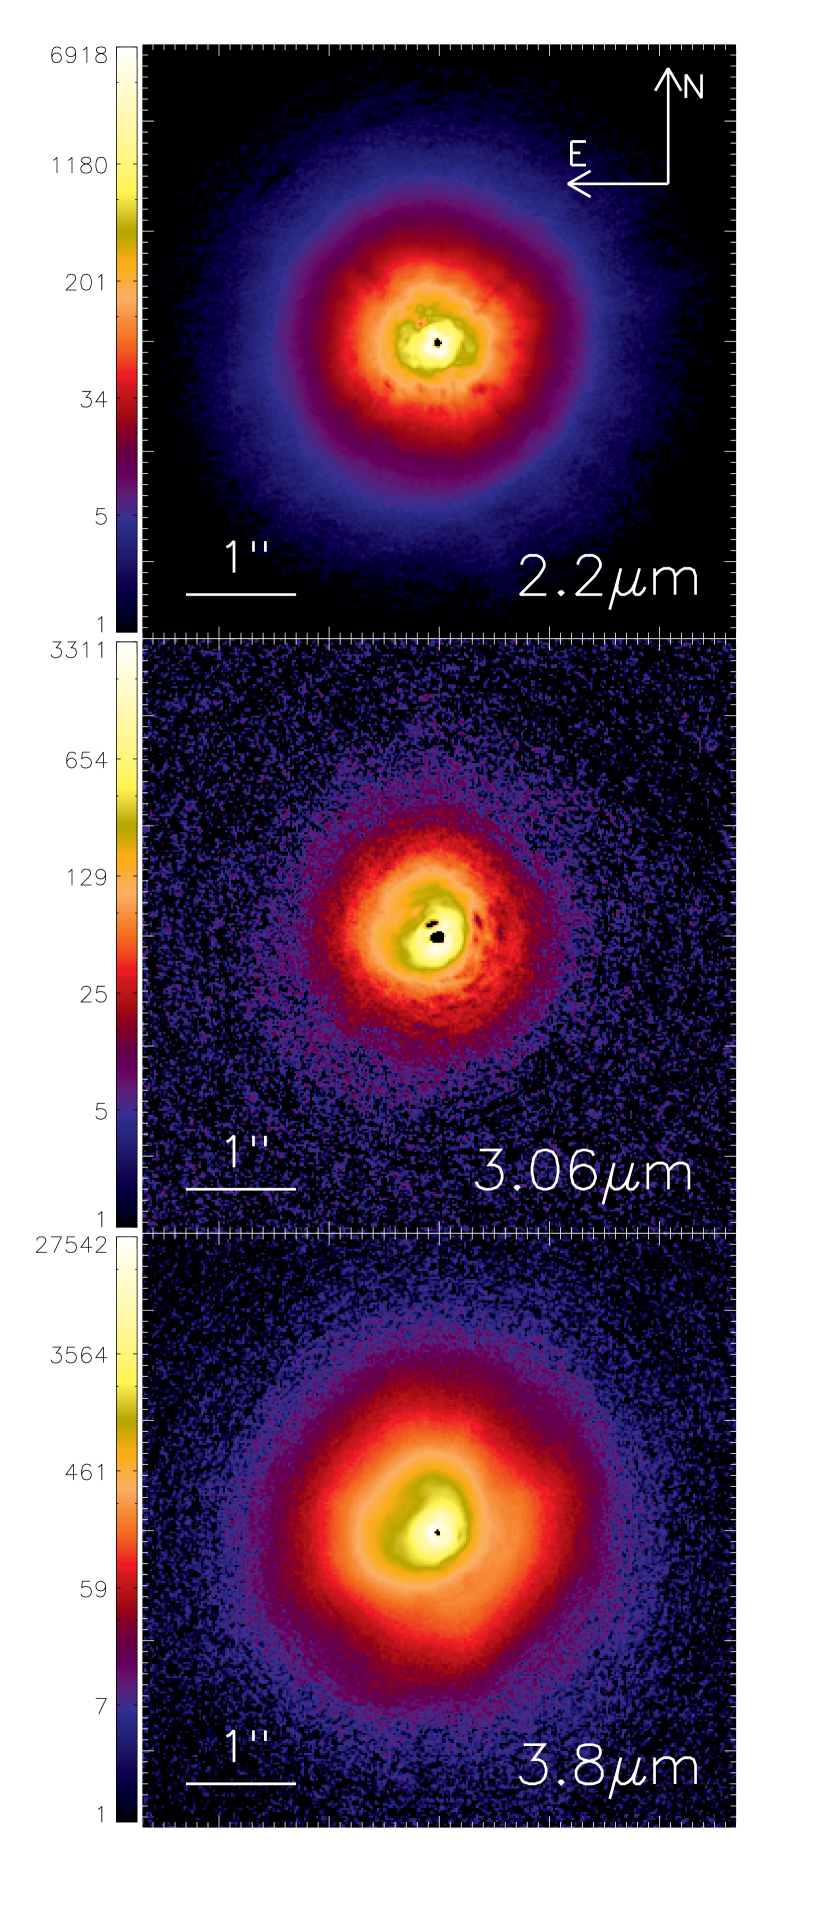
The images were first processed using the IRAF packages for dark subtraction, flat-fielding with sky flats, bad pixel correction, and sky subtraction. Since the stellar halo was very bright, PSF subtraction was required to investigate the faint structure near the central star. The reference PSF was chosen to match the PSF of HD 100546 for each frame with careful visual inspection to determine whether the circular bright halo of the central point source was well suppressed after PSF subtraction. The reference PSF was made by combining the adopted reference star images. The flux scaling of the reference PSF was performed so that no region had negative intensity after the subtraction, in particular, just outer part of central radius (r ). The reference PSF was shifted to match the central position and subtracted from each frame of HD 100546. The each subtracted frame was rotated to match the north direction. Then, the final PSF subtracted image was made by combining the rotated object frames. In order to estimate the systematic uncertainty of the surface brightness due to the PSF subtraction process, we changed the scaling of the PSF before subtraction, and measured the acceptable range of the scaling factor. The systematic uncertainty of the surface brightness was measured to be 20% depending on the position. This systematic uncertainty was typically larger than the statistical error derived from the standard deviation of the best PSF-subtracted object frames. The final PSF subtracted images of HD100546 disk is shown in Figure 1.
3. Results
In Figure 1, an extended disk structure is detected in all three bands. Especially in L’ band, a dark lane is seen in the south-west direction from the star, showing the typical inclined flaring disk morphology. The north-east side is facing to us, while the south-west scattered light beyond the dark lane can be the scattered light from the other side of the disk surface. This morphology is consistent with the previous studies (Quanz et al., 2011; Mulders et al., 2011, 2013; Avenhaus et al., 2014).
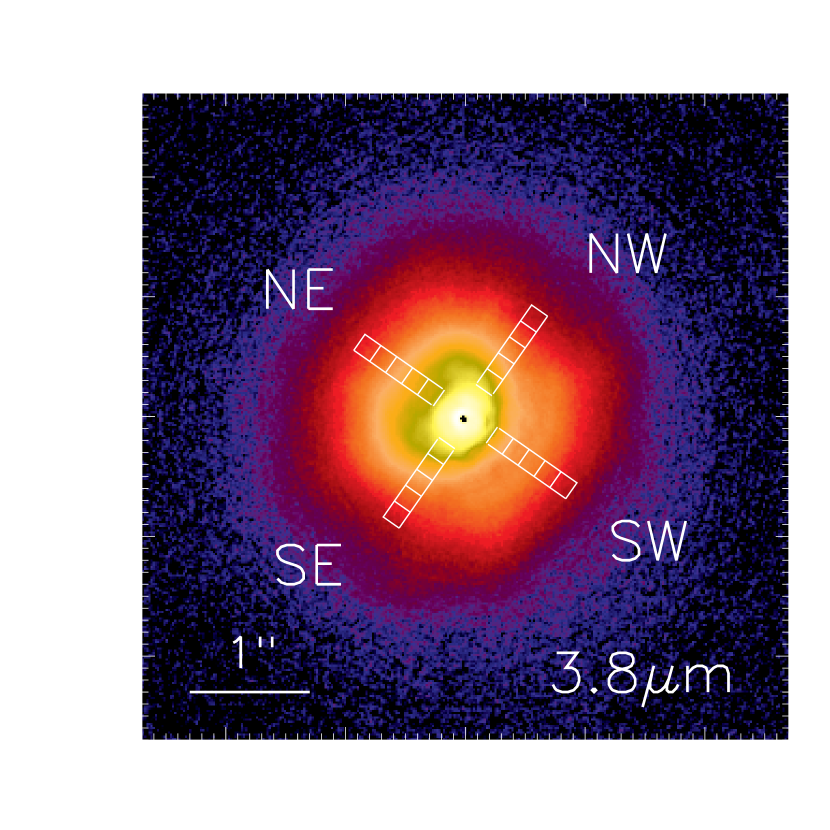
Using these three color images, we extracted the scattered light spectra of different region of the protoplanetary disk. Since the position angle (PA) of this disk major axis is 145∘ (Mulders et al., 2011), we set the 0.162′′(9 pixel) square region along with major and minor axis at a distance of 0.360′′, 0.522′′, 0.684′′, 0.846′′, and 1.008′′ from the central star, which is shown in Figure 2. The extracted spectra of the each region are shown in Figure 3. In almost all the regions, relatively shallow 3 m absorption feature is present in their spectra likely due to water ice grains, indicating that the water ice grains present in the disk surface.
The shallowness of this ice absorption feature can be due to the loss of ice grains at the disk surface. Oka et al. (2012) claimed that the water ice grains can be quickly destroyed at the disk surface around A/B type stars due to its strong UV photodesorption. To assess their prediction, quantitative comparison with the model prediction is required.
4. Discussion
4.1. 3.1 m absorption optical depth
Since we are interested in the water ice distribution in the disk and it is necessary to quantify the absorption feature depth for comparison with the disk model, we will use the water ice absorption optical depth following the convention. Note that the absorption feature in the scattered light spectra is not a pure absorption but rather an albedo effect (see Inoue et al. (2008)), however, the optical depth is so often used as an indicator of the depth of the feature, thus we use it for descriptive purposes. The optical depth is derived from the following formula as usual.
where is the observed surface brightness at H2O band and is the estimated continuum surface brightness interpolated by power-law using K and L’ brightness as shown below.
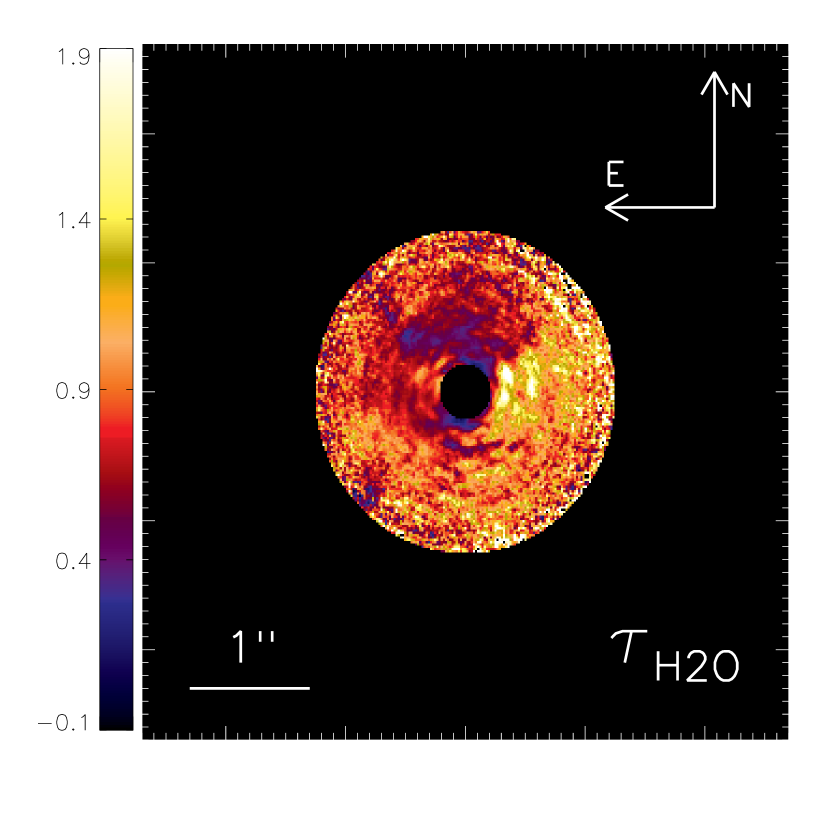
where and are the observed surface brightness at K and L’ filters, respectively, while ,, and are the central wavelengths of K, H2O and L’ filters, respectively. As the ice absorption depth becomes deeper, the optical depth value becomes larger. We derived the at each extracted disk regions, and these values ranged from 0 to 2. The map is shown in Fig.4. In this figure, the central region (0.22”) is masked due to the saturation problem and outer region (r1.26”) is also masked because of the low signal to noise ratio. In general, south-western(SW) region shows relatively high value (), which coincides with the dark-lane seen in L’ disk image. This can be qualitatively understood that some scattered light of this region may come from the backside of the disk, which suffers more extinction than that from the frontside of the disk. Other than the SW region, a possible trend could be recognized that the inner region shows lower optical depth () which might imply the decrease of the ice grains toward the central star as expected, although the patchy structure in the map hampers us to make a solid conclusion.
Since the map shows significant asymmetry along the disk minor axis (SW-NE) and scattered light intensity depends on the scattering geometry, discussion on the scattered light spectra along the disk minor axis is more complicated than that along the disk major axis (SE-NW). Thus we focus on a comparison with the model along the disk major axis. The radial distributions of along with the disk major axis are summarized in Table2 and shown in Fig.5. As already described, the error is dominated by systematic error, not the statistical one, and is estimated 20% of the surface brightness at each wavebands.
4.2. Comparison with the disk model including photodesorption effect
To discuss whether the observed absorption feature is consistent with the model predictions, we derived the expected value based on the disk model calculations by Oka et al. (2012) who included the effect of photodesorption of water ice grains by UV photons from the central star. Our calculation model consists of two parts: one is the disk structure calculation (Model Part 1) in which the density and temperature distributions in the disk, as well as the snow line, are obtained, and the other is the radiative transfer calculation (Model Part 2) that simulates observations.
In the Model Part 1, we obtain the location of the snow line, which is primarily determined by two reasons; the thermal sublimation and the photodesorption of water ice particles. In order to evaluate the thermal sublimation of ice particles, we obtain the temperature and the gas density distributions in the disk as follows. The temperature in the disk is determined by the energy balance between heating and cooling. Heating sources for the disk include the radiation from the central star illuminating the surface of the disk and the viscous heating due to the disk accretion. Cooling process is the radiative transfer, which finally emits energy from the disk to outer space by means of radiation. The surface density distribution is provided as a model parameter, and the gas density distribution along the vertical direction with respect to the disk is determined so that the hydrostatic equilibrium is achieved. The temperature in the disk and the shape of the disk surface affect each other, because the angle between the direction of the light from the central star and the disk surface determines the radiative energy received by the disk surface, and the inclination of the disk surface is a function of the temperature distribution. Thus, the temperature distribution and the gas density distribution, which is related to the disk surface, should be calculated consistently. Using the temperature and the gas density, we can evaluate the vapor pressure and the saturated vapor pressure of water, which are used to determine the snow line. On the other hand, we calculate the radiative transfer of UV radiation from the central star to the disk and obtain the UV flux exposed to ice particles in the disk, which gives the photodesorption rate. Finally, we can see if ice particles can be present stably with the vapor pressure (contributing to the condensation), the saturated vapor pressure (contributing to the sublimation), and the photodesorption rate, and we obtain the location of the snow line in the disk.
For our calculations, we use physical parameters for HD 100546 given by Mulders et al. (2011), which are listed in Table 3. We adopt the mass fractions of silicate and water to the disk gas of 0.0043 and 0.0094, respectively Miyake & Nakagawa (1993). We also assume that they form spherical dust particles, that ice particles contain pure ice and silicate grains are composed of only silicate, that radii of dust particles range from 0.025 m to 2.5 m, and that their size distributions follow the power-law with the index of -3.5. Absorption and scattering coefficients of dust particles are given by Miyake & Nakagawa (1993).
To make a comparison with observation (Model Part 2), we carry out Monte Carlo radiative transfer calculations. Deviations of obtained results seen in Fig. 5 are caused by statistical errors intrinsically related to Monte Carlo simulations. In the calculations, we take into account the anisotropic scattering and polarization produced by dust particles. The scattering matrices of silicate and ice particles are obtained using the BHmie code by (Bohren & Huffman, 1983) with the complex refractive indices by Miyake & Nakagawa (1993).
The radial profiles of the of disk models with or without photodesorption along with the disk major axis are also shown in Fig.5. A model without photodesorption effect shows deeper water ice absorption feature (larger ) than the observations, while models with photodesorption effect show relatively shallow absorption (smaller ). This is due to the destruction of water ice grains at the disk surface via photodesorption by strong irradiation of UV photons from the central star (Oka et al., 2012). Although the observed values match with both disk models with/without photodesorption effect, the model with photo desorption effect seems slightly better match with the observations at least for NW region.
4.3. Future prospects
It would be interesting to note that the water vapor is reported to be depleted in the disk atmosphere of Herbig AeBe stars by the observations of water vapor lines (Fedele et al., 2011). A plausible explanation is due to photodissociation of water by UV photons in the disk atmosphere. Although photodissociation effect is not included in the model of Oka et al. (2012), they discussed that the photodesorption process is much important for the water ice stability, while photodissociation effect is crucial for water vapor destruction in the disk surface. In any cases, the UV photons seem to play important role on the survival of both water ice and gas in the disk surface around Herbig Ae/Be stars.
It is apparent that our data do not have a high signal-to-noise ratio enough to distinguish the models with/without photodesorption process. This is because the systematic error dominates over the total error. Further observations with better photometric accuracy are strongly desired. Since these observations shown here employed techniques similar to so-called ’lucky imaging’ technique, improvement of systematic error is principally limited. However, when we make use of the polarimetric differential imaging (PDI) and/or spectroscopy, the systematic error can be significantly reduced and it will change the situation dramatically. Thus the L-band PDI and/or spectroscopy is promising for the advance of this observations. Furthermore, other effects on the depth of water ice absorption, such as grain size, grain shape, grain structure, ice/rock ratio (abundance), dust settling, turbulent mixing, and so on, should be investigated in the future theoretical studies to comprehensively understand the water ice distribution in the protoplanetary disks.
References
- Fukagawa et al. (2006) Fukagawa, M., Tamura, M., Itoh, Y., Kudo, T., Imaeda, Y., Oasa, Y., Hayashi, S. S., & Hayashi, M. 2006, ApJ, 636, L153
- Honda et al. (2010) Honda, M., et al. 2010, ApJ, 718, L199
- Hayashi et al. (1985) Hayashi, C., Nakazawa, K., & Nakagawa, Y. 1985, Protostars and Planets II, 1100
- Brauer et al. (2008) Brauer, F., Henning, T., & Dullemond, C. P. 2008, A&A, 487, L1
- Morbidelli et al. (2000) Morbidelli, A., Chambers, J., Lunine, J. I., et al. 2000, Meteoritics and Planetary Science, 35, 1309
- Carr & Najita (2008) Carr, J. S., & Najita, J. R. 2008, Science, 319, 1504
- Salyk et al. (2008) Salyk, C., Pontoppidan, K. M., Blake, G. A., et al. 2008, ApJ, 676, L49
- Malfait et al. (1999) Malfait, K., Waelkens, C., Bouwman, J., de Koter, A., & Waters, L. B. F. M. 1999, A&A, 345, 181
- Meeus et al. (2001) Meeus, G., Waters, L. B. F. M., Bouwman, J., et al. 2001, A&A, 365, 476
- Pontoppidan et al. (2005) Pontoppidan, K. M., Dullemond, C. P., van Dishoeck, E. F., et al. 2005, ApJ, 622, 463
- Terada et al. (2007) Terada, H., Tokunaga, A. T., Kobayashi, N., et al. 2007, ApJ, 667, 303
- Inoue et al. (2008) Inoue, A. K., Honda, M., Nakamoto, T., & Oka, A. 2008, PASJ, 60, 557
- Oka et al. (2012) Oka, A., Inoue, A. K., Nakamoto, T., & Honda, M. 2012, ApJ, 747, 138
- Honda et al. (2009) Honda, M., Inoue, A. K., Fukagawa, M., et al. 2009, ApJ, 690, L110
- Chun et al. (2008) Chun, M., Toomey, D., Wahhaj, Z., et al. 2008, Proc. SPIE, 7015, 70151V
- Allen & Cragg (1983) Allen, D. A., & Cragg, T. A. 1983, MNRAS, 203, 777
- Carter & Meadows (1995) Carter, B. S., & Meadows, V. S. 1995, MNRAS, 276, 734
- van Boekel et al. (2005) van Boekel, R., Min, M., Waters, L. B. F. M., et al. 2005, A&A, 437, 189
- Quanz et al. (2011) Quanz, S. P., Schmid, H. M., Geissler, K., et al. 2011, ApJ, 738, 23
- Mulders et al. (2013) Mulders, G. D., Min, M., Dominik, C., Debes, J. H., & Schneider, G. 2013, A&A, 549, AA112
- Mulders et al. (2011) Mulders, G. D., Waters, L. B. F. M., Dominik, C., et al. 2011, A&A, 531, AA93
- Soubiran et al. (2010) Soubiran, C., Le Campion, J.-F., Cayrel de Strobel, G., & Caillo, A. 2010, A&A, 515, AA111
- Currie et al. (2014) Currie, T., Muto, T., Kudo, T., et al. 2014, ApJ, 796, LL30
- Miyake & Nakagawa (1993) Miyake, K., & Nakagawa, Y. 1993, Icarus, 106, 20
- Bohren & Huffman (1983) Bohren, C. F., & Huffman, D. R. 1983, New York: Wiley, 1983,
- Avenhaus et al. (2014) Avenhaus, H., Quanz, S. P., Meyer, M. R., et al. 2014, ApJ, 790, 56
- Fedele et al. (2011) Fedele, D., Pascucci, I., Brittain, S., et al. 2011, ApJ, 732, 106
- Zhang et al. (2013) Zhang, K., Pontoppidan, K. M., Salyk, C., & Blake, G. A. 2013, ApJ, 766, 82
- Quanz et al. (2013) Quanz, S. P., Amara, A., Meyer, M. R., et al. 2013, ApJ, 766, LL1
| object | filter | Integ. time [s] | comment |
|---|---|---|---|
| HD100546 | K | 1672 | |
| HR4977 | K | 456 | PSF reference |
| HD105116 | K | 152 | photometric reference |
| HD100546 | H2O ice | 3192 | |
| HR4977 | H2O ice | 2280 | PSF reference |
| BS4638 | H2O ice | 152 | photometric reference |
| HD100546 | L’ | 2128 | |
| HR4977 | L’ | 532 | PSF reference |
| BS4638 | L’ | 152 | photometric reference |
| distance[AU] | **in mJy/arcsecond2 | **in mJy/arcsecond2 | **in mJy/arcsecond2 | |
|---|---|---|---|---|
| SE | ||||
| 104 | 17.53.5 | 10.02.0 | 39.07.8 | 1.060.39 |
| 87 | 31.36.3 | 18.43.7 | 6513 | 0.990.39 |
| 70 | 6012 | 35.37.1 | 11122 | 0.920.39 |
| 54 | 12625 | 7114 | 21042 | 0.900.39 |
| 37 | 30461 | 22345 | 48597 | 0.610.39 |
| NW | ||||
| 104 | 18.93.8 | 10.82.2 | 37.57.5 | 0.990.39 |
| 87 | 31.46.3 | 22.84.6 | 6313 | 0.76 0.39 |
| 70 | 5210 | 39.77.9 | 10922 | 0.74 0.39 |
| 54 | 10621 | 9218 | 21944 | 0.59 0.39 |
| 37 | 25050 | 23747 | 506100 | 0.50 0.39 |
| parameter | values |
|---|---|
| stellar effective temperature | 10500 K |
| stellar mass | 2.4 |
| stellar luminosity | 36 |
| stellar radius | 1.8 |
| distance d | 103 pc |
| disk inner radius | 0.5 AU |
| disk outer radius | 500. AU |
| disk inclination | 45∘ |
| surface density at 1AU | 45 g/cm2 |
| surface density power-law index q | 1 |