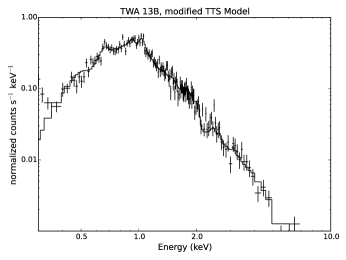
M Stars in the TW Hya Association:
Stellar X-rays and Disk Dissipation
Abstract
To investigate the potential connection between the intense X-ray emission from young, low-mass stars and the lifetimes of their circumstellar, planet-forming disks, we have compiled the X-ray luminosities () of M stars in the 8 Myr-old TW Hya Association (TWA) for which X-ray data are presently available. Our investigation includes analysis of archival Chandra data for the TWA binary systems TWA 8, 9, and 13. Although our study suffers from poor statistics for stars later than M3, we find a trend of decreasing with decreasing for TWA M stars wherein the earliest-type (M0–M2) stars cluster near and then decreases, and its distribution broadens, for types M4 and later. The fraction of TWA stars that display evidence for residual primordial disk material also sharply increases in this same (mid-M) spectral type regime. This apparent anticorrelation between the relative X-ray luminosities of low-mass TWA stars and the longevities of their circumstellar disks suggests that primordial disks orbiting early-type M stars in the TWA have dispersed rapidly as a consequence of their persistent large X-ray fluxes. Conversely, the disks orbiting the very lowest-mass pre-MS stars and pre-MS brown dwarfs in the Association may have survived because their X-ray luminosities and, hence, disk photoevaporation rates are very low to begin with, and then further decline relatively early in their pre-MS evolution.
1 Introduction
Thanks to their low luminosities and close-in habitable zones — i.e., the range of exoplanet orbital semimajor axes where water may exist in liquid form and, as a result, life may eventually flourish — the lowest-mass (M-type) stars represent the best targets for future direct (imaging) giant planet searches and indirect (transiting) discovery and characterization of potentially habitable exoplanets. It is hence essential to establish, on both theoretical and observational grounds, whether planets are expected to be common around M stars. Based on the data available thus far, giant planets seem to be rare around M dwarfs, but terrestrial planets and super-Earths may be quite common (e.g., Mulders et al., 2015a, b). Indeed, the occurrence rate of 1–4 planets around M dwarfs appears to be higher than that around solar-mass stars (Howard et al., 2012; Mulders et al., 2015a, b).
Meanwhile, the answer to the corresponding, fundamental theoretical questions — why should giant planets be rare and terrestrial planets common around M stars? — requires understanding the harsh conditions out of which such planets form. Low-mass, pre-main sequence (pre-MS) stars are characterized by intense high-energy radiation fields (e.g., Preibisch & Feigelson, 2005; Güdel et al., 2007). This strong UV and X-ray emission has its origins in a combination of stellar magnetic and accretion activity. As low-mass pre-MS stars descend to the main sequence, their deep convective envelopes combine with differential rotation to produce strong magnetic dynamos and, hence, high levels of chromospheric and coronal activity; the former is a source of bright UV emission, while the latter generates strong X-ray emission (e.g., Stelzer et al., 2013, and refs. therein). In the case of T Tauri stars that are actively accreting from circumstellar disks, shocks at the bases of accretion columns can also significantly contribute to UV and soft X-ray emission (Günther et al., 2007; Sacco et al., 2010).
The resulting irradiation of protoplanetary disks by high-energy stellar photons likely regulates exoplanet formation and evolution processes. Various theoretical studies have shown that EUV and X-ray radiation from young stars can drive disk dissipation and disk chemistry, thereby determining the timescale over which, and the conditions out of which, exoplanets and their atmospheres emerge (e.g., Gorti et al., 2009; Ercolano et al., 2009; Glassgold et al., 2012; Owen et al., 2012; Walsh et al., 2012; Cleeves et al., 2013; Gorti et al., 2015). In particular, the EUV and soft (1 keV) X-ray radiation field of the central star should be a major source of disk surface heating and, as a result, potentially represents an important driver of slow, photoevaporative disk winds (Gorti et al., 2009; Ercolano et al., 2009; Owen et al., 2012). There is observational evidence for the presence of such stellar EUV/X-ray-generated photoevaporative disk winds in the case of relatively evolved pre-main sequence stars of roughly solar mass (Pascucci & Sterzik, 2009; Sacco et al., 2012; Clarke & Owen, 2015). Whether protoplanetary disks orbiting ultra-low-mass stars and brown dwarfs are similarly irradiated and actively photoevaporating remains to be determined (see, e.g., Pascucci et al., 2013).
To improve our understanding of the potential effects of X-rays on planet formation in disks orbiting M stars, we must characterize the X-ray emission properties of the lowest-mass (mid- to late-type M type) pre-MS stars of age 3 Myr, i.e., the epoch during or just after giant planet building and just preceding terrestrial planet building. The TW Hya Association (TWA; Kastner et al., 1997; Webb et al., 1999) affords just such an opportunity, thanks to its mean distance of just 50 pc and age 8 Myr (Torres et al., 2008; Ducourant et al., 2014; Herczeg & Hillenbrand, 2015, and refs. therein). Here, we present an analysis of all published and archival X-ray observations of M-type stars in the TWA in light of the presence or absence of evidence for gas and dust in circumstellar disks around these same stars, so as to further constrain the potential relationship between X-rays and disk dispersal.
2 TW Hya Association M stars: X-ray luminosities and disk detection rates
| ID | sp. typea | b | c | mid-IR excessd | |
|---|---|---|---|---|---|
| (pc) | (mag) | ( erg s-1) | |||
| TWA 6 | M0 | 51 | 8.87 | 4.72 | N |
| TWA 25 | M0.5 | 51 | 8.17 | 9.04 | N |
| TWA 14 | M0.5 | 113 | 9.42 | 13.8 | N |
| TWA 13A | M1 | 55 | 8.43 | 7.86 | N |
| TWA 13B | M1 | 55 | 8.43 | 7.88 | N |
| TWA 16 | M1 | 65 | 8.99 | 6.54 | N |
| TWA 21 | M1 | 50 | 7.87 | 11.1 | N |
| TWA 23 | M1 | 48 | 8.62 | 5.12 | N |
| TWA 5A | M1.5+M2 | 49 | 7.67 | 11.8 | N |
| TWA 2AB | M2+M2 | 42 | 7.63 | 8.91 | N |
| TWA 10 | M2 | 62 | 9.12 | 4.92 | N |
| TWA 11B | M2 | 67 | 9.15 | 5.68 | … |
| TWA 12 | M2 | 65 | 9.00 | 6.18 | N |
| TWA 7 | M3 | 35 | 7.79 | 5.08 | Y |
| TWA 8A | M3 | 43 | 8.34 | 4.73 | N |
| TWA 9B | M3 | 52 | 9.98 | 1.54 | N |
| TWA 15B | M3 | 113 | 10.49 | 4.56 | N |
| TWA 20 | M3 | 73 | 9.33 | 5.51 | N |
| TWA 3A | M3+M4 | 31 | 7.65 | 2.70 | Y |
| TWA 15A | M3.5 | 113 | 10.56 | 4.25 | N |
| TWA 3B | M4 | 31 | … | 1.68 | N |
| TWA 30B | M4 | 44 | 15.35 | 2.0 | Y |
| TWA 31 | M4.2 | 110 | 13.05 | 0.4 | Y |
| TWA 11C | M4.5 | 67 | 9.79 | 2.75 | N |
| TWA 8B | M5 | 39 | 9.84 | 0.83 | N |
| TWA 30A | M5 | 42 | 9.64 | 1.2 | Y |
| TWA 5B | M8 | 49 | 12.60 | 0.08 | … |
| TWA 27 | M8 | 53 | 13.00 | 0.12 | Y |
| TWA 28 | M8.5 | 55 | 13.03 | 0.075 | Y |
| TWA 26 | M9 | 38 | 12.69 | 0.09 | N |
a) Spectral types from Schneider et al. (2012), Manara et al. (2013), and Herczeg & Hillenbrand (2014); see text. b) Trigonometric parallax distances from Ducourant et al. (2014) where available; otherwise, distances from Schneider et al. (2012). c) Bolometric luminosities obtained from and spectral-type-dependent bolometric corrections listed in Pecaut & Mamajek (2013), except for TWA 30A and 30B ( from Principe et al. 2015 and refs. therein), TWA 5B ( from Tsuboi et al., 2003), TWA 27 ( from Gizis & Bharat, 2004), TWA 28 ( from Scholz et al., 2005), and TWA 26 ( from Castro et al., 2011). d) Mid-IR excess (or lack thereof) as determined from WISE data by Schneider et al. (2012) or in this study (see text). The presence of absence of mid-IR excess is unknown for TWA 5B and 11B due to proximity to the (far more mid-IR-luminous) primary stars in these systems.
The sample considered here (Table 1) consists of those high-probability M-type members of the TWA for which archival or published X-ray data from ROSAT (All-Sky Survey; RASS), Chandra, or XMM-Newton were available at the time this paper was written, based on a search of the HEASARC browse search utility111https://heasarc.gsfc.nasa.gov/cgi-bin/W3Browse/w3browse.pl and the literature. Appendix A contains notes concerning the sample’s inclusion and exclusion of specific TWA members and candidate members. For each sample star, we list in Table 1 the spectral type and distance we have adopted from the literature, as well as 2MASS magnitude and bolometric luminosity . For known binaries that are unresolved in the available X-ray data (TWA 2AB, 3A, and 5A), we list composite spectral types and total values. The listed spectral types are obtained from Schneider et al. (2012, and refs. therein), Manara et al. (2013), and Herczeg & Hillenbrand (2014). The spectral types of TWA 14 (M0.5), TWA 13AB (both M1), TWA 2A (M2), TWA 8A (M3) and TWA 8B (M5) listed in Schneider et al. (2012) were confirmed in one or both of the Manara et al. (2013) and Herczeg & Hillenbrand (2014) studies, while one or both of these studies determined later spectral types for TWA 7 (M3), TWA 9B (M3), TWA 15A (M3.5), TWA 15B (M3), and TWA 25 (M0.5). We adopt these revised classifications here.
Except where noted, the values were obtained from the listed spectral types, stellar distances, and band data based on the (spectral-type-dependent) band bolometric corrections determined by Pecaut & Mamajek (2013), assuming no reddening.
2.1 X-ray luminosities
| ID | sp. type | , 0.3–8.0 keV ( erg s-1) | Notes | ||||
| ROSAT | XMM | Chandra | adopted | ||||
| (1) | (2) | (3) | (4) | (5) | (6) | (7) | (8) |
| TWA 6 | M0 | 5.4 | … | 10.3 | 10.3 | ||
| TWA 25 | M0.5 | 11.3 | … | … | 11.3 | ||
| TWA 14 | M0.5 | 10.8 | … | … | 10.8 | ||
| TWA 13A | M1 | (2.3) | (5.1) | 10.7 | 9.2 | 1 | |
| TWA 13B | M1 | (2.3) | (5.1) | 12.9 | 11.1 | 1 | |
| TWA 16 | M1 | 3.2 | … | … | 3.2 | ||
| TWA 21 | M1 | 5.9 | 6.1 | … | 6.1 | ||
| TWA 23 | M1 | 2.5 | … | … | 2.5 | ||
| TWA 5A | M1.5+M2 | 12.0 | 7.0 | 9.4 | 6.5 | 2 | |
| TWA 2AB | M2+M2 | 4.5 | … | … | 2.1 | 3 | |
| TWA 10 | M2 | 3.2 | 6.0 | … | 6.0 | ||
| TWA 11B | M2 | … | … | … | 4.5 | 4 | |
| TWA 12 | M2 | 3.5 | 8.5 | … | 8.5 | ||
| TWA 7 | M3 | 2.7 | 3.3 | 7.2 | 4.7 | 5 | |
| TWA 8A | M3 | (1.9) | … | … | 6.3 | 1 | |
| TWA 9B | M3 | (3.3) | … | … | 0.64 | 1 | |
| TWA 20 | M3 | 2.7 | … | … | 2.7 | ||
| TWA 15AB | M3+M3.5 | 1.3 | … | … | 1.3 | ||
| TWA 3A | M3+M4 | (1.0) | … | … | 1.0 | 6 | |
| TWA 3B | M4 | (1.0) | … | … | 2.0 | 6 | |
| TWA 30B | M4 | … | … | … | 0.030 | -4.8 | 7 |
| TWA 31 | M4.2 | … | 0.034 | … | 0.034 | -4.1 | |
| TWA 11C | M4.5 | … | … | … | 1.2 | 8 | |
| TWA 8B | M5 | (1.9) | … | … | 0.46 | 1 | |
| TWA 30A | M5 | 1.4 | … | … | 0.12 | 7 | |
| TWA 5B | M8 | … | … | … | 0.03 | 9 | |
| TWA 27 | M8 | … | … | … | 0.0012 | -5.1 | 10 |
| TWA 28 | M8.5 | … | … | … | 0.0053 | -4.1 | 11 |
| TWA 26 | M9 | … | … | … | 0.0014 | 12 | |
1) Binary unresolved by ROSAT and XMM. Adopted component values determined from the analysis of Chandra data described in Appendix B. 2) Adopted determined from Chandra data (Tsuboi et al., 2003). 3) Adopted determined from Swift data (Brown et al., 2015). 4) Adopted determined from Chandra serendipitous observation (D. Huenemoerder, pvt. comm.). 5) Adopted determined from Chandra data (Brown et al., 2015). 6) Binary unresolved by ROSAT; adopted component values determined from Chandra data (Huenemoerder et al., 2007). 7) Adopted determined from XMM data (Principe et al. 2015, and refs. therein). 8) Adopted determined from XMM data (Kastner et al., 2008). 9) Adopted determined from Chandra data (Tsuboi et al., 2003). 10) Adopted determined from Chandra data (Gizis & Bharat, 2004). 11) Adopted limit on determined from XMM-Newton data (Stelzer et al., 2007). 12) Adopted determined from Chandra data (Castro et al., 2011).
Table 2 lists X-ray luminosities () for the sample stars. The values of in columns 3, 4 and 5 of Table 2 are all calculated over the energy range 0.3–8.0 keV from available archival (HEASARC database) ROSAT All-sky Survey (RASS), XMM-Newton, and Chandra count rates, respectively, as described below. Note that whereas X-ray count rates (hence values) are available for all but one of the early-M (M0 to M2) TWA members from the RASS, only a few TWA stars of type M3 or later were detected in the RASS, as a consequence of its limited sensitivity. We hence do not consider RASS count rate upper limits in the present study, as these upper limits do not place meaningful constraints on for young mid- to late-M stars at the distance of the TWA (Rodriguez et al., 2013).
To obtain the values of in columns 3–5, we converted the count rates to 0.3–8.0 keV X-ray fluxes () via the webpimms tool222https://heasarc.gsfc.nasa.gov/cgi-bin/Tools/w3pimms/w3pimms.pl, which accounts for the different energy sensitivities of the three missions (the Chandra and XMM-Newton X-ray Observatories and their back-illuminated CCD sensors cover the entire 0.3–8.0 keV range, whereas the Position Sensitive Proportional Counter aboard ROSAT was sensitive in the range 0.1-2.0 keV). We assumed a single-component absorbed thermal plasma model whose parameters are characteristic plasma temperature (), metallicity relative to solar, and intervening absorbing column (). We adopted parameter values of keV ( MK), cm-2, and a metallicity of 0.2. These choices for parameter values are based on the results of model fitting to the XMM-Newton spectra of TWA 11B (Kastner et al., 2008, and refs. therein) and TWA 30A (Principe et al., 2016), as well as the results of Chandra X-ray spectral fitting presented in Appendix B for the individual components of the binary systems TWA 8AB, 9AB, and 13AB. For these model parameter values, the count rate to conversion factors are , , and erg cm-2 count-1 for ROSAT, XMM-Newton, and Chandra, respectively. For binaries that are unresolved by ROSAT (TWA 3AB, 8AB, 9AB, and 13AB), we have split the ROSAT-based (column 3) equally between components. We then calculated from the values of , assuming the distances listed in Table 1.
It is evident from Table 2 that all of the stars for which data is available from multiple observatories (i.e., multiple epochs) show variability at the level of a factor 2–3, as is typical for low-mass pre-MS stars (e.g., Güdel et al., 2007; Principe et al., 2014). The most extreme case in Table 2 is the M5 star TWA 30A, which displayed at least a factor 10 change (decrease) in between the (1990) RASS and (2011) XMM-Newton observing epochs (Principe et al., 2016).
In columns 6 and 7 of the Table we list the values of and , respectively, that we have adopted for the analysis described in §3. Wherever possible, these adopted values of were obtained from analyses of Chandra or XMM-Newton spectra. Specifically, for the binary systems TWA 8, 9, and 13, the values were determined from our analysis of archival Chandra data (Appendix B), while for the stars TWA 5A, 5B, 7, 11C, 26, 27, 28, 30A, and 30B, the adopted values in column 6 were obtained from the literature (see references listed in column 8 of Table 2). In adopting a value of for each star, Chandra results have been given priority, since Chandra most reliably resolves the X-ray counterparts to TWA binary systems. In cases where both XMM-Newton and RASS observations (but no Chandra data) are available, we adopt the XMM-based . Comparing the values of calculated for TWA 5A, 7, 13A and 13B based on the single-component webpimms model (column 5) with values obtained from spectral modeling of the same (Chandra) data (column 6), it appears that our use of the webpimms model may systematically overestimate by 30%. This potential level of systematic error does not affect the results described in §3.
2.2 Presence or absence of circumstellar disks
In the last column of Table 1 we indicate whether each sample star displays a mid-infrared excess indicative of the presence of warm ( 100–300 K) dust in a circumstellar disk. These assessments of the presence of absence of dusty disks are drawn from the analysis of WISE data by Schneider et al. (2012), with the exception of TWA 14, 15AB, and 21 (which were omitted from their sample; see Appendix A). The WISE point source catalog colors of these three stars are 0.25, 0.20, and 0.08, respectively (where the TWA 15AB binary is unresolved by WISE), all of which lie well within the locus of TWA star colors for stars that lack IR excesses (Schneider et al., 2012). The mid-IR excess stars TWA 3A, 7, 30A, 30B, and 31 also display relatively strong far-IR fluxes (Riviere-Marichalar et al., 2013; Liu et al., 2015). Reanalysis of archival HST imaging has yielded a direct detection of the TWA 7 dust disk via scattered starlight; TWA 25 also displays a compact, nearly edge-on dust disk in HST imaging despite its lack of detectable mid-IR excess (Choquet et al., 2015).
Of the seven Table 1 stars that display mid-IR excesses, all but one (TWA 7; Manara et al., 2013) also show evidence for active accretion of gas from their disks in the form of unusually strong, broad H emission (see §3.2 and Muzerolle et al., 2000; Stelzer et al., 2007; Looper et al., 2010a; Shkolnik et al., 2011). The variable, weak accretors TWA 27 and 28 also display He i line emission (Herczeg et al., 2009). In the case of the 1.4′′ separation binary TWA 3AB, Chandra X-ray spectroscopy (and large UV excess) also indicate the presence of accretion shocks in this system, with the X-ray signature of accretion more evident at the dusty binary component (TWA 3A; Huenemoerder et al., 2007). But the most extreme examples of gas-rich disks among the TWA M stars with mid-IR excesses are the two components of the wide binary TWA 30A and 30B. These star/disk systems, both of which are evidently viewed nearly edge-on, display evidence for the presence of circumstellar gas in the form of forbidden emission lines detected via optical spectroscopy (Looper et al., 2010a) and, in the case of TWA 30A, in the form of attenuation of stellar X-rays (Principe et al., 2016). The relatively weak H emission seen toward TWA 30A and 30B (emission-line equivalent widths Å) can be ascribed to their viewing geometry, which in each case at least partially obscures the regions of active accretion onto the star (Looper et al., 2010a, b). Furthermore, during a photometric monitoring campaign, TWA 30A was seen to display quasi-periodic dips in its multi-band optical and near-IR lightcurves, bolstering the Looper et al. (2010b) model invoking disk structures that rotate in and out of the line of sight, temporarily obscuring the star (Stelzer et al., 2015).
Knowledge of the presence or absence of cold ( K) circumstellar dust and gas is scant for the Table 1 stars. Only three of these stars — TWA 30A, 30B, and 31 — have been the subject of sensitive mm- and submm-wave continuum and CO observations (with the Atacama Large Millimeter Array; Rodriguez et al., 2015). All three display mid- to far-IR excesses indicative of warm dust (Schneider et al., 2012; Liu et al., 2015). However, only TWA 30B was detected as a submm continuum source, and none of the three were detected as CO sources, in the Rodriguez et al. (2015) ALMA survey of ultra-low-mass members and candidate members of the TWA. The CO nondetections imply the gas disks orbiting these three stars have very low masses and/or small radii (0.1 Earth masses and/or 10 AU, respectively; Rodriguez et al., 2015).
2.3 Trends in X-ray luminosity and disk fraction
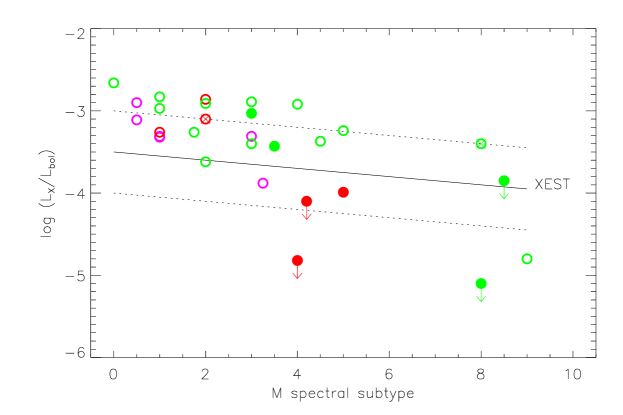
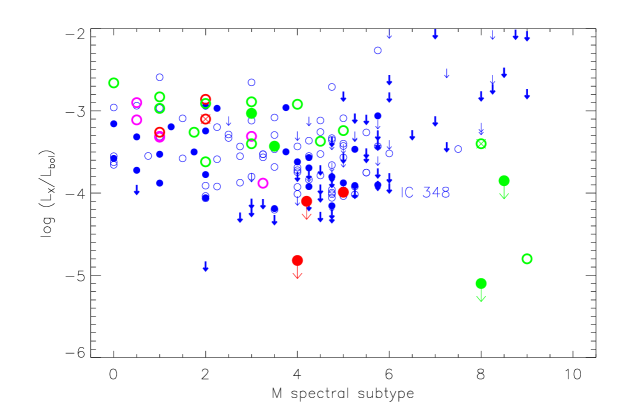
In Fig. 1, we plot the log of the ratio as a function of M spectral subtype for the TWA M stars. A trend is apparent, in which the earliest-type (M0–M2) stars cluster near , and then decreases, and its distribution broadens, for spectral types M4 and later. As Fig. 1 demonstrates, such a trend of decreasing with M subtype is also apparent for the younger pre-MS M stars in the Taurus molecular clouds (median age 0.5 Myr; Grosso et al., 2007) and for M stars in the young cluster IC 348 (age 3 Myr; Stelzer et al., 2012). The decline of with decreasing M star effective temperature appears to be somewhat steeper in the TWA than in Taurus, and is similar to IC 348 in the range M0–M5. The ratios of early-M TWA stars appear to be systematically larger than those of their counterparts in Taurus and IC 348 (but see below).
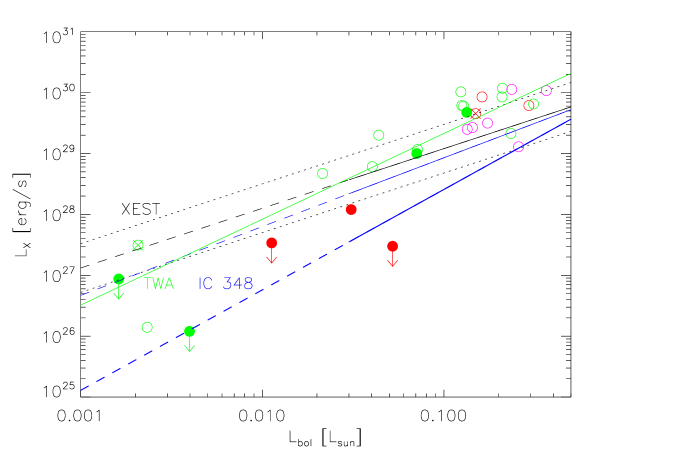
In Fig. 2, we plot vs. for the TWA M stars, and overlay the empirical relationships determined for pre-MS low-mass stars and brown dwarf candidates in Taurus (Grosso et al., 2007) and IC 348 (Stelzer et al., 2012). As was also clear in Fig. 1 (top panel), it seems that the more luminous early-M type TWA stars (i.e., those with ) are overluminous in X-rays, relative to Taurus TTS in this same range of bolometric luminosity. The mid- to late-M type (lowest-luminosity) TWA stars (those with ) also appear underluminous in X-rays relative to their Taurus counterparts, although the comparison in this range suffers both from the small number statistics of our TWA sample and a lack of X-ray detections for the Taurus sample (Grosso et al., 2007).
The latter caveat notwithstanding, we find the slope of vs. for the X-ray-detected TWA M stars, , is significantly steeper than that determined for the 0.5 Myr-old M stars in Taurus (0.980.06 for X-ray-detected stars; Grosso et al., 2007), and that the zero- intercept for the TWA sample, , is larger than found for Taurus (; Grosso et al., 2007). The latter comparison may reflect the fact that there are no known examples of actively accreting stars in the TWA in the M0–M2 spectral type range (see below and §3.1). Indeed, the X-ray luminosities of early-type M stars in the TWA are similar to those of Class III (diskless) early-M stars in IC 348 (Fig. 1, bottom panel). As illustrated in Fig. 2, the slope of vs. we find for the TWA — which includes stars with and without disks, and spans the range 0.015…0.3 — is intermediate between the slopes determined for Class II and Class III pre-MS stars in IC 348 in the range 0.03…3.0 , i.e., 1.130.11 and 1.650.22, respectively (where these determinations take into account upper limits on ; Stelzer et al., 2012).
The overall disk fraction among M-type TWA members with available X-ray data (Table 1) is 25% (7 of 28, excluding the two stars for which the presence or absence of disks cannot be established due to the proximity of IR-bright companions). This disk fraction is similar to but somewhat smaller than that inferred for TWA members overall (Schneider et al., 2012). However, Figs. 1 and 2 also make apparent that the fraction of TWA M stars with evidence for circumstellar disks increases as stellar mass decreases. Specifically, 6 of 11 stars with spectral types M3.5 and later (50%) have detectable warm circumstellar dust. All 6 of these stars also display evidence for circumstellar gas (§2.2). In contrast, the disk fraction among stars of type M3 and earlier drops to 5%, i.e., one in 17, with the lone exception being the debris disk orbiting the M3 star TWA 7. The apparent jump in disk fraction hence occurs very near the same (M3/M4) spectral type boundary where appears to decline (Fig. 1). Schneider et al. (2012) noted a similar trend in which candidate substellar members of the TWA are more likely to display evidence for disks than are stellar members.
3 Discussion
3.1 Implications for the early evolution of X-ray emission in M stars
The comparison of the and distributions of the TWA M stars with the corresponding distributions for the much younger pre-MS M stars in Taurus (Figs. 1, 2) suggests that over the first 8 Myr of the lifetime of an early-M pre-MS star — an epoch during which is monotonically decreasing — coronal X-ray luminosity remains roughly constant or perhaps even increases. In contrast, based on the sparse data presently available for mid- to late-M stars in the TWA, it appears that X-ray luminosity has decreased at least as fast as — and, in at least some cases, much faster than — bolometric luminosity for these stars (Fig. 1). It is possible that gas in the disks orbiting the mid- to late-type M type TWA stars is attenuating their X-ray emission. However, such an explanation for the smaller values of observed for these stars appears unlikely, since the majority of the TWA M stars with disks do not show evidence for extinction of their photospheres by disk dust — the notable exceptions being TWA 30A and 30B (Looper et al., 2010a, b; Principe et al., 2016; Stelzer et al., 2015).
The X-ray data presently available for the TWA, in combination with similar studies for Orion, Taurus, and IC 348 (Preibisch et al., 2005; Grosso et al., 2007; Stelzer et al., 2012), thereby potentially shed further light on the age at which coronal activity declines for stellar masses near the main sequence H-burning limit of 0.08 . Such a decline is apparent when comparing the X-ray luminosities of very young (age 1 Myr) ultra-low-mass stars and brown dwarfs with those of (old) late-M and L-type field stars. Specifically, X-ray-detected pre-MS brown dwarf candidates in Orion and Taurus have typical X-ray luminosities erg s-1 (Preibisch et al., 2005; Grosso et al., 2007), whereas erg s-1 for ultra-low-mass stars and brown dwarfs in the field (e.g., Stelzer et al., 2006; Williams et al., 2014, and refs. therein).
We note that the spectral type boundary where the (8 Myr-old) TWA stars appear to display a decline in — i.e., near M4 — approximately corresponds to the dividing line between pre-MS stars that will and will not undergo core H burning once on the main sequence, according to evolutionary models (e.g., D’Antona & Mazzitelli, 1997). However, this is likely just a coincidence. In very low mass field stars (with ages of order Gyr), a drop in magnetic activity is observed around M8 (e.g., West et al., 2004; Berger, 2006; Stelzer et al., 2006; Berger et al., 2010), i.e., at an effective temperature well above the H-burning limit. The likely cause of this decrease of X-ray (and H) activity is the low level of ionization within the cool atmospheres of the latest-type M stars (e.g., Mohanty et al., 2002).
The same (low ionization) effect also might play a role in the coolest (i.e., M8–M9) objects among our TWA sample, but would not explain the apparent low X-ray activity levels of three of the six mid-M stars (TWA 30A, 30B, and 31; Table 2). In that regard, it is interesting that all three of these stars are actively accreting from their dusty disks (§ 2.3). The apparent bifurcation of in this spectral type range that is hinted at by Fig. 1 may therefore reflect the suppression of coronal X-ray emission by accretion. Alternatively, the internal (e.g., convective and/or rotational) structures of young, ultra-low-mass stars may differ fundamentally from those of higher-mass young stars (see discussion in Stelzer et al., 2012, and refs. therein). X-ray observations of additional mid- to late-type M stars of age 10 Myr, combined with spectroscopic diagnostics of mass accretion rates, will be necessary to distinguish between these different scenarios for the apparent overall drop in for such stars at this age.
3.2 Implications for disk dispersal via photoevaporation
It is difficult to establish whether the dust responsible for the mid-IR excesses associated with M stars in the TWA resides in primordial (gas-rich) disks or (gas-poor) debris disks. Due to their small radial extent and low masses, the gaseous constituents of these disks are exceedingly difficult to detect in (sub)mm-wave molecular line emission. Indeed, as noted in §2.2, gas has been detected in the disks orbiting TWA 30A and 30B in the form of optical forbidden-line emission from disk winds and jets (Looper et al., 2010b, a) as well as X-ray absorption by the (nearly edge-on) TWA 30A disk itself (Principe et al., 2016); however, a sensitive search for CO in these same disks with ALMA yielded negative results (Rodriguez et al., 2015).
Nonetheless, there is reason to conclude that almost all of the TWA M stars with mid-IR excesses due to warm dust in fact host primordial disks that, given the 8 Myr age of the TWA, are highly evolved and in the process of dispersing. Specifically, a majority of these stars display H emission indicative of active accretion of disk gas (Table 3) and [O i] 6300 emission indicative of residual disk gas that is either orbiting or flowing out in a disk wind or jets. The components of the TWA 30 binary represent extreme cases in terms of [O i] equivalent width (Looper et al., 2010a), but [O i] emission has also been detected from TWA 3A, 27, and 28 (Herczeg et al., 2009). Among the TWA M stars with mid-IR excesses, only TWA 7 appears to harbor a gas-poor debris disk (Riviere-Marichalar et al., 2013; Choquet et al., 2015).
If most of the disks orbiting M stars in the TWA are indeed primordial, then the anticorrelation between X-ray luminosity and disk frequency noted in §2.3 (and apparent in Figs. 1, 2) may have implications for models describing how high-energy photons from low-mass stars can play a central role in driving disk dispersal via photoevaporation (Gorti et al., 2009; Ercolano et al., 2009; Ercolano & Owen, 2010; Owen et al., 2012; Gorti et al., 2015, and refs. therein). Specifically, models formulated by Owen et al. (2012, and refs. therein) predict that the rate of stellar-X-ray-induced disk gas photoevaporation is directly proportional to the stellar X-ray luminosity ,
| (1) |
where is X-ray luminosity integrated over the energy range 0.1–10 keV in units of erg s-1 assuming a relatively hard stellar X-ray spectral energy distribution (see below).
Eq. 1 predicts that, given their present X-ray luminosities (; Fig. 2), yr-1 for early-M stars in the TWA. The predicted present-day photoevaporative mass loss rates for stars of type M4 and later, for which , are at least an order of magnitude smaller. Viewed in this context, the results in Figs. 1, 2 could be taken to suggest that primordial disks orbiting early-type M stars have dispersed rapidly as a consequence of their persistent large X-ray fluxes, while disks orbiting the very lowest-mass pre-MS stars and pre-MS brown dwarfs can survive to ages 10 Myr because their X-ray luminosities — and, hence, disk photoevaporation rates — are very low to begin with, and then further decline relatively early in their pre-MS evolution. Such an interpretation of Fig. 2 would be consistent with the suggestion that the well-established anticorrelation of and accretion rate in T Tauri stars (e.g., Stelzer et al., 2012, and refs. therein) is indicative of “photoevaporation-starved T Tauri accretion” (Drake et al., 2009).
This simple interpretation is subject to several caveats. First, it requires that the values of (hence ) presently measured for TWA M stars are, at least in relative terms, representative of these values over most of the lifetime of the TWA. The comparisons with pre-MS M stars in Taurus (age 1 Myr) and IC 348 (age 3 Myr) presented in Figs. 1, 2 and discussed in §2.3 would appear to support such an assertion.
Second, because soft photons dominate the disk surface heating, Eq. 1 would yield inaccurate estimates of for those stars whose X-ray spectral energy distributions (SEDs) differ significantly from the irradiating spectrum assumed in the Owen et al. (2012) models. This model X-ray spectrum spans a range of plasma temperatures, peaking at . It is hence somewhat harder than the observed X-ray spectral distributions of TWA M stars (see §2.2 and Appendix B). If so, the predicted mass loss rates obtained via Eq. 1 would be systematically underestimated. On the other hand, the X-ray spectral fitting results obtained for the three TWA M star binaries analyzed here (see Appendix B) hint at the likelihood that is correlated with stellar mass (see also Johnstone & Güdel, 2015), and that the plasma emission model adopted by Owen et al. (2012) more closely resembles the plasma parameters that are characteristic of early-M stars. If so, then Eq. 1 would be most directly applicable to these (higher-mass) M stars, but would tend to underestimate for mid- to late-M stars.
| Observed | Predicted | |||
| Object | (H)a | b | c | |
| (km s-1) | ( yr-1) | (erg s) | ( yr-1) | |
| TWA 3A | 250 | , | 29.0 | |
| TWA 30B | 200 | |||
| TWA 31 | 447 | |||
| TWA 30A | 230 | 28.0 | ||
| TWA 27 | 170, 320 | , | ||
| TWA 28 | 194 | |||
Notes:
a) (Range of) width of H emission line at 10% of peak,
obtained from Muzerolle et al. (2000); Stelzer et al. (2007); Looper et al. (2010b, a); Shkolnik et al. (2011).
b) (Range of) inferred mass accretion rates, obtained from
Muzerolle et al. (2000); Stelzer et al. (2007); Herczeg et al. (2009); Shkolnik et al. (2011). Accretion rates for TWA 30A, 30B, 31 obtained from (H) using Eq. 1 in Natta et al. (2004).
c) Photoevaporative disk mass loss rate predicted from Eq. 1 given
stellar .
Third, comparison of the theoretically predicted disk mass loss rates and mass loss timescales for accretion vs. EUV- and X-ray-driven photoevaporation indicates that photoevaporation should only become the dominant disk gas dispersal mechanism very late in disk evolution, after the bulk of the initial disk mass has already been lost via accretion (Owen et al., 2012; Gorti et al., 2015, and references therein). As a preliminary evaluation of the relative importance of accretion vs. photoevaporation for the TWA stars that appear to retain residual gaseous disks, we compare in Table 3 mass accretion diagnostics (i.e., the 10% width of H emission) and inferred mass accretion rates () with predicted values of (or upper limits on) as obtained from Eq. 1. Based on the predictions for , it seems that the mass loss rate due to photoevaporation may equal or perhaps exceed that due to accretion in the cases of TWA 3A and 30A. In contrast, the inferred accretion rate of TWA 31 is at least two orders of magnitude larger than its predicted X-ray-driven photoevaporative mass loss rate. The comparisons of with for the remaining three stars, all of which are undetected in X-rays, are inconclusive.
4 Summary and Conclusions
To investigate the potential connection between the intense X-ray emission from young, low-mass stars and the lifetimes of their circumstellar, planet-forming disks, we have compiled a list of the X-ray luminosities () of all presently known M-type members of the 8 Myr-old TW Hya Association (TWA). The values of are mainly drawn from available archival data and published values in the recent literature. We have obtained for the individual components of the binary star systems TWA 8, 9, and 13 via analysis of archival Chandra data (Appendix B).
Although our study suffers from poor statistics for stars later than M3, we find a trend of decreasing with decreasing for TWA M stars wherein the earliest-type (M0–M2) stars cluster near and then decreases, and its distribution broadens, for types M4 and later. These mid- to late-M TWA stars generally appear underluminous in X-rays relative to very young pre-main sequence stars of similar spectral type and luminosity, consistent with previous studies indicating that mean declines more rapidly for ultra-low-mass stars and brown dwarfs than for early-M stars (e.g., Stelzer et al., 2012). This apparent decline of near a spectral type of M4, if real, may reflect either the suppression of coronal X-ray emission by accretion or a fundamental difference between the internal structures of ultra-low-mass pre-MS stars and earlier-type pre-MS M stars.
Notably, the fraction of TWA stars with evidence for residual primordial disk material also sharply increases for subtypes of M4 and later, i.e., near the stellar effective temperature where decreases. Furthermore, most of the newly discovered TWA candidates that are of late-M and L-type also display evidence for disks (Rodriguez et al., 2015). The extant data for the TWA hence suggest that disk survival times may be longer for ultra-low mass stars and brown dwarfs than for higher-mass (early-type) M stars — a result that would be consistent with studies of the Upper Sco region (age 10 Myr; Scholz et al., 2007; Luhman & Mamajek, 2012, and refs. therein). These observations have interesting implications for models of disk evolution, which generally predict that any dependence of disk lifetime on stellar mass should be very weak (e.g., Gorti et al., 2009; Owen et al., 2012).
The apparent anticorrelation between the X-ray luminosities of low-mass TWA stars and the longevities of their circumstellar disks (Figs. 1, 2) could be interpreted to indicate that the persistent large X-ray fluxes from early-type M stars in the Association have contributed to the rapid dispersal of their primordial disks. Conversely, disks orbiting the lowest-mass pre-MS stars and pre-MS brown dwarfs in the TWA may have survived because their relatively small X-ray luminosities have resulted in overall low disk photoevaporation rates.
In the specific cases of TWA 3A and 30A, we infer that the rate of mass loss due to X-ray-driven photoevaporation may exceed that due to accretion. The dominant role of photoevaporation in the dispersal of these disks, if confirmed, would be consistent with their advanced ages. However, the (X-ray-undetected) star TWA 31 appears to be accreting disk mass far more rapidly than it could be losing disk mass loss via photoevaporation.
X-ray observations of additional mid- to late-type M stars in the TWA (e.g., Rodriguez et al., 2015) and M-type members of similarly nearby young stellar groups, combined with acquisition of spectroscopic diagnostics of the disk gas masses and mass accretion rates of these same stars, are required to verify and further investigate the apparent coincidence of a dropoff of and increase in primordial disk fraction for ultra-low-mass stars and brown dwarfs at an age of 10 Myr. High-quality X-ray spectra of selected stars spanning the full range of M spectral types would also better inform photoevaporation models, by constraining the hardness of the X-ray radiation that is incident on protoplanetary disks orbiting the lowest-mass stars.
References
- Berger (2006) Berger, E. 2006, ApJ, 648, 629
- Berger et al. (2010) Berger, E., et al. 2010, ApJ, 709, 332
- Brown et al. (2015) Brown, A., Herczeg, G. J., Ayres, T. R., France, K., & Brown, J. M. 2015, in Cambridge Workshop on Cool Stars, Stellar Systems, and the Sun, Vol. 18, 18th Cambridge Workshop on Cool Stars, Stellar Systems, and the Sun, ed. G. T. van Belle & H. C. Harris, 203–208
- Castro et al. (2011) Castro, P. J., Gizis, J. E., & Gagné, M. 2011, ApJ, 736, 67
- Choquet et al. (2015) Choquet, É., et al. 2015, ArXiv e-prints
- Clarke & Owen (2015) Clarke, C. J., & Owen, J. E. 2015, MNRAS, 446, 2944
- Cleeves et al. (2013) Cleeves, L. I., Adams, F. C., & Bergin, E. A. 2013, ApJ, 772, 5
- D’Antona & Mazzitelli (1997) D’Antona, F., & Mazzitelli, I. 1997, Mem. Soc. Astron. Italiana, 68, 807
- Drake et al. (2009) Drake, J. J., Ercolano, B., Flaccomio, E., & Micela, G. 2009, ApJ, 699, L35
- Ducourant et al. (2014) Ducourant, C., Teixeira, R., Galli, P. A. B., Le Campion, J. F., Krone-Martins, A., Zuckerman, B., Chauvin, G., & Song, I. 2014, A&A, 563, A121
- Ercolano et al. (2009) Ercolano, B., Clarke, C. J., & Drake, J. J. 2009, ApJ, 699, 1639
- Ercolano & Owen (2010) Ercolano, B., & Owen, J. E. 2010, MNRAS, 406, 1553
- Gizis & Bharat (2004) Gizis, J. E., & Bharat, R. 2004, ApJ, 608, L113
- Glassgold et al. (2012) Glassgold, A. E., Galli, D., & Padovani, M. 2012, ApJ, 756, 157
- Gorti et al. (2009) Gorti, U., Dullemond, C. P., & Hollenbach, D. 2009, ApJ, 705, 1237
- Gorti et al. (2015) Gorti, U., Hollenbach, D., & Dullemond, C. P. 2015, ApJ, 804, 29
- Grosso et al. (2007) Grosso, N., et al. 2007, A&A, 468, 391
- Güdel et al. (2007) Güdel, M., et al. 2007, A&A, 468, 353
- Günther et al. (2007) Günther, H. M., Schmitt, J. H. M. M., Robrade, J., & Liefke, C. 2007, A&A, 466, 1111
- Herczeg et al. (2009) Herczeg, G. J., Cruz, K. L., & Hillenbrand, L. A. 2009, ApJ, 696, 1589
- Herczeg & Hillenbrand (2014) Herczeg, G. J., & Hillenbrand, L. A. 2014, ApJ, 786, 97
- Herczeg & Hillenbrand (2015) —. 2015, ApJ, 808, 23
- Howard et al. (2012) Howard, A. W., et al. 2012, ApJS, 201, 15
- Huenemoerder et al. (2007) Huenemoerder, D. P., Kastner, J. H., Testa, P., Schulz, N. S., & Weintraub, D. A. 2007, ApJ, 671, 592
- Johnstone & Güdel (2015) Johnstone, C. P., & Güdel, M. 2015, A&A, 578, A129
- Kastner et al. (2002) Kastner, J. H., Huenemoerder, D. P., Schulz, N. S., Canizares, C. R., & Weintraub, D. A. 2002, ApJ, 567, 434
- Kastner et al. (2008) Kastner, J. H., Zuckerman, B., & Bessell, M. 2008, A&A, 491, 829
- Kastner et al. (1997) Kastner, J. H., Zuckerman, B., Weintraub, D. A., & Forveille, T. 1997, Science, 277, 67
- Liu et al. (2015) Liu, Y., et al. 2015, A&A, 573, A63
- Looper et al. (2010a) Looper, D. L., Bochanski, J. J., Burgasser, A. J., Mohanty, S., Mamajek, E. E., Faherty, J. K., West, A. A., & Pitts, M. A. 2010a, AJ, 140, 1486
- Looper et al. (2010b) Looper, D. L., et al. 2010b, ApJ, 714, 45
- Luhman & Mamajek (2012) Luhman, K. L., & Mamajek, E. E. 2012, ApJ, 758, 31
- Mamajek (2005) Mamajek, E. E. 2005, ApJ, 634, 1385
- Manara et al. (2013) Manara, C. F., et al. 2013, A&A, 551, A107
- Mohanty et al. (2002) Mohanty, S., Basri, G., Shu, F., Allard, F., & Chabrier, G. 2002, ApJ, 571, 469
- Mulders et al. (2015a) Mulders, G. D., Pascucci, I., & Apai, D. 2015a, ApJ, 798, 112
- Mulders et al. (2015b) —. 2015b, ApJ, 814, 130
- Muzerolle et al. (2000) Muzerolle, J., Calvet, N., Briceño, C., Hartmann, L., & Hillenbrand, L. 2000, ApJ, 535, L47
- Natta et al. (2004) Natta, A., Testi, L., Muzerolle, J., Randich, S., Comerón, F., & Persi, P. 2004, A&A, 424, 603
- Owen et al. (2012) Owen, J. E., Clarke, C. J., & Ercolano, B. 2012, MNRAS, 422, 1880
- Pascucci et al. (2013) Pascucci, I., Herczeg, G., Carr, J. S., & Bruderer, S. 2013, ApJ, 779, 178
- Pascucci & Sterzik (2009) Pascucci, I., & Sterzik, M. 2009, ApJ, 702, 724
- Pecaut & Mamajek (2013) Pecaut, M. J., & Mamajek, E. E. 2013, ApJS, 208, 9
- Preibisch & Feigelson (2005) Preibisch, T., & Feigelson, E. D. 2005, ApJS, 160, 390
- Preibisch et al. (2005) Preibisch, T., et al. 2005, ApJS, 160, 582
- Principe et al. (2014) Principe, D. A., Kastner, J. H., Grosso, N., Hamaguchi, K., Richmond, M., Teets, W. K., & Weintraub, D. A. 2014, ApJS, 213, 4
- Principe et al. (2016) Principe, D. A., Sacco, G. G., Kastner, J. H., & et al. 2016, MNRAS, submitted
- Riviere-Marichalar et al. (2013) Riviere-Marichalar, P., et al. 2013, A&A, 555, A67
- Rodriguez et al. (2015) Rodriguez, D. R., van der Plas, G., Kastner, J. H., Schneider, A. C., Faherty, J. K., Mardones, D., Mohanty, S., & Principe, D. 2015, A&A, 582, L5
- Rodriguez et al. (2013) Rodriguez, D. R., Zuckerman, B., Kastner, J. H., Bessell, M. S., Faherty, J. K., & Murphy, S. J. 2013, ApJ, 774, 101
- Sacco et al. (2010) Sacco, G. G., Orlando, S., Argiroffi, C., Maggio, A., Peres, G., Reale, F., & Curran, R. L. 2010, A&A, 522, A55
- Sacco et al. (2012) Sacco, G. G., et al. 2012, ApJ, 747, 142
- Schneider et al. (2012) Schneider, A., Melis, C., & Song, I. 2012, ApJ, 754, 39
- Scholz et al. (2007) Scholz, A., Jayawardhana, R., Wood, K., Meeus, G., Stelzer, B., Walker, C., & O’Sullivan, M. 2007, ApJ, 660, 1517
- Scholz et al. (2005) Scholz, R.-D., McCaughrean, M. J., Zinnecker, H., & Lodieu, N. 2005, A&A, 430, L49
- Shkolnik et al. (2011) Shkolnik, E. L., Liu, M. C., Reid, I. N., Dupuy, T., & Weinberger, A. J. 2011, ApJ, 727, 6
- Skinner & Güdel (2013) Skinner, S. L., & Güdel, M. 2013, ApJ, 765, 3
- Stelzer et al. (2015) Stelzer, B., Frasca, A., & Alcala, J. M. 2015, ArXiv e-prints
- Stelzer et al. (2013) Stelzer, B., Marino, A., Micela, G., López-Santiago, J., & Liefke, C. 2013, MNRAS, 431, 2063
- Stelzer et al. (2006) Stelzer, B., Micela, G., Flaccomio, E., Neuhäuser, R., & Jayawardhana, R. 2006, A&A, 448, 293
- Stelzer et al. (2012) Stelzer, B., Preibisch, T., Alexander, F., Mucciarelli, P., Flaccomio, E., Micela, G., & Sciortino, S. 2012, A&A, 537, A135
- Stelzer et al. (2007) Stelzer, B., Scholz, A., & Jayawardhana, R. 2007, ApJ, 671, 842
- Sterzik et al. (1999) Sterzik, M. F., Alcalá, J. M., Covino, E., & Petr, M. G. 1999, A&A, 346, L41
- Teixeira et al. (2009) Teixeira, R., Ducourant, C., Chauvin, G., Krone-Martins, A., Bonnefoy, M., & Song, I. 2009, A&A, 503, 281
- Torres et al. (2006) Torres, C. A. O., Quast, G. R., da Silva, L., de La Reza, R., Melo, C. H. F., & Sterzik, M. 2006, A&A, 460, 695
- Torres et al. (2008) Torres, C. A. O., Quast, G. R., Melo, C. H. F., & Sterzik, M. F. 2008, Young Nearby Loose Associations, ed. Reipurth, B., 757–+
- Tsuboi et al. (2003) Tsuboi, Y., Maeda, Y., Feigelson, E. D., Garmire, G. P., Chartas, G., Mori, K., & Pravdo, S. H. 2003, ApJ, 587, L51
- Walsh et al. (2012) Walsh, C., Nomura, H., Millar, T. J., & Aikawa, Y. 2012, ApJ, 747, 114
- Webb et al. (1999) Webb, R. A., Zuckerman, B., Platais, I., Patience, J., White, R. J., Schwartz, M. J., & McCarthy, C. 1999, ApJ, 512, L63
- Weinberger et al. (2013) Weinberger, A. J., Anglada-Escudé, G., & Boss, A. P. 2013, ApJ, 762, 118
- West et al. (2004) West, A. A., et al. 2004, AJ, 128, 426
- Williams et al. (2014) Williams, P. K. G., Cook, B. A., & Berger, E. 2014, ApJ, 785, 9
Appendix A: Notes on Inclusion and Exclusion of Individual Stars
- TWA 6:
- TWA 9:
-
As Weinberger et al. (2013) and Pecaut & Mamajek (2013) have noted, the Hipparcos parallax of TWA 9 casts some doubt on its membership in the TWA. Based on other considerations (e.g., Li line strength, proper motion, kinematic distance, location relative to other TWA members), Pecaut & Mamajek (2013) conclude that TWA 9 is indeed likely a member of the Association, and that the parallax measurement is spurious. Hence, we retain TWA 9B in our TWA M star sample. As the higher-mass component TWA 9A is a mid-K star (Webb et al., 1999), our consideration of this component is restricted to the X-ray spectral analysis presented in Appendix B.
- TWA 14, 15, 21:
-
Schneider et al. (2012, and refs. therein) conclude these M stars are unlikely to be TWA members, and do not include them in their WISE-based assessment of the presence or absence of IR excesses. However, Ducourant et al. (2014) find these systems are indeed likely TWA members, based on convergent point analysis, so we include them in our sample.
- TWA 18:
- TWA 22:
-
Mamajek (2005) finds a low probability that TWA 22 (M5) is a TWA member; Teixeira et al. (2009) concluded this star is a member of the Pic Moving Group (rather than the TWA); and Ducourant et al. (2014) find that TWA 22 fails their convergence point membership analysis. Although Schneider et al. (2012) list this system as a possible member of the TWA, we exclude TWA 22 from our analysis.
- TWA 31:
-
Schneider et al. (2012) list this system as a possible member of the TWA, while Ducourant et al. (2014) find that it fails their convergence point membership analysis. While this star could hence be unrelated to the Association (at 110 pc, it is one of the more distant candidates), it displays strong, broad H emission indicative of ongoing accretion (Shkolnik et al., 2011), suggesting it is not merely a young field star that happens to lie in the direction of the TWA. We retain TWA 31 in our sample.
Appendix B: Chandra X-ray Spectral Analysis for TWA 8, 9 and 13
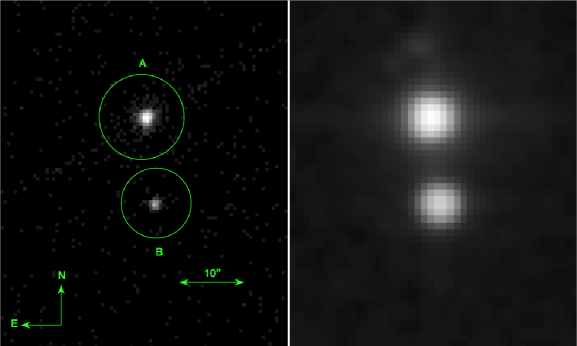
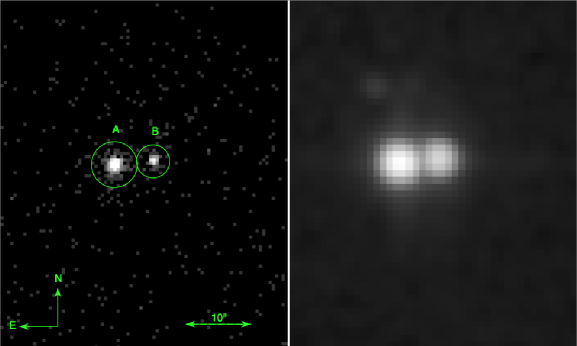
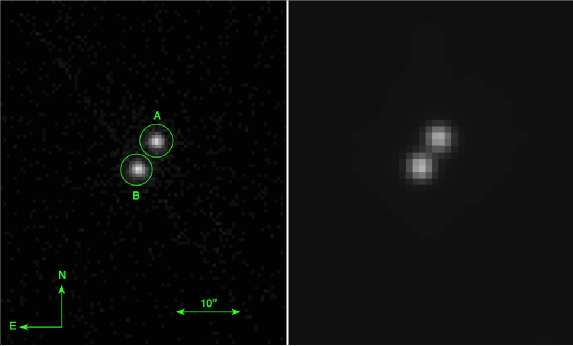
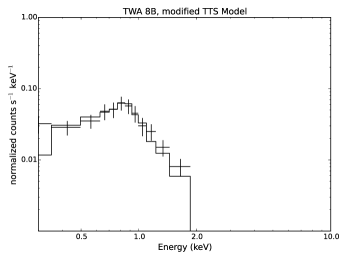
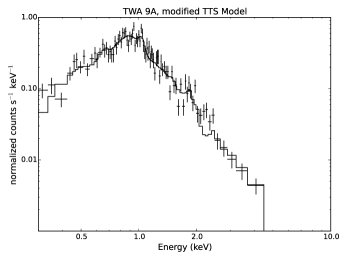
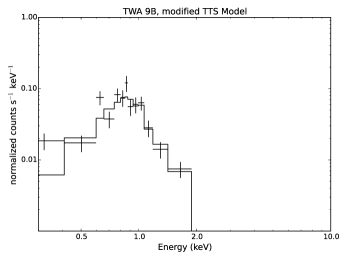
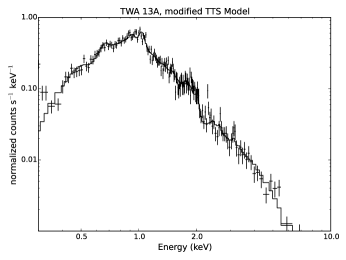
We have performed analysis of archival Chandra X-ray data for the M binary systems TWA 8, 9, and 13 (Webb et al., 1999; Sterzik et al., 1999). Five of the six components of these systems are M-type stars (Table 1), the lone exception being the K5 star TWA 9A. The binary separations of TWA 8, 9 and 13 are 13′′, and 5′′, respectively. A summary of the available Chandra observations of the three systems is listed in Table 4. All of these data were obtained using CCD S3 of the Advanced CCD Imaging Spectrometer (ACIS) array. The resulting Chandra/ACIS-S3 images are displayed, alongside 2MASS J band images of the systems, in Fig. 3.
The pipeline-processed data files provided by the Chandra X-Ray Center were analyzed using standard science threads with CIAO version 4.7333http://asc.harvard.edu/ciao.. The CIAO processing used calibration data from CALDB version 4.6.5. Spectra (and associated calibration data) were extracted within circular regions with diameters of 3– centered on the stellar X-ray sources (see Fig. 3). Background spectra were extracted within circular regions from nearby, source-free regions. The background-subtracted source count rates are listed in Table 4.
Spectral fitting was performed with the HEASOFT Xanadu444http://heasarc.gsfc.nasa.gov/docs/xanadu/xanadu.html. software package (version 6.16) using XSPEC555http://heasarc.gsfc.nasa.gov/xanadu/xspec. version 12.8.2.
We adopted the XSPEC optically thin thermal plasma model vapec, whose parameters are the plasma abundances, temperature, and emission measure (via the model normalization). The potential effects of intervening absorption were included via XSPEC’s wabs absorption model, although we found the absorbing column to be negligible in all cases (with the possible exception of TWA 13A, for which we find cm-2).
We found that two temperature components are required to obtain acceptable fits to the spectra of four of the six stars, based on statistics (the exceptions being the relatively faint sources TWA 8B and 9B).
Initially, we fixed the parameters for the plasma abundances to values that have been determined to be typical of T Tauri stars in Taurus (Skinner & Güdel, 2013, and references therein).
These abundance values (relative to solar) are H = 1.0, He = 1.0, C = 0.45, N = 0.79, O = 0.43, Ne = 0.83, Mg = 0.26, Al = 0.50, Si = 0.31, S = 0.42, Ar = 0.55, Ca = 0.195, Fe = 0.195, and Ni = 0.195.
We then allowed the abundances of Ne and Fe to be free parameters, since emission lines of these elements (plus O) tend to dominate the X-ray spectra of T Tauri stars in the 0.5–2.0 keV energy range (Kastner et al., 2002). Apart from the cases of TWA 8B and 9B, we find that leaving the Ne and Fe abundances free marginally improves the fit (slightly lowers ). In all cases, however, leaving Ne and Fe free only affects the results for X-ray flux (hence ) at the level of a few percent.
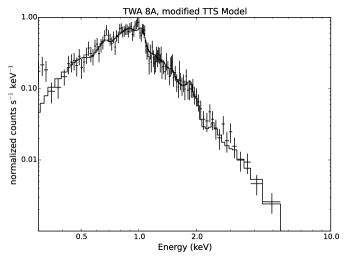
The results of the spectral analysis are presented in Table 5 and Fig. 4. The values for over the energy range 0.3–8.0 keV obtained from the fits are within 30% of those determined by Brown et al. (2015) in all cases. We find that characteristic plasma temperature is correlated with for this small sample of TWA member stars. Specifically, the weakest X-ray sources (TWA 8B and 9B) have best-fit plasma temperatures MK, while the brighter sources (TWA 8A, 9A, 13A, and 13B) have characteristic (emission-measure-weighted) plasma temperatures MK. The results also indicate that TWA 8A may depart from the “standard” T Tauri star abundance pattern, in that it appears deficient in Ne and significantly overabundant in Fe. The other three stars for which we can extract plasma abundance results with some confidence — TWA 9A, 13A, and 13B — show marginal enhancements of Ne relative to the “standard” T Tauri star abundance.
| TWA 8 | TWA 9 | TWA 13 | |
|---|---|---|---|
| Obs. ID (PI) | 8569 (Herczeg) | 8570 (Herczeg) | 12389 (Brown) |
| Exp. (ks) | 4.560 | 4.563 | 14.570 |
| Count Rate, Comp. A (ks-1) | 615 (13) | 482 (10) | 449 (6) |
| Count Rate, Comp. B (ks-1) | 47 (4) | 52 (3) | 543 (6) |
| Star | ||||||
|---|---|---|---|---|---|---|
| ParameteraaFitting parameters are as follows: Ne, Fe are abundances of these elements with respect to solar; , and , are, respectively, the temperatures and emission measures of the two plasma components; and “d.o.f.” are the reduced and degrees of freedom of the fit, respectively; and and are the intrinsic X-ray flux and X-ray luminosity, respectively. | TWA 8A | TWA 8B | TWA 9A | TWA 9B | TWA 13A | TWA 13B |
| Ne | 0.11 (0.03) | 0.4 (0.4) | 1.2 (0.4) | 1.1 (0.9) | 1.4 (0.2) | 1.6 (0.2) |
| Fe | 1.2 (0.3) | 0.11 (0.06) | 0.13 (0.04) | 0.12 (0.06) | 0.18 (0.04) | 0.15 (0.03) |
| (keV) | 0.80 (0.06) | 0.68 (0.16) | 0.80 (0.05) | 0.68 (0.16) | 0.40 (0.03) | 0.44 (0.04) |
| (MK) | 9.3 | 7.9 | 9.3 | 7.9 | 4.7 | 5.1 |
| (keV) | 2.5 (0.6) | … | 2.5 (0.5) | … | 2.1 (0.1) | 2.3 (0.1) |
| (MK) | 29 | … | 29 | … | 24 | 27 |
| ( cm-3) | 3.44 | 0.36 | 3.47 | 0.26 | 2.46 | 2.69 |
| ( cm-3) | 2.32 | … | 2.90 | … | 5.64 | 6.73 |
| 0.78 | 2.97 | 1.41 | 2.72 | 1.36 | 1.49 | |
| d.o.f. | 102 | 6 | 80 | 7 | 139 | 155 |
| ( ergs cm-2 s-1) | 2.8 | 0.26 | 2.2 | 0.20 | 2.5 | 3.1 |
| (1029 ergs s-1) | 6.3 | 0.46 | 7.2 | 0.64 | 9.2 | 11.1 |
| log | 2.88 | 3.25 | … | 3.38 | 2.93 | 2.85 |