A 16-ch module for thermal neutron detection using ZnS:6LiF scintillator with embedded WLS fibers coupled to SiPMs and its dedicated readout electronics
Abstract
A scalable 16-ch thermal neutron detection system has been developed in the framework of the upgrade of a neutron diffractometer. The detector is based on ZnS:6LiF scintillator with embedded WLS fibers which are read out with SiPMs. In this paper, we present the 16-ch module, the dedicated readout electronics, a direct comparison between the performance of the diffractometer obtained with the current 3He detector and with the 16-ch detection module, and the channel-to-channel uniformity.
keywords:
Thermal neutron detector , Diffractometer , ZnS:6LiF , Wavelength-shifting fiber , SiPM1 Introduction
POLDI is a neutron time-of-flight (TOF) diffractometer [1] commissioned in 2002 at the Swiss neutron spallation source (SINQ) at the Paul Scherrer Institute (PSI). It was designed to function as a strain scanner for the investigation of residual stress in engineering materials and components. While residual stress measurements are still an important part of the beamtime usage, 30% of the research at POLDI involves now in-situ testing and this will increase with the recent installation of a tension/compression/biaxial deformation rig which is unique and not available at other beamlines. In order to allow a simultaneous measurement of the axial and transverse strain components during in-situ deformation measurements, an upgrade program of the POLDI beamline has been launched which is aiming for the installation of a second detector oppositely placed to the current 3He detector with the same geometry and the same level of performance.
| detector size (width height) | 1 0.2 m2 |
|---|---|
| radius of curvature | 2 m |
| number of channels | 400 |
| channel size (width height) | 2.5 200 mm2 |
| neutron spectrum | 1 - 5 Å |
| detection efficiency | % at 1.2 Å |
| time resolution | s |
| sustainable count rate | kHz / channel |
| quiet background rate | Hz / channel |
| gamma sensitivity |
Table 1 gives the requirements for the new detector. Because of the world-wide shortage of 3He, a simple duplication of the current detector was not possible. As an alternative to the 3He technology, we decided to use the ZnS/6LiF scintillator technology.
2 The 16-ch detection module
The 16-ch module has been described in detail recently in [2]. We repeat here the main aspects. The 16-ch module consists of an almost gapless assembly of 16 individual detection bars with a pitch of 2.5 mm. A detection bar is a layered assembly of scintillation screens ND2:1 from Scintacor [3] with embedded wavelength-shifting (WLS) fibers Y11(400)M from Kuraray [4] uniformly distributed in the detection volume. This structure shown in Fig. 1 provides an efficient and uniform light collection efficiency despit of the poor light transmission of the scintillator as well as a large neutron absorption probability of 84% at 1.2 Å. On one extremity of the bar the surface is polished and mirrored while on the other the 12 WLS fibers are bundled and glued into a 1.1 mm diameter hole of a plexiglas block before they are polished.
The fiber bundle is coupled to a SiPM S12571-025C from Hamamatsu [6] through a 2 mm long clear multiclad fiber with a diameter of 1.2 mm which is polished on both ends (see Fig. 3). This optical coupling provides a uniform illumination of the mm2 sensitive area of the SiPM independent of which WLS fibers collect the light. The SiPMs are connected with spring contacts to the front-end board. This offers the possibility to exchange the SiPMs in case of a necessary replacement due to radiation damage or the use of new devices with improved properties. Fig. 3 shows the 16-ch module. Each detection bar is mounted individually and can be replaced in case of damage without affecting the others. To prevent optical crosstalk between adjacent bars, each one is wrapped with a thin aluminum foil.
The front-end board to which the SiPMs are connected contains a passive thermistor circuit [7] on each high voltage line to compensate for temperature variations. This circuit stabilizes the SiPM overvoltage over a large range of temperature from about 15°C to 45°C.
3 Signal processing
The signal processing system is based on a photon counting approach. Two reasons make this approach feasible. First, the ZnS:6LiF scintillator is relatively slow [8] and consequently the photons are sufficiently spaced in time to allow the detection of almost each individual photon emitted in a given time window. Secondly, SiPMs have an excellent single photon counting capability.
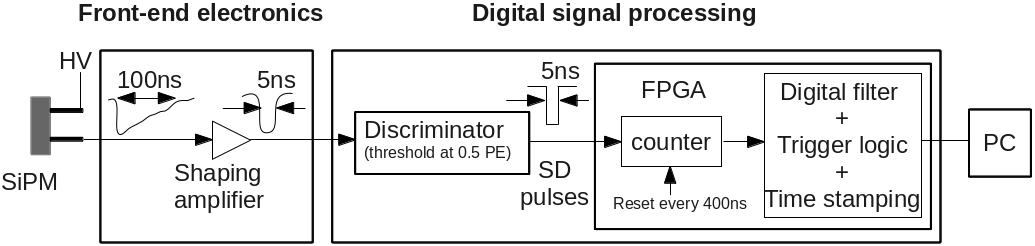
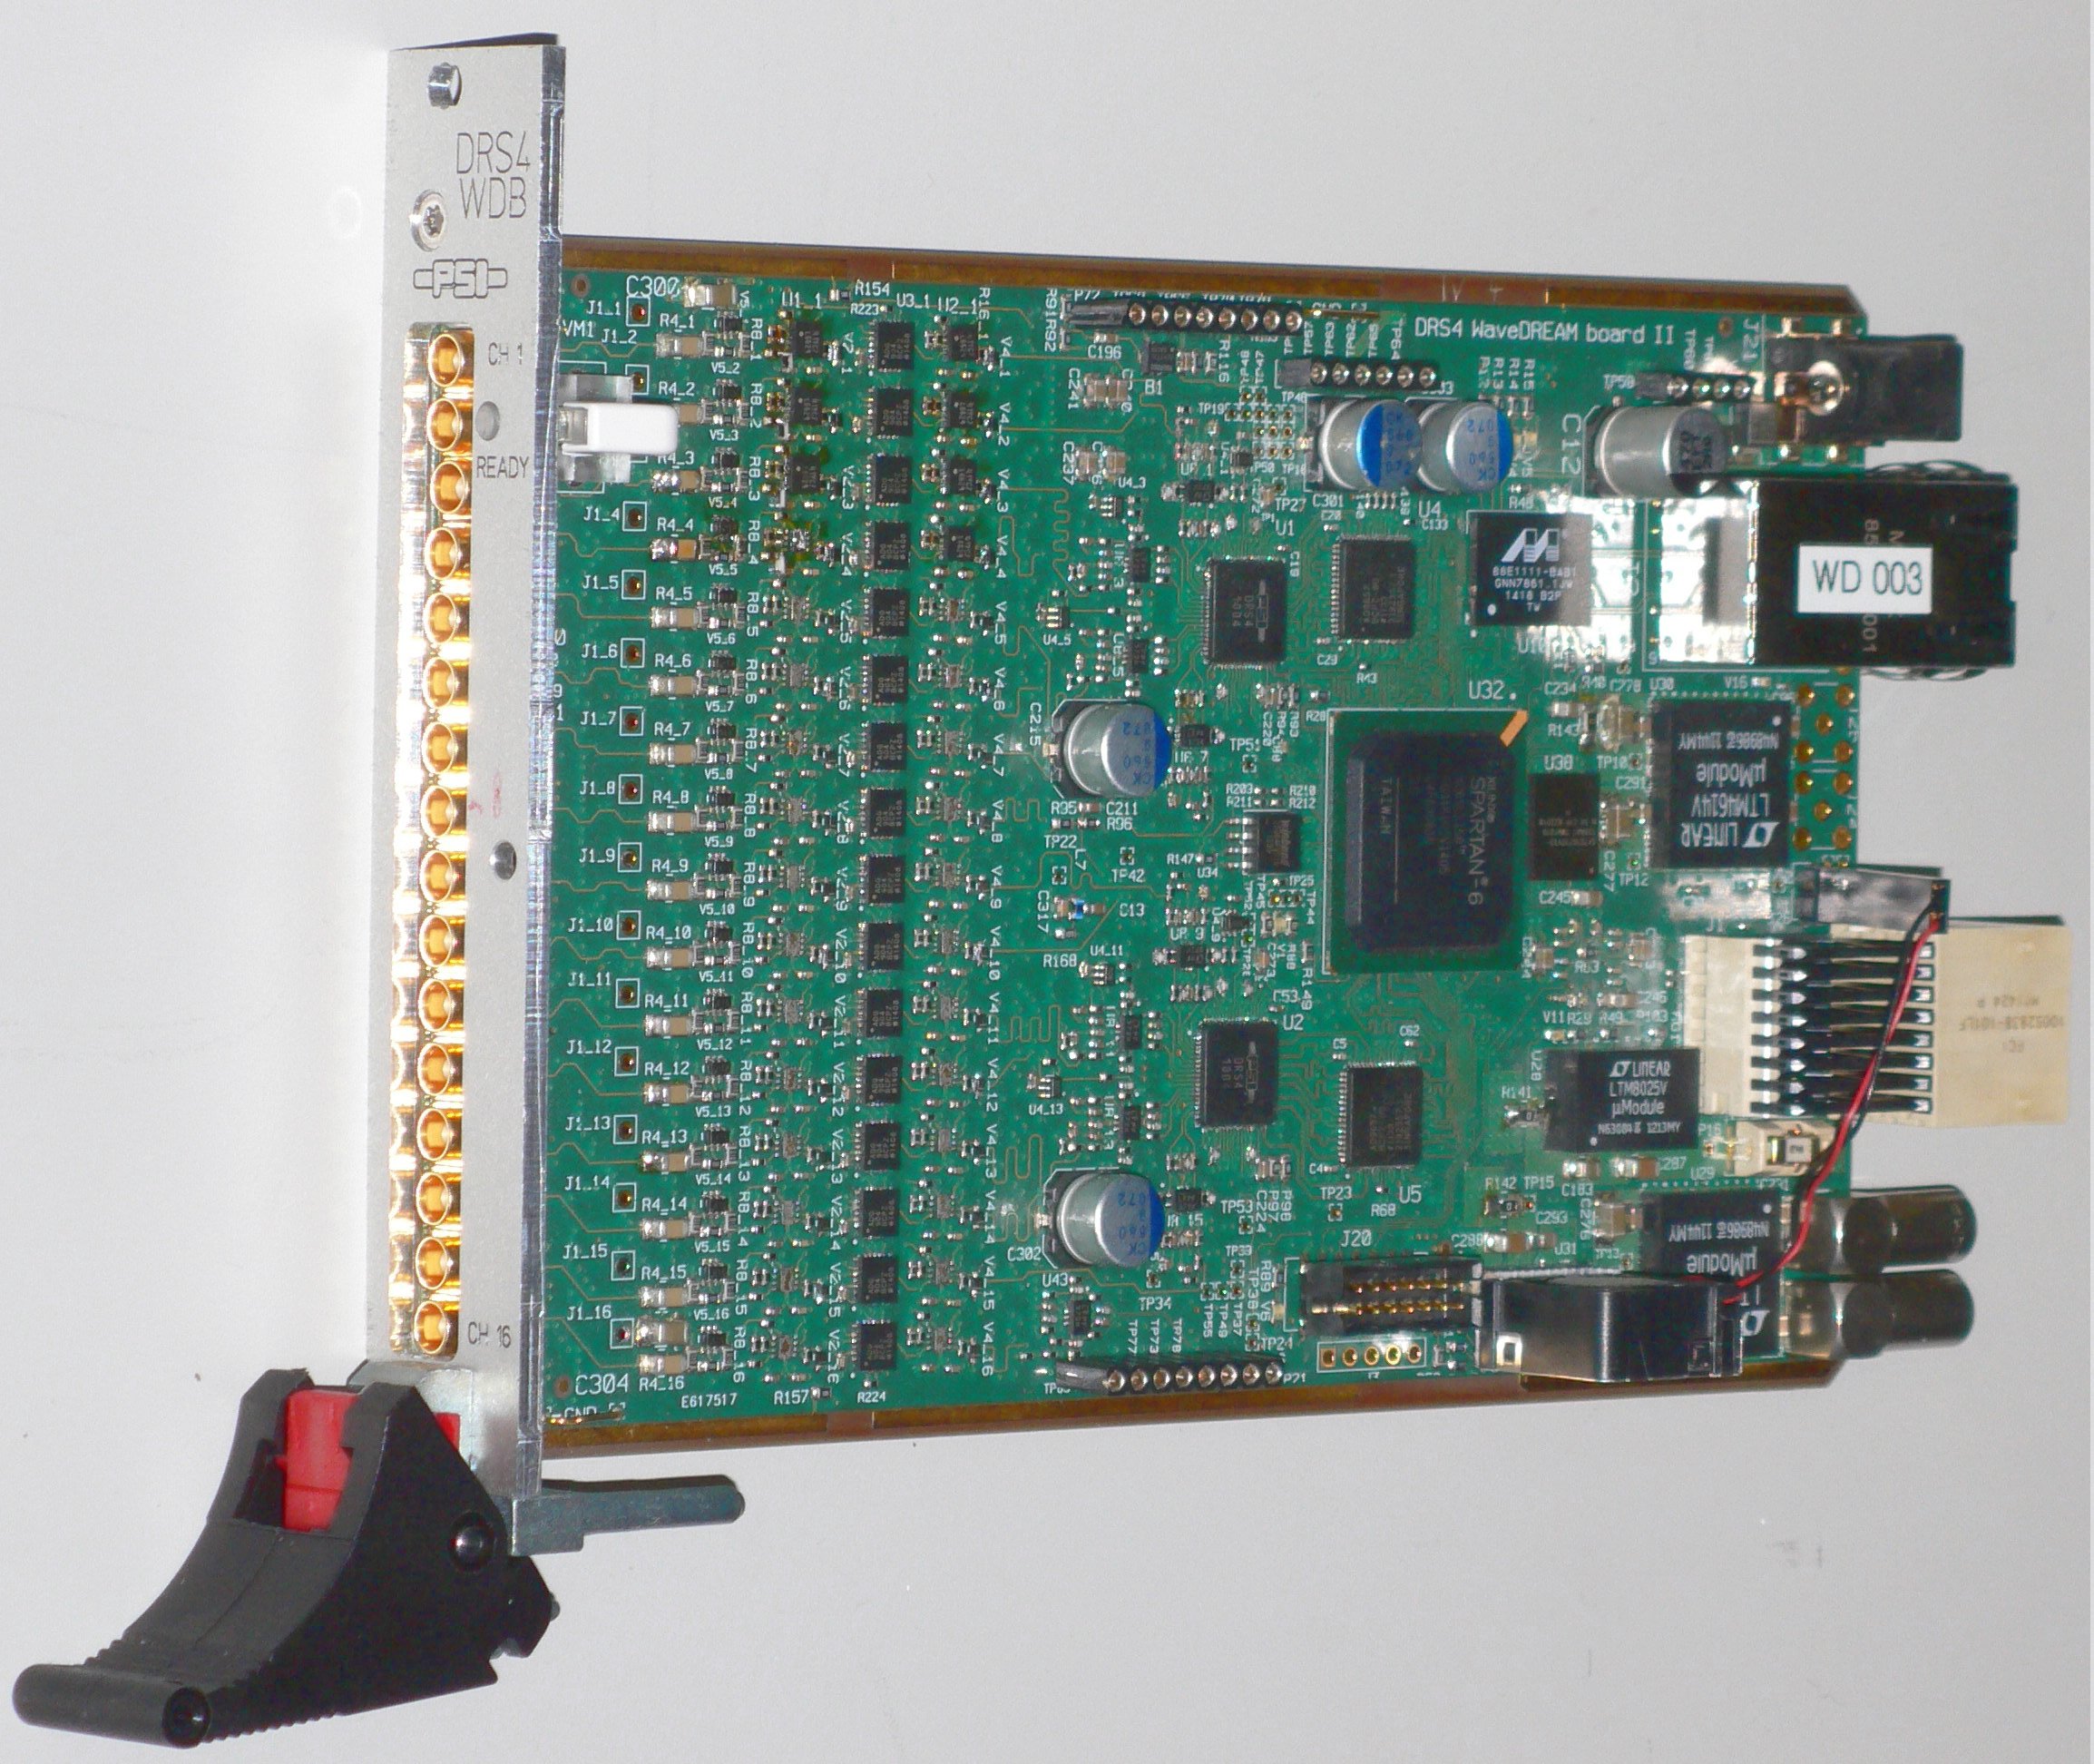
Fig. 4 shows the block diagram of the signal processing system. The SiPM output is connected to a high frequency amplifier producing a 5 ns wide pulse for each single-cell signal of the SiPM. The output of the amplifier is then fed into a leading edge discriminator with a threshold set at 0.5 photoelectron (PE). Independent of how many SiPM cells are triggered simultaneously due to the SiPM crosstalk, the discriminator creates only one standard SD-pulse. This “digitization” which suppresses the crosstalk allows to reduce the quiet background rate of the detector [9].
The analog output signals from the front-end board are readout by the WaveDREAM board, a 16-ch FPGA-based readout board (Fig. 5) developed at PSI for the MEG experiment. The WaveDREAM board is highly flexible and offers all the necessary features for this project: discriminators and FPGA. The board is connected to a PC via a GBit Ethernet connection which offers a fast data transfer. We achieve a maximum count rate of neutrons equal to 4 kHz/ch without loss, which satisfies the requirements for POLDI.
The nature of the signal received by the digital filter is the temporal SD-pulse density. This signal is sampled every 400 ns by measuring the number of SD-pulses during each consecutive time slice of 400 ns. In [10], the performances of the detector obtained with several digital filters are compared. The best evaluated filter, the so-called “moving sum after differentiation” (DI+MS) filter, is the one which has been implemented in the WaveDREAM board. It is defined by the following formulas:
| (1) |
where and are the discrete samples of the signal at the input and output of the filter and is a parameter which determines the shaping time of the filter equal to ns.
After calculation of the filter output, the following triggering conditions are ANDed: (a) The channel is ready (after each trigger, a blocking time is introduced to prevent multiple triggers on the same events). (b) The filter output is maximum. (c) The filter output is higher than a certain threshold.
The time stamp of an event is defined by the time slice in which the filter output is maximum.
The detection module is operated with the following settings of the signal processing: =5, blocking time = 4 s, threshold = 20 SD-pulses. With this settings and up to a SiPM dark count rate of 4 MHz, the performance parameters of the detection module reported in [10] are: trigger efficiency = 81%, background rate Hz/ch, probability of multiple trigger , time resolution (StDev) ns (contribution from the signal processing). Based on recent measurements performed with an analog CR-RC4 filter, which is equivalent to the DI+MS filter, we estimate the gamma sensitivity of the detection module to up to a SiPM dark count rate of 4 MHz.
The initial dark count rate of the SiPMs is 100 kHz and irradiation tests in the POLDI beamline show an increase of 90 kHz/year of the SiPM dark count rate. So, the detection module could be operated during more than 20 years with the above-mentioned performance.
4 Measurements
4.1 Diffractometer performance with current and new detector
In order to obtain a direct comparison between the current 3He detector and the new 16-ch detection module, the latter was placed oppositely to the current 3He detector, at a scattering angle of about 90° and at the same distance from the sample as the 3He detector. Both detectors were synchronized so that they started and stopped their acquisition of data simultaneously and their timers were reset simultaneously at the beginning of each chopper sequence.
There was no available collimator for the 16-ch module. Therefore, in order to have identical measurement conditions for both detectors, the collimator of the 3He detector was removed and a small size sample which does not require a collimator was used (Iron wire of 1 mm diameter) .
In order to have a fair comparison of the diffractometer performance obtained with the 3He and with the scintillation detectors, we only used the 16 channels of the 3He detector (channels 134 to 149) having the same angular positions as the ones of the scintillation detector. Fig. 6 shows the raw data obtained with the two detectors.
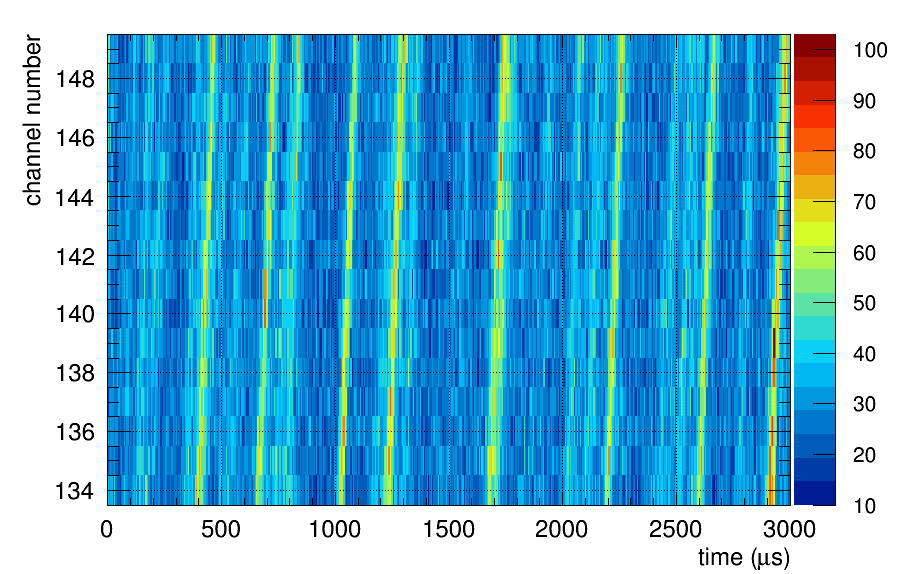
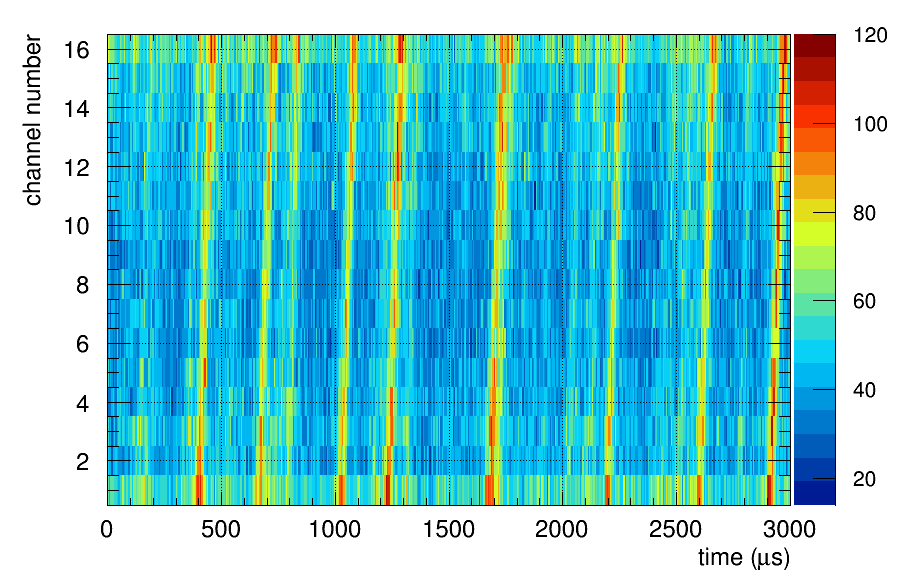
With the scintillation detector, the number of events located between the Bragg lines (background) appears to be higher than with the 3He detector, in particular for the channels located on the edge of the detector (channels 1 and 16). The reason for that is not so much related to the detection units themselves but mainly to their shielding against neutrons scattered from somewhere else than the sample, or against fast neutrons. The 3He detector had a better shielding than the scintillation detector. Moreover, in the 3He detector, the detection channels surrounding the selected channels were acting as a shielding providing a uniform background, in contrast to the situation with the 16-ch scintillation detector.
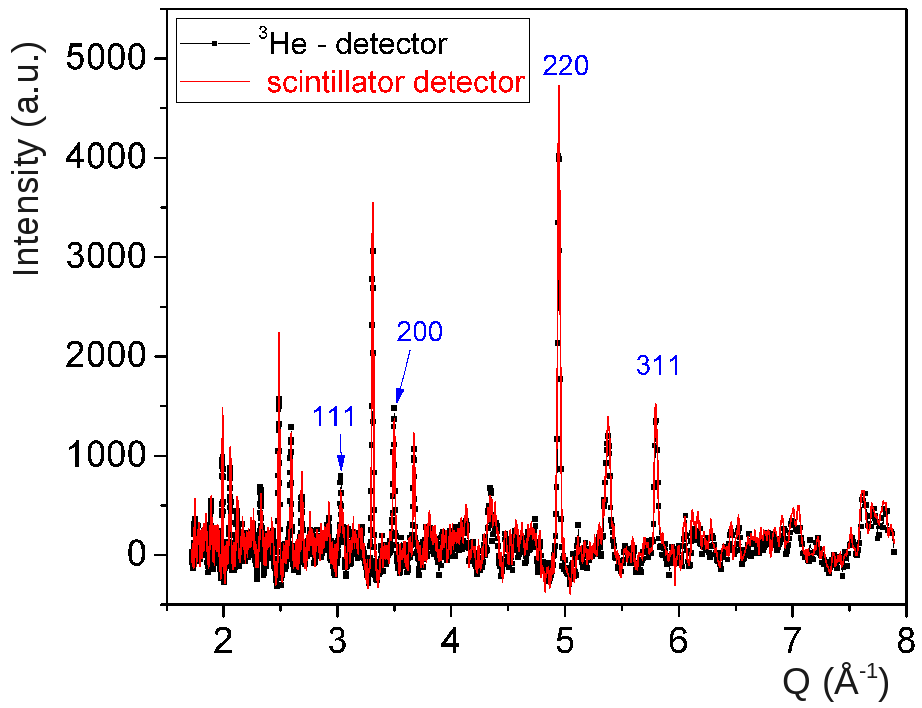
Fig. 7 shows the correlated diffraction pattern obtained with the 16-ch scintillation detector and with the 16 corresponding channels of the 3He detector. Only four peaks correspond to Bragg peaks. The others are artifacts created by the algorithm due to the limited number of channels used. Nevertheless, we observe a perfect agreements concerning the peak positions and the diffractometer resolution (FWHM of the Bragg peak divided by its position) obtained with the scintillation detector is equivalent or even better than with the current 3He detector.
4.2 Channel-to-channel uniformity
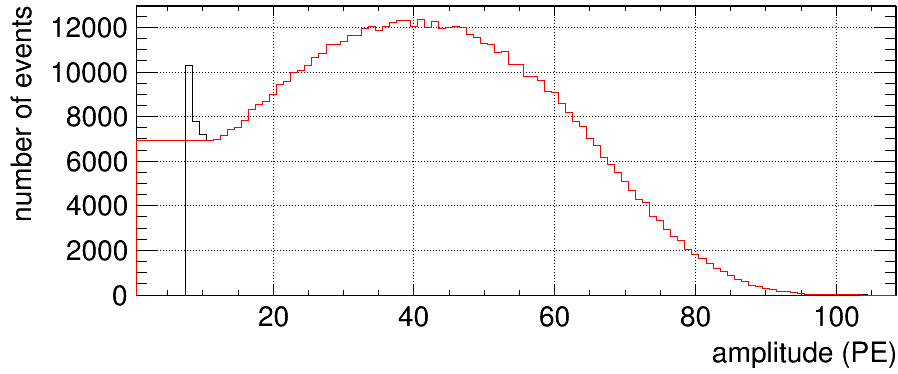
Fig. 8 shows the amplitude spectrum for one channel of the 16-ch module measured at a low trigger threshold. The trigger efficiency at a threshold is calculated with the equation
| (2) |
where is the extrapolated amplitude spectrum and is the total number of events in .
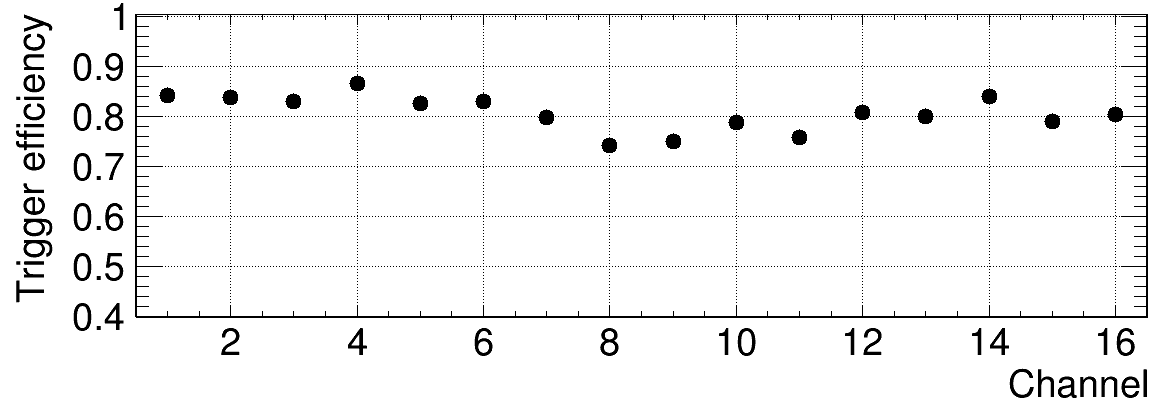
Fig. 9 shows the tigger efficiency profile of the 16-ch detection module. The average and the standard deviation of the trigger efficiencies of the individual channels are 81% and 3.4%, respectively.
5 Summary
The upgrade program of the POLDI engineering diffractometer at PSI is aiming to the installation of an additional detector with the same geometry and the same level of performance as the current 3He detector. In order to tackle the problem of the 3He shortage, we developped a 16-ch detection module based on ZnS(Ag):6LiF scintillator with WLS fibers as well as its dedicated digital signal processing system based on a photon counting approach. This module represents a building block of the full-size detector. It presents two innovative features for a ZnS(Ag):6LiF scintillator-based detector that are the layered assembly of the sensitive volume with embedded WLS fibers and the use of SiPMs. The relative standard deviation of the trigger efficiency over the 16 channels is 4%. This good channel-to-channel uniformity validates the manufacturing process. The resolution of the POLDI diffractometer obtained with the 16-ch scintillation module is equivalent or even better than with the current 3He detector.
Acknowledgements
The authors wish to thank Dieter Fahrni and Andreas Hofer for the design and construction of the neutron detection module. This work was supported by the Swiss National Science Foundation (Grant no. 206021-139106).
References
- [1] U. Stuhr, et al., Time-of-flight diffraction with multiple frame overlap Part II: The strain scanner POLDI at PSI, Nuclear Instruments and Methods in Physics Research A 545 (2005) 330.
- [2] M. Hildebrandt, et al., Detection of thermal neutrons using ZnS:Ag/6LiF neutron scintillator read out with WLS fibres and SiPMs, Nuclear Instruments and Methods in Physics Research A (2015), http://dx.doi.org/10.1016/j.nima.2015.10.102.
- [3] http://www.scintacor.com.
- [4] http://kuraraypsf.jp.
- [5] http://www.eljentechnology.com.
- [6] http://www.hamamatsu.com.
- [7] H. Miyamoto, et al., SiPM development and application for astroparticle physics experiments, Proceedings of the 31st ICRC, 2009.
- [8] E.S. Kuzmin, et al., Detector for the FSD Fourie-diffractometer based on ZnS(Ag)/6LiF scintillation screen and wavelength shifting fiber readout, Journal of Neutron Research 10 (1) (2002) 31.
- [9] J.-B. Mosset, et al., Evaluation of two thermal neutron detection units consisting of ZnS/6LiF scintillating layers with embedded WLS fibers readout with a SiPM, Nuclear Instruments and Methods in Physics Research A 764 (2014) 299.
- [10] J.-B. Mosset, et al., Digital signal processing for a thermal neutron detector using ZnS(Ag):6LiF scintillating layers read out with WLS fibers and SiPMs, Nuclear Instruments and Methods in Physics Research A (2015), http://dx.doi.org/10.1016/j.nima.2015.11.062.