Mass ratio determination from Hα lines in Black-Hole X-ray transients
Abstract
We find that the mass ratio in quiescent black hole (BH) X-ray transients is tightly correlated with the ratio of the double peak separation () to the full-width-half maximum () of the Hα emission line, . The correlation is explained through the efficient truncation of the outer disc radius by the 3:1 resonance with the companion star. This is the dominant tidal interaction for extreme mass ratios , the realm of BH (and some neutron star) X-ray transients. Mass ratios can thus be estimated with a typical uncertainty of 32%, provided that the Hα profile used to measure is an orbital phase average. We apply the relation to the three faint BH transients XTE J1650-500, XTE J1859+226 and Swift J1357-0933 and predict , 0.049 and 0.040, respectively. This new relation, together with the correlation presented in Paper I (Casares, 2015) allows the extraction of fundamental parameters from very faint targets and, therefore, the extension of dynamical BH studies to much deeper limits than was previously possible. As an example, we combine our mass ratio determination for Swift J1357-0933 with previous results to yield a BH mass of 12.43.6 M⊙. This confirms Swift J1357-0933 as one of the most massive BH low-mass X-ray binaries in the Galaxy.
1 Introduction
Stellar-mass black holes (BHs) are mostly detected through dramatic X-ray outbursts exhibited by transient X-ray binaries (SXTs; Tanaka & Shibazaki 1996). About 60 BH candidates have been identified in the 50 year lifetime of X-ray astronomy (Corral-Santana et al., 2015), although only 17 of these have been confirmed by dynamical studies i.e. they possess a mass function in excess of 3 M⊙, where is the mass ratio of the companion star to the compact object. The reason for the low rate of confirmed BHs lies in the difficulty of detecting the companion star for quiescent optical magnitudes fainter than 22. Time-resolved spectroscopy with signal-to-noise ratio is typically needed to detect the weak absorption features and trace their orbital motion. Determining the binary mass ratio is even more challenging as it also requires resolving powers to measure the rotational broadening of the absorption lines (e.g. Casares & Charles 1994). In addition, moderately short integration times are essential to avoid significant orbital smearing. It should be mentioned that alternative methods based on the radial velocities of the disc emission lines are uncertain and prone to large systematic effects (see e.g. Marsh et al. 1994). A critical review on the determination of system parameters in BH SXTs can be found in Casares & Jonker (2014).
In Casares (2015) (henceforth Paper I) we showed that the full-width-half maximum () of the disc Hα line in quiescent BH SXTs scales with the velocity semi-amplitude of the companion star. We here present the discovery of a another correlation between and the ratio of the double peak separation to the line width. Both relations open the door to constrain fundamental parameters and perform dynamical studies in much fainter samples of quiescent BH candidates than is currently possible.
2 Database
We have selected a sample of quiescent spectra of nine dynamical BH and two neutron star (NS) SXTs from Paper I, all with reliable mass ratio determinations. Only mass ratios obtained by resolving the rotational broadening of the companion star (the technique) have been considered. Table 1 presents our sample and the associated references. Full observational details for every target are given in Paper I. For the case of XTE J1118+480, we decided to include also 34 additional spectra obtained with the 10.4m Gran Telescopio Canarias (GTC) and reported in González Hernández et al. (2014). Note that GRO J0422+320 is not included despite having a determination through the technique. This is because the resolution of the only three quiescent spectra available to us is too poor (% of the double peak separation) for a realistic determination of the double peak separation.
For comparison we have also chosen a sub-sample of quiescent Cataclysmic Variables (CVs) from Paper I. From the 24 possible CVs with reliable determinations, 13 have been rejected because the line core is dominated by a strong S-wave component which prevents us from measuring the double peak separation with the simple model outlined below. In any case, these are all CVs with large mass ratios which, as we will show later, are not relevant to our analysis. From the remaining 11 CVs, three have values based on the technique (GK Per, IP Peg and CTCV J1300-3052) and another two on a direct determination of the radial velocity curves of both the white dwarf and the donor star (U Gem and WZ Sge). In the remaining six the companion star is not directly observed but robust values are available through modeling the eclipse of the white dwarf and the hot spot (see e.g. Littlefair et al. 2008). Our CV sample is listed in Table 2.
3 The relation
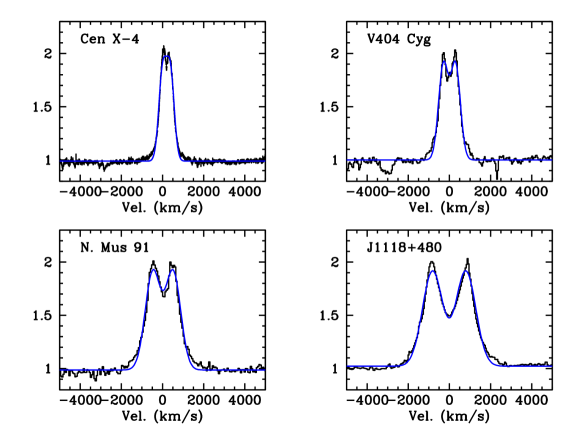
Double peak separations () were obtained by fitting a symmetric 2-Gaussian model to the average Hα profile in every SXT and CV. In the case of eclipsing CVs we excluded those spectra obtained within 0.05 phases from the time of the central eclipse. The fitted model consists of a constant plus two Gaussians of identical width and height. The continuum rectified spectra were fitted in a window of 10000 km s-1, centered on the Hα line after masking the neighboring HeI line at 6678. Prior to the fit, the 2-Gaussian model was degraded to the resolution of the data by convolution with the instrumental profile111As a test we also tried fitting the model without instrument degradation and find that this only has a minor impact (%) on the ratio because both quantities are almost equally affected. We adopted 1- formal errors on the fitted parameter as derived through minimization. Fig. 1 displays some fit examples using our 2-Gaussian model. In addition, values were extracted from single Gaussian fits to the same average Hα profiles following Paper I.
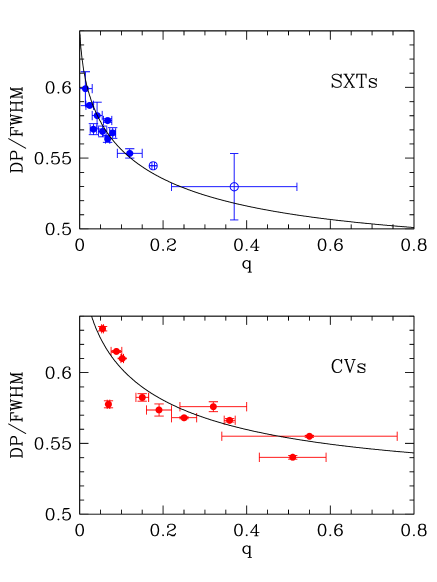
Tables 1 and 2 list the parameter and its propagated 1- error as derived from our Gaussian model fits. The evolution of with is presented in Fig. 2. The figure shows that varies very rapidly for small values, with a 10% increase for under 0.2.
In order to understand this behaviour, we follow on from Paper I and start by assuming that the of the Hα line is determined by gas with Keplerian velocity at a characteristic radius , with and the Roche lobe of the compact star, i.e.
| (1) |
On the other hand, the double peak separation is set by the velocity of the outer disc, whose radius is truncated by the tidal forces of the companion star (Paczynski, 1977; Papaloizou & Pringle, 1977). There is ample evidence for the outer disc velocities to be sub-Keplerian (e.g. North et al. 2002) and thus we decided to adopt
| (2) |
where the parameter accounts for the fraction by which the outer disc material is sub-Keplerian. For extreme mass ratios the disc is effectively truncated at the resonance radius of the (j=3, k=2) commensurability or 3:1 resonance radius i.e. the radius at which the disc angular velocity is three times the angular velocity of the companion star (see Hirose & Osaki 1990; Frank, King & Raine 2002). Therefore,
| (3) |
where the binary separation. If we now bring eq. 3 into eq. 2 and use Eggleton’s relation (Eggleton, 1983) to remove we find
| (4) |
where is the same expression as in eq. 6 of Paper I, i.e.
| (5) |
By computing the ratio between the double peak separation and the line width we have managed to cancel out the dependence on compact object mass and binary inclination. Interestingly, in contrast with the correlation presented in Paper I, eq. 4 is very sensitive to the mass ratio for i.e. the typical values achieved by BH SXTs.
For the sake of comparison, we also plot eq. 4 in Fig. 2 for (adopted from Paper I) and . Although not intended to be a fit, the alignment of the data with the model indicates that eq. 4 provides a good description of the observations. This endorses our interpretation that the strong dependence of with is driven by the truncation of the outer disc radius caused by the 3:1 resonance tide. The bottom panel in Fig. 2 also displays the evolution of for the CV sample, with the model for and superimposed. The comparison of the SXT and CV data with the model indicates that the velocities at the outer accretion disc are sub-Keplerian by 20%, in good agreement with other studies (e.g. Wade & Horne 1988). Note that for the 3:1 resonance lies beyond 0.9 and the outer disc radius is then limited by the largest non-intersecting orbits allowed by three-body interactions (Paczynski, 1977). Under these circumstances, the dependence of the outer disc radius on is very weak (Frank, King & Raine, 2002) and, therefore, a nearly constant evolution of versus is expected for .
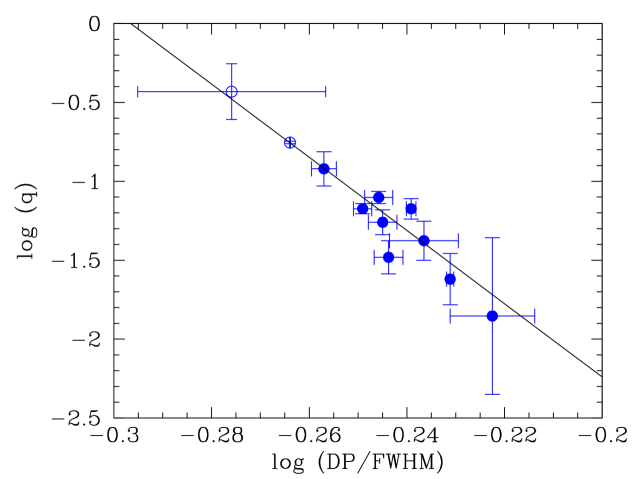
For practical purposes, we display in Fig. 3 the variation of versus in logarithmic units. A least-squares linear fit yields
| (6) |
witha Pearson correlation coefficient . In order to estimate the error in implied by this relation we have computed the difference with respect to the true observed values for our 11 SXTs. The distribution of differences can be approximated by a normal function with . This indicates that mass ratios can be realistically obtained from eq. 6 with a typical % uncertainty.
4 Orbital effects
The spectra that we have used to produce the correlation are orbital averages. This is party because individual spectra rarely possess enough signal-to-noise for the technique to be applicable. But also, because orbital means average out possible asymmetries in individual spectra from, for example, hot-spots or disc eccentricitiies which could potentially bias the determination of .
At this point we decided to explore the impact of line asymmetries in the results of our technique. Since this can only be tested on data with sufficient signal-to-noise we have focused on the 154 high quality GTC spectra of XTE J1118+480 obtained along four different orbits over two years. We have performed Gaussian fits on every individual spectrum and computed mass ratios using eq. 6. The distribution of values is found to peak at (bottom panel in Fig. 4), with 68% of the values contained between and 0.045. This indicates that, if were to be obtained from a single individual spectrum, the typical uncertainty would be about 56%.
In order to trace the effect of line asymmetries we also extracted the parameter from each spectrum, with defined as the ratio of equivalent widths between the blue and the red part of the Hα profile. The two halves of the line are set from the rest wavelength till 2500 km s-1. For example, indicates a line with the red part stronger by 20% while implies a symmetric profile. A plot of versus (see top panel in Fig. 4) seems to show a trend, with asymmetric profiles preferring slightly lower values, although the large scatter prevents from drawing a firm conclusion.
However, as we have mentioned above, the technique outlined in this paper is most useful on phase averaged spectra because individual spectra typically have very limited signal-to-noise. Consequently, we have extracted values by fitting Gaussians to the four orbital averages of the 154 individual spectra. The distribution of values has a mean at 0.026 and a standard deviation of 0.005, indicating that the typical error on phase averaged spectra is reduced to 19% i.e. smaller than the 25% uncertainty drawn from the correlation. We therefore conclude that the uncertainty expected from the application of our technique to phase averaged spectra is about 32%.
5 Discussion: application to three faint BHs
In Paper I we showed that the of the Hα line in quiescent SXTs and CVs is formed at 42% of . Furthermore, it is tightly correlated with the projected velocity of the donor star and thus, the quantity can be used to extract dynamical information from single epoch low resolution () spectroscopy. In addition, we showed that is weakly dependent on , resulting in a 27% flatter slope for (long-period) CVs.
We here now present a new method to estimate the binary mass ratio in quiescent BH SXTs from the properties of the Hα line. We have proved that the quantity is strongly dependent on , with a 10% variation for . The reason behind this is the efficient truncation of the outer disc radius by the 3:1 tidal resonance of the donor star. The correlation of with , therefore, opens a new avenue to measure mass ratios in quiescent BH SXTs. The double peak separation can be solidly measured by fitting a symmetric double-Gaussian model to phase averaged Hα profiles. We estimate that instrumental resolution better than 25% of the double peak separation is required to resolve the latter. This typically demands resolving powers of only 1000 i.e a factor lower than required to measure using the technique. More significantly for observational feasibility, this method makes use of the disc Hα line which, with a typical Å, is much stronger that the weak atmospheric features of the donor star.
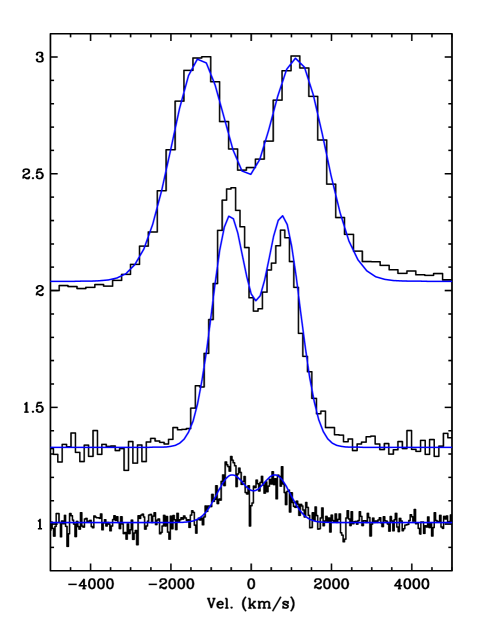
The relations presented in this paper and in Paper I thus allow for a reasonably accurate estimation of the system parameters in very faint SXTs which otherwise cannot be tackled with current instrumentation and standard techniques. As an example, we have applied our method to the BH SXTs XTE J1650-500, XTE J1859+226 and Swift J1357-0933. They all have and none of them has yet a mass ratio determination. We have produced averaged spectra for XTE J1650-500 and XTE J1859+226 using the data presented in Table 1 of Paper I. Regarding Swift J1357-0933 we have used a more recent and extended database reported in Mata Sánchez et al. (2015). Fig.5 displays the averaged spectra of the three BHs together with the best double-Gaussian model fits, which result in , 0.57410.0072 and 0.58050.0027 for XTE J1650-500, XTE J1859+226 and Swift J1357-0933 respectively. The mass ratios implied by eq. 6 are , 0.049 and 0.040, respectively. The quoted uncertainties correspond to 68% confidence regions and have been computed using a Monte Carlo simulation with realizations. We note in passing that our mass ratio for Swift J1357-0933 is in excellent agreement with an independent estimate based on the radial velocity curve of the wings of the Hα line (Mata Sánchez et al., 2015).
Regarding Swift J1357-0933 we are now in a position to present a credible BH mass based on our scaling relations. By combining our mass ratio with the mass function obtained by means of the correlation (Mata Sánchez et al., 2015) and a conservative estimate of the inclination angle (Corral-Santana et al., 2013; Mata Sánchez et al., 2015) we find M⊙. This result confirms Swift J1357-0933 as one of the most massive BH low-mass X-ray binaries in the Galaxy, only rivaled by GRS 1915+105 (Reid et al., 2014).
To conclude we would like to stress that the relations presented here and in Paper I will help deepen the search for new BH transients to substantially fainter limits. They will also prove very useful in extracting fundamental parameters from large numbers of data to be delivered by new spectroscopic surveys such as GAIA or WEAVE.
References
- Baptista et al. (1998) Baptista, R., Catalan, M.S., Horne, K. & Zilli, D. 1998, MNRAS, 300, 233
- Beekman et al. (2000) Beekman, G., Somers, M., Naylor, T. & Hellier, C. 2000, MNRAS, 318, 9
- Calvelo et al. (2009) Calvelo, D.E., Vrtilek, S.D., Steeghs, D., Torres, M.A.P., Neilsen, J., Filippenko, A.V. & González Hernández, J.I. 2009, MNRAS, 399, 539
- Casares (2015) Casares, J. 2015, ApJ, 808, 80
- Casares (1996) Casares, J. 1996, Astrophysics and Space Science Library, Proc. of the 158th coll. of IAU, A. Evans and Janet H. Wood ed., Dordrecht: Kluwer Academic Publishers, Vol. 208, p.395
- Casares et al. (1991) Casares, J., Charles, P.A., Jones, D.H.P., Rutten, R.G.M. & Callanan, P.J. 1991, MNRAS, 250, 712
- Casares & Charles (1994) Casares, J. & Charles, P.A. 1994, MNRAS, 271, L5
- Casares et al. (2009a) Casares, J. et al. 2009a, ApJS, 181, 238
- Casares & Jonker (2014) Casares, J. & Jonker, P.G. 2014, SSRv, 183, 223
- Corral-Santana et al. (2013) Corral-Santana, J.M., Casares, J., Muñoz-Darias, T., Rodríguez-Gil, P., Shahbaz, T., Torres, M.A.P., Zurita, C. & Tyndall, A.A. 2013, Science, 339, 1048
- Corral-Santana et al. (2015) Corral-Santana, J.M., Casares, J., Muñoz-Darias, T., Bauer, F.B, Martínez-Pais, I.G. & Russell, D.M. 2015, A&A, 587, A61
- Eggleton (1983) Eggleton, P.P. 1983, ApJ, 268, 368
- Frank, King & Raine (2002) Frank, J., King, A.R. & Raine, D.J. 2002, Accretion Power in Astrophysics, 3rd edn., Cambridge University Press
- Friend et al. (1990) Friend, M.T., Martin, J.S., Connon Smith, R. & Jones, D.H.P. 1990, MNRAS, 246, 637
- González Hernández et al. (2014) González Hernández, J.I., Rebolo, R. & Casares, J. 2014, MNRAS, 438, L21
- Harlaftis et al. (1996) Harlaftis, E.T., Horne, K. & Filippenko, A.V. 1996, PASP, 108, 762
- Harlaftis et al. (1997) Harlaftis, E.T., Steeghs, D., Horne, K. & Filippenko, A.V. 1997, AJ, 114, 1170
- Hirose & Osaki (1990) Hirose, M. & Osaki, Y. 1990, PASJ, 42, 135
- Littlefair et al. (2008) Littlefair, S.P. et al. 2008, MNRAS, 388, 1582
- Long & Gilliland (1999) Long, K.S. & Gilliland, R.L. 1999, ApJ, 511, L916
- Macias et al. (2011) Macias, P. et al. 2011, Bulletin of the American Astronomical Society, Vol. 43, 2011
- Marsh et al. (1994) Marsh, T.R., Robinson, E.L. & Wood, J.H. 1994, MNRAS, 266, 137
- Mata Sánchez et al. (2015) Mata Sánchez, D., Muñoz-Darias, T., Casares, J., Corral-Santana, J.M. & Shahbaz, T. 2015, MNRAS, 454, 2199
- Morales-Rueda et al. (2002) Morales-Rueda, L., Still, M.D., Roche, P., Wood, J.H. & Lockley, J.J. 2002, MNRAS, 329, 597
- North et al. (2002) North, R.C., Marsh, T.R., Kolb, U., Dhillon, V.S. & Moran, C.K.J. 2002, MNRAS, 313, 383
- Orosz et al. (2011) Orosz, J.A. et al. 2011, ApJ, 730, 75
- Paczynski (1977) Paczyński, B. 1977, ApJ, 216, 822
- Papaloizou & Pringle (1977) Papaloizou, J. & Pringle, J.E. 1977, MNRAS, 181, 441
- Reid et al. (2014) Reid, M.J., McClintock, J.E., Steiner, J.F., Steeghs, D., Remillard, R.A., Dhawan, V. & Narayan, R. 2014, ApJ, 796, 2
- Savoury et al. (2012) Savoury, C.D.J., Littlefair, S.P., Marsh, T.R., Dhillon, V.S., Parsons, S.G., Copperwheat, C.M. & Steeghs, D. 2012, MNRAS, 422, 469
- Shahbaz et al. (2014) Shahbaz, T., Watson, C.A. & Dhillon, V.S. 2014, MNRAS, 440, 504
- Southworth et al. (2009) Southworth, J., Hickman, R.D.G., Marsh, T.R., Rebassa-Mansergas, A., Gänsicke, B.T., Copperwheat, C. M. & Rodríguez-Gil, P. 2009, A&A, 507, 929
- Steeghs et al. (2007) Steeghs, D., Howell, S.B., Knigge., C., Gänsicke, B.T., Sion, E.M. & Welsh, W. 2007, ApJ, 667, 442
- Tanaka & Shibazaki (1996) Tanaka, Y. & Shibazaki, N. 1996, ARA&A, 34, 607
- Tomsick et al. (2002) Tomsick, J.A., Heindl, W.A., Chakrabarty, D. & Kaaret, P. 2002, ApJ, 581, 570
- Wade & Horne (1988) Wade, R.A. & Horne, K. 1988, MNRAS, 324, 411
- Wood & Horne (1990) Wood, J. & Horne, K. 1990, MNRAS, 242, 606
- Wu et al. (2015) Wu, J. et al. 2015, ApJ, 806, 92

| Object | q | DP/FWHM | ref |
|---|---|---|---|
| Black Holes | |||
| V404 Cyg | 0.067 0.005 | 0.5636 0.0024 | 1 |
| BW Cir | 0.12 0.03 | 0.5534 0.0032 | 2 |
| XTE J1550 -564 | 0.033 0.008 | 0.5705 0.0039 | 3 |
| N. Oph 77 | 0.014 0.016 | 0.5991 0.0119 | 4 |
| N. Mus 91 | 0.079 0.007 | 0.5679 0.0037 | 5 |
| GS 2000+25 | 0.042 0.012 | 0.5801 0.0094 | 6 |
| A0620-00 | 0.067 0.010 | 0.5766 0.0013 | 7 |
| N Vel 93 | 0.055 0.010 | 0.5689 0.0038 | 8 |
| XTE J1118+480 | 0.024 0.009 | 0.5873 0.0010 | 9 |
| Neutron Stars | |||
| Cen X-4 | 0.176 0.003 | 0.5446 0.0001 | 10 |
| XTE J2123-058 | 0.37 0.15 | 0.5298 0.0234 | 11 |
References. — (1) Casares (1996); (2) Casares et al. (2009a); (3) Orosz et al. (2011); (4) Harlaftis et al. (1997); (5) Wu et al. (2015); (6) Harlaftis et al. (1996); (7) Marsh et al. (1994); (8) Macias et al. (2011); (9) Calvelo et al. (2009); (10) Shahbaz et al. (2014); (11) Tomsick et al. (2002) .
| Object | q | DP/FWHM | ref |
|---|---|---|---|
| GK Per | 0.55 0.21 | 0.5551 0.0007 | 1 |
| SDSS J100658.40+233724 | 0.51 0.08 | 0.5402 0.0013 | 2 |
| U Gem | 0.359 0.013 | 0.5663 0.0013 | 3,4 |
| IP Peg | 0.32 0.08 | 0.5760 0.0035 | 5 |
| CTCV J1300-3052 | 0.25 0.03 | 0.5681 0.0007 | 6 |
| HT Cas | 0.150 0.015 | 0.5825 0.0027 | 7 |
| OY Car | 0.102 0.003 | 0.6100 0.0003 | 8 |
| V2051 Oph | 0.19 0.03 | 0.5737 0.0043 | 9 |
| SDSS 103533.02+055158.3 | 0.055 0.002 | 0.6311 0.0016 | 8 |
| WZ Sge | 0.088 0.013 | 0.6150 0.0007 | 10 |
| SDSS J143317.78+101123.3 | 0.069 0.003 | 0.5777 0.0025 | 8 |
Note. — values for GK Per, IP Peg and CTCV J1300-3052 have been obtained through the technique while those for U Gem and WZ Sge by measuring the radial velocity curves of the white dwarf and the donor star. The remaining values are derived by modeling the eclipses of the white dwarf and the hot-spot in optical light curves.