Analysis of the ground level enhancements on 14 July 2000 and on 13 December 2006 using neutron monitor data
Abstract
On the basis of neutron monitor data we estimate the energy spectrum, anisotropy axis direction and pitch-angle distribution of solar energetic particles during two major ground level enhancements (GLE 59 on 14 July 2000 and GLE 70 on 13 December 2006). For the analysis we use a newly computed neutron monitor yield function. The method consists of several consecutive steps: definition of the asymptotic viewing cones of neutron monitor stations considered for the data analysis by computations of cosmic ray particles propagation in a model magnetosphere with the MAGNETOCOSMICS code; computation of the neutron monitor model responses and derivation of the solar energetic particle characteristics on the basis of inverse problem solution. The pitch-angle distribution and rigidity spectrum of high-energy protons are obtained as function of time in the course of ground level enhancements. A comparison with previously reported results is performed and reasonable agreement is achieved. A discussion of the obtained results is included as well their possible application is included.
Keywords:Solar eruptive events, Neutron Monitor, Yield function solution
For contact: alexander.mishev@oulu.fi; ilya.usoskin@oulu.fi
1 Introduction
A thorough analysis of solar energetic particle (SEP) events provides crucial information on particle scattering and transport in the interplanetary medium as well as understanding of their acceleration mechanisms (Debrunner et al., 1988; Lockwood, Debrunner, and Flükiger, 1990; Kallenrode, Cliver, and Wibberenz, 1992; Reames, 1999). Some solar flares and eruptive events, such as coronal mass ejections (CMEs), can accelerate protons and other ions to high energies (Cliver, Kahler, and Reames, 2004; Dorman, 2006; Reames, 2009b, a; Aschwanden, 2012, and references therein). Such SEPs can enter the Earth atmosphere sporadically, with a greater probability during maximum and declining phase of a solar activity cycle (e.g. Shea and Smart, 1990).
High-energy particles, mostly protons and -particles, of extra-solar origin known as galactic cosmic rays (GCR) constantly hit the Earth atmosphere. They induce a complicated atmospheric nuclear–electromagnetic–muon cascade (see Dorman (2004); Bazilevskaya et al. (2008) and references therein). Occasionally the energy of SEPs is large enough ( 1 GeV/nucleon) to initiate a similar atmospheric cascade leading to an enhancement of count rate of ground-based detectors, specifically neutron monitors (NMs). This special class of SEP events is called ground-level enhancements (GLEs). The worldwide network of NMs (e.g. Mavromichalaki et al., 2011) represents a multi-instrumental tool for continuous monitoring of the intensity of CR particles as well as the registration of GLEs (Simpson, Fonger, and Treiman, 1953; Hatton, 1971).
The NM stations are spread over the globe at multiple geographic locations in order to obtain a complete picture of cosmic rays in space, since their intensity is not uniform around the Earth (Bieber and Evenson, 1995). This is particularly important for GLEs, which possess an essential anisotropic part, specifically during the event’s onset (Debrunner et al., 1988; Shea and Smart, 1990; Vashenyuk et al., 2006b; Bütikofer et al., 2009). Therefore, measurements performed by the worldwide network of NMs form the basis to assess the spectral and angular characteristics of SEPs near Earth. In addition, it was recently shown that spectral and angular characteristics of SEPs derived using NM data are model dependent (Bütikofer and Flückiger, 2013), mainly due to assumed NM yield function(s), magnetospheric model(s) (for details see Bütikofer et al. (2013)). In this study we use an established method for the analysis of GLEs based on NM data but applying a newly computed neutron monitor yield function (Mishev, Kocharov, and Usoskin, 2014). We study two major events, namely GLE 59 on 14 July 2000 and GLE 70 on 13 December 2006.
2 Modelling the neutron monitor response
In order to derive the SEPs characteristics, it is necessary to establish a relationship between NM count rates and the primary particle flux, considering the full complexity of particle transport in the geomagnetosphere and in the Earth atmosphere (Debrunner and Brunberg, 1968; Hatton, 1971; Smart, Shea, and Flückiger, 2000; Dorman, 2004; Desorgher et al., 2009; Mishev and Usoskin, 2013). A convenient formalism for relation between NM count rate and primary particle flux is based on yield function (for details see e.g. Hatton, 1971; Clem and Dorman, 2000, and references therein). In this study, we use a recently computed NM yield function, which considers the finite lateral extent of cosmic ray induced atmospheric cascade and provides good agreement with experimental latitude surveys (Mishev and Usoskin, 2013; Mishev, Usoskin, and Kovaltsov, 2013).
An analysis of GLEs based on NM data consists of several consecutive steps: determination of asymptotic viewing cones of the NMs by computation of particle trajectories in a model magnetosphere; assumption of an initial guess of the inverse problem; application of an optimization procedure (inverse method) for derivation of the primary SEPs’ energy spectrum, anisotropy axis direction and pitch angle distribution. A detailed description of the method is given elsewhere (Mishev, Kocharov, and Usoskin, 2014). The method is similar to that used by Shea and Smart (1982); Humble et al. (1991); Cramp et al. (1997); Bombardieri et al. (2006); Vashenyuk et al. (2006b, 2008).
The relative count rate increase of a given NM can be expressed as:
| (1) |
where is the rigidity spectrum of the primary solar particles in the direction of the maximal flux, is the rigidity spectrum of GCR at given time with the corresponding modulation, Y(P) is the NM yield function, is the pitch angle distribution of SEPs, is the count rate due to GCR, is the count rate increase due to solar particles, is the minimum rigidity cut-off of the station, accordingly is the maximum rigidity of SEPs considered in the model, assumed to be 20 GV, which is sufficiently high for SEPs. The fractional increase of the count rate of a NM station represents the ratio between the NM count rates due to SEPs and GCR averaged over 2 hours before the event’s onset. In our model we assume a modified power law rigidity spectrum of SEP similarly to Cramp, Humble, and Duldig (1995); Cramp et al. (1997); Bombardieri et al. (2006); Vashenyuk et al. (2008):
| (2) |
where is particle flux arriving from the Sun along the axis of symmetry whose direction is defined by geographic coordinate angles and , is the power-law spectral exponent at rigidity P = 1 GV, is the rate of the spectrum steepening. The pitch angle distribution is assumed to be a Gaussian:
| (3) |
where is the pitch angle, is parameter corresponding to the width of the pitch angle distribution. The pitch angle is defined as the angle between the asymptotic direction and the axis of anisotropy. Therefore according to equations (1) to (3) six parameters have to be determined: , , , and , .
In our study, for the computation of rigidity cut-offs and asymptotic directions of the allowed trajectories (Cooke et al., 1991) we use the combination of International Geomagnetic Reference Field (IGRF) geomagnetic model (epoch 2010) as the internal field model (Langel, 1987) and the Tsyganenko 89 model as external field (Tsyganenko, 1989). This combination provides the most efficient computation of asymptotic directions as well as a balance between simplicity and realism (Kudela and Usoskin, 2004; Kudela, Bučik, and Bobik, 2008; Nevalainen, Usoskin, and Mishev, 2013). All computations of particle’s transport in the geomagnetic field are performed with the MAGNETOCOSMICS code (Desorgher et al., 2005).
For the GCR spectrum we apply a parametrisation based on the force-field model (Gleeson and Axford, 1968; Caballero-Lopez and Moraal, 2004). Full details of the application of the model are given elsewhere (Usoskin et al., 2005). The solar modulation parameter is taken from Usoskin, Bazilevskaya, and Kovaltsov (2011). For the solution of the inverse problem we use the Levenberg-Marquardt algorithm (LMA) (Levenberg, 1944; Marquardt, 1963) with the Minpack code (More, Garbow, and Hillstrom, 1980). The optimization is performed by minimization of the difference between the modelled NM responses and the measured NM responses i.e. optimization of the functional over the vector of unknowns and NM stations:
| (4) |
3 Results of the analysis
In total 16 GLEs were observed during the Solar Cycle 23 (Andriopoulou et al., 2011a, b; Gopalswamy et al., 2012). The strongest event, namely GLE 69 on 20 January 2005 was analysed elsewhere (Vashenyuk et al., 2006a; Plainaki et al., 2007; Bombardieri et al., 2008; Perez-Peraza et al., 2008; Bütikofer et al., 2009; Bieber et al., 2013). Here we focus on two major events: GLE 59 on 14 July 2000 also known as the Bastille day event and GLE 70 on 13 December 2006.
3.1 The Bastille day GLE 59 on 14 July 2000
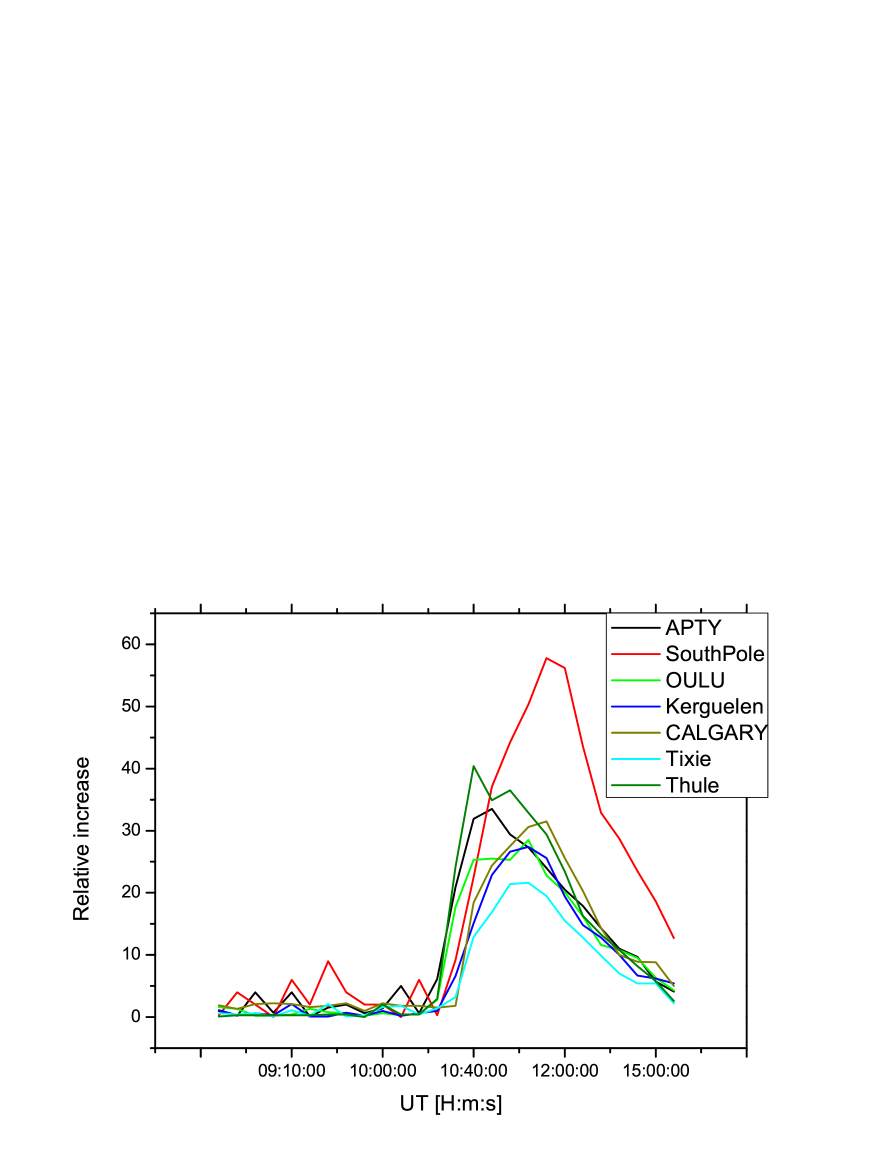
The second decade of July 2000 was characterized by intense solar activity extending from 10 to 15 of July. During this period three X-class flares (including the Bastille Day flare) and two halo CMEs were produced (Dryer et al., 2001). The GLE 59 event was related to the Bastille day X5.8/3B solar flare and the associated full halo CME. It started at 10:03 UT, reached peak at 10:24 UT and ended at 10:43 UT (Klein et al., 2001). Accordingly, the GLE onset began between 10:30 and 10:35 UT at several stations (Figure 1). The strongest NM increases were observed at the South Pole (58.3 ) and SANAE (54.4 ) compared to pre-increase levels. In general the event was characterized by a large anisotropy in its initial phase (Bieber et al., 2002; Bombardieri et al., 2006; Vashenyuk et al., 2006b).
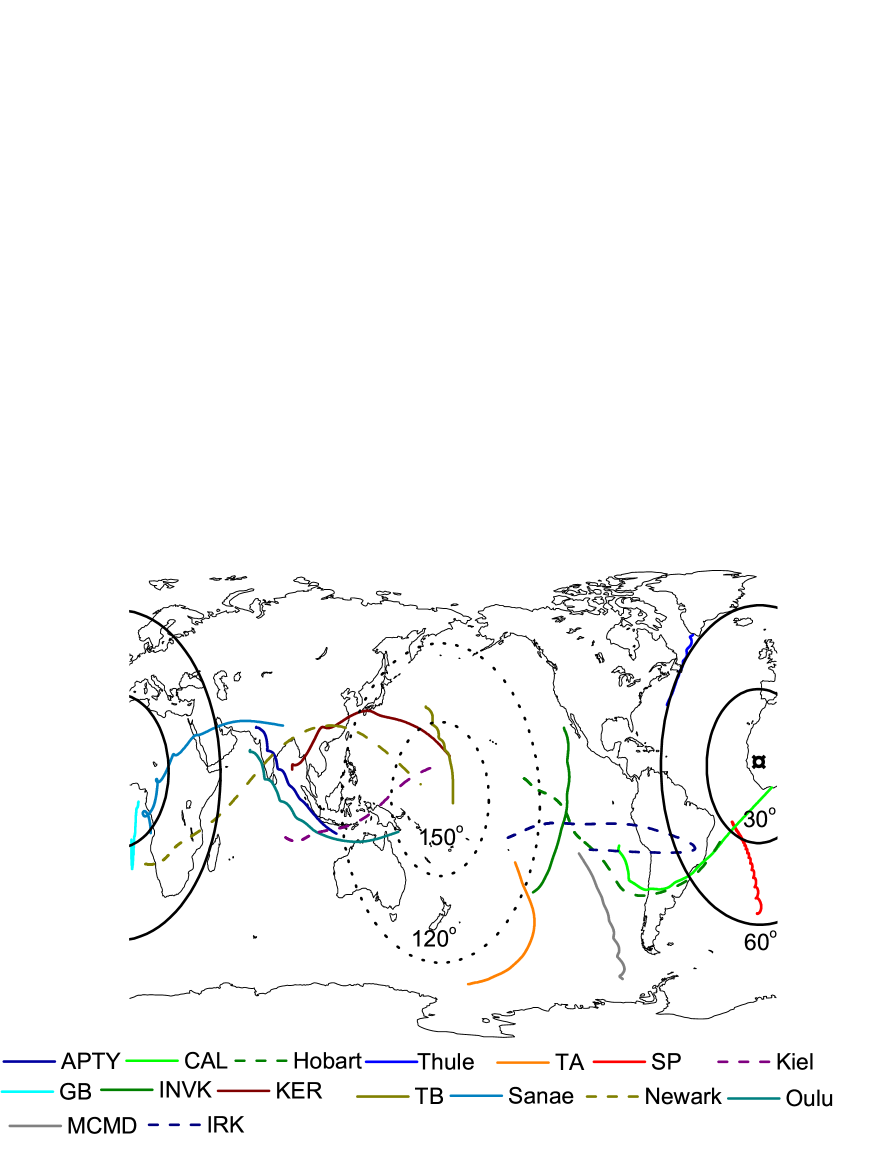
An illustration of several computed asymptotic cones used for our analysis is shown in Figure 2. The full list of NMs used in this analysis is given below (Table 3). The computations were carried out with the MAGNETOCOSMICS code using Tsyganenko 1989 (external field model) and International Geomagnetic Reference Field (IGRF) (internal field model) geomagnetic models, adjusted to the measured index and 2000 epoch. Here we present the asymptotic directions in the rigidity range from 1 to 5 GV in order to demonstrate the range of maximal response, while in the analysis we used the 1-20 GV rigidity range.
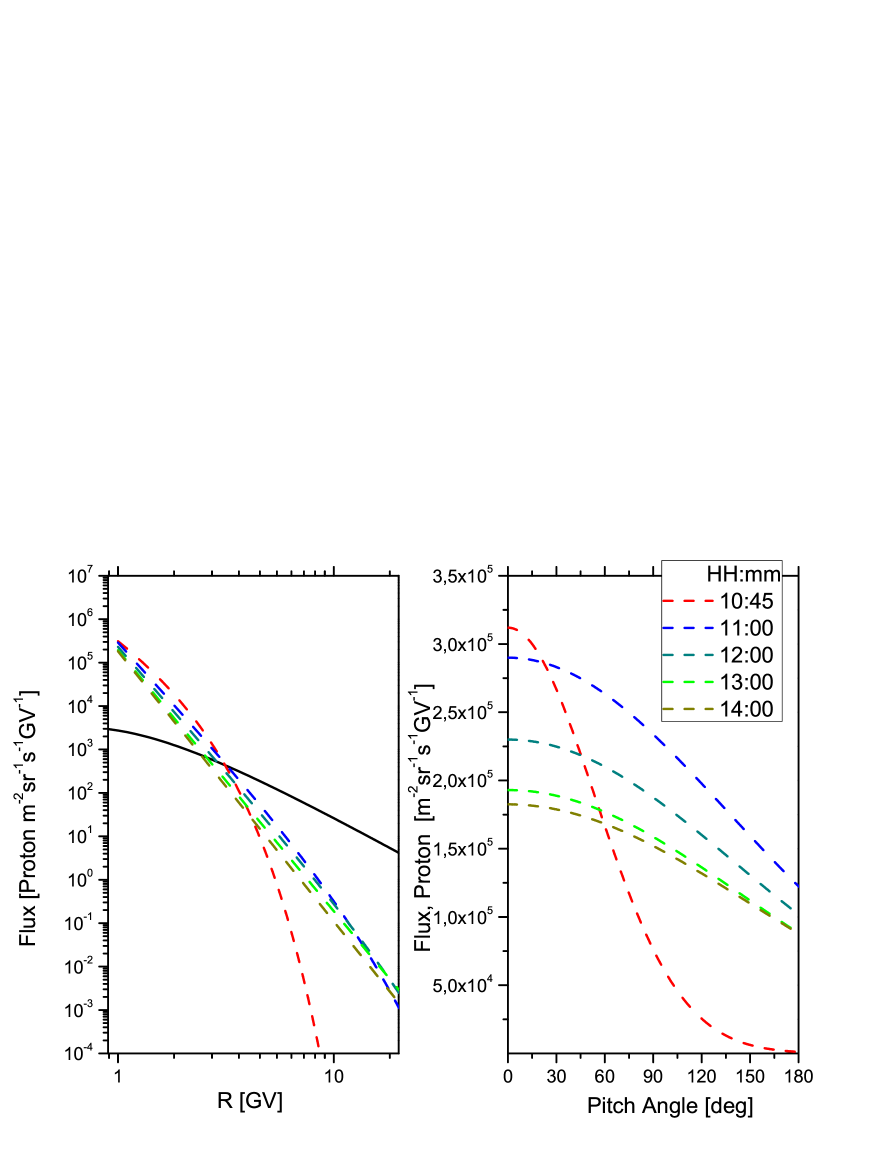
For the analysis we considered 5-min NM data retrieved from GLE database (Usoskin et al., 2015). The derived rigidity spectra with the anisotropy characteristics of the high-energy SEP are presented in Figure 3. During the event’s onset, SEPs had a hard rigidity spectrum and strong anisotropy as it was observed by NM stations with small pitch-angles.
The left-hand panel of Figure 3 demonstrates the obtained rigidity spectrum during various stages of the event. The corresponding pitch angle distributions are presented in the right-hand panel of Figure 3. One can see that the rigidity spectrum was gradually softening throughout the event. The steepening varied throughout the event. It resulted in a moderate steepening of the spectrum during the early phase and only a slight steepening during the late phase of the event. Moreover, vanished after 13:00 UT so that the derived rigidity spectra can be described by a pure power law. The derived anisotropy was high during the event’s onset. It rapidly dropped to a low, relatively steady level so that the SEPs angular distribution considerably broadened out after the initial phase of the event. We can conclude that the event was isotropised very fast, leading to a nearly isotropic SEP flux after 11:00 UT. The derived spectral and anisotropy characteristics are summarized in Table 1.
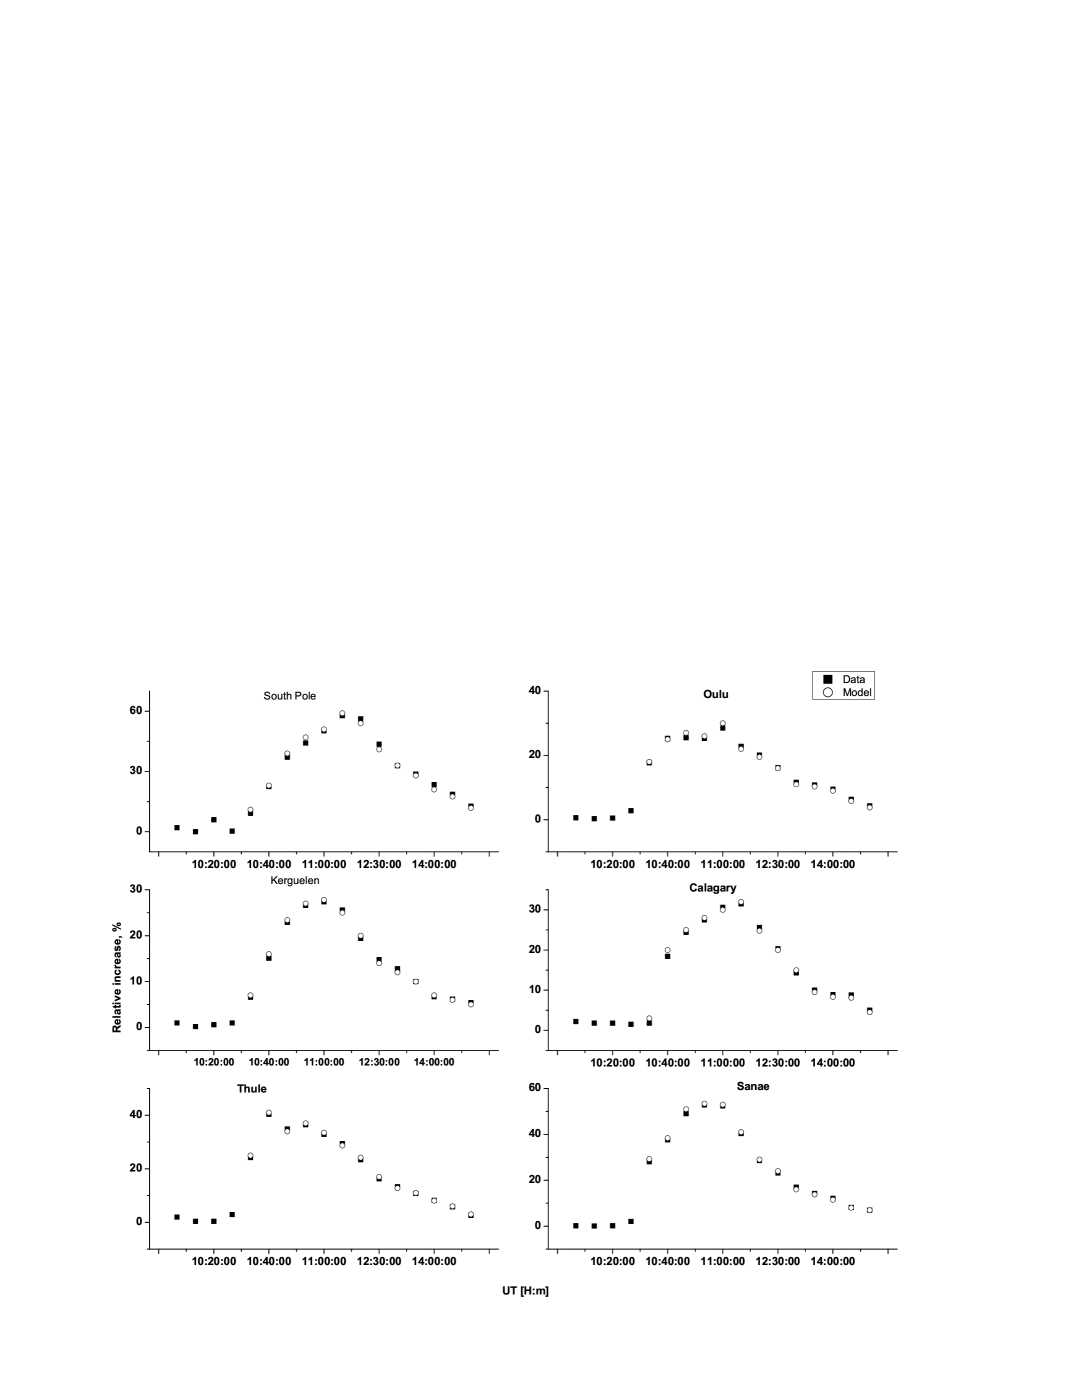
The quality of the modelling is demonstrated by comparison between the modelled and observed responses of NMs during the GLE 59. Here we present a comparison for several NM stations (Figure 4), but the quality of the fit is similar for the other NM stations. Since there is no dramatic change of the derived SEP characteristics after 11:00 UT (gradual softening of the rigidity spectrum and isotropic phase), in order to present detailed information throughout the whole event, the X axis (Time) in Figure 4 is not uniform.
A detailed analysis of confidence limits of the derived model parameters is rather difficult, because of strong non-linearity and complexity of the model as well as a significant correlation between the fit parameters (Dennis and Schnabel, 1996; Aster, Borchers, and Thurber, 2005). We examine the squared difference between the observed and calculated increases. We achieve less than 5 relative difference between modelled and observed NM relative increases. Note that in the analysis we employed a natural initial guess similarly to Bombardieri et al. (2006), i.e. that the apparent source position is located along the interplanetary magnetic field (IMF) line derived from the ACE satellite measurements (otherwise the initial guess is similar to that of Cramp, Humble, and Duldig (1995)). According to our analysis a small variation of the input (initial guess) does not alter the solution. In case when the initial guess is far from the local minimum (the LMA converges to the global minimum only if the initial guess is close to the final solution (Dennis and Schnabel, 1996)), the derived solution of the inverse problem possess greater residual compared to that with a natural initial guess or it is not physical.
| Integration interval [UT] | [] | [rad 2] | [degrees] | [degrees] | ||
|---|---|---|---|---|---|---|
| 10:35–10:40 | 273000 | 4.47 | 0.81 | 1.25 | 12.61 | -6.31 |
| 10:40–10:45 | 312000 | 4.25 | 0.8 | 1.75 | 14.32 | -8.02 |
| 10:45–10:50 | 340100 | 4.49 | 0.68 | 2. 5 | 15.46 | -14.32 |
| 10:50–10:55 | 328200 | 4.87 | 0.41 | 4. 5 | 20.62 | -14.89 |
| 10:55–11:00 | 290000 | 5.51 | 0.05 | 11. 5 | 10.88 | -12.65 |
| 11:25–11:30 | 272000 | 5.52 | 0.05 | 11. 8 | 14.32 | -16.04 |
| 11:55–12:00 | 230000 | 5.74 | 0.02 | 12. 1 | 6.3 | -21.19 |
| 12:25–12:30 | 195200 | 5.83 | 0.03 | 12. 5 | 8.59 | -23.49 |
| 12:55–13:00 | 193000 | 6.01 | 0.0 | 12. 6 | 6.28 | -25.78 |
| 13:25–13:30 | 187100 | 6.15 | 0.0 | 13. 1 | 6.87 | -29.22 |
| 13:55–14:00 | 182500 | 6.22 | 0.0 | 13. 5 | 6.91 | -32.65 |
| 14:55–15:00 | 178500 | 6.5 | 0.0 | 14. 2 | 8.59 | -35.52 |
| 15:55–16:00 | 165000 | 7.1 | 0.0 | 15.0 | 5.72 | -38.39 |
3.2 The GLE 70 on 13 December 2006
The second event considered for analysis in this study is one of the strongest events of Solar Cycle 23. The month of December 2006 was at the declining phase of the solar cycle close to the minimum. However, on 13 December 2006, NOAA active region 10930, located at S06W26, triggered a X3.4/4 B solar flare which reached maximum at 2:40 UT. It was associated with Type II and Type IV radio bursts and a fast full-halo CME accompanied by a strong solar proton event (for details see e.g. Gopalswamy et al., 2012; Moraal and McCracken, 2012, and references therein). The worldwide network of NMs recorded the event with maximum seen at Oulu NM 90 at 5 min data) (Figure 5). It was classified as GLE 70.
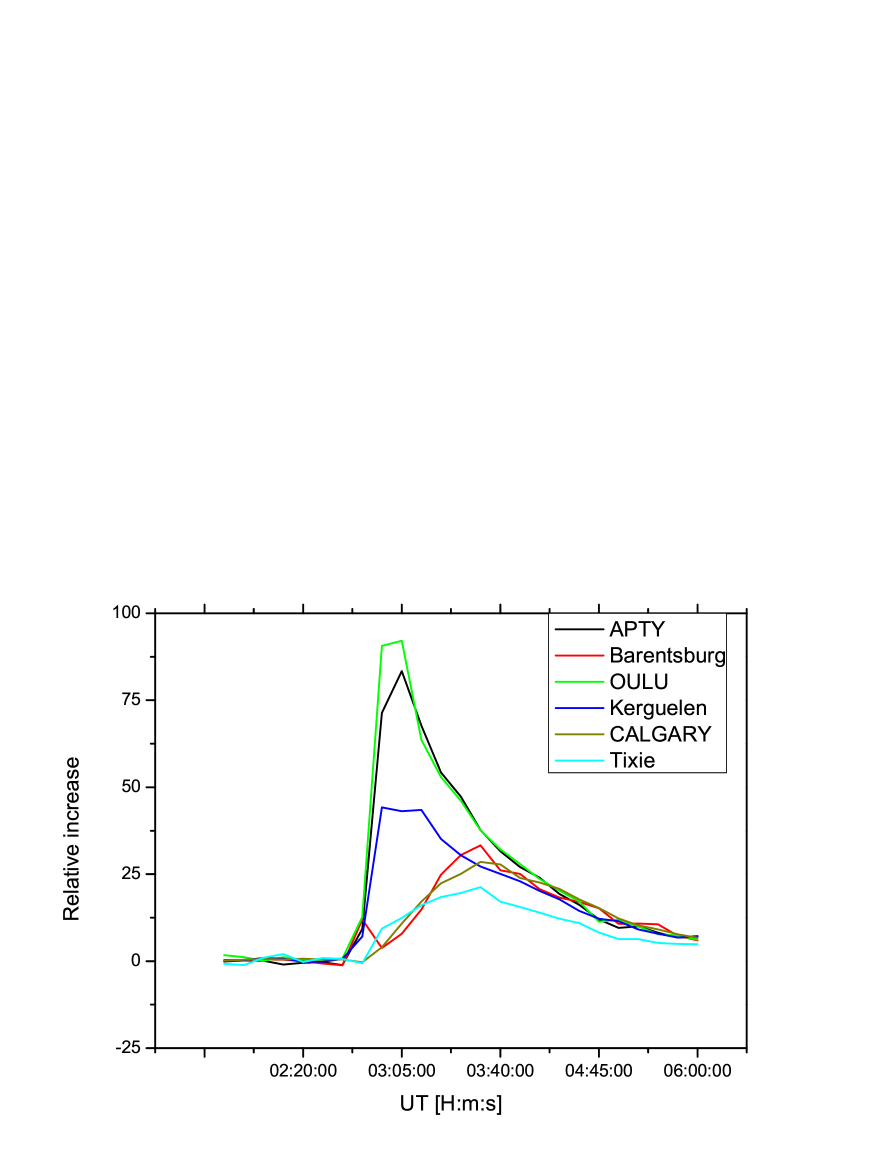
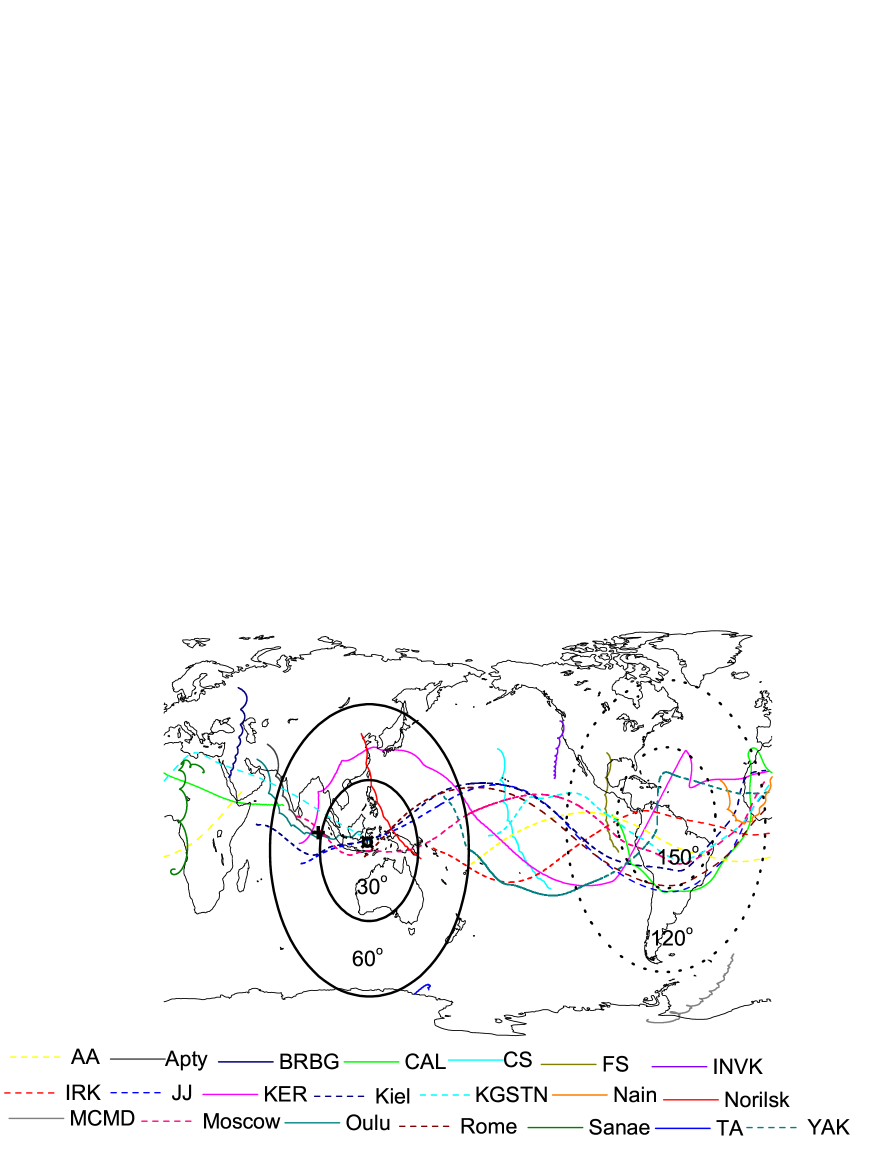
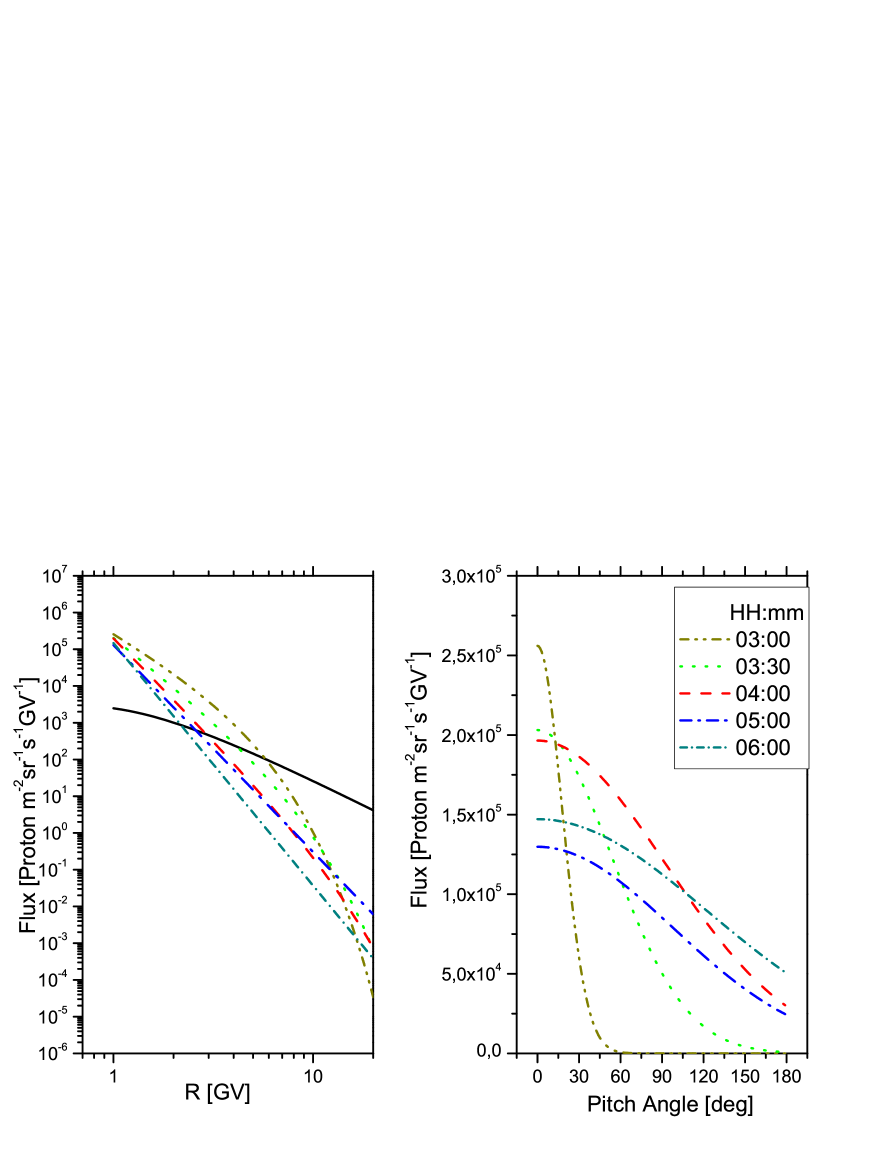
Similarly to some other events it was characterized by a large anisotropy in the initial phase (Bütikofer et al., 2009; Vashenyuk et al., 2008; Plainaki et al., 2009). Here for the analysis we consider 5-min NM data retrieved from GLE database (Usoskin et al., 2015). An illustration of several computed asymptotic cones of NMs used for the analysis is shown in Figure 6. The full list of NMs used in this analysis is given in Table 3. Similarly to the previous case, the computations are carried out with the MAGNETOCOSMICS code using Tsyganenko 1989 (external field model) and IGRF (internal field model) geomagnetic models, adjusted to the measured index and 2000 epoch. The derived rigidity spectra with the corresponding anisotropy characteristics are shown in Figure 7. During the event’s onset, SEPs had a hard spectrum, strong anisotropy of a beam like SEP flux, which have been observed by NM stations with small pitch-angles. As an example, Oulu and Barentsburg NMs showed very different responses, despite their close geographic location and rigidity cut-offs. A summary of the derived spectral and angular characteristics for GLE 70 on 13 December 2006, as well as NM integration period and apparent source position is given in Table 2.
| Integration interval [UT] | [m-2 s-1 sr-1 GV-1] | [rad 2] | [degrees] | [degrees] | ||
|---|---|---|---|---|---|---|
| 03:00–03:05 | 256000 | 3.41 | 0.22 | 0.19 | -17 | 148 |
| 03:05–03:10 | 356500 | 3.71 | 0.3 | 0.28 | -16 | 154 |
| 03:10–03:15 | 216800 | 4.25 | 0.2 | 0.3 | -14 | 145 |
| 03:15–03:20 | 206000 | 4.31 | 0.1 | 0.85 | -13 | 160 |
| 03:20–03:25 | 205000 | 4.32 | 0.2 | 1.2 | -13 | 137 |
| 03:25–03:30 | 203100 | 4.43 | 0.11 | 1.77 | -11 | 131 |
| 03:30–03:35 | 200000 | 4.5 | 0.1 | 1.81 | -10 | 126 |
| 03:35–03:40 | 200000 | 4.75 | 0.08 | 1.85 | -10 | 128 |
| 03:40–03:45 | 204900 | 5.2 | 0.1 | 2.01 | -7 | 122 |
| 03:45–03:50 | 202500 | 5.46 | 0.12 | 2.3 | -5 | 120 |
| 03:50–03:55 | 201800 | 5.48 | 0.1 | 3.5 | -5 | 117 |
| 03:55–04:00 | 196500 | 5.52 | 0.05 | 5.19 | -1 | 120 |
| 04:10–04:15 | 185203 | 5.62 | 0.04 | 5.8 | 0.1 | 118 |
| 04:25–04:30 | 150000 | 5.69 | 0.001 | 5.68 | 5 | 115 |
| 04:40–04:45 | 135920 | 5.65 | 0 | 6.47 | 10 | 111 |
| 04:55–05:00 | 129800 | 5.63 | 0 | 5.87 | 13 | 110 |
| 05:10–05:15 | 145325 | 6.15 | 0 | 6.63 | 15 | 108 |
| 05:25–05:30 | 135320 | 6.12 | 0 | 6.68 | 14 | 107 |
| 05:40–05:45 | 125050 | 6.19 | 0 | 7.1 | 14 | 105 |
| 05:55–06:00 | 147150 | 6.6 | 0 | 9.2 | 15 | 95 |
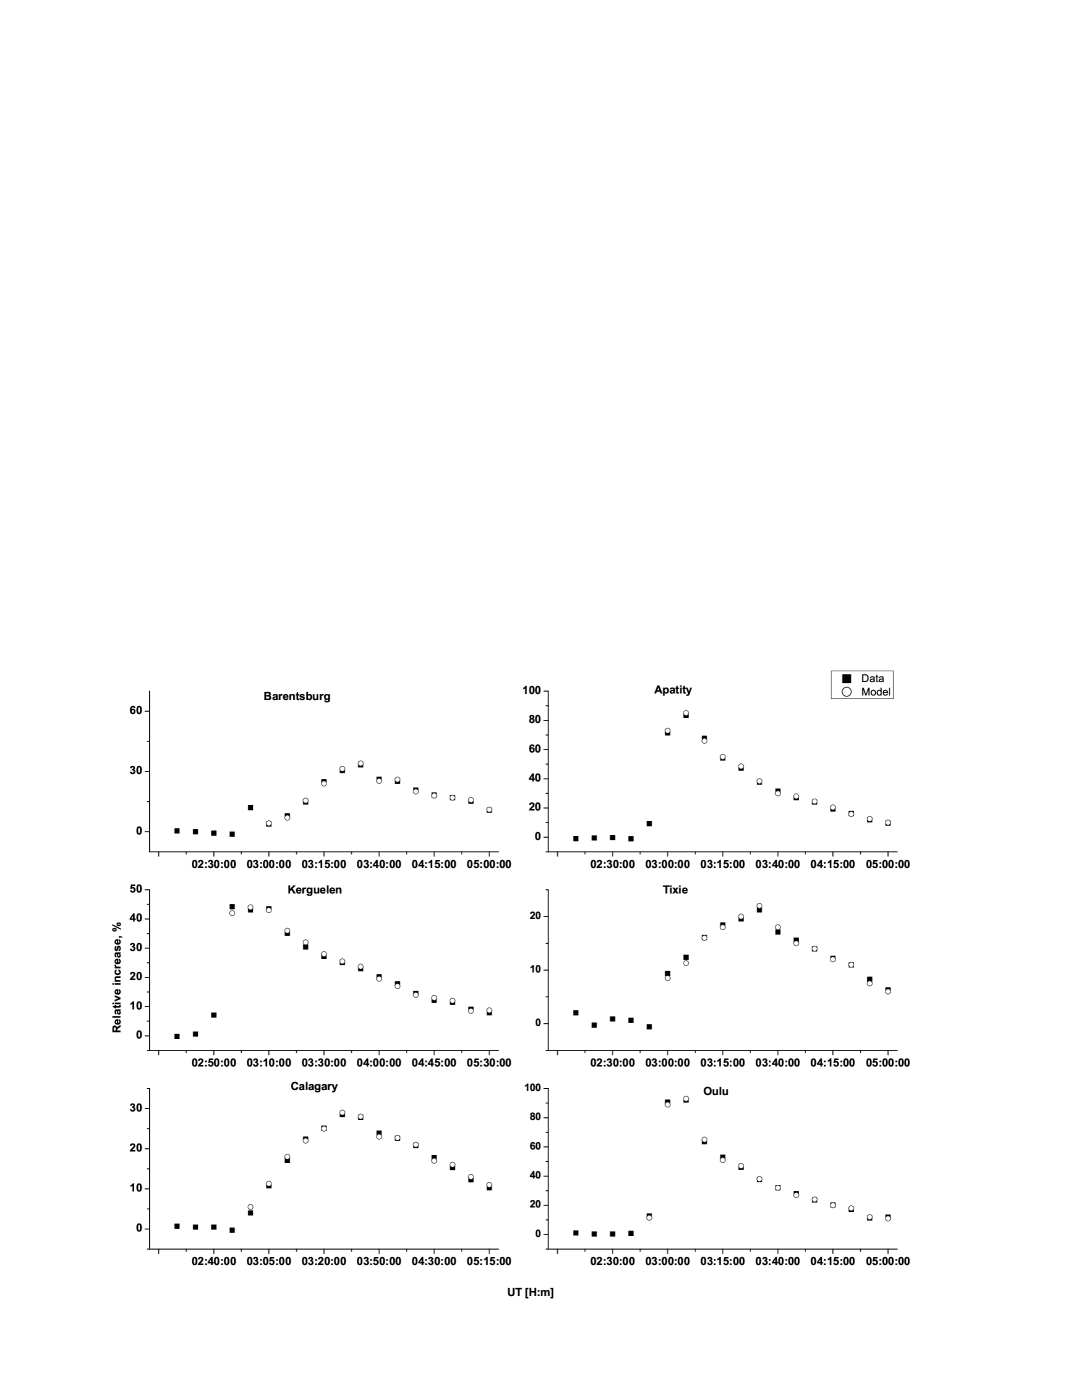
The quality of the modelling is demonstrated in Figure 8, where the model and observed responses of several NMs are compared. The quality of the fit is similar for the other NM stations. Similarly to Figure 4, the X axis (Time) in Figure 8 is not uniform.
The analysis similar to the previous one shows an achieved maximal relative difference of about 3-6 between modelled and observed NM relative increase. The full list of NMs used for the analysis of both events is given in Table 3.
| Station | latitude [deg] | Longitude [deg] | [GV] | Altitude [m] | GLE 59 | GLE 70 |
|---|---|---|---|---|---|---|
| Alma Ata (AA) | 43.25 | 76.92 | 6.67 | 3340 | x | x |
| Apatity (Apty) | 67.55 | 33.33 | 0.48 | 177 | x | x |
| Barentsburg (BRBG) | 78.03 | 14.13 | 0 | 70 | 0 | x |
| Calgary (Cal) | 51.08 | 245.87 | 1.04 | 1128 | x | x |
| Cape Schmidt (CS) | 68.92 | 180.53 | 0.41 | 0 | 0 | x |
| Forth Smith (FS) | 60.02 | 248.07 | 0.25 | 0 | 0 | x |
| Goose Bay (GB) | 23.27 | 299.60 | 0.52 | 46 | x | 0 |
| Hermanus (HRMS) | -34.42 | 19.22 | 4.90 | 26 | x | x |
| Hobart (HBRT) | -42.92 | 147.24 | 1.88 | 0 | x | 0 |
| Inuvik (INVK) | 68.35 | 226.28 | 0.16 | 21 | x | x |
| Irkutsk (IRK) | 52.58 | 104.02 | 3.23 | 435 | x | x |
| Jungfraujoch (JJ) | 46.55 | 7.98 | 4.46 | 3476 | x | x |
| Kerguelen (Ker) | -49.35 | 70.25 | 1.01 | 33 | x | x |
| Kiel | 54.33 | 10.13 | 2.22 | 54 | x | x |
| Kingston (KGSTN) | -42.99 | 147.29 | 1.75 | 65 | x | x |
| Lomnicky Štit (LS) | 49.2 | 20.22 | 3.72 | 2634 | x | x |
| Magadan (MAG) | 60.12 | 151.02 | 1.84 | 220 | x | x |
| Mawson (MWSN) | -67.60 | 62.88 | 0.22 | 0 | x | x |
| McMurdo (MCMD) | -77.85 | 166.72 | 0 | 48 | x | x |
| Moscow (MOS) | 55.47 | 37.32 | 2.13 | 200 | x | x |
| Nain | 56.55 | 298.32 | 0.28 | 0 | 0 | x |
| Newark (NWRK) | 39.70 | 284.30 | 1.97 | 50 | x | 0 |
| Norilsk | 69.26 | 88.05 | 0.52 | 0 | 0 | x |
| Oulu | 65.05 | 25.47 | 0.69 | 15 | x | x |
| Peawanuck (PWNC) | 54.98 | 274.56 | 0.16 | 52 | 0 | x |
| Rome | 41.86 | 12.47 | 6.19 | 60 | 0 | x |
| Sanae | -71.67 | 357.15 | 0.56 | 856 | x | 0 |
| South Pole (SP) | -90.00 | 0.0 | 0 | 2820 | x | 0 |
| Terre Adelie (TA) | -66.67 | 140.02 | 0 | 45 | x | x |
| Thule | 76.60 | 291.2 | 0.1 | 260 | x | 0 |
| Tixie (TB) | 71.60 | 128.90 | 0.53 | 0 | x | x |
| Yakutsk (YAK) | 62.03 | 129.73 | 1.64 | 105 | x | x |
4 Discussion and Conclusions
The two major events GLE 59 and GLE 70 considered for study in this work occurred at different solar activity conditions. They were also quite different in increase profiles. The GLE 70 depicted a very sharp impulsive-type increase, while GLE 59 had a wider time profile typical for gradual events. This feature may be explained by the position of the flare at the solar disk (Duldig et al., 1995; Cramp et al., 1997).
The events were characterized by relatively strong anisotropy during the initial phase, which decreased rapidly over the following 30 minutes for GLE 59, accordingly 50-60 minutes for GLE 70. The strong anisotropy of SEPs during both event onsets indicates focused transport conditions in the interplanetary medium. In addition, we studied the likelihood of bidirectional arrival of SEPs, namely by modelling the NM response assuming a two flux event and a complicated shape of pitch angle distribution (see Mishev, Kocharov, and Usoskin (2014)) similarly to Vashenyuk et al. (2006a) who found a clear signature of bidirectional flux for the GLE 69 on 20 January 2005. In this case analysis we found no evidence of particles arriving from other but sunward directions. The rapid increase of NM response of stations in the antisunward direction such as Tixie for GLE 59 is most-likely due to scattering processes (Bieber et al., 2002).
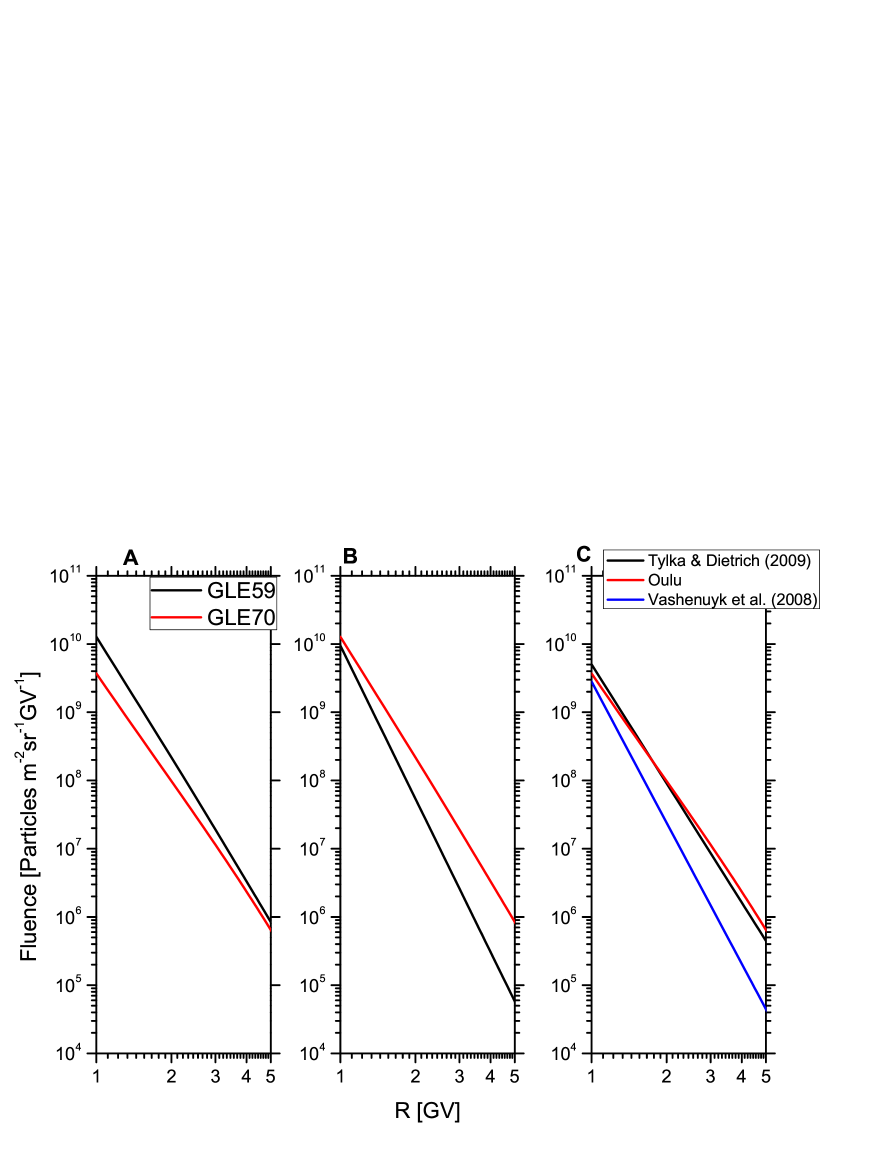
The particle fluences (rigidity, time and angle integrated particle flux) of both events are compared (Figure 9a). The particle fluence during the Bastille day event is greater than during the GLE 70 event. This is consistent with recent findings based on both satellite-borne and NMs data analysis (Tylka and Dietrich, 2009). The fluence during Bastille day event is compared with recent estimations (Figure 9b) (Tylka and Dietrich, 2009). The observed discrepancy is most likely due to different reconstruction methods and model assumptions. In (Tylka and Dietrich, 2009) a simplified analysis of NM data is used and different spectral shape, namely band function is employed.
A reasonable agreement is achieved for GLE 70 event (Figure 9c). In addition, on Figure 9c is compared the particle fluence using the reconstructions by Vashenyuk et al. (2008), where a discrepancy in particle fluence is observed, but not in derived rigidity spectra.
In the work presented here, we performed a detailed modelling of spectral and angular characteristics of high energy SEPs in the vicinity of Earth during the the Bastille Day 2000 (GLE 59) event and GLE 70 on 13 December 2006.
The CR particles are the main source of ionization in the troposphere and stratosphere resulting form the induced nuclear-electromagnetic-muon cascade and secondary particle energy loss (Usoskin and Kovaltsov, 2006; Bazilevskaya et al., 2008; Velinov et al., 2013; Mironova et al., 2015). The derived characteristics during the GLEs are useful for further space weather/space climate applications, namely the estimation of ion production rate and ionization effect in the atmosphere similarly to (see e.g. Bazilevskaya et al., 2008; Usoskin et al., 2011; Žigman, Kudela, and Grubor, 2014; Mishev and Velinov, 2015a, b, c).
References
- Andriopoulou et al. (2011a) Andriopoulou, M., Mavromichalaki, H., Plainaki, C., Belov, A., Eroshenko, E.: 2011a, Intense ground-level enhancements of solar cosmic rays during the last solar cycles. Solar Physics 269(1), 155.
- Andriopoulou et al. (2011b) Andriopoulou, M., Mavromichalaki, H., Preka-Papadema, P., Plainaki, C., Belov, A., Eroshenko, E.: 2011b, Solar activity and the associated ground level enhancements of solar cosmic rays during solar cycle 23. Astrophysics and Space Sciences Transactions 7(4), 439.
- Aschwanden (2012) Aschwanden, M.: 2012, GeV particle acceleration in solar flares and ground level enhancement (GLE) events. Space Science Reviews 171(1-4), 3.
- Aster, Borchers, and Thurber (2005) Aster, R.C., Borchers, B., Thurber, C.H.: 2005, Parameter estimation and inverse problems, Elsevier, New York. ISBN 0-12-065604-3.
- Bazilevskaya et al. (2008) Bazilevskaya, G.A., Usoskin, I.G., Flückiger, E.O., Harrison, R.G., Desorgher, L., Bütikofer, B., Krainev, M.B., Makhmutov, V.S., Stozhkov, Y.I., Svirzhevskaya, A.K., Svirzhevsky, N.S., Kovaltsov, G.A.: 2008, Cosmic ray induced ion production in the atmosphere. Space Science Reviews 137, 149.
- Bieber and Evenson (1995) Bieber, J.W., Evenson, P.A.: 1995, Spaceship Earth - an optimized network of neutron monitors. In: Proc. of 24th ICRC Rome, Italy, 28 Auygust - 8 September 1995 4, 1316.
- Bieber et al. (2002) Bieber, J.W., Droge, W., Evenson, P.A., Pyle, K.R., Ruffolo, D., Pinsook, U., Tooprakai, P., Rujiwarodom, M., Khumlumlert, T., Krucker, S.: 2002, Energetic particle observations during the 2000 July 14 solar event. Astrophysical Journal 567(1), 622.
- Bieber et al. (2013) Bieber, J.W., Clem, J., Evenson, P., Pyle, R., Sáiz, A., Ruffolo, D.: 2013, Giant ground level enhancement of relativistic solar protons on 2005 January 20. i. spaceship Earth observations. Astrophysical Journal 771(2).
- Bombardieri et al. (2006) Bombardieri, D.J., Duldig, M.L., Michael, K.J., Humble, J.E.: 2006, Relativistic proton production during the 2000 July 14 solar event: The case for multiple source mechanisms. Astrophysical Journal 644(1), 565.
- Bombardieri et al. (2008) Bombardieri, D.J., Duldig, M.L., Humble, J.E., Michael, K.J.: 2008, An improved model for relativistic solar proton acceleration applied to the 2005 January 20 and earlier events. Astrophysical Journal 682(2), 1315.
- Bütikofer and Flückiger (2013) Bütikofer, R., Flückiger, E.O.: 2013, Differences in published characteristics of GLE 60 and their consequences on computed radiation dose rates along selected flight paths. Journal of Physics: Conference Series 409(1), 012166.
- Bütikofer et al. (2009) Bütikofer, R., Flückiger, E.O., Desorgher, L., Moser, M.R., Pirard, B.: 2009, The solar cosmic ray ground-level enhancements on 20 January 2005 and 13 December 2006. Advances in Space Research 43(4), 499.
- Bütikofer et al. (2013) Bütikofer, R., Flückiger, E.O., Balabin, Y., Belov, A.: 2013, The reliability of GLE analysis based on neutron monitor data - a critical review. In: Proc. of 33th ICRC Rio de Janeiro, Brazil, 2 -9 July 2013, 0863.
- Caballero-Lopez and Moraal (2004) Caballero-Lopez, R.A., Moraal, H.: 2004, Limitations of the force field equation to describe cosmic ray modulation. Journal of Geophysical Research 109, A01101.
- Clem and Dorman (2000) Clem, J., Dorman, L.: 2000, Neutron monitor response functions. Space Science Reviews 93, 335.
- Cliver, Kahler, and Reames (2004) Cliver, E.W., Kahler, S.W., Reames, D.V.: 2004, Coronal shocks and solar energetic proton events. Astrophysical Journal 605, 902.
- Cooke et al. (1991) Cooke, D.J., Humble, J.E., Shea, M.A., Smart, D.F., Lund, N., Rasmussen, I.L., Byrnak, B., Goret, P., Petrou, N.: 1991, On cosmic-ray cutoff terminology. Il Nuovo Cimento C 14(3), 213.
- Cramp, Humble, and Duldig (1995) Cramp, J.L., Humble, J.E., Duldig, M.L.: 1995, The cosmic ray ground-level enhancement of 24 October 1989. In: Proceedings Astronomical Society of Australia 11, 28.
- Cramp et al. (1997) Cramp, J.L., Duldig, M.L., Flückiger, E.O., Humble, J.E., Shea, M.A., Smart, D.F.: 1997, The October 22, 1989,solar cosmic enhancement: ray an analysis the anisotropy spectral characteristics. Journal of Geophysical Research 102(A11), 24 237.
- Debrunner and Brunberg (1968) Debrunner, H., Brunberg, E.: 1968, Monte Carlo calculation of nucleonic cascade in the atmosphere. Canadian Journal of Physics 46, 1069.
- Debrunner et al. (1988) Debrunner, H., Flückiger, E.O., Gradel, H., Lockwood, J.A., McGuire, R.E.: 1988, Observations related to the acceleration, injection, and interplanetary propagation of energetic protons during the solar cosmic ray event on February 16, 1984. Journal of Geophysical Research 93(A7), 7206.
- Dennis and Schnabel (1996) Dennis, J.E., Schnabel, R.B.: 1996, Numerical methods for unconstrained optimization and nonlinear equations, Prentice-Hall, Englewood Cliffs. ISBN 13-978-0-898713-64-0.
- Desorgher et al. (2005) Desorgher, L., Flückiger, E.O., Gurtner, M., Moser, M.R., Bütikofer, R.: 2005, A Geant 4 code for computing the interaction of cosmic rays with the earth’s atmosphere. Internationl Journal of Modern Physics A 20(A11), 6802.
- Desorgher et al. (2009) Desorgher, L., Kudela, K., Flückiger, E.O., Bütikofer, R., Storini, M., Kalegaev, V.: 2009, Comparison of earth’s magnetospheric magnetic field models in the context of cosmic ray physics. Acta Geophysica 57(1), 75.
- Dorman (2004) Dorman, L.: 2004, Cosmic rays in the Earth’s atmosphere and underground, Kluwer Academic Publishers, Dordrecht. ISBN 1-4020-2071-6.
- Dorman (2006) Dorman, L.: 2006, Cosmic ray interactions, propagation, and acceleration in space plasmas, Astrophysics and Space Science Library 339, Springer, Dordrecht. ISBN 13-978-1-4020-5100-5.
- Dryer et al. (2001) Dryer, M., Fry, C.D., Sun, W., Deehr, C., Smith, Z., Akasofu, S.-I., Andrews, M.D.: 2001, Prediction in real time of the 2000 July 14 heliospheric shock wave and its companions during the ’bastille’ epoch. Solar Physics 204(1-2), 267.
- Duldig et al. (1995) Duldig, M.L., Cramp, J.L., Humble, J.E., Smart, D.F., Shea, M.A., Bieber, J.W., Evenson, P., Fenton, K.B., Fenton, A.G., Bendoricchio, M.B.M.: 1995, The ground level enhancements of 1989 September and October 22. In: Proceedings Astronomical Society of Australia 10, 211.
- Gleeson and Axford (1968) Gleeson, L.J., Axford, W.I.: 1968, Solar modulation of galactic cosmic rays. Astrophysical Journal 154, 1011.
- Gopalswamy et al. (2012) Gopalswamy, N., Xie, H., Yashiro, S., Akiyama, S., Mäkelä, P., Usoskin, I.G.: 2012, Properties of ground level enhancement events and the associated solar eruptions during solar cycle 23. Space Science Reviews 171(1-4), 23.
- Hatton (1971) Hatton, C.: 1971, The neutron monitor. In: Progress in Elementary Particle and Cosmic-ray Physics X, North Holland Publishing Co., Amsterdam. Chap. 1.
- Humble et al. (1991) Humble, J.E., Duldig, M.L., Smart, D.F., Shea, M.A.: 1991, Detection of 0.5–15 GeV solar protons on 29 September 1989 at australian stations. Geophysical Research Letters 18(4), 737.
- Kallenrode, Cliver, and Wibberenz (1992) Kallenrode, M.-B., Cliver, E.W., Wibberenz, G.: 1992, Composition and azimuthal spread of solar energetic particles from impulsive and gradual flares. Astrophysical Journal 391(1), 370.
- Klein et al. (2001) Klein, K.-L., Trottet, G., Lantos, P., Delaboudinière, J.-P.: 2001, Coronal electron acceleration and relativistic proton production during the 14 July 2000 flare and CME. Astronomy and Astrophysics 373(3), 1073.
- Kudela and Usoskin (2004) Kudela, K., Usoskin, I.: 2004, On magnetospheric transmissivity of cosmic rays. Czechoslovak Journal of Physics 54(2), 239.
- Kudela, Bučik, and Bobik (2008) Kudela, K., Bučik, R., Bobik, P.: 2008, On transmissivity of low energy cosmic rays in disturbed magnetosphere. Advances in Space Research 42(7), 1300.
- Langel (1987) Langel, R.A.: 1987, Main field in geomagnetism. In: Geomagnetism, J.A. Jacobs Academic Press, London, 249. Chap. 1.
- Levenberg (1944) Levenberg, K.: 1944, A method for the solution of certain non-linear problems in least squares. Quarterly of Applied Mathematics 2, 164.
- Lockwood, Debrunner, and Flükiger (1990) Lockwood, J.A., Debrunner, H., Flükiger, E.O.: 1990, Indications for diffusive coronal shock acceleration of protons in selected solar cosmic ray events. Journal of Geophysical Research: Space Physics 95(A4), 4187.
- Marquardt (1963) Marquardt, D.: 1963, An algorithm for least-squares estimation of nonlinear parameters. SIAM Journal on Applied Mathematics 11(2), 431.
- Mavromichalaki et al. (2011) Mavromichalaki, H., Papaioannou, A., Plainaki, C., Sarlanis, C., Souvatzoglou, G., Gerontidou, M., Papailiou, M., Eroshenko, E., Belov, A., Yanke, V., Flückiger, E.O., Bütikofer, R., Parisi, M., Storini, M., Klein, K.-L., Fuller, N., Steigies, C.T., Rother, O.M., Heber, B., Wimmer-Schweingruber, R.F., Kudela, K., Strharsky, I., Langer, R., Usoskin, I., Ibragimov, A., Chilingaryan, A., Hovsepyan, G., Reymers, A., Yeghikyan, A., Kryakunova, O., Dryn, E., Nikolayevskiy, N., Dorman, L., Pustil’Nik, L.: 2011, Applications and usage of the real-time neutron monitor database. Advances of Space Research 47, 2210.
- Mironova et al. (2015) Mironova, I., Aplin, K., Arnold, F., Bazilevskaya, G., Harrison, R., Krivolutsky, A., Nicoll, K., Rozanov, E., Turunen, E., Usoskin, I.: 2015, Energetic particle influence on the Earth’s atmosphere, Space Science Reviews 194(1), 1.
- Mishev and Usoskin (2013) Mishev, A., Usoskin, I.: 2013, Computations of cosmic ray propagation in the Earth’s atmosphere, towards a GLE analysis. Journal of Physics: Conference Series 409, 012152.
- Mishev and Velinov (2015a) Mishev, A.L., Velinov, P.I.Y.: 2015a, Time evolution of ionization effect due to cosmic rays in terrestrial atmosphere during GLE 70. Journal of Atmospheric and Solar-Terrestrial Physics 129, 78.
- Mishev and Velinov (2015b) Mishev, A.L., Velinov, P.I.Y.: 2015b, Ionization rate profiles due to solar and galactic cosmic rays during GLE 59 on Bastille day 14 July 2000. Comptes rendus de l’Académie bulgare des Sciences 68(3), 359.
- Mishev and Velinov (2015c) Mishev, A.L., Velinov, P.I.Y.: 2015c, Determination of Medium Time Scale Ionization Effects at Various Altitudes in the Stratosphere and Troposphere During Ground Level Enhancement Due to Solar Cosmic Rays on 13.12.2006. Comptes rendus de l’Académie bulgare des Sciences 68(11), 1425.
- Mishev, Kocharov, and Usoskin (2014) Mishev, A.L., Kocharov, L.G., Usoskin, I.G.: 2014, Analysis of the ground level enhancement on 17 May 2012 using data from the global neutron monitor network. Journal of Geophysical Research 119, 670.
- Mishev, Usoskin, and Kovaltsov (2013) Mishev, A., Usoskin, I., Kovaltsov, G.: 2013, Neutron monitor yield function: New improved computations. Journal of Geophysical Research 118, 2783.
- Moraal and McCracken (2012) Moraal, H., McCracken, K.G.: 2012, The time structure of ground level enhancements in solar cycle 23. Space Science Reviews 171(1-4), 85.
- More, Garbow, and Hillstrom (1980) More, G., Garbow, B.S., Hillstrom, K.E.: 1980, User guide for Minpack-1. Report ANL 80-74, Argonne National Laboratory, Downers Grove Township, Ill., USA.
- Nevalainen, Usoskin, and Mishev (2013) Nevalainen, J., Usoskin, I., Mishev, A.: 2013, Eccentric dipole approximation of the geomagnetic field: Application to cosmic ray computations. Advances in Space Research 52(1), 22.
- Perez-Peraza et al. (2008) Perez-Peraza, J.A., Vashenyuk, E.V., Gallegos-Cruz, A., Balabin, Y.V., Miroshnichenko, L.I.: 2008, Relativistic proton production at the sun in the 20 January 2005 solar event. Advances in Space Research 41(6), 947.
- Plainaki et al. (2007) Plainaki, C., Belov, A., Eroshenko, E., Mavromichalaki, H., Yanke, V.: 2007, Modeling ground level enhancements: Event of 20 January 2005. Journal of Geophysical Research: Space Physics 112(4).
- Plainaki et al. (2009) Plainaki, C., Mavromichalaki, H., Belov, A., Eroshenko, E., Yanke, V.: 2009, Modeling the solar cosmic ray event of 13 December 2006 using ground level neutron monitor data. Advances in Space Research 43(4), 474.
- Reames (1999) Reames, D.V.: 1999, Particle acceleration at the sun and in the heliosphere. Space Science Reviews 90(3-4), 413.
- Reames (2009a) Reames, D.V.: 2009a, Solar energetic-particle release times in historic ground-level events. Astrophysical Journal 706(1), 844.
- Reames (2009b) Reames, D.V.: 2009b, Solar release times of energetic particles in ground-level events. Astrophysical Journal 693(1), 812.
- Shea and Smart (1982) Shea, M.A., Smart, D.F.: 1982, Possible evidence for a rigidity-dependent release of relativistic protons from the solar corona. Space Science Reviews 32, 251.
- Shea and Smart (1990) Shea, M.A., Smart, D.F.: 1990, A summary of major solar proton events. Solar Physics 127, 297.
- Simpson, Fonger, and Treiman (1953) Simpson, J., Fonger, W., Treiman, S.: 1953, Cosmic radiation intensity-time variation and their origin. i. neutron intensity variation method and meteorological factors. Physical Review 90, 934.
- Smart, Shea, and Flückiger (2000) Smart, D.F., Shea, M.A., Flückiger, E.O.: 2000, Magnetospheric models and trajectory computations. Space Science Reviews 93(1), 305.
- Tsyganenko (1989) Tsyganenko, N.A.: 1989, A magnetospheric magnetic field model with a warped tail current sheet. Planetary and Space Science 37(1), 5.
- Tylka and Dietrich (2009) Tylka, A., Dietrich, W.: 2009, A new and comprehensive analysis of proton spectra in ground-level encahnced (GLE) solar particle. In: Proc. of 31th ICRC Lodz, Poland, 7 -15 July 2009.
- Usoskin, Bazilevskaya, and Kovaltsov (2011) Usoskin, I.G., Bazilevskaya, G.A., Kovaltsov, G.A.: 2011, Solar modulation parameter for cosmic rays since 1936 reconstructed from ground-based neutron monitors and ionization chambers. Journal of Geophysical Research 116, A02104.
- Usoskin et al. (2011) Usoskin, I.G., Kovaltsov, G.A., Mironova, I.A., Tylka, A.J., Dietrich, W.F.: 2011, Ionization effect of solar particle GLE events in low and middle atmosphere. Atmospheric Chemistry and Physics 11, 1979.
- Usoskin et al. (2005) Usoskin, I., Alanko-Huotari, K., Kovaltsov, G., Mursula, K.: 2005, Heliospheric modulation of cosmic rays: Monthly reconstruction for 1951-2004,. Journal of Geophysical Research 110(A12108).
- Usoskin and Kovaltsov (2006) Usoskin, I., Kovaltsov, G.: 2006, Cosmic ray induced ionization in the atmosphere: Full modeling and practical applications,. Journal of Geophysical Research 111(D21206).
- Usoskin et al. (2015) Usoskin, I.G., Ibragimov, A., Shea, M.A., Smart, D.F.: 2015, Database of ground level enhancements (GLE) of high energy solar proton events. In: Proc. of 34th ICRC Hague, Netherlands, 30 July -6 August 2015 PoS, paper 54.
- Vashenyuk et al. (2006a) Vashenyuk, E.V., Balabin, Y.V., Gvozdevskii, B.B., Karpov, S.N.: 2006a, Relativistic solar protons in the event of January 20, 2005: Model studies. Geomagnetism and Aeronomy 46(4), 424.
- Vashenyuk et al. (2006b) Vashenyuk, E.V., Balabin, Y.V., Perez-Peraza, J., Gallegos-Cruz, A., Miroshnichenko, L.I.: 2006b, Some features of the sources of relativistic particles at the sun in the solar cycles 21-23. Advances Space Research 38(3), 411.
- Vashenyuk et al. (2008) Vashenyuk, E.V., Balabin, Y.V., Gvozdevsky, B.B., Schur, L.I.: 2008, Characteristics of relativistic solar cosmic rays during the event of December 13, 2006. Geomagnetism and Aeronomy 48(2), 149.
- Velinov et al. (2013) Velinov, P., Asenovski, S., Kudela, K., Lastovička, J., Mateev, L., Mishev, A., Tonev, P.: 2013, Impact of cosmic rays and solar energetic particles on the earth’s ionosphere and atmosphere. Journal of Space Weather and Space Climate. Journal of Space Weather and Space Climate 3(A14).
- Žigman, Kudela, and Grubor (2014) Žigman, V., Kudela, K., Grubor, D.: 2014, Response of the earth’s lower ionosphere to the ground level enhancement event of December 13, 2006. Advances in Space Research 53(5), 763.