The influence of mergers and ram-pressure stripping
on black hole-bulge correlations
Abstract
We analyse the scatter in the correlation between super-massive black hole (SMBH) mass and bulge stellar mass of the host galaxy, and infer that it cannot be accounted for by mergers alone. The merger-only scenario, where small galaxies merge to establish a proportionality relation between the SMBH and bulge masses, leads to a scatter around the linear proportionality line that increases with the square root of the SMBH (or bulge) mass. By examining a sample of 103 galaxies we find that the intrinsic scatter increases more rapidly than expected from the merger-only scenario. The correlation between SMBH masses and their host galaxy properties is therefore more likely to be determined by a negative feedback mechanism that is driven by an active galactic nucleus. We find a hint that some galaxies with missing stellar mass reside close to the centre of clusters and speculate that ram-pressure stripping of gas off the young galaxy as it moves near the cluster centre, might explain the missing stellar mass at later times.
1 INTRODUCTION
The correlations of super-massive black hole (SMBH) masses with properties of their host galaxies are a hot research topic (see, e.g., reviews by Graham 2015; Kormendy & Ho 2013). For these correlations the stellar mass (or luminosity) of the spheroidal component (hereafter referred to as the bulge), and the stellar velocity dispersion of the bulge, are mostly used (e.g. Kormendy & Richstone 1995; Laor 2001; Magorrian et al. 1998; Hu 2009; Graham & Spitler 2009; McConnell & Ma 2013; Aversa et al. 2015; Savorgnan et al. 2016 for ; and Gebhardt et al. 2000; Merritt & Ferrarese 2001; Hu 2008; Graham 2008a, b; Gültekin et al. 2009; Shen et al. 2008; Graham & Scott 2013; Saxton et al. 2014; Savorgnan & Graham 2015a; Shankar et al. 2016 for ). Correlations with other properties are also studied (e.g., Feoli & Mancini 2011; Saglia et al. 2016), such as the number of globular clusters (e.g., Burkert & Tremaine 2010), the kinetic energy parameter (e.g., Feoli et al. 2011; Mancini & Feoli 2012; Benedetto et al. 2013; Feoli 2014), and the momentum parameter (e.g., Soker & Meiron 2011; Lahav et al. 2011; Cen 2012). Most recently, Saglia et al. (2016) found the best correlation to be between the SMBH mass and , as also discussed by Hopkins et al. (2007a, b). The correlations are chiefly assumed to take the form of power laws – linear when plotted on a log-log scale.
Some studies argued that the – correlation could be brought about by mergers between many small galaxies (e.g., Peng 2007; Jahnke & Macciò 2011; Gaskell 2011), and that a feedback process based on active galactic nuclei (AGN; which seems to affect both the stars’ evolution and that of the SMBH, Arav et al. 2015) is superfluous (e.g., Peng 2007). Mergers may play a more modest role: Saglia et al. (2016) for example, argue that mergers may be important only in explaining the displacement of core ellipticals from the correlations.
It is expected (see Section 3) that if only galaxy mergers lead to significant SMBH growth, the intrinsic scatter of BH masses would increase as , where is the number small galaxies, the ‘building blocks’, that merged to form the final galaxy. As the mass increases in proportion with , the relative scatter in linear scale should decrease as in the merger-only scenario.
Drawing upon these arguments on intrinsic scatter evolution, Lahav et al. (2011) conducted a preliminary study of the merger scenario for BH-mass-bulge-mass correlation. They examined a sample of 86 galaxies and found that the intrinsic scatter increases with mass more rapidly than expected from the merger-only scenario. Hence, they concluded, the merger-alone scenario cannot account for the – correlation. Several other studies followed, and strengthened the conclusion of Lahav et al. (2011) on the limited role mergers play in forming the correlations (e.g., Shankar et al. 2012; Debattista et al. 2013; Aversa et al. 2015; Savorgnan & Graham 2015a; Mechtley et al. 2016), and more generally in building galaxies (e.g., Narayanan et al. 2015; cf. Shankar et al. 2009 for BH growth below ).
In the present study we update the analysis of Lahav et al. (2011) of the scatter in the – correlation, and go further to discuss how the correlation is affected by inflation of gas due to AGN activity. We describe the sample of galaxies we use in Section 2, and in Section 3 we analyse the implications to the merger scenario. In Section 4 we consider a certain class of galaxies – those residing near cluster centres – and their - relation relative to the general one. We present our summary and conclusions in Section 5.
2 THE SAMPLE
The sample of galaxies is assembled from the following sources: first is the list of galaxies compiled by Savorgnan & Graham (2015a, b); Savorgnan et al. (2016) (based on Graham & Scott 2013), Kormendy & Ho (2013) and McConnell & Ma (2013), (SG, KH and MM respectively) and other galaxies taken from individual studies (see below). The data appear in Table 1. All (106) galaxies have measured , and 103 galaxies have measured bulge mass, which is the entire stellar mass in elliptical galaxies. All galaxies in McConnell & Ma (2013) are included in Kormendy & Ho (2013), as well as some galaxies in the sample of Savorgnan & Graham (2015a, b); Savorgnan et al. (2016) (which were combined for values of both and ); however, the sources differ regarding some values for the same parameters. In such cases averages were calculated and used for the plots given here. As McConnell & Ma (2013) do not give error estimates for , the errors were taken from Kormendy & Ho (2013) and, if present, from Savorgnan & Graham (2015a, b). Errors for the average values of the bulge mass and from sources were estimated according to
| (1) |
where stands for the variable whose errors are to be calculated. In the few cases where the standard error of the mean were bigger, it was used as the error. The errors for the black hole masses are the average values of the higher and lower estimates.
In this work we neglect the possible effects of non-Gaussianity of the errors and their cross-correlation, as a thorough discussion of these is beyond the scope of this work. We note that recently Saglia et al. (2016) calculated the error covariance matrix of various quantities and found that the off-diagonal terms were smaller than the diagonal terms, adding that ignoring them is not a bad approximation.
There are several exceptions. Two individual BHs that do not appear in any of the three compilations; these are the BHs in NGC 1271 which we take from Walsh et al. (2015a) and its bulge mass from Graham et al. (2016a); and last, the BH in M60-UCD1 (Seth et al., 2014). Besides these two, the values adopted for the mass of the black hole and spheroid of NGC 1277 are the newest estimates presented by Graham et al. (2016c), although a higher BH mass was suggested by Walsh et al. (2015b). The quantities and for NGC 4486B were taken from Saglia et al. (2016). These values are different from those given by Kormendy & Ho (2013); we fitted the data using both values, resulting in small differences. Besides these, we add eight more galaxies from Saglia et al. (2016) (S+; see table 1).
We do not consider galaxies for which the black hole mass was derived from the width of the H emission line rather than dynamical models. (This is the case for RGG 118 (LEDA 87300), which is interesting by itself. See, e.g., Graham et al. 2016b.)
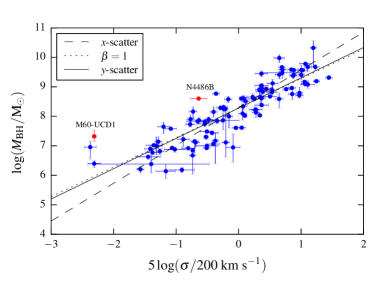
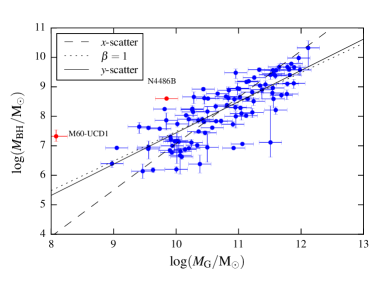
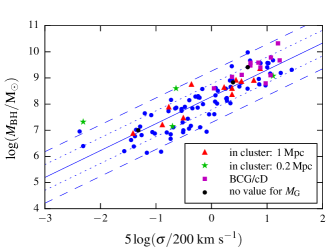
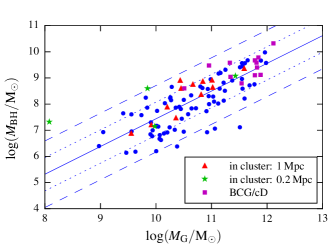
Many studies established that the black hole mass correlates strongly with the stellar velocity dispersion, i.e., the – correlation, and with the bulge mass, i.e., the – correlation (e.g. Kormendy & Richstone 1995; Magorrian et al. 1998; Gebhardt et al. 2000; Merritt & Ferrarese 2001; Tremaine et al. 2002; Wandel 2002; Laor 2001; Hu 2009; Gültekin et al. 2009; Graham & Spitler 2009; Graham et al. 2011; Greene et al. 2010; McConnell & Ma 2013; Kormendy & Ho 2013; Savorgnan et al. 2016). In Fig. 1 we present these two correlations for our sample. The 103 galaxies in the – plot (Fig. 1, bottom panel) are only those which had a measurement of their bulge mass, while the – plot (Fig. 1, top panel) contains the entire sample of 106 galaxies.
We also calculated the best-fitting parameters for each correlation in three ways, depending on the scatter, as explained by Lahav et al. (2011) and Soker & Meiron (2011). We obtained results which are similar to those obtained in recent years (e.g. Soker & Meiron 2011; Graham et al. 2011; McConnell & Ma 2013; Lahav et al. 2011; Savorgnan et al. 2016), and hence will not present them here.
3 THE SCATTER
The (total) ‘scatter’ of the data points is quantified by the root mean square of the residuals from the line of best fit, while the intrinsic scatter is a measure of the natural spread of the data. The total scatter is not identical to the intrinsic scatter. Hence, the intrinsic scatter contributes to the total scatter, but so do measurement errors, thus making the latter larger. Usually the intrinsic scatter is estimated from the logarithmic data, and hence is dimensionless, but below we refer to the scatter (extrinsic and intrinsic) in the linear scale, which isn’t.
Let us now proceed to examine the proposal that the – correlation is the result of mergers. We take the fundamental building-blocks to be galaxies with identically and independently distributed bulge masses, around a mean . The initial mass distribution of the black holes within these galaxies has an average with variance . After mergers, the mean bulge mass becomes . According to the central limit theorem, the masses of the black holes are normally distributed around with variance , for any given number of merges (or a given ), whatever the initial distribution. In this simple model, the relation between black hole and bulge mass is indeed linear – . More importantly for our analysis, the intrinsic scatter increases as . This is consistent with the results of Hirschmann et al. (2010), who investigated the intrinsic scatter using cosmological halo merger trees (Genel et al., 2009).
According to the merger scenario , and hence , too. We use error propagation to calculate the (intrinsic) scatter of for a given
| (2) |
Therefore, this merger-based scenario for the co-evolution of the galaxy and its SMBH predicts an – relation with a scatter that does not depend on the bulge mass.
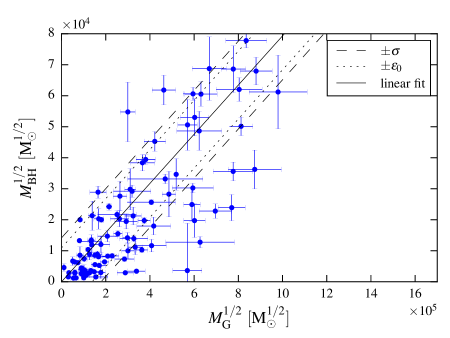
We test this merger-based scenario and its consequence of a constant scatter of by examining the – correlation (left panel of Fig. 2). The data are the same as in Fig. 1, but on a linear scale rather than logarithmic. The solid line is the best linear fit (zero intercept).
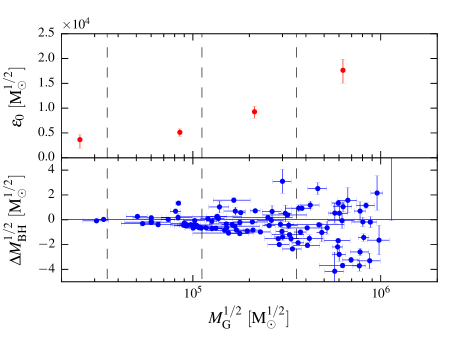
In the lower part of the right panel of Fig. 2, we plot the residuals; and evidently the total scatter around the fit-line increases with bulge mass. In order to investigate the intrinsic scatter’s dependence on mass, we divided the data into four equal-logarithmic-width bins of . For each bin, we calculated the intrinsic scatter in required to bring the reduced sum of square residuals (from the ridge line derived from the entire data-set) to 1. We calculate the errors on from the shape of the distribution (Soker & Meiron, 2011). The upper part of the right panel of Fig. 2 shows that the intrinsic scatter also increases with , contrary to what is expected in a merger-only scenario.
There is room for a scenario where the correlation is formed by mergers alone, while separate hypothetical processes lead to the observed scatter but do not contribute to the correlation. We examined this possibility by generating mock samples with statistical properties similar to the galaxy sample; the BH masses were put on the correlation line and randomly shifted in such a way that the scatter in the – plane was constant and equal to , corresponding to the leftmost bin in the right panel Fig. 2 (the premise being that if those hypothetical processes are turned off, the intrinsic scatter would be smaller than or equal to the value at the low-mass end). We then tried to reproduce the behaviour of the scatter in Fig. 2 by additionally scattering the data points in various reasonable ways (i.e. BH mass can only increase), imitating these hypothetical mass-dependent processes. Our finding was that this normally changes the correlation so significantly, that a straight line in the – plane is not a good fit any more, and the residuals show a clear trend. This is only circumvented if there are two very finely tuned processes that separately modify the BH and bulge masses in such a way that the linear correlation is preserved. It is far more likely that the observed scatter is a feature of the process that forms the correlation, rather than two additional finely tuned processes.
4 OUTLIERS WITH MISSING STELLAR MASS
4.1 The outliers
Our conclusion from the analysis presented in Section 3 is that mergers play a small role in establishing the correlation between the BH masses and the stellar masses of their host galaxies bulges (in agreement with Lahav et al., 2011). The alternative is an AGN feedback mechanism. The AGN, mostly through jets, can heat up the gas (e.g., Zubovas & King 2012; Díaz-Santos et al. 2016), as occurred for example in cooling flow clusters, and expel the gas, as is expected during galaxy formation (e.g., Bower et al. 2008). Not all of the gas is expelled during galaxy formation, though – some of the inter-stellar medium (ISM) that is heated by AGN activity stays bound, but expands. The expanded ISM suffers radiative cooling and flows back to the galaxy. One outcome is that a cooling flow can take place at galaxy formation (Soker, 2010).
The expanded gas has a lower density and resides in a smaller depth of the potential well relative to its initial state. Hence, it is more vulnerable to external perturbations as it is moving through the intra-cluster medium (ICM). We speculate that in rare cases, a young galaxy might pass very close to the central galaxy of its cluster, or near another very massive galaxy, where the ICM is relatively dense, and undergo ram-pressure stripping, which should be more efficient there. (We assume that the SMBH acquires a substantial amount of its mass early in the galactic history. See, e.g. Ferré-Mateu et al. 2015). ISM removal should inhibit star formation at later times; the outcome of which is a galaxy with a normal BH mass, but with less than normal stellar mass. The galaxy would be on the – correlation because the velocity dispersion is determined mainly by the dark matter. However, it would be deficient in stellar mass, and hence might be an outlier in the – correlation – an over-massive BH galaxy. This scenario of ISM inflation, followed by ram-pressure stripping, is different from that proposed by Fabian et al. (2013), who did not mention stripping, but rather the inability to gather material due to the galaxy’s rapid motion in the cluster core.
Two noteworthy over-massive outliers in the – plot (Fig. 1) are NGC 4486B and M60-UCD1. In projection, NGC 4486B resides near the giant elliptical galaxy M 87 at the centre of the Virgo Cluster – less than from the centre. Although it has been suggested that it had been tidally stripped (e.g. Faber 1973; Barber et al. 2016), this case serves as part of our motivation. Recent measurements by Saglia et al. (2016) place it as an outlier in both - and - correlations; whereas the differing data in Kormendy & Ho (2013) imply that it is only an outlier in the - correlation – as would be the case if it had undergone the process we suggest. On the other hand, the galaxy M60-UCD1 is as extreme an outlier as NGC 4486B in the – correlation, but it is also far from the - ridge line, hence it could have suffered mainly tidal stripping, as suggested by Seth et al. (2014). Further motivation for the proposed scenario is discussed next.
We further classify the galaxies that are cluster members by their projected distance from the centre of their host cluster. In Fig. 3 we mark those with projected distance less than , those with projected distance less than , and the central cluster galaxies. For cluster member classification, we used the HyperLeda database (Makarov et al., 2014)111http://leda.univ-lyon1.fr/. Then we calculated the distance between the galaxy and its cluster’s centre using co-ordinates from SIMBAD and VizieR222http://simbad.u-strasbg.fr/simbad/, http://vizier.u-strasbg.fr/ (Wenger et al., 2000; Ochsenbein et al., 2000). The distances to these galaxies were taken from Kormendy & Ho (2013) and Savorgnan et al. (2016), with preference to the former in case of discrepancies. While the sample is very small, we find that galaxies that reside near their host cluster’s centre tend to occupy the upper parts of the - plot (bottom panel of Fig. 3), i.e., above the trend line, in agreement with McGee (2013). We interpret this as a deficiency of stellar mass. For Virgo Cluster galaxies, we used the minimum distance from M 87, M 60 or M 49 (the latter two are ). Although M 87 is the central galaxy, we consider the two others as also capable harbouring a dense ICM environment. Unlike the case of the - correlation, in the - correlation (upper panel of Fig. 3) we do not discern such a trend, i.e., the cluster galaxies are symmetrically distributed around the correlation line in the -. This is in contrast with the findings of Zubovas & King (2012) and McGee (2013), perhaps due to a difference in samples and the small numbers of cluster galaxies. We infer therefore that galaxies near the centres of clusters show a stronger trend of stellar mass deficiency than of having too low velocity dispersions. This might hint that ram-pressure stripping, which only removes gas, is more significant than tidal stripping in accounting for this trend, if at all.
4.2 The stripping scenario
We can estimate the order of magnitude of some of the parameters of the ram-pressure scenario, which exemplify the important parts of the scenario and their respective roles. Tidal stripping would also be important, but we emphasise the additional role of the efficient ram-pressure stripping as a result of the inflation of the ISM by jets. However, to solidify the proposed scenario, simulations of cluster evolution would have to be conducted.
Many galaxies in clusters have elongated orbits. Galaxies spend only a fraction of the time near the centre, where they can be efficiently stripped of their gas. The inflated phase of the gas in the galaxy takes about the free fall time from the radius outside of which most of the gas is to be stripped. We found this radius to be of the order of , for the density profiles we use (see below). The fall-back time of the inflated envelope – when the inner half-mass of the ISM returns to its original radius – is . A galaxy with an elongated orbit to about , would take about 5 times as long to reach the cluster centre. Over all, only galaxies residing near the cluster centre (within about ) would undergo stripping – only if their orbit carried them further in – and even then the stripping phase might last for only part of the orbit. Based on these numbers, we expect only about a fifth, say , of the galaxies within to be stellar-deficient outliers.
We assume that this holds true at the period of major AGN activity, at a redshift of . Although the cluster, or smaller proto-cluster, was probably not fully virialized at that time, galaxy velocities were not much different from their values at present. In some cases the stripping process took place in a small group that later became the centre of the cluster – that already contained a massive elliptical galaxy at its centre. The subsequent analysis is therefore valid only for galaxies for which these conditions hold. There is evidence that some clusters were already formed by and even earlier (e.g., Wylezalek et al. 2014), as well as observations of a proto-cluster at (Dey et al., 2016). By a hot ICM gas could have been created in these clusters, e.g., as in the cluster JKCS 041 at redshift (Andreon et al., 2014), and the cores of the clusters could have hosted a characteristic population of galaxies (Strazzullo et al., 2015). Concerning NGC 4486B, it is possible that the Virgo cluster in which it resides was partially formed, and that it had already contained about of its mass (Sorce et al., 2016). Generally, our ram-pressure stripping scenario overlaps with the period during which a feedback mechanism determines the correlation between the SMBH mass and the galactic properties.
Our analysis below does not depend much on the redshift in the relevant range, from the period of major AGN activity at to the present, for the following reasons. First, as noted above, the velocities of galaxies in the cluster are about the same in the redshift range . Secondly, the density in the inner regions of the cluster did not change much with respect to physical radius. Although the average density within the virial radius decreases strongly with time, the density of the dark matter, and to some degree the density of the baryonic matter, did not change with respect to physical radius, both in the cluster and in the stripped galaxy. That is, the dark matter within the radius of , and the baryonic matter density in the region where most stripping takes place in the cluster, , did not change much from to present. As we are interested in a stripping near the cD galaxy (or a massive elliptical galaxy), the process could take place at the high redshift of when the virial radius of the proto-cluster was much smaller than its value at present, but proto-clusters already existed. In short, the differences of the relevant parameters with redshift are much smaller than the uncertainties in the proposed scenario that we check here with a toy model.
To demonstrate the feasibility of our ram-pressure stripping idea, we put forward a very simple toy model. Consider a galaxy with a spherical density profile given by , where is the gas density and is the density of all other matter in the galaxy. We further assume that AGN activity inflates the ISM by a uniform factor , while keeping the total gaseous mass the same. The new gas density profile is
| (3) |
For the stripping efficiency we use the analytical fit derived by McCarthy et al. (2008) from their numerical simulations. According to McCarthy et al. (2008) the radius beyond which gas is removed by ram-pressure stripping, , is given by
| (4) |
where is a constant which they find to be roughly 2. The ram-pressure that is exerted by the ICM is defined by , where is the ICM density and is the speed of the galaxy through the ICM. We take for the ICM density , corresponding to the electron number density at a radius of in the Virgo cluster (Urban et al., 2011).
The ISM in the galaxy to be stripped is assumed to be distributed according to a -model (Roediger et al., 2015)
| (5) |
with and a central density of (typical values). For the total baryonic mass, which at this early phase is mainly gas, we take . From the density profile, total gas mass, and the central density used above we find that the ISM extends up to radius of . We take the dark matter to be distributed according to a Navarro–Frenk–White (NFW) profile (Navarro et al., 1997)
| (6) |
For our model galaxy we use a total dark matter mass , and (like McCarthy et al. 2008) take the cut-off radius to be the radius at which the dark matter density is 200 times the critical density; is calculated from using the relation given by Neto et al. (2007). Once it is determined, can be calculated from the definition of ; then is deduced from the total mass and . This yields .
We take the ISM gas and gravitational potential according to these parameters, then let the gas expand by a factor according to equation (3), and use equation (4) with a galaxy velocity through the ICM of to calculate how much mass is stripped. We emphasise that we use these typical parameters to demonstrate the feasibility of the proposed ram-pressure scenario. We are not in the stage of performing full scale numerical simulations of the scenario that tracks the evolution with redshift – this is a task for a future study.
We now present our findings of the fraction of the ISM gas that is retained after ram-pressure stripping, to the total gaseous mass before both stripping and ISM inflation, defined in the following way:
| (7) |
We find that for the parameters we used, before any expansion of the ISM, the ram-stripping by the ICM removes gas outside of a radius of , and leaves a fraction of from the ISM. If before the galaxy is stripped the AGN inflates the ISM by a factor of , , and , the stripping takes place from radii of , , and , respectively, and the fraction of gaseous mass that is not stripped off is only , , and , respectively. The exact values might change somewhat when the evolution of the cluster with redshift is considered. However, as discussed above, the changes are smaller than the uncertainties in the toy model.
In the above calculation we considered only inflated gas. However, a considerable portion of the ISM might be ejected by the AGN activity itself, without any need for the ram-pressure stripping (Zubovas & King, 2012). For the present goals, we have demonstrated that ram pressure stripping could in principle account for outliers in the – correlation that are not outliers in the – correlation.
We now estimate the amount of energy that is required to inflate the ISM. If the gas is inflated, its potential energy increases; this energy must come from the SMBH. According to the virial theorem and only the change in potential energy needs be calculated for an order of magnitude estimate. We assume also that the potential is mainly due to the dark matter, and that it is given as an NFW potential. Thus, the energy of the gas is
| (8) |
where is only the gas density. The change in the energy of the inflated ISM is given then by
| (9) |
We find that for the parameters of our model, to expand the ISM by a factor of two in size requires an energy of . If this energy were to come from the AGN alone, then with an efficiency of , the total mass accreted by the black hole would be . As discussed above, the expansion factor can be less than two.
5 Summary
Having examined the claim that mergers of low mass galaxies are the main process behind the SMBH mass to bulge mass correlation, we conclude that if it causes the – correlation, then it also creates an intrinsic scatter in the – relation as given by equation (2) – a constant scatter in this plane. To test this expectation, we used a sample of 103 galaxies that was compiled from recent studies (see Table 1), and found that the intrinsic scatter in – increases faster than it should have, had it been driven mainy by mergers (see Fig. 2). As all galaxies participate in mergers, we included all kinds of galaxies in our study. Lahav et al. (2011) performed a similar analysis for different types of galaxies separately and found that the results hold for each subgroup separately. We do not dispute the claim that mergers influence the various correlations to some degree. We argue though, that in view of the conclusions of Section 3, mergers cannot be the dominant processes behind the correlations.
We also considered another process that might play a secondary role: we looked at galaxies that tend to have missing stellar mass – namely, they have small ratios of bulge mass to SMBH mass, but are not far from the correlation of the SMBH mass with the velocity dispersion. In Fig. 3, we classified cluster members according to their distance from the centre of their cluster, and saw that those very close to it (or to another very large elliptical galaxy in the cluster) tend to occupy the upper parts of the - correlation. We proposed that ram-pressure stripping plays a part in forming these outliers (Section 4.1) – it removes mainly the gas and hence primarily influences the stellar mass. The stripping becomes significant when AGN activity inflates the gas, thus making it more vulnerable, in conjunction with the galaxy’s moving in the dense central region of a cluster. Only a small number of galaxies are expected to be strongly affected by this process. It has been noticed before that the environment can influence the correlations studied here. McGee (2013), for example, found that the slopes of the correlations depend on whether the galaxy is close to the centre of a cluster, or it is far from the centre, a satellite galaxy. McGee (2013) also mentioned that ram-pressure stripping can affect Satellite galaxies in-falling into the ICM, but also cited Zubovas & King (2012) in that stripping affects mainly the outskirts of the ISM. We are mostly concerned with gas that would have stayed inside the galaxy, were it not inflated by the AGN and stripped off right afterwards. This is an additional effect to the one described in these papers. The inflation by the AGN jets may enhance the difference between cluster galaxies and others.
In cooling flows, the main role of the AGN is to heat the ICM, and in galaxy formation it is to eject the gas. We speculated here that inflation of the ISM is another important process by which the AGN determines the properties of its host galaxy. This speculation is motivated by our finding that mergers play only a small role in determining the correlations, and by the properties of galaxies with small distances to cluster centres.
We thank the anonymous referee for very helpful comments. This research was supported by the Asher Fund for Space Research at the Technion, and in part by the European Research Council under the European Union’s Horizon 2020 Programme, ERC-2014-STG grant GalNUC 638435. YM acknowledges support from the China Postdoctoral Science Foundation through grant No. 2015T80011 and from the Strategic Priority Research Program “The Emergence of Cosmological Structure” of the Chinese Academy of Sciences (No. XDB09000000) (Pilot B programme).
References
- Andreon et al. (2014) Andreon, S., Newman, A. B., Trinchieri, G., Raichoor, A., Ellis, R. S., & Treu, T. 2014, A&A, 565, A120.
- Arav et al. (2015) Arav, N., Chamberlain, C., Kriss, G. A., et al. 2015, A&A, 577, A37.
- Aversa et al. (2015) Aversa, R., Lapi, A., de Zotti, G., Shankar, F., & Danese, L. 2015, ApJ, 810, 74.
- Baldassare et al. (2015) Baldassare, V. F., Reines, A. E., Gallo, E., & Greene, J. E. 2015, ApJ, 809, L14.
- Barber et al. (2016) Barber, C., Schaye, J., Bower, R. G., Crain, R. A., Schaller, M., & Theuns, T. 2016, arXiv:1602.04819.
- Benedetto et al. (2013) Benedetto, E., Fallarino, M. T., & Feoli, A. 2013, A&A, 558, A108.
- Bower et al. (2008) Bower, R. G., McCarthy, I. G., & Benson, A. J. 2008, MNRAS, 390, 1399.
- Burkert & Tremaine (2010) Burkert, A., & Tremaine, S. 2010, ApJ, 720, 516.
- Cen (2012) Cen, R. 2012, ApJ, 755, 28.
- Debattista et al. (2013) Debattista, V. P., Kazantzidis, S., & van den Bosch, F. C. 2013, ApJ, 765, 23.
- Díaz-Santos et al. (2016) Díaz-Santos, T., Assef, R. J., Blain, A. W., et al. 2016, ApJ, 816, L6.
- Dey et al. (2016) Dey, A., Lee, K. S., Reddy, N., et al. 2016, ApJ, 823, 11.
- Faber (1973) Faber, S. M. 1973, ApJ, 179, 731.
- Fabian et al. (2013) Fabian, A. C., Sanders, J. S., Haehnelt, M., Rees, M. J., & Miller, J. M., 2013, MNRAS, 431, L38.
- Feoli (2014) Feoli, A. 2014, ApJ, 784, 34
- Feoli & Mancini (2011) Feoli, A., & Mancini, L. 2011, International Journal of Modern Physics D, 20, 2305
- Feoli et al. (2011) Feoli, A., Mancini, L., Marulli, F., & van den Bergh, S. 2011, General Relativity and Gravitation, 43, 1007.
- Ferré-Mateu et al. (2015) Ferré-Mateu, A., Mezcua, M., Trujillo, I., Balcells, M., & van den Bosch, R. C. E., 2015, ApJ, 808, 79.
- Gaskell (2011) Gaskell, C. M. 2011, arXiv:1111.2067.
- Gebhardt et al. (2000) Gebhardt, K., et al. 2000, ApJ, 539, L13.
- Genel et al. (2009) Genel, S., Genzel, R., Bouché, N., Naab, T., & Sternberg, A. 2009, ApJ, 701, 2002.
- Graham (2008a) Graham, A. W., 2008a, ApJ, 680, 143.
- Graham (2008b) Graham, A. W., 2008b, PASA, 25, 167.
- Graham (2015) Graham, A. W. 2015, arXiv:1501.02937.
- Graham et al. (2016a) Graham, A. W., Ciambur, B. C., & Savorgnan, G. A. D 2016, ApJ, submitted.
- Graham et al. (2016b) Graham, A. W., Ciambur, B. C., & Soria, R. 2016b, ApJ, 818, 172.
- Graham et al. (2016c) Graham, A. W., Durré, M., Savorgnan, G. A. D., et al. 2016c, ApJ, 819, 43.
- Graham et al. (2011) Graham, A. W., Onken, C. A., Athanassoula, E., & Combes, F. 2011, MNRAS, 412, 2211.
- Graham & Scott (2013) Graham, A. W., & Scott, N. 2013, ApJ, 764, 151.
- Graham & Spitler (2009) Graham, A. W., & Spitler, L. R. 2009, MNRAS, 397, 2148.
- Greene et al. (2010) Greene, J. E., Peng, C. Y., Kim, M., et al. 2010, ApJ, 721, 26.
- Gültekin et al. (2009) Gültekin, K., et al. 2009, ApJ, 698, 198.
- Hirschmann et al. (2010) Hirschmann, M., Khochfar, S., Burkert, A., et al. 2010, MNRAS, 407, 1016.
- Hopkins et al. (2007a) Hopkins, P. F., Hernquist, L., Cox, T. J., Robertson, B., & Krause, E. 2007a, ApJ, 669, 45
- Hopkins et al. (2007b) Hopkins, P. F., Hernquist, L., Cox, T. J., Robertson, B., & Krause, E. 2007b, ApJ, 669, 67
- Hu (2008) Hu, J. 2008, MNRAS 386, 2242.
- Hu (2009) Hu, J. 2009, arXiv:0908.2028.
- Jahnke & Macciò (2011) Jahnke, K., & Macciò, A. V. 2011, ApJ, 734, 92.
- Kormendy & Ho (2013) Kormendy, J., & Ho, L. C. 2013, ARA&A, 51, 511.
- Kormendy & Richstone (1995) Kormendy, J., & Richstone, D. 1995, ARAA, 33, 581.
- Lahav et al. (2011) Lahav, C. G., Meiron, Y., & Soker, N. 2011, arXiv:1112.0782.
- Laor (2001) Laor, A. 2001, ApJ, 553, 677.
- Magorrian et al. (1998) Magorrian, J., et al. 1998, AJ, 115, 2285.
- Mancini & Feoli (2012) Mancini, L., & Feoli, A. 2012, A&A, 537, A48.
- Makarov et al. (2014) Makarov, D., Prugniel, P., Terekhova, N., Courtois, H., & Vauglin, I. 2014, A&A, 570, A13.
- McCarthy et al. (2008) McCarthy, I. G., Frenk, C. S., Font, A. S., Lacey, C. G., Bower, R. G., Mitchell, N. L., Balogh, M. L. & Theuns, T., 2008, MNRAS, 383, 593.
- McConnell & Ma (2013) McConnell, N. J., & Ma, C.-P. 2013, ApJ, 764, 184.
- McGee (2013) McGee, S. L. 2013, MNRAS, 436, 2708.
- Mechtley et al. (2016) Mechtley, M., Jahnke, K., Windhorst, R. A., et al. 2016, arXiv:1510.08461.
- Merritt & Ferrarese (2001) Merritt, D., & Ferrarese, L. 2001, ApJ, 547, 140.
- Narayanan et al. (2015) Narayanan, D., Turk, M., Feldmann, R., et al. 2015, Nature, 525, 496.
- Navarro et al. (1997) Navarro, J. F., Frenk, C. S., & White, S. D. M. 1997, ApJ, 490, 493.
- Neto et al. (2007) Neto, A. F., Gao, L., Bett, P., et al. 2007, MNRAS, 381, 1450.
- Ochsenbein et al. (2000) Ochsenbein, F., Bauer, P., & Marcout, J. 2000, A&AS, 143, 23.
- Peng (2007) Peng, C. Y. 2007, ApJ, 671, 1098.
- Roediger et al. (2015) Roediger, E., Kraft, R. P., Nulsen, P. E. J., Forman, W. R., Machacek, M., Randall, S., Jones, C., Churazov, E., & Kokotanekova, R. 2015, ApJ, 806, 103.
- Saglia et al. (2016) Saglia, R. P., Opitsch, M., Erwin, P., Thomas, J., Beifiori, A., Fabricius, M., Mazzalay, X., Nowak, N., Rusli, S. P., & Bender, R. 2016, ApJ, 818, 47.
- Savorgnan & Graham (2015a) Savorgnan, G. A. D., & Graham, A. W. 2015, MNRAS, 446, 2330.
- Savorgnan & Graham (2015b) Savorgnan, G. A. D., & Graham, A. W. 2015, arXiv:1511.07446.
- Savorgnan et al. (2016) Savorgnan, G. A. D., Graham, A. W., Marconi, A., & Sani, E. 2016, ApJ, 817, 21.
- Saxton et al. (2014) Saxton, C. J., Soria, R., & Wu, K. 2014, MNRAS, 445, 3415.
- Seth et al. (2014) Seth, A. C., van den Bosch, R., Mieske, S., et al. 2014, Nature, 513, 398.
- Shankar et al. (2016) Shankar, F., Bernardi, M., Sheth, R. K., et al. 2016, arXiv:1603.01276
- Shankar et al. (2012) Shankar, F., Marulli, F., Mathur, S., Bernardi, M., & Bournaud, F. 2012, A&A, 540, A23.
- Shankar et al. (2009) Shankar, F., Weinberg, D. H., & Miralda-Escudé, J. 2009, ApJ, 690, 20.
- Shen et al. (2008) Shen, J., Vanden Berk, D. E., Schneider, D. P., & Hall, P. B. 2008, AJ, 135, 928.
- Soker (2010) Soker, N. 2010, MNRAS, 407, 2355.
- Soker & Meiron (2011) Soker, N., & Meiron, Y. 2011, MNRAS, 411, 1803.
- Sorce et al. (2016) Sorce, J. G., Gottloeber, S., Hoffman, Y., & Yepes, G. 2016, arXiv:1605.06756.
- Strazzullo et al. (2015) Strazzullo, V., Daddi, E., Gobat, R., et al. 2015, A&A, 576, L6.
- Tremaine et al. (2002) Tremaine, S., et al. 2002, ApJ, 574, 740.
- Urban et al. (2011) Urban, O., Werner, N., Simionescu, A., Allen, S. W., Böhringer, H. 2011, MNRAS, 414, 2101.
- van Loon & Sansom (2015) van Loon, J. T., & Sansom, A. E. 2015, MNRAS, 453, 2341.
- Walsh et al. (2015a) Walsh, J. L., van den Bosch, R. C. E., Gebhardt, K., Yildirim, A., Gültekin, K., Husemann, B., & Richstone, D. O. 2015a, ApJ, 808, 183.
- Walsh et al. (2015b) Walsh, J. L., van den Bosch, R. C. E., Gebhardt, K., Yildirim, A., Richstone, D. O., Gültekin, K., & Husemann, B. 2015b, ApJ, 817, 2.
- Wandel (2002) Wandel, A. 2002, ApJ, 565, 762.
- Wenger et al. (2000) Wenger, M., Ochsenbein, F., Egret, D., et al. 2000, A&AS, 143, 9.
- Wylezalek et al. (2014) Wylezalek, D., Vernet, J., De Breuck, C., et al. 2014, ApJ, 786, 17.
- Zubovas & King (2012) Zubovas, K., & King, A. R. 2012, MNRAS, 426, 2751.
| Galaxy | -high | -low | Cluster | Reference | |||
|---|---|---|---|---|---|---|---|
| [km s-1] | [] | [] | [] | [] | |||
| A1836BCG | A | KH, SG, MM | |||||
| A3565BCG | A | KH, SG, MM | |||||
| Circinus | KH, SG, MM | ||||||
| IC 1459 | KH, SG, MM | ||||||
| IC 2560 | KH, SG | ||||||
| M 31 | KH, SG, MM | ||||||
| M 32 | KH, SG, MM | ||||||
| M 81 | KH, SG, MM | ||||||
| M 87 | VirgocD | KH, SG, MM | |||||
| Milky Way | KH, SG, MM | ||||||
| NGC 0253 | SG | ||||||
| NGC 0524 | UGCl 241 | KH, SG, MM | |||||
| NGC 0821 | KH, SG, MM | ||||||
| NGC 1023 | KH, SG, MM | ||||||
| NGC 1068 | KH, SG | ||||||
| NGC 1194 | UGCl 49 | KH, SG, MM | |||||
| NGC 1277 | Perseus1,2 | KH ( only) | |||||
| NGC 1300 | KH, SG, MM | ||||||
| NGC 1316 | Fornax | KH, SG, MM | |||||
| NGC 1332 | KH, SG, MM | ||||||
| NGC 1374 | Fornax1 | KH, SG, MM | |||||
| NGC 1399 | FornaxBCG | KH, SG, MM | |||||
| NGC 1407 | KH, SG, MM | ||||||
| NGC 1550 | UCGl 56BCG | KH, SG, MM | |||||
| NGC 2273 | KH, SG, MM | ||||||
| NGC 2549 | UGCl 1161,2 | KH, SG, MM | |||||
| NGC 2748 | KH | ||||||
| NGC 2778 | KH, SG | ||||||
| NGC 2787 | KH, SG, MM | ||||||
| NGC 2960 | KH, SG, MM | ||||||
| NGC 2974 | SG | ||||||
| NGC 3079 | UGCl 163 | SG | |||||
| NGC 3091 | KH, SG, MM | ||||||
| NGC 3115 | KH, SG, MM | ||||||
| NGC 3227 | UGCl 1691 | KH, SG, MM | |||||
| NGC 3245 | KH, SG, MM | ||||||
| NGC 3368 | KH, SG, MM | ||||||
| NGC 3377 | KH, SG, MM | ||||||
| NGC 3379 | KH, SG, MM | ||||||
| NGC 3384 | KH, SG, MM | ||||||
| NGC 3393 | KH, SG, MM | ||||||
| NGC 3414 | UGCl 1921 | SG | |||||
| NGC 3489 | KH, SG, MM | ||||||
| NGC 3585 | KH, SG, MM | ||||||
| NGC 3607 | KH, SG, MM | ||||||
| NGC 3608 | KH, SG, MM | ||||||
| NGC 3842 | UGCl 234 | KH, SG, MM | |||||
| NGC 3945 | UGCl 229 | KH | |||||
| NGC 3998 | UGCl 2291 | KH, SG, MM | |||||
| NGC 4026 | UGCl 229 | KH, SG, MM | |||||
| NGC 4151 | SG | ||||||
| NGC 4258 | KH, SG, MM | ||||||
| NGC 4261 | Virgo | KH, SG, MM | |||||
| NGC 4291 | UGCl 2691 | KH, SG, MM | |||||
| NGC 4342 | Virgo | KH, SG, MM | |||||
| NGC 4374 | Virgo | KH, SG, MM | |||||
| NGC 4382 | Virgo | KH | |||||
| NGC 4388 | Virgo1 | KH, SG, MM | |||||
| NGC 4459 | Virgo | KH, SG, MM | |||||
| NGC 4472 | VirgocD | KH, SG, MM | |||||
| NGC 4473 | Virgo | KH, SG, MM | |||||
| NGC 4486A | Virgo | KH, SG, MM | |||||
| NGC 4486B | Virgo1,2 | S+ | |||||
| NGC 4526 | Virgo1 | KH | |||||
| NGC 4552 | Virgo | SG | |||||
| NGC 4564 | Virgo | KH, SG, MM | |||||
| NGC 4594 | KH, SG, MM | ||||||
| NGC 4596 | Virgo1 | KH, SG, MM | |||||
| NGC 4621 | Virgo | SG | |||||
| NGC 4649 | VirgocD | KH, SG, MM | |||||
| NGC 4697 | KH, SG, MM | ||||||
| NGC 4736 | KH, SG, MM | ||||||
| NGC 4751 | KH, SG | ||||||
| NGC 4826 | KH, SG, MM | ||||||
| NGC 4889 | ComaBCG | KH, SG, MM | |||||
| NGC 4945 | KH, SG | ||||||
| NGC 5077 | KH, SG, MM | ||||||
| NGC 5128 | KH, SG, MM | ||||||
| NGC 5328 | KH, SG | ||||||
| NGC 5516 | KH, SG, MM | ||||||
| NGC 5576 | KH, SG, MM | ||||||
| NGC 5813 | SG | ||||||
| NGC 5845 | UGCl 3521 | KH, SG, MM | |||||
| NGC 5846 | UGCl 352BCG | SG | |||||
| NGC 6086 | KH, SG, MM | ||||||
| NGC 6251 | UGCl 388 | KH, SG, MM | |||||
| NGC 6264 | AWM 51 | KH, SG, MM | |||||
| NGC 6323 | UGCl 420 | KH, SG, MM | |||||
| NGC 6861 | KH, SG | ||||||
| NGC 7052 | KH, SG, MM | ||||||
| NGC 7457 | KH | ||||||
| NGC 7582 | KH, SG, MM | ||||||
| NGC 7619 | UGCl 4871 | KH, SG, MM | |||||
| NGC 7768 | UGCl 493BCG | KH, SG, MM | |||||
| UGC 3789 | UGCl 100 | KH, SG, MM | |||||
| Cygnus A | KH, SG | ||||||
| NGC 1271 | Perseus1,2 | ||||||
| M60-UCD1 | Virgo1,2 | ||||||
| NGC 307 | UGCl 141 | S+ | |||||
| NGC 1398 | S+ | ||||||
| NGC 3627 | S+ | ||||||
| NGC 3923 | S+ | ||||||
| NGC 4371 | S+ | ||||||
| NGC 4501 | S+ | ||||||
| NGC 4699 | S+ | ||||||
| NGC 5018 | S+ |