Effect of delithiation on the dimer transition of the
honeycomb-lattice ruthenate Li2-xRuO3
Abstract
The honeycomb-lattice ruthenate Li2RuO3 is made heavily Li-deficient by chemical oxidation by iodine. The delithiation triggers a different phase Li2-xRuO3, the “D-phase”, with superlattice. For the first time we disclose the magnetic and structural properties of the D-phase in the dimer-solid state. The low temperature magnetic susceptibility and the bond lengths indicate a bonding configuration consisting of both Ru4+-Ru4+ and Ru5+-Ru5+ dimers.
pacs:
Valid PACS appear hereI Introduction
Honeycomb-lattice iridates of the type IrO3 (A=Li, Na) with the effective angular momentum due to strong spin-orbit coupling have been under active active experimental investigation Singh and Gegenwart (2010); Takayama et al. (2015) mainly because of their interesting properties associated with predicted topologically non-trivial states, including the Kitaev spin-liquid state Kitaev (2006); Shitade et al. (2009). What is more, topological superconductivity has been proposed based on the Kitaev-Heisenberg model with the spin S = 1/2 emerging with hole doping You et al. (2012); Hyart et al. (2012); Okamoto (2013); Scherer et al. (2014).
Another interesting compound with the honeycomb structure is Li2RuO3. One of the differences from IrO3 is that Li2RuO3 has nominally , as expected for the low-spin state of Ru4+(4). Interestingly, Li2RuO3 exhibits dimerization of Ru-Ru ions at K, accompanied by a sharp decrease of magnetization below Miura et al. (2007). More recently, it is found that the disorder in the Ru-Ru dimer configuration sensitively affects the magnetic behavior Jimenez-Segura et al. (2016). In addition, the dimer transition has been revealed to be of the first-order type Terasaki et al. (2015), especially in samples with more coherent dimer configuratuion with K, Jimenez-Segura et al. (2016).
It has been also demonstrated that the dimer transition is not an ordinary Peierls transition. In a recent study based on a combination of high-energy X-ray diffraction (XRD), pair distribution function (PDF) analysis, and density functional theory (DFT) calculations, it has been found that the dimers dynamically survives even above Kimber et al. (2014). Thus, the transition can be regarded as the change from a static “dimer-solid” state at low temperatures to a dynamic “dimer-liquid” state above Kimber et al. (2014).
The potential utility of Li2RuO3 as a material for batteries has motivated investigation on its electrochemical properties as well Sarkar et al. (2014). The delithiated series Li2-xRuO3 has been synthesized from Li2RuO3 by electrochemical deintercalation of lithium Kobayashi et al. (1995); Taminato et al. (2014); Mori et al. (2015) and by chemical oxidation by I2 Kobayashi et al. (1996). Moreover, it has been revealed that a part of Ru4+ changes to Ru5+ by delithiation based on a sequence of experiments Sathiya et al. (2013a, b); Li et al. (2016).
However, concerning the physical properties of Li2-xRuO3, only magnetization has been reported in the limited temperature range between 83 and 293 K Kobayashi et al. (1996). In particular, the relation between the dimer transition and delithiation has not been reported.
The effect of Li deficiency on the dimer transition is of primary interest for the following reasons. Firstly, the hole doping by delithiation could lead to the spin state and thus to various topological phases including exotic superconductivity. Secondly, the dimer formation may be substantially changed by Li deficiency or hole doping, leading to a possible new dimer state related to dimer-solid and dimer-liquid states.
In this work, we report properties of heavily delithiated Li2-xRuO3 obtained by chemical oxidation. We confirm a crystallographic phase distinct from the pristine phase. This phase, emerging by heavy delithiation, shall be called the “D-phase”. We compare structural and magnetic properties of the D-phase with those of the stoichiometric “S-phase”. In particular, we find in the D-phase a new dimer-solid state with a different electronic configuration from that in the S-phase.
II EXPERIMENT
Pristine Li2RuO3 samples were prepared from Li2CO3 (Aldrich, 99.997%) and RuO2 (Rare metallic, 99.9%) by means of solid-state reaction. After the starting powders were dried, stoichiometric quantities were mixed and ground for 1 h in a conventional mortar. We added acetone to improve the homogeneity of the powder Jimenez-Segura et al. (2016). The powder was pelletized and heated at 1000C for 24 h in the first step. Next, the pellet was re-ground in acetone for 1 h, pelletized, and heated at 900C for 48 h followed by natural cooling. This choice of the synthesis proccedure is based on the previous study Jimenez-Segura et al. (2016). Purity, as well as the coherence of the dimer configuration were verified by XRD and magnetic susceptibility measurements as described below.
The delithiation was performed based on the reaction:
| (1) |
I2 (Wako, 99.9%) was dissolved in acetonitrile (CH3CN) with the concentration of 0.3384 mol/L. After precise measurement of its mass, the powder of Li2RuO3 was soaked in the iodine solution for 3 days at room temperature. Then the Li2-xRuO3 powder was washed with clean acetonitrile. Since XRD analysis indicated that stronger delithiation was necessary, after another measurement of the mass, the powder was soaked in a new solution of I2 0.3683 mol/L for 18 h under stirring at 560 rpm. The containers were covered with aluminum foil in order to avoid the conversion of I- into I2 triggered by light. The Li2-xRuO3 powder was taken out, and rinsed with clean acetonitrile until the color of the acetonitrile became completely transparent. A less-delithiated sample of Li2-xRuO3 was prepared in a solution of I2 0.18457 mol/L. In this case, a pellet of Li2RuO3 was soaked for 3 days. We stored samples in vacuum although there is no noticeable decomposition at room temperature in air for both pristine and delithiaed samples.
In order to evaluate the value of x, the remaining quantity of I2 in acetonitrile was measured through titration Daniel C. Harris (2006); Patnaik (2004) with a standard solution of Na2S2O3 (Wako, 0.05 mol/L for volumetric analysis) at 19 based on the reaction:
| (2) |
The glassware used for the titration was calibrated at 19 with acetonitrile. The completion of this reaction is monitored by the color of starch added in the solution. We find that the total lithium extracted is and 0.34 for the two delithiated samples presented in this paper.
We also performed the inductively-coupled plasma optical emission spectroscopy (ICP-OES) analysis using a commercial apparatus (Seiko Instruments, SPS 6100). Quantitative evaluation of x by ICP-OES was not successful because Li2-xRuO3 cannot be dissolved completely into standard acids (such as HCl), due to production of insoluble RuO2 in the acid.
The laboratory XRD measurements were carried out with a commercial diffractometer (Bruker, D8 Advance) using the Cu radiation ( Å, keV) equipped with a one-dimensional array of detectors and a nickel monochromator. High-energy XRD measurements at room temperature were performed at the beam line ID22 of the European Synchrotron Radiation Facility (ESRF). X-ray beam of the energy Å) was used. High-energy XRD measurements at various elevated temperatures were performed at the beam line ID11 at ESRF. A double Laue monochromator was used to select X-ray of the energy of 87.5 keV ( Å). The beam was focused to ca. 100 mm using refractive lenses. The scattered X-ray was detected using a CCD camera (FReLoN). Temperature control was achieved using a hot-air blower. Data were continuously collected upon heating to 723 K at 2.5 K/min, and upon cooling to room temperature at the same rate. Typical temperature resolution was 0.2 K/pattern. We find a noticeable difference between the actual sample temperature and the thermometer temperature. Thus, a lineal correction to the thermometer temperature was made, so that of Li2RuO3 recorded in the XRD measurement matches with the of the magnetization measurements.
The magnetization measurements were performed using a commercial superconducting quantum interference device magnetometer (Quantum Design, MPMS). The magnetization at high temperatures (300 to 700 K) were measured using the oven option for MPMS. We used quartz tubes as sample holders for the high temperature measurements. The sample tubes were sealed with ceramic bond (Resbond, 907GF) in order to prevent any gas released from the sample to damage the inside of the oven sample space. We checked the thermometer calibration of the oven by measuring the ferromagnetic transition (= 627.2 K) of Ni (Rare metallic, 99.99%) at several fields (Kouvel and Fisher, 1964). The calibration error in of Ni is less than 0.2%. Measurements from 1.8 to 300 K were performed with the ordinary setup of MPMS in zero-field-cooled (ZFC) and field-cooled (FC) sequences.
III RESULTS AND DISCUSSION
III.1 Structure
.
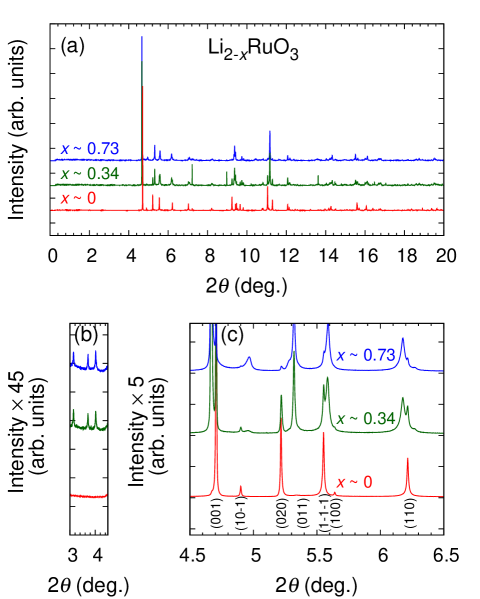
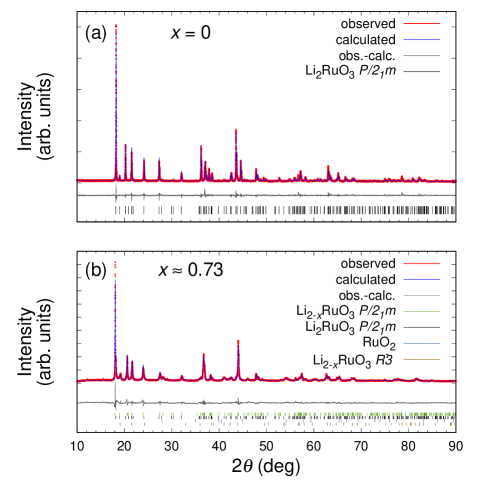
Figure 1 shows the high-energy powder XRD spectra for Li2-xRuO3 samples with various values of x measured at room temperature. This provides high-resolution spectra containing clear superlattice peaks at low angles. Figure 2 shows Cu XRD with Rietveld fitting. The pristine () sample exhibits the patterns expected for the pure Li2RuO3. The spectrum can be well fitted with the space group (SG) /m [No. 11, Fig 2(a)] as reported previously Miura et al. (2007); Kimber et al. (2014); Lei et al. (2014); Terasaki et al. (2015); Jimenez-Segura et al. (2016).
The delithiated samples exhibit patterns with substantial differences compared with the sample as described below. The sample, exhibiting almost single-phase behavior, has the (h00) and (00l) peaks shifted to lower angles and the (0k0) peaks shifted to higher angles (Fig.1(c)), indicating increase in the values of a and c and decrease in the value of b [Fig.6(c)]. Nevertheless, the spectrum of this delithiathed sample can be well fitted also with the SG /m [Fig 2(b)]. We designate the crystallographic phase observed in the sample as the D-phase. In addition to the main peaks associated with the D-phase, we can identify minor phases such as the S-phase Li2RuO3, RuO2, and yet another delithiated phase Li2-xRuO3 with (SG , No. 148) Kobayashi et al. (1995).
For the sample with , we find that the XRD peaks such as (001) and (020) are clearly split into two peaks [Fig.1(c)]: one group similar to those of the sample and the other similar to those of the sample. This fact indicates that the crystal-structure change due to delithiation is not continuous: there are two crystallographically distinct phases with and and they coexist in similar ratio in the sample.
In addition to the shifts in the main peaks, three small peaks but sharp peaks are observed in the delithiated samples at [d = 7.30, 6.18, and 5.71 Å, Fig.1(b)], indicating the presence of a superlattice structure. Although these small peaks have not been reported in pristine or delithiated Li2RuO3, a superlattice in Li2-xRuO3 (Mn, Sn) has been recently found as additional spots in electron diffraction Sathiya et al. (2013b, a). In these studies, the structure has approximately been described with the SG (neglecting the presence of the superlattice and Ru-Ru dimers even for small values of y). It has been suggested that the origin of the superlattice is the distortion in the oxygen positions Sathiya et al. (2013a); Li et al. (2016). Another possibility is an ordering of Ru valency (charge order) as we discuss latter. Since the SG in Li2-xRuO3 with the superlattice taken into account is not trivial, we hereafter consider the SG /m to evaluate the cell parameters and the Ru ion positions.
| x | a (Å) | b (Å) | c (Å) | (∘) | GOF | |||
|---|---|---|---|---|---|---|---|---|
| 0 | 4.922 | 8.787 | 5.896 | 124.36 | 0.970 | 10.96 | 7.31 | 1.50 |
| 0.73 | 4.937 | 8.630 | 5.898 | 123.54 | 0.991 | 11.35 | 4.37 | 2.60 |
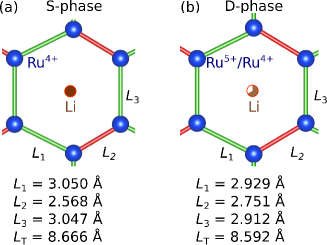
The cell parameters of the S and D-phases, obtained from the laboratory XRD data, are compared in Table 1. The parameters a and b of Li2-xRuO3 are longer and shorter than those of Li2RuO3, respectively. Studies on Li2Ru1-yMnyO3 revealed the same trend of change in a and b when lithium is deintercalated, although the structure of Li2Ru1-yMnyO3 is described with the SG Sathiya et al. (2013b). Furthermore, the relation of Li2-xRuO3 is closer to the unity than that of Li2RuO3 (Table 1). Thus, on average, the structure of Li2-xRuO3 seems to be more symmetric. Figure 3 compares the difference in the bond lengths between the S and D-phases. Reflecting the dimer-solid state in the S-phase, the dimer bond is 16% shorter than the long bonds and . In contrast, for the D-phase, the difference is only about 6%. In Sec. III.3, we will discuss local structures in more detail.
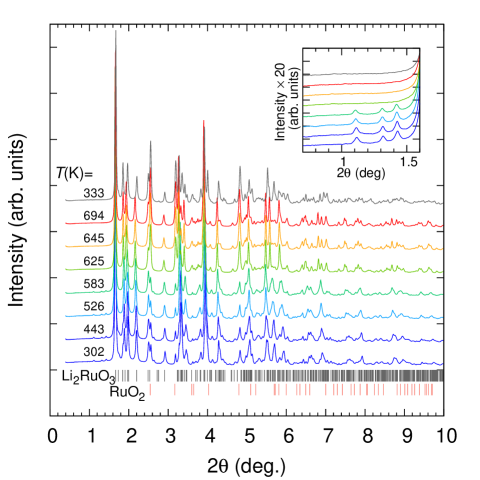
Figure 4 shows high-energy XRD patterns (, Å) of the sample (dominated by the D-phase) at selected temperatures on heating (302 K to 694 K) and after subsequent cooling (333 K). While heating, the three superlattice peaks between and disappear at K. At the same temperature, a sudden increase in the RuO2 peak intensity, for example the one at , is observed. These facts indicate the decomposition of Li2-xRuO3 () into Li2RuO3 and RuO2 starting from this temperature (see Appendix A for details).
III.2 Magnetization
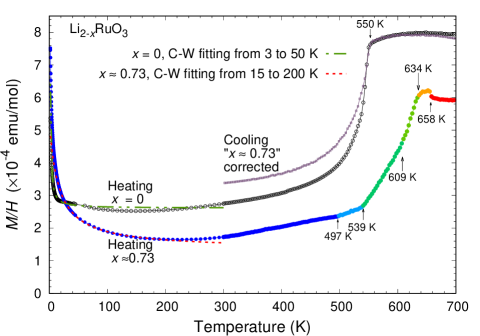
Figure 5 shows the temperature dependence of the magnetic susceptibility of the and samples. Diamagnetic contributions of ion cores have been subtracted Bain and Berry (2008). The overall shapes of curves for these samples differ in several aspects. At low temperatures, both samples exhibit Curie-like behavior; the difference will be discussed later. Both samples exhibit a minimum of magnetic susceptibility but at different temperatures: K for the sample with and K for the sample with . With increasing temperature, the magnetic susceptibility of both samples increases toward the transition from dimer solid to dimer liquid. The change of the magnetic susceptibility in the pristine sample Li2RuO3 is relatively gradual below K, followed by a sharp jump characteristic of the first-order transition (Appendix B). In contrast, the sample with does not exhibit a gradual change below the transition but exhibits a clearer change in the slope of the curve at K. Between this temperature and 609 K, no clear change in the averaged crystalline structure was observed and the superlattice peaks are maintained (inset of Fig. 4). Thus, the change in the susceptibility seems to be mainly linked to changes in the electronic state, but not to chemical decomposition.
At 609 K, there is another change of slope in the curve (Fig. 5). As already explained, the decomposition of Li2-xRuO3 into Li2RuO3 begins at this temperature (see also Appendix A). Therefore, the slope change at 609 K is mainly due to the decomposition. Thus, in the warming run the susceptibility of the sample above 609 K represents the sum of those of evolving multiple phases. While warming above 658 K, there is a slight but sharp drop in the susceptibility of the sample (dominated by the S-phase at this temperature). Across this temperature, there is no noticeable anomaly in the XRD spectra. Thus, the sharp drop probably reflects a reorganization of lithium or oxygen induced by the vacancies of lithium in the initial Li2-xRuO3.
The purple curve in Fig. 5 is obtained from the susceptibility in the cooling process of the sample after decomposition. Under this condition, the sample is dominated by Li2RuO3 and RuO2 (see Appendix A). The raw data matches with the susceptibility shown by the red curve of the sample above K. The molar susceptibility of Li2RuO3 contained in the decomposed sample was estimated by using Eq. 5 and the susceptibility of RuO2 Fletcher et al. (1968). The result is shown by the purple curve in Fig. 5, which indeed matches with that of the for the pristine Li2RuO3 above K. However, the molar susceptibility shown by the purple curve at room temperature is larger than that of the pristine sample. This is attributable to less conherent dimer configuration in Li2RuO3 after decomposition of Li2-xRuO3 Jimenez-Segura et al. (2016).
| x |
|
|
|
|
|
|
|
|||||||||||||||||
|---|---|---|---|---|---|---|---|---|---|---|---|---|---|---|---|---|---|---|---|---|---|---|---|---|
| 0 | 0.00039 | 0.96 | 0.0002610 | 0.056 | 3–50 | 1 | 0.039 | |||||||||||||||||
| 0.73 | 0.00625 | -16.0 | 0.0001349 | 0.22 | 15–200 | 3/2 | 0.333 |
We performed a Curie-Weiss fitting to the susceptibility at low temperatures. The fitting temperature ranges (shown in Table 2) are chosen so that the positive slope in associated with the dimer transition at does not affect the fittings. Results of the fitting with the Curie-Weiss law are shown with the broken curves in Fig. 5. From the fittings, we obtain the Curie constant (C) and the Weiss temperature () as emu K/mol and K for the sample, and emu K/mol and K for the sample. These results imply that the number of localized spins is rather small even for the sample.
In an earlier study, it is proposed that samples with broad magnetic transitions at are accompanied by a dimer decoherent configuration, namely dimer patterns breaking the long-range ordered configuration Jimenez-Segura et al. (2016). Such dimer decoherent configuration results in nondimerized Ru ions with finite spin. To examine the number of such nondimerized ions, we assume that they exhibit and for the S-phase and D-phase, respectively, and that they can be treated as nearly free spins. From the Curie-Weiss fitting described above, the quantity of nondimerized ions is 0.039% for the sample and 0.33% for the sample. It is important to note that the obtained number of nondimerized ions in the sample is much smaller than the number of vacancies of lithium, or equivalently the number of Ru5+ ions. This fact indicates that most of the Ru ions form dimers even in the D-phase.
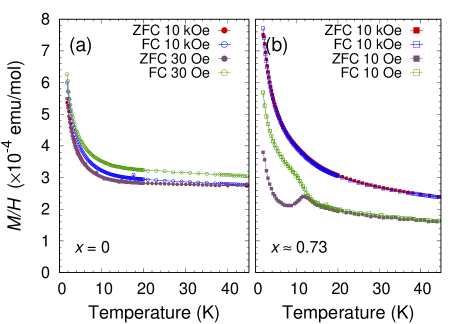
Figures 6(a) and (b) compare the low-temperature susceptibilities for the and samples. It is noticeable in Fig. 6(b) that the sample with at low fields exhibits magnetic hysteresis below 12 K. Since the Weiss temperature is negative, this hysteresis is probably due to magnetic ordering with antiferromagnetic interactions. No trace of superconductivity was found by AC susceptibility measurements using an adibatic demagnetization refrigerator Yonezawa et al. (2015) or transport measurements down to 0.1 K.
III.3 Electronic configuration of dimers
According to the outcome of the last section, the D-phase is dominated by Ru-Ru dimers. In this section, we discuss the electronic configuration of these dimers and their correlation with the crystalline structure.
We first discuss the probable valency of Ru ions in the D-phase. It has been demonstrated by X-ray photoemission spectroscopy, Mössbauer spectroscopy, electronic paramagnetic resonance measurements, and DFT calculations, that the deintercalation of lithium from Li2RuO3 leads to the valence change from Ru4+ to Ru5+. In higher x range than , where Ru ions are fully oxidized to pentavalent, it is revealed that further delithiation induces loss of oxygen, presence of peroxides (O), and oxidation of Ru5+ into Ru6+ ions Sathiya et al. (2013a, b); Li et al. (2016). Thus, in the sample of the present study with , the ratio of the amount of Ru5+ among the total Ru ions would be similar to this x value and the others remain Ru4+. In other words the valency of the sample can be approximately expressed as \ceLi_2-Ru^4+_1-Ru^5+_O3.
For the S-phase, it is expected that the magnetization is governed by the Ru4+ (4) ion. The origin of the decrease of the magnetization below has been attributed to the formation of dimers with molecular orbitals (MOs) with S 0 Miura et al. (2009). In contrast, the greater magnetization above has been explained by the partial breakdown of MOs. In the dimer-liquid state above , the Ru 4d orbitals keep the MO formed only by the , leading to dynamic dimers Kimber et al. (2014).
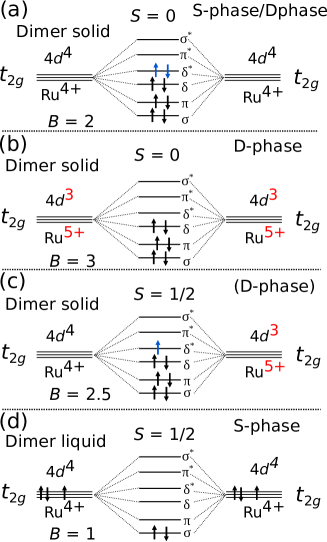
Since the Curie-Weiss analysis indicates that most of the Ru ions form dimers with even in Li2-xRuO3, there are three possible electronic configurations of the dimers in the dimer-solid state as depicted in Fig. 7. The configuration in panel (a) is what already proposed for the S-phase (Refs. Miura et al. (2007, 2009); Kimber et al. (2014)).
We propose that in the D-phase the most probable configuration for Ru5+ is the dimer formed between Ru5+ and Ru5+ [Fig. 7(b)], since such a dimer has electrons only in the lower-energy bonding states. In contrast, the dimers formed between Ru4+ and Ru4+ ions or Ru4+and Ru5+ ions [Fig. 7(a, c)] contain electrons also in higher-energy antibonding states. Actually, the amount of dimers with the configuration Ru5+-Ru4+ accompanied by spin must be quite small based on the observed small Curie constant.
The situation that most of the Ru ions form isovalent-spinless dimers is actually difficult to be realized if Ru5+ and Ru4+ ions distribute randomly. Thus, the Ru ions in the D-phase may exhibit charge ordering between Ru4+ and Ru5+ions. Such charge ordering may be the origin of the observed superlattice.
Since Ru4+–Ru4+ dimers contain a MO with higher energy than those of Ru5+–Ru5+ dimers i.e. , it is more likely that the of the Ru4+–Ru4+ dimers breaks at lower temperature than MOs of Ru5+–Ru5+[Fig.7(b)]. The where MOs of Li2RuO3 break has been demonstrated to depend on the dimer coherence configuration Jimenez-Segura et al. (2016). Thus, similar to the S-phase, the enhancement of magnetization in the D-phase at K (Fig. III.2) is probably related to the breaking of MOs of the Ru4+–Ru4+ dimers.
In the context of the linear combination of atomic orbitals, the bond lengths L of different dimer configurations can be estimated in terms of the quantity called the bond order B, which is evaluated as
| (3) |
where and are the numbers of electrons in the bonding and antibonding states, respectively. In Fig. 7 the values of B of the possible electronic configurations are shown. Pauling found an empirical relation between B and the bond length Pauling (1947, 1970):
| (4) |
where the value of f depends on the atoms and is the bond length for . Later this relation was derived from the Friedel model Adrian P. Sutton (1993). In order to evaluate the constant f, we use the value of the bond length of the dimer-liquid state of the S-phase ( Å) Kimber et al. (2014), where only the -MO is occupied i.e. [Fig. 7(d)]. We also use the bond lengths of the short bond in the dimer-solid state of the S-phase ( Å) where the MOs are occupied i.e. [Fig. 7(a)]. From these values, we obtain Å. By using these values we estimate the length of the Ru5+–Ru5+ bond in the dimer-solid state to be Å.
Since in the dimer-solid state of the sample, around 73% of the dimers are formed by Ru5+–Ru5+ ions and the rest by by Ru4+–Ru4+ions, the average length of the short bonds is expected to be 2.56 Å if we assume that the dimers are all located in the bonds. This is 0.04 Å shorter than the dimer entirely formed between Ru4+and Ru4+ ions in the S-phase. On the other hand, the observations for the sum of the bond lengths () of the D-phase (8.592 Å) is 0.074 Å shorter than that of the S-phase (8.666 Å). The excess of shrinkage of maybe due to the difference in ionic size between Ru4+ ( Å) and Ru5+ ( Å) Shannon (1976) in the nondimer bonds, although covalency needs to be considered. The reduced difference between short and long bonds in the D-phase suggests that some dimers are distributed in and as well.
IV CONCLUSION
We successfully synthesized the delithiated phase Li2-xRuO3, the D-phase, with structures distinct from the stoichiometric Li2RuO3, the S-phase. For the first time, we identify the magnetic properties of the D-phase. We found that the Ru ions also form dimers as in the S-phase. There should be two kinds of dimers in the D-phase: Ru4+–Ru4+ dimers as in the S-phase and additional Ru5+–Ru5+ dimers. The latter should have a new molecular orbital configuration, in which no electrons occupy antibonding states. We find that above K the D-phase exhibits a strong linear increase in the susceptibility. In analogy to the S-phase, this magnetic feature is most likely associated with the change from the dimer-solid to dimer-liquid states. Structural and magnetic properties indicate that the dimers in the dimer-solid state are located not only in the bonds but also in the and bonds. Such dimer distribution may lead to the observed superlattice structure.
Acknowledgements.
We thank G. Khaliullin, Z. Fisk, H. Takagi, M. Braden, and T. Fröhlich for useful discussions. We are grateful to Y. Honda for his support in the chemical composition analysis. We also acknowledge J. Wright and M. Di Michiel for their supports. This work was supported by the Grants-in-Aid for Scientific Research on Innovative Areas “Topological Materials Science” (KAKENHI Grant No. 15H05852), as well as KAKENHI Grant No. 26247060, from JSPS of Japan. M.-P. J.-S. is supported by the Japanese government (MEXT) scholarship.Appendix A Reaction of Li2-xRuO3 at high temperatures
In the XRD spectra shown in Fig. 4, the peak intensities of the RuO2 () peaks at 625 K are markedly higher than those at 583 K. See for example the peak at . We find that this enhancement starts at K (not shown in the figure). The structure of the main phase after heating above K is equivalent to that of the S-phase Li2RuO3.
Besides, as shown in Fig. 5 the temperature dependence of the susceptibility of Li2-xRuO3 changes substantially before and after heating to 700 K. The behavior after heating to 700 K becomes similar to that of pristine Li2RuO3 (compare purple and black lines in Fig. 5). While repeating magnetization measurements, the obtained curves remain almost equivalent to the purple curve in Fig. 5.
These results indicate that, when Li2-xRuO3 is heated above K, it decomposes into Li2RuO3 and RuO2 according to the following reaction:
| (5) |
This decomposition reaction seems to be triggered by the loss of oxygen.
Appendix B First-order transition of the S-phase Li2RuO3
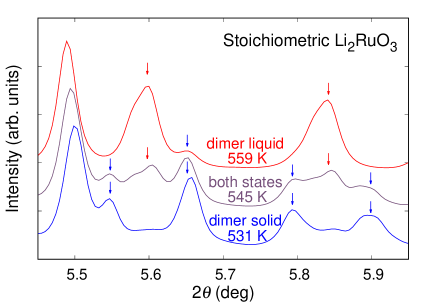
Initially the dimer transition of the pristine Li2RuO3 was considered to be second order Miura et al. (2007). However, recent studies indicate that the dimer transition is a first-order transition Terasaki et al. (2015); Jimenez-Segura et al. (2016). Figure 8 shows the high-energy XRD spectra of pristine Li2RuO3 at three different temperatures. At the temperature close to the dimer transition, the spectrum shows the combination of the structures of the dimer-solid and dimer-liquid states. This coexistence provides additional evidence for the first-order transition.
References
- Singh and Gegenwart (2010) Y. Singh and P. Gegenwart, Phys. Rev. B 82, 064412 (2010).
- Takayama et al. (2015) T. Takayama, A. Kato, R. Dinnebier, J. Nuss, H. Kono, L. Veiga, G. Fabbris, D. Haskel, and H. Takagi, Phys. Rev. Lett. 114, 077202 (2015).
- Kitaev (2006) A. Kitaev, Ann. Phys. 321, 2 (2006).
- Shitade et al. (2009) A. Shitade, H. Katsura, J. Kuneš, X.-L. Qi, S.-C. Zhang, and N. Nagaosa, Phys. Rev. Lett. 102, 256403 (2009).
- You et al. (2012) Y.-Z. You, I. Kimchi, and A. Vishwanath, Phys. Rev. B 86, 085145 (2012).
- Hyart et al. (2012) T. Hyart, A. R. Wright, G. Khaliullin, and B. Rosenow, Phys. Rev. B 85, 140510 (2012).
- Okamoto (2013) S. Okamoto, Phys. Rev. B 87, 064508 (2013).
- Scherer et al. (2014) D. D. Scherer, M. M. Scherer, G. Khaliullin, C. Honerkamp, and B. Rosenow, Phys. Rev. B 90, 045135 (2014).
- Miura et al. (2007) Y. Miura, Y. Yasui, M. Sato, N. Igawa, and K. Kakurai, J. Phys. Soc. Jpn. 76, 033705 (2007).
- Jimenez-Segura et al. (2016) M.-P. Jimenez-Segura, A. Ikeda, S. Yonezawa, and Y. Maeno, Phys. Rev. B 93, 075133 (2016).
- Terasaki et al. (2015) I. Terasaki, S. Abe, Y. Yasui, R. Okazaki, and H. Taniguchi, J. Mater. Chem. C 3, 10430 (2015).
- Kimber et al. (2014) S. A. J. Kimber, I. I. Mazin, J. Shen, H. O. Jeschke, S. V. Streltsov, D. N. Argyriou, R. Valentí, and D. I. Khomskii, Phys. Rev. B 89, 081408 (2014).
- Sarkar et al. (2014) S. Sarkar, P. Mahale, and S. Mitra, J. Electrochem. Soc. 161, A934 (2014).
- Kobayashi et al. (1995) H. Kobayashi, R. Kanno, Y. Kawamoto, M. Tabuchi, O. Nakamura, and M. Takano, Solid State Ionics 82, 25 (1995).
- Taminato et al. (2014) S. Taminato, M. Hirayama, K. Suzuki, K. Kim, Y. Zheng, K. Tamura, J. Mizuki, and R. Kanno, J. Mater. Chem. A 2, 17875 (2014).
- Mori et al. (2015) D. Mori, H. Kobayashi, T. Okumura, and Y. Inaguma, Electrochemistry 83, 1071 (2015).
- Kobayashi et al. (1996) H. Kobayashi, R. Kanno, Y. Kawamoto, M. Tabuchi, and O. Nakamura, Solid State Ionics 86, 859 (1996).
- Sathiya et al. (2013a) M. Sathiya, G. Rousse, K. Ramesha, C. P. Laisa, H. Vezin, M. T. Sougrati, M.-L. Doublet, D. Foix, D. Gonbeau, W. Walker, A. S. Prakash, M. Ben Hassine, L. Dupont, and J.-M. Tarascon, Nat Mater 12, 827 (2013a).
- Sathiya et al. (2013b) M. Sathiya, K. Ramesha, G. Rousse, D. Foix, D. Gonbeau, A. S. Prakash, M. L. Doublet, K. Hemalatha, and J.-M. Tarascon, Chem. Mater. 25, 1121 (2013b).
- Li et al. (2016) B. Li, R. Shao, H. Yan, L. An, B. Zhang, H. Wei, J. Ma, D. Xia, and X. Han, Adv. Funct. Mater. , n/a (2016).
- Daniel C. Harris (2006) Daniel C. Harris, Quantitative Chemical Analysis, 7th ed. (W. H. Freeman, 2006).
- Patnaik (2004) P. Patnaik, Dean’s Analytical Chemistry Handbook, 2nd ed. (McGraw-Hill Education, New York, 2004).
- Kouvel and Fisher (1964) J. S. Kouvel and M. E. Fisher, Phys. Rev. 136, A1626 (1964).
- Lei et al. (2014) H. Lei, W.-G. Yin, Z. Zhong, and H. Hosono, Phys. Rev. B 89, 020409 (2014).
- Momma and Izumi (2011) K. Momma and F. Izumi, J. Appl. Cryst. 44, 1272 (2011).
- Bain and Berry (2008) G. A. Bain and J. F. Berry, J. Chem. Educ. 85, 532 (2008).
- Fletcher et al. (1968) J. M. Fletcher, W. E. Gardner, B. F. Greenfield, M. J. Holdoway, and M. H. Rand, J. Chem. Soc. A , 653 (1968).
- Yonezawa et al. (2015) S. Yonezawa, T. Higuchi, Y. Sugimoto, C. Sow, and Y. Maeno, Review of Scientific Instruments 86, 093903 (2015).
- Miura et al. (2009) Y. Miura, M. Sato, Y. Yamakawa, T. Habaguchi, and Y. Ōno, J. Phys. Soc. Jpn. 78, 094706 (2009).
- Pauling (1947) L. Pauling, J. Am. Chem. Soc. 69, 542 (1947).
- Pauling (1970) L. Pauling, Mineral. Soc. Am. Spec. Pap. 3, 125 (1970).
- Adrian P. Sutton (1993) Adrian P. Sutton, Electronic Structure Of Materials, Oxford Science Publications (Oxford University Press, New York, 1993).
- Shannon (1976) R. D. Shannon, Acta Crystallographica Section A 32, 751 (1976).