Fe-K Line Time variability and Ni abundance of Distant Reflector in Seyfert Galaxies
Abstract
We have performed systematic studies of narrow Fe-K line (6.4 keV) flux variability and Ni-K line intensity for Seyfert galaxies, using Suzaku and XMM-Newton archival data. Significant Fe-K line variability of several tens percents was detected for a pair of observations separated by 1000–2000 days (Cen A, IC 4329 A, NGC 3516, and NGC 4151) and 158 days (NGC 3516). These timescales are larger by a factor of 10–100 than the inner radius of torus, consistent with the view that X-ray reflection by torus is a main origin of a narrow Fe-K line. Ni-K line was detected with level for the Circinus galaxy, Cen A, MRK 3, NGC 4388, and NGC 4151. A mean and variance of Ni-K to Fe-K line intensity ratio are 0.066 and 0.026, respectively. Comparing this with the Monte-Carlo simulation of reflection, Ni to Fe abundance ratio is 1.90.8 solar. We discuss the results and possibility of Ni abundance enhancement.
1 Introduction
X-ray spectra of active galactic nucleus (AGNs) exhibit various reprocessed features such as continuum absorption, fluorescence lines, reflection humps, absorption lines, and so on. Among them, fluorescence lines and reflection hump are prominent in the hard X-ray band. Reflection is believed to be mainly attributed to an accretion disk or a distant torus (Pounds et al., 1990; Awaki et al., 1991), but a broad line region (BLR) is also suggested to be an origin (Yaqoob & Padmanabhan, 2004; Nandra, 2006). Here we do not deal with a relativistic reflection from the inner accretion disk. The origin of torus and the connection to the BLR and accretion disk are important topics to understand the formation of accretion disk and the evolution of central massive black holes.
The structure of torus is not yet completely established. Optical polarization and far infrared (FIR) observations indicate that a torus exists with a size of 100 pc (Antonucci, 1993; Pier & Krolik, 1993). Recent near infrared (NIR) observations measured an inner torus radius as pc (Suganuma et al., 2006), where is a luminosity of the central engine in unit of erg s-1. A clumpy torus is suggested to understand a large geometrical thickness (Wilson & Tsvetanov, 1994), FIR spectral features (Nenkova et al., 2002), variable X-ray absorption (Risaliti et al., 2002), and so on.
Origin of narrow Fe-K lines in the AGN spectra is considered to be the torus (Awaki et al., 1991), and a line center energy supports this view (Yaqoob & Padmanabhan, 2004; Fukazawa et al., 2011a). On the other hand, it is suggested that there is a contribution of inner region to the narrow Fe-K lines, such as the BLR or the outer accretion disk, based on a wide range of narrow Fe-K line widths (Nandra, 2006; Bianchi et al., 2008) or a lack of Compton-thick reflection hump (Ursini et al., 2015).
The variability of Fe-K line flux is also a good probe to constrain the emission region. Searching for Fe-K line flux variability has been attempted, but little evidence has been reported. This is due to that a signal-to-noise ratio of Fe-K lines is not sufficient for the past observations, and Suzaku or XMM-Newton observations are needed. There are several reports about the flux variability of the Fe-K line. A short variability timescale of sub-day was reported for MRK 841 (Petrucci et al., 2002; Longinotti et al., 2004). On the other hand, an year-long timescale variability was reported for the Cen A (Fukazawa et al., 2011b), NGC 7213 (Ursini et al., 2015), and NGC 2110 (Marinucci et al., 2015). Shu et al. (2012) systematically studied the Chandra/HETG data of 32 AGNs and concluded that the Fe-K line flux lacks a corresponding response to the continuum variation, but the photon statistics are limited and a timescale on study is typically much shorter than one year. Therefore, systematic studies of Fe-K flux variability with good photon statistics and various timescales are needed.
Metal abundance of reflectors can be measured from fluorescence lines of several elements. High-quality XMM-Newton data for the first time resolve the Ni-K line for a few AGNs. The Ni-to-Fe K line ratio was reported to be 0.0700.010 for the Circinus Galaxy, 0.130.03 for NGC 1068 (Matt et al., 2004), and 0.0670.034 for MRK 3 (Pounds & Vaughan, 2006). Suzaku also detected fluorescence lines other than Fe-K from bright AGNs, such as Cen A (Markowitz et al., 2007), MRK 3 (Awaki et al., 2008), the Circinus Galaxy (Yang et al., 2009). However, systematic measurements of fluorescence lines other than Fe-K have not yet been performed. Metal abundance of torus is interesting in terms of connection with BLR and accretion disk. Metal abundance of BLR is reported to be supersolar by optical/UV observations (Warner et al., 2004). Based on studies of broad Fe-K and Fe-L lines associated with relativistic reflection, a very high Fe abundance of 2–7 solar has been suggested (Zoghbi et al., 2010; Reynolds et al., 2012).
In this paper, we report systematic studies of Fe-K line flux variability and Ni abundances, based on archival Suzaku (Mitsuda et al., 2007) data on Seyfert galaxies with good photon statistics, thanks to its large effective area and repeated observations. In addition, we utilized some archival XMM-Newton data in order to compensate the variability timescale of 0.5–1 yr. Throughout this paper, the errors are shown as a 90% confidence level. The solar abundance ratio is referred to the solar photospheric values of Anders & Grevesse (1989) for photoelectric absorption, reflection, and plasma model, and the cross-section for absorption model is set to that of Balucinska-Church & McCammon (1992).
2 Observations and Data Reduction
We analyzed the archival Suzaku data of X-ray bright AGNs. Selection of sample AGNs is the same as Fukazawa et al. (2011a); they are detected by HXD-PIN (Takahashi et al., 2007; Kokubun et al., 2007) above 15 keV. This ensures a high signal-to-noise ratio around the Fe-K lines. Also, time variability of the central engine can be traced above 10 keV freely from absorption. In addition, X-rays above 7 keV are important to produce Fe-K line photons. As a result, we looked at 261 observational data of 173 objects. All the data were obtained with the standard mode of XIS ( or ) and HXD. Data reduction of XIS (Koyama et al., 2007) and HXD-PIN is also the same as Fukazawa et al. (2011a), following the standard Suzaku data reduction. We then extracted the spectra of each XIS-FI (0, 2, 3) and XIS-BI (1) within 4 arcmin of the object, and the XIS-FI spectra were coadded; after 2006 Nov., XIS-2 data were not available, and thus we analyzed only XIS-0 and XIS-3 for the XIS-FI data. In the line studies, we fitted XIS-FI and XIS-BI spectra simultaneously with thr cross normalization set to be free.
For the analysis of Fe-K line variability, we selected AGNs which have been observed multiply with Suzaku. Furthermore, we gave criteria that a photon count after background subtraction is more than 2500 in 5–9 keV. In addition, we do not include objects with strong Fe-K absorption lines; NGC 1365, MRK 766, MRK 335, PDS 456, and Fairall 51. H1821+643 is excluded since the Fe-K line is not detected for all observations in the following analysis. As a result, 88 observational data of 25 objects are analyzed for study of Fe-K flux variability. Table 1 summarizes the data we analyzed for Fe-K line variability.
For the analysis of Ni-K line, we analyzed data whose observed photon count of XIS-FI after background subtraction is more than 5000 in 5–9 keV. Furthermore, we set a criteria for target selection that the degree of freedom in the fitting of the 7.1–8.0 keV band is more than 3 (for details, see §3.2). As a result, 143 out of 261 observations remain for studies of Ni-K line.
Since there are only a few pairs of Suzaku observations with a separation of 0.5–1 yr, we analyzed archival XMM-Newton data of objects which has been observed by Suzaku repeatedly in order to study the Fe-K line variability with a timescale of 0.5–1 yr. For such objects, we searched for pairs of observations with a separation around 0.5–1 yr, and found that nine objects have such a pair of observations. Table 2 summarizes the XMM-Newton data we analyzed for Fe-K line variability. We performed the standard data reduction with SAS 14.0.0. We extracted the source and background spectra and generated the response functions with xmmextractor. We fitted MOS-1, MOS-2, and PN spectra simultaneously with thr cross normalizations set to be free.
3 Results
3.1 Fe-K line variability
In order to derive the Fe-K line flux, we fitted the XIS spectra in 5–9 keV. In addition, we ignored the energy band of XIS-1 where the flux is less than 0.02 count s-1 keV-1, to avoid the background uncertainty. The continuum shape is determined by fitting the 2–10 keV XIS and 15–50 keV PIN spectra by the model including an partially absorbed power-law and a reflection component. Reflection component is modeled by pexmon (Nandra, 2006) with the inclination and high energy cut-off fixed to 60∘ and 1000 keV, respectively. Partial absorption is modeled by zphabs and pcfabs. We determined the continuum parameters, and used them in the fitting of Fe-K line region (5–9 keV) by fixing the parameters of absorption model of zphabs and pcfabs, and reflection fraction. Then, we replaced the model pexmon by the model pexrav (Magdziarz & Zdziarski, 1995), where only the reflection continuum is considered. As a result, free parameters of the continuum model are a photon index and a normalization of the power-law. In addition, we included five gaussians which represent three fluorescence lines of Fe-K (6.394 keV), Fe-K (7.08 keV), and Ni-K (7.47 keV), and two ionized Fe-K lines of He-like (6.7 keV) and H-like (7.0 keV), by the model zgaussian. The ionized Fe-K lines represent ionized emission or absorption lines observed in many AGNs (Fukazawa et al., 2011a), and we represent them by a positive or negative normalization of zgaussian model. Note that consideration of these two lines in the fitting introduces some additional errors to the fluorescence Fe-K line intensity. Energies of these lines other than the 6.4 keV line are fixed to the rest-frame energy and shifted by redshift, and widths of these lines are fixed to 0. The normalization ratio of the fluorescence Fe-K to the K line is fixed to 0.125 (Palmeri et al., 2003). The above modeling is the same as done in Fukazawa et al. (2011a). As a result, the fits are almost successful with a reduced of . Two exceptions are NGC 4151 (2012) and NGC 3783 (2009), where a low-energy-tail structure at the left side of the Fe-K line exists and thus their reduced is 2. This structure could be reproduced by the relativistic reflection model (Keck et al., 2015; Reynolds et al., 2012). Here, we added the broad gaussian but the narrow Fe-K line flux does not change beyond statistical errors; we treat only the narrow line for Fe-K line variability study. Two observations of NGC 4945 (2010 Jul 9) and MRK 841 (Jul, 2007) give a somewhat worse fit with a reduced of 2, and thus we do not treat these data. We took an average of the line flux of XIS-FI and XIS-BI, weighting them at 3 : 1, considering the observed number of photons. The difference between XIS-FI line flux and the average one is addded to the statistical error as a systematic error. In most cases, the difference is at most 2%, but it is sometimes up tp 5%. As a result, obtained Fe-K line flux of 88 observations (25 objects) is summarized in table 1. When we changed the fitting energy range to 6.0–8.0 keV, we obtained consistent Fe-K flux within errors. In order to quantify the flux variability of the central engine, we fitted the PIN spectra in 15–70 keV by power-law and derived the flux in 20–30 keV.
For XMM-Newton data, we analyzed the spectra in 5–8 keV by modeling the absorbed powerlaw plus 5 gaussians const*(phabs*powerlaw + 5*zgaussian) since the reflection continuum cannot be constrained by only XMM-Newton and is not significantly contributed to the Fe-K band for analyzed data, according to the Suzaku data. Five zgaussian models were treated in the same way as the Suzaku data analysis. All the spectra were well fitted by this modeling with the reduced . We also checked the pile-up by looking at the plots created with the tool epatplot and comparing the constant factors of each instrumental spectra. Then, the data of the brightest object Cen A suffered significantly from the pile-up, and other objects often have a scatter of constant factors with 10% difference between MOS-1 and MOS-2, and often with a larger difference between MOS and PN. Therefore, we did not treat Cen A data here. For other objects, we took an average of the line flux of MOS-1 and MOS-2, and the difference between MOS-1 line flux and the average one is addded to the statistical error as a systematic error. The results are summarized in table 2.
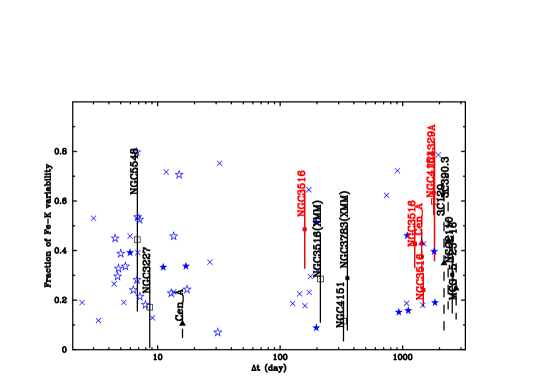
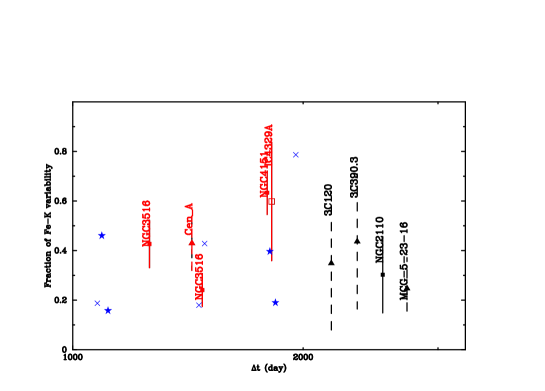
Figure 1 shows the variability fraction of Fe-K line flux against the separation time for a pair of two sequence observations. Error bars represent 1 level, and the stars and crosses represent upper limits. AGNs with significant variability of Fe-K line flux are indicated in Table 1. Since the objects have been observed as snapshots, we do not know the complete history of flux variability of the central engine, and thus we cannot consider whether the objects are expected to show a variability of Fe-K line flux or not. Suzaku measured the direct emission flux almost free from the absorption with PIN, and thus the PIN flux can be used as an indicator of variability of the central engine. Therefore, we plot the data with different symbols whether the PIN flux variance among all observations is % (square, star) or not (triangle, cross), and whether the PIN flux variability between a pair of observations is % (filled) or not (open). The latter is a direct evidence of flux variability. The former ensure that the objects varies significantly even if the flux does not vary between a corresponding pair of observations. If the flux variability is not significant, we give an upper limit. is concentrated on days and days. The data with days are monitoring observations within one observable window (several months), while those of days are reobservations after several years from the past observations. Several pairs of observations show a significant Fe-K time variability of several tens % with level for days; Cen A, IC 4329A, NGC 3516 (2 pairs), and NGC 4151. On the other hand, some objects show a possible variability with level Cen A, NGC 3227, NGC 5548 in days, NGC 3516, NGC 3783, NGC 4151 in days, and 3C 120, 3C 390.3, MCG-5-23-16, NGC 2110 in days. Fe-K line intensity is high for these objects, but equivalent width is not so large and exposure time is not so long, and thus the signal-to-noise ratio is low. One object, NGC 3516, with a separation of 158 days shows a significant Fe-K variability of 50%. This timescale is much shorter than those of significant variability at days. We return to this issue in the discussion.
| Object | Va | Dateb (ObsID Fe-fluxc Exposured ) | |
|---|---|---|---|
| 1H0323+342 | 2 | 090726(704034010 3.4 168.4 6.3) 130301(707015010 3.8 202.6 3.3) | |
| 1H0419-577 | 2 | 070725(702041010 5.6 267.3 8.3) 100116(704064010 6.6 246.2 6.8) | |
| 3C111 | 4 | 080822(703034010 19.1 244.8 11.2) 100902(705040010 24.9 161.4 24.0) 100909(705040020 22.9 158.8 29.2) 100914(705040030 25.5 160.8 25.5) | |
| 3C120 | 3 | V1 | 060223(700001030 22.5 102.6 20.8) 120209(706042010 30.3 366.1 21.6) 120214(706042020 29.6 236.1 21.1) |
| 3C390.3 | 2 | V1 | 061214(701060010 19.9 165.7 17.5) 130524(708034010 28.6 200.7 16.6) |
| 4C+74.26 | 2 | 071028(702057010 19.1 164.2 13.8) 111123(706028010 20.6 202.8 14.0) | |
| Cen_A | 6 | V2 | 050819(100005010 229.5 164.4 159.3) 090720(704018010 328.1 125.1 282.0) 090805(704018020 362.5 102.6 249.7) 090814(704018030 342.9 111.9 271.6) 130815(708036010 330.3 21.4 287.6) 140106(708036020 318.8 14.7 134.6) |
| ESO511-G030 | 2 | 120722(707023020 18.0 448.1 9.5) 120817(707023030 16.6 103.8 9.7) | |
| FAIRALL9 | 2 | 070607(702043010 27.2 231.6 10.4) 100519(705063010 25.6 458.6 13.3) | |
| IC4329A | 6 | V2 | 070801(702113010 60.2 34.1 53.9) 070806(702113020 61.1 39.5 61.7) 070811(702113030 62.8 37.5 61.1) 070816(702113040 68.2 33.0 55.6) 070820(702113050 54.9 33.3 43.0) 120813(707025010 87.7 235.2 55.3) |
| M81 | 2 | 060508(701022010 6.9 184.9 4.3) 110915(906004010 7.8 91.8 3.6) | |
| MCG-5-23-16 | 3 | V1 | 051207(700002010 80.4 200.5 49.6) 130601(708021010 100.3 319.1 51.4) 130605(708021020 99.0 277.7 47.3) |
| MCG-6-30-15 | 3 | 060109(700007010 23.2 292.4 16.3) 060123(700007020 23.9 193.8 17.4) 060127(700007030 22.7 207.5 18.4) | |
| MRK509 | 4 | 060425(701093010 28.0 36.9 24.0) 061014(701093020 23.0 59.9 22.9) 061115(701093030 26.8 27.5 22.3) 061127(701093040 21.3 46.2 19.1) | |
| MRK590 | 2 | 110123(705043010 12.7 123.2 2.8) 110126(705043020 10.5 81.8 2.5) | |
| MRK841 | 4 | 070122(701084010 13.0 75.0 7.9) 070723(701084020 12.1 73.8 8.7) 120105(706029010 13.5 488.7 5.1) 120118(706029020 13.1 220.6 6.6) | |
| NGC2110 | 3 | V1 | 050916(100024010 69.3 225.5 68.0) 120831(707034010 90.2 206.5 89.0) 150320(709011010 89.5 95.1 43.5) |
| NGC3227 | 6 | V1 | 081028(703022010 39.1 117.8 27.7) 081104(703022020 43.2 78.4 23.2) 081112(703022030 42.8 75.0 21.4) 081120(703022040 35.4 73.3 15.3) 081127(703022050 35.9 65.7 18.9) 081202(703022060 32.8 66.4 16.3) |
| NGC3516 | 8 | V2 | 051012(100031010 56.0 323.7 22.8) 091028(704062010 42.5 502.7 10.4) 130409(708006010 24.4 102.8 3.5) 130427(708006020 24.4 38.2 10.0) 130512(708006030 32.6 100.9 11.8) 130523(708006070 35.7 103.0 15.6) 130529(708006040 37.0 108.4 11.3) 131104(708006060 19.0 92.4 2.2) |
| NGC3783 | 2 | 060624(701033010 71.7 158.4 29.4) 090710(704063010 67.9 419.8 40.2) | |
| NGC4051 | 3 | 051110(700004010 15.7 255.3 6.4) 081106(703023010 19.3 373.1 12.0) 081123(703023020 18.8 111.3 8.5) | |
| NGC4151 | 4 | V2 | 061218(701034010 169.2 179.6 52.5) 111117(906006010 276.3 123.3 171.9) 111218(906006020 276.6 121.2 179.6) 121111(707024010 244.7 300.6 165.7) |
| NGC4945 | 3 | 060115(100008030 34.5 195.2 46.5) 100709(705047020 34.1 88.3 19.3) 110129(705047050 32.4 92.2 15.2) | |
| NGC5506 | 3 | 060808(701030010 88.0 96.3 59.3) 060811(701030020 92.1 115.6 63.6) 070131(701030030 83.3 77.5 59.8) | |
| NGC5548 | 7 | V1 | 070618(702042010 19.8 45.2 7.9) 070624(702042020 19.1 56.8 10.4) 070708(702042040 20.3 46.0 12.1) 070715(702042050 22.8 44.3 13.6) 070722(702042060 19.9 37.6 16.9) 070729(702042070 26.4 42.9 14.3) 070805(702042080 14.7 48.4 11.8) |
: ‘V1 and V2 denote objects for which Fe-K line variability is
detected with 1 or 2 significance
: Observation date with YYMMDD.
: Fe-K line flux in unit of photons s-1 cm-2.
: Exposure of XIS-FI (sum of 0, 2, and 3) in unit of kiloseconds.
: Hard X-ray flux in 20–30 keV in units of erg cm-2
s-1. For NGC 2110, HXD was not operated on the observation
YYMMDD=150320, we scaled the flux of YYMMDD=120831 by the ratio of
powerlaw normalization with a photon index of 1.81.
| Object | Va | Dateb (ObsID Fe-fluxc Exposured ) |
|---|---|---|
| Cen_Af | 130807(0724060601 104.8 25.9 106.8) 140106(0724060701 164.4 57.1 78.7) | |
| FAIRALL9 | 140102(0721110201 20.8 114.1 11.4) 140509(0741330101 21.6 336.6 11.6) | |
| MCG-5-23-16 | 010513(0112830301 46.1 29.9 35.6) 011201(0112830401 48.6 64.7 34.1) | |
| MRK509 | 001025(0130720101 21.7 65.1 15.0) 010420(0130720201 22.4 54.1 18.2) | |
| NGC3516 | V1 | 010410(0107460601 33.6 151.3 14.2) 011109(0107460701 43.2 317.8 16.2) |
| NGC3783 | V1 | 001228(0112210101 57.5 100.1 27.3) 011217(0112210201 44.6 342.9 17.5) |
| NGC4151 | 060516(0402660101 178.5 102.7 43.6) 061129(0402660201 174.1 82.3 66.5) | |
| NGC5506 | 080727(0554170201 73.4 225.1 65.5) 090102(0554170101 68.6 193.0 71.3) | |
| NGC5548 | 001224(0109960101 21.2 61.5 11.0) 010709(0089960301 26.4 216.8 17.2) |
: ‘V1 and V2 denote objects for which Fe-K line variability is
detected with 1 or 2 significance
: Observation date with YYMMDD.
: Fe-K line flux in units of photons s-1 cm-2.
: Exposure of sum of MOS-1, MOS-2, and PN in unit of kiloseconds.
: Hard X-ray flux in units of erg cm-2 s-1,
converted the absorption-corrected 2–10 keV flux to by using the
powerlaw with a photon index of 1.7.
: The data of this object were significantly affected by the pile-up.
3.2 Ni-K line intensity
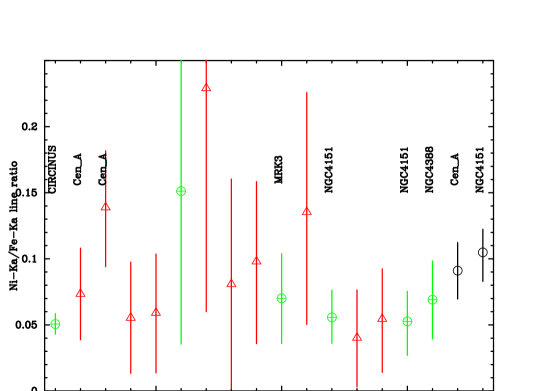
By using the same model as used in the Fe-K line analysis, we obtained the Ni-K line flux. Figure 2 shows an example of the observed Ni-K line. the Circinus Galaxy, which has the highest Fe-K line flux (Fukazawa et al., 2011b), shows a clear Ni-K line, while some other AGNs show a marginal Ni-K line as NGC 4388. Since a Ni-K line is very weak (1/201/30 times as intense as Fe-K line) , we limited the energy band to 7.1–8.0 keV to avoid a situation in which the continuum level mismatch causes an incorrect Ni-K line flux. The line parameters other than the Ni-K line are fixed to those of Fe-K line analysis. The spectra are well fitted with a reduced of in all observations. Although the Ni-K line was not significantly detected for most observations due to a weakness of the Ni-K line, 16 observational data (9 objects) show a significance of for Ni-K line detection. Figure 3 plots a line flux ratio of Ni-K to Fe-K line for these 16 observations, and table 3 summarizes the results. The Ni-K line fluxes of Cen A (2005), MRK 3, and the Circinus Galaxy are consistent with those in the past results of Suzaku observations (Markowitz et al., 2007; Awaki et al., 2008; Yang et al., 2009). The average of is 0.066 with a variance of 0.026 for measurements of single observation. The most accurate measurement was obtained to be for the Circinus Galaxy, whose equivalent width of the Ni-K line is prominently the largest. Several other AGNs also provide a mild measurement for Cen A, MRK 3, NGC 4388, and NGC 4151, but the Ni-K line significance is not so high.
When we changed the fitting energy range to 7.1–7.8 keV, we obtained consistent Ni-K flux within errors. When we modeled the continuum by only absorbed powerlaw (phabs*powerlaw in XSPEC) instead of the above model (which contains partial covering absorption and reflection), Ni-K flux does not change within errors. Exceptional cases are the results of Circinus Galaxy and NGC 4151, whose spectra around the Fe-K edge cannot be well represented by the simple absorbed powerlaw model, and thus their Ni-K flux changes due to the incompleteness of continuum modeling.
In addition to data analysis of single pointing observations, we summed the spectra of multiple observations for objects which were repeatedly observed, and analyzed them in the same way as data of single observation. We also plot the results in figure 3 (black circle). Ni-K line intensity ratio of multiple observations is systematically larger than that of single observation. For Cen A and NGC 4151, they were observed during the bright state several times and Ni-K line equivalent width became small. Therefore, the summation of multiple observations does not necessarily increase the signal-to-noise ratio and thus does not give a confident result. Therefore, we do not refer to results of multiple observations.
| Object | Obsa | Fe-K | Fe-EWc | Ni-K | Ni-EWc | reduced (d.o.f.) |
|---|---|---|---|---|---|---|
| CIRCINUS | 060721 | 337.3 4.9 | 1435 21 | 1.52 (23) | ||
| Cen_A | 050819 | 228.510.7 | 69 3 | 1.16 (112) | ||
| Cen_A | 090720 | 327.117.0 | 63 3 | 1.08 (120) | ||
| Cen_A | 090805 | 361.518.4 | 75 4 | 1.05 (116) | ||
| Cen_A | 090814 | 341.918.4 | 63 3 | 1.04 (120) | ||
| Cen_A | 140106 | 317.841.2 | 103 13 | 1.41 (24) | ||
| IC4329A | 070816 | 67.213.1 | 59 11 | 1.10 (22) | ||
| MCG+8-11-11 | 070917 | 50.2 4.9 | 68 7 | 0.83 (63) | ||
| MCG-5-23-16 | 051207 | 79.4 6.1 | 73 6 | 1.27 (77) | ||
| MRK3 | 051022 | 50.2 2.6 | 427 22 | 0.71 (9) | ||
| NGC2110 | 150320 | 88.5 8.8 | 94 9 | 1.32 (43) | ||
| NGC4151 | 061218 | 168.1 5.3 | 266 8 | 0.96 (66) | ||
| NGC4151 | 111117 | 275.312.7 | 92 4 | 1.10 (106) | ||
| NGC4151 | 111218 | 275.613.0 | 87 4 | 1.31 (107) | ||
| NGC4151 | 121111 | 256.9 7.5 | 102 3 | 1.50 (120) | ||
| NGC4388 | 051224 | 77.5 3.3 | 207 9 | 0.90 (39) |
: Observation date with YYMMDD.
: Line flux in unit of photons s-1 cm-2.
: Line Equivalent Width in unit of eV.


4 Discussion
Fe-K line flux of bright AGNs is typically around photons s-1 cm-2, and thus an effective area of cm2 around 6 keV is needed to obtain 10% accuracy with 100 ks observation. Actually, more effective area is needed to reduce a Poisson noise of continuum. Therefore, Suzaku XIS and XMM-Newton provide opportunities of Fe-K variability study. As a result, we obtained the results that some objects show a significant Fe-K variability of several 10 percents with days. This is an extensive result of the past reports (Fukazawa et al., 2011b; Ursini et al., 2015; Marinucci et al., 2015) On the other hand, clear evidences of Fe-K variability with days are not found. These facts are consistent with the view that a fluorescence narrow Fe-K line originates at the distant torus.
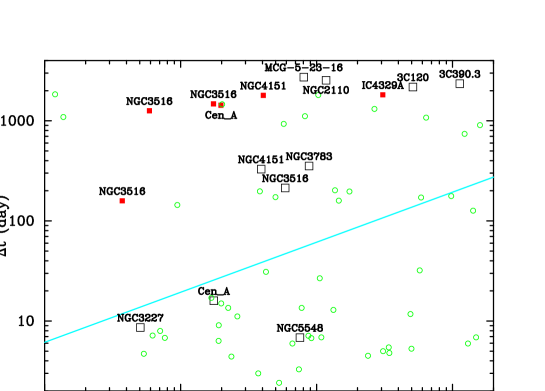
Figure 4 plots the separation timescale between a pair of observations against the X-ray luminosity in 20–30 keV. For the XMM-Newton results, we converted the absorption-corrected 2–10 keV flux to the 20–30 keV luminosity by using the powerlaw with a photon index of 1.7. We also plot the inner radius of torus measured by dust echo (Suganuma et al., 2006); we adjust the scale by NGC 5548 with the V magnitude of -19.12 (Suganuma et al., 2006) and X-ray luminosity (20–30 keV) of erg s-1. Observed timescale of Fe-K line variability is 10–100 times as large as the inner radius of torus. Fe-K line variability can appear if the central emission varies with a large amplitude of %, and timescale of such a large variability is typically around several months. On the other hand, Fe-K line variability will not be observed when the separation timescale between a pair of observations ish a shorter than the variability timescale of the central emission. Considering these effects, the separation timescale between a pair of observations where Fe-K variability is observed is biased to a longer timescale than a true light-crossing time of Fe-K emitting region. Therefore, observed timescale of Fe-K line variability is larger than the inner radius of torus. On the other hand, Fe-K line variability will be smeared when the central emission varies with a shorter timescale than the light-crossing time of Fe-K emitting region. The fact that Fe-K line varies with a separation timescale of 1000–2000 days between a pair of observations indicates that the Fe-K emitting region extends to 1 pc. Therefore, our results suggest that the Fe-K line emitting region in some AGNs is mainly the dust torus within 1 pc of the center, but does not conflict with some contribution of broad line region to the Fe-K line suggested as Minezaki & Matsushita (2015) or Gandhi et al. (2015).
One special example of significant Fe-K variability is NGC 3516, whose Fe-K line intensity varied by % with days. This variability was observed between May and November in 2013, when the flux of NGC 3516 was historically low in November. It is suggested that the inner radius of torus becomes smaller due to low X-ray luminosity of erg s-1 (15–50 keV) in 2013–2014. A detail analysis of NGC 3516 will be presented in a forthcoming paper.
CCD energy resolution is around 120 eV at Fe-K line and typical equivalent widths of Fe-K line for non-Compton-thick Seyfert galaxies are 50–200 eV (Fukazawa et al., 2011a). Therefore, in most cases, the Poisson noise of the continuum significantly contributes to the line flux accuracy. ASTRO-H SXS has an unprecedentedly good energy resolution of 4–6 eV (Takahashi et al., 2014), enabling us to measure the Fe-K line flux more accurately without contribution of continuum. Also, ASTRO-H SXS could measure the Fe-K line width with good accuracy, and time variability study could track the width variation and thus the change of inner torus radii.
Suzaku XIS observations also enabled us to measure Ni-K line flux of AGNs systematically for the first time, due to its stable and low background. is 0.03–0.07 for objects with Ni line detection. These are almost consistent with the past observations of XMM-Newton and Suzaku, but smaller than 0.130.03 of XMM-Newton measurements for NGC 1068 (Matt et al., 2004). Since Ni-K line is very weak, it could be affected by background subtraction or complex absorption features by highly ionized material. The former case would not be worried about in our results, since most objects with Ni-K line detection are apparently bright. Here, we discuss the Ni-K intensity ratio to the Fe-K, by considering the latter case.
The predicted Ni-K line intensity in the reflection spectrum of AGNs has been reported by Yaqoob & Murphy (2011) in detail, based on their MYTorus model. They assumed that the Ni-to-Fe abundance ratio is the same as that of Anders & Grevesse (1989) (Fe and Ni abundances against Hydrogen as and , respectively), fluorescence yield of K lines is 0.347 and 0.414 for Fe and Ni, respectively, the K branching fraction is 0.8811 for both of Fe and Ni. Comparing their Ni-K line prediction (figure 1 in their paper), together with their Fe-K line prediction (figure 2 in Yaqoob et al. (2010)), the Ni to Fe K line ratio is 0.030–0.033 and 0.032–0.038 for various inclination angles for the torus column density of cm-2 and cm-2, respectively. We also predicted the observed Ni to Fe K line ratio by simulating the X-ray reflection spectrum with the model pexmon (Nandra, 2006), in which the Ni to Fe K line ratio is assumed to be 0.050. We set an inclination angle as , a metal abundance of 1 solar, and an incident powerlaw photon index of 2. We convolved the simulated spectra with the XIS response, and fitted them in the same way as observed data, and obtained a line ratio of 0.051. This is larger than that based on Yaqoob & Murphy (2011), possibly due to the assumption of larger Ni abundance and/or Ni fluorescence yield for the database used in pexmon.
As an independent check, we performed the Monte-Carlo simulation of X-ray reflection by torus using the Geant 4 package, as performed by Odaka et al. (2011) or Liu & Li (2014), using the framework MONACO (Odaka et al., 2011). Detailed description on this Monte-Carlo simulation will be presented in Furui et al. (2016). The geometry is almost the same as that of Murphy & Yaqoob (2009). We assume Fe and Ni abundances, according to Anders & Grevesse (1989). Fluorescence yield (K branching fraction) of K lines is 0.3401 (0.8830) and 0.4060 (0.8825) for Fe and Ni, respectively (Furui et al., 2016). The absorption column density of the torus is assumed to be cm-2 toward the equatorial direction. The incident X-rays follow a power-law shape with a photon index of 2 in the range of 2–300 keV. The reflection spectrum is accumulated with a viewing angle of as , convolved with the XIS response function, and fitted in the same way as observed data. As a result, a Fe-K (6.4 keV) to Ni-K line intensity ratio becomes 0.035, almost consistent with that based on Yaqoob & Murphy (2011). When we changed the assumed Ni abundance to 0.5 solar or 2.0 solar, the Fe-K to Ni-K line intensity ratio varies almost proportionally to the assumed Ni abundance. Since the assumed abundance and fluorescence yield of Ni in ours and Yaqoob & Murphy (2011) is explicitly shown and typically used, we take the Ni to Fe K line ratio of 0.0350.003 for the solar abundance. In this case, the average of observed Ni to Fe K line flux ratios of indicates that the Ni to Fe abundance ratio is 1.90.8 solar, and it is marginally consistent with but somewhat higher than the solar abundance ratio. The Ni to Fe abundance ratio was reported to be larger by a factor of 1.5–2.0 than that of Anders & Grevesse (1989) for the Circinus galaxy (Molendi et al., 2003), and thus consistent with ours. This suggests possible evidence of enhanced Ni to Fe abundance ratio for the torus material of AGNs. Note that XMM-Newton results of NGC 1068 (Molendi et al., 2003) lead to the extremely large Ni to Fe abundance ratio of 3.70.9 solar.
However, as described in §3.2, we must pay attention to the continuum modeling in measurements of a weak Ni-K line. Possible systematics are caused by blue-shifted Fe-K absorption lines. Typical weak blue-shifted Fe-K absorption lines have an equivalent width of 10–30 eV (Tombesi et al., 2010). If such absorption lines exist in the CCD spectra but are not modeled in the narrow-band spectral fitting around the Ni-K line, the continuum would be underestimated and thus the Ni-K line equivalent width would be affected by 10 eV. Equivalent widths of observed Ni-K lines are typically 5–20 eV, and thus could be overestimated by several percents. This indicates that the measurement with higher spectral resolution is important to determine a Ni-K line flux unambiguously. Therefore, ASTRO-H SXS (Takahashi et al., 2014) observations of AGNs are promising for Ni-K line probing.
The enhanced abundance of Ni has recently been reported for a supernova remnant 3C 397 whose progenitor is considered to be a SN Ia (Yamaguchi et al., 2015), who suggested a production of 58Ni in the single-degenerated binary. The enhanced Ni to Fe ratio has also been reported for three core-collapse supernovae (Jerkstrand et al., 2015a) and gives constraint on the supernova explosion mechanism and structure of parent stars. Jerkstrand et al. (2015b) suggested that stars with a zero-age main sequence star (ZAMS) mass of 13–15 could produce an enhanced Ni to Fe abundance. If the enhanced Ni to Fe abundance of the torus is significant, more single-degenerated binary and more middle-mass stars are suggested to contribute to the enrichment of metals at the center of AGN-hosting galaxies. These issues are related with star formation phenomena, which are often associated with AGN activity. Therefore, information of Ni to Fe abundance ratio in other galaxies and AGNs is important to understand star formation history of galaxies and AGNs.
The authors also wish to thank all members of the Suzaku Science Working Group, for their contributions to the instrument preparation, spacecraft operation, hardware/software development, and in-orbit calibration. Y.F. is supported by JSPS KAKENHI Grant Number 2424401400. H.N. is supported by the Grant-in-Aid for Young Scientists (B) (26800095) from the Japan Society for the Promotion of Science (JSPS), and the Special Postdoctoral Researchers Program in RIKEN.
References
- Anders & Grevesse (1989) Anders, E., & Grevesse, N. 1989, Geochim. Cosmochim. Acta, 53, 197
- Antonucci (1993) Antonucci, R. 1993, ARA&A, 31, 473
- Awaki et al. (1991) Awaki, H., Koyama, K., Inoue, H., & Halpern, J. P. 1991, PASJ, 43, 195
- Awaki et al. (2008) Awaki, H., Anabuki, N., Fukazawa, Y., et al. 2008, PASJ, 60, 293
- Balucinska-Church & McCammon (1992) Balucinska-Church, M., & McCammon, D. 1992, ApJ, 400, 699
- Bianchi et al. (2008) Bianchi, S., La Franca, F., Matt, G., et al. 2008, MNRAS, 389, L52
- Fukazawa et al. (2011a) Fukazawa, Y., Hiragi, K., Mizuno, M., et al. 2011a, ApJ, 727, 19
- Fukazawa et al. (2011b) Fukazawa, Y., Hiragi, K., Yamazaki, S., et al. 2011b, ApJ, 743, 124
- Furui et al. (2016) Furui, S., Fukazawa, Y., Odaka, H., et al. 2016, ApJ, 818, 164
- Gandhi et al. (2015) Gandhi, Pa., Hoenig, S. F., & Kishimoto, M. 2015, arXiv:1502.02661
- Jerkstrand et al. (2015a) Jerkstrand, A., Timmes, F. X., Magkotsios, G., et al. 2015a, ApJ, 807, 110
- Jerkstrand et al. (2015b) Jerkstrand, A., Smartt, S. J., Sollerman, J., et al. 2015b, MNRAS, 448, 2482
- Keck et al. (2015) Keck, M. L., Brenneman, L. W., Ballantyne, D. R., et al. 2015, ApJ, 806, 149
- Kokubun et al. (2007) Kokubun, M., Makishima, K., Takahashi, T., et al. 2007, PASJ, 59, 53
- Koyama et al. (2007) Koyama, K., Tsunemi, H., Dotani, T., et al. 2007, PASJ, 59, 23
- Liu & Li (2014) Liu, Y., & Li, X. 2014, ApJ, 787, 52
- Longinotti et al. (2004) Longinotti, A. L., Nandra, K., Petrucci, P. O., & O’Neill, P. M. 2004, MNRAS, 355, 929
- Magdziarz & Zdziarski (1995) Magdziarz, P., & Zdziarski, A. A. 1995, MNRAS, 273, 837
- Marinucci et al. (2015) Marinucci, A., Matt, G., Bianchi, S., et al. 2015, MNRAS, 447, 160
- Markowitz et al. (2007) Markowitz, A., Takahashi, T., Watanabe, S., et al. 2007, ApJ, 665, 209
- Matt et al. (2004) Matt, G., Bianchi, S., Guainazzi, M., & Molendi, S. 2004, A&A, 414, 155
- Minezaki & Matsushita (2015) Minezaki, T., & Matsushita, K. 2015, ApJ, 802, 98
- Mitsuda et al. (2007) Mitsuda, K., Bautz, M., Inoue, H., et al. 2007, PASJ, 59, 1
- Molendi et al. (2003) Molendi, S., Bianchi, S., & Matt, G. 2003, MNRAS, 343, L1
- Murphy & Yaqoob (2009) Murphy, K. D., & Yaqoob, T. 2009, MNRAS, 397, 1549
- Nandra (2006) Nandra, K. 2006, MNRAS, 368, L62
- Nenkova et al. (2002) Nenkova, M., Ivezić, Ž., & Elitzur, M. 2002, ApJ, 570, L9
- Odaka et al. (2011) Odaka, H., Aharonian, F., Watanabe, S., et al. 2011, ApJ, 740, 103
- Palmeri et al. (2003) Palmeri, P., Mendoza, C., Kallman, T. R., Bautista, M. A., & Meléndez, M. 2003, A&A, 410, 359
- Petrucci et al. (2002) Petrucci, P. O., Henri, G., Maraschi, L., et al. 2002, A&A, 388, L5
- Pier & Krolik (1993) Pier, E. A., & Krolik, J. H. 1993, ApJ, 418, 673
- Pounds et al. (1990) Pounds, K. A., Nandra, K., Stewart, G. C., George, I. M., & Fabian, A. C. 1990, Nature, 344, 132
- Pounds & Vaughan (2006) Pounds, K., & Vaughan, S. 2006, MNRAS, 368, 707
- Reynolds et al. (2012) Reynolds, C. S., Brenneman, L. W., Lohfink, A. M., et al. 2012, ApJ, 755, 88
- Risaliti et al. (2002) Risaliti, G., Elvis, M., & Nicastro, F. 2002, ApJ, 571, 234
- Shu et al. (2012) Shu, X. W., Wang, J. X., Yaqoob, T., Jiang, P., & Zhou, Y. Y. 2012, ApJ, 744, L21
- Suganuma et al. (2006) Suganuma, M., Yoshii, Y., Kobayashi, Y., et al. 2006, ApJ, 639, 46
- Takahashi et al. (2007) Takahashi, T., Abe, K., Endo, M., et al. 2007, PASJ, 59, 35
- Takahashi et al. (2014) Takahashi, T., Mitsuda, K., Kelley, R., et al. 2014, Proc. SPIE, 9144, 914425
- Tombesi et al. (2010) Tombesi, F., Cappi, M., Reeves, J. N., et al. 2010, A&A, 521, A57
- Ursini et al. (2015) Ursini, F., Marinucci, A., Matt, G., et al. 2015, MNRAS, 452, 3266
- Warner et al. (2004) Warner, C., Hamann, F., & Dietrich, M. 2004, ApJ, 608, 136
- Wilson & Tsvetanov (1994) Wilson, A. S., & Tsvetanov, Z. I. 1994, AJ, 107, 1227
- Yamaguchi et al. (2015) Yamaguchi, H., Badenes, C., Foster, A. R., et al. 2015, ApJ, 801, L31
- Yang et al. (2009) Yang, Y., Wilson, A. S., Matt, G., Terashima, Y., & Greenhill, L. J. 2009, ApJ, 691, 131
- Yaqoob & Padmanabhan (2004) Yaqoob, T., & Padmanabhan, U. 2004, ApJ, 604, 63
- Yaqoob et al. (2010) Yaqoob, T., Murphy, K. D., Miller, L., & Turner, T. J. 2010, MNRAS, 401, 411
- Yaqoob & Murphy (2011) Yaqoob, T., & Murphy, K. D. 2011, MNRAS, 412, 1765
- Zoghbi et al. (2010) Zoghbi, A., Fabian, A. C., Uttley, P., et al. 2010, MNRAS, 401, 2419