Estimating the number of tissue resident macrophages
Abstract
I provide a simple estimation for the number of macrophages in a tissue, arising from the hypothesis that they should keep infections below a certain threshold, above which neutrophils are recruited from blood circulation. The estimation reads , where is a numerical coefficient, the exponent , and is the maximal number of pathogens a macrophage may engulf in the time interval, , between pathogen replications.
Tissue resident macrophages are a subject under intense research by the scientific community trm . The estimation of their numbers in different tissues is a key problem in the understanding of how the immune system works just after pathogens arrive to a given tissue. A serious effort in determining the average number of all cells of the immune system has already been initiated mapT . In my opinion, the only drawback of such an effort is that there is no idea of what numbers one should expect.
In the present paper, I use very simple reasonings in order to obtain an estimation for the number of resident macrophages in a tissue with cells.
I start by considering the free evolution of pathogens (bacteria, for example) in a tissue. In the initial instants, the number of pathogens follows an exponential law:
| (1) |
where is the number at , and is the replication time. The latter is of the order of one hour for bacteria bactT .
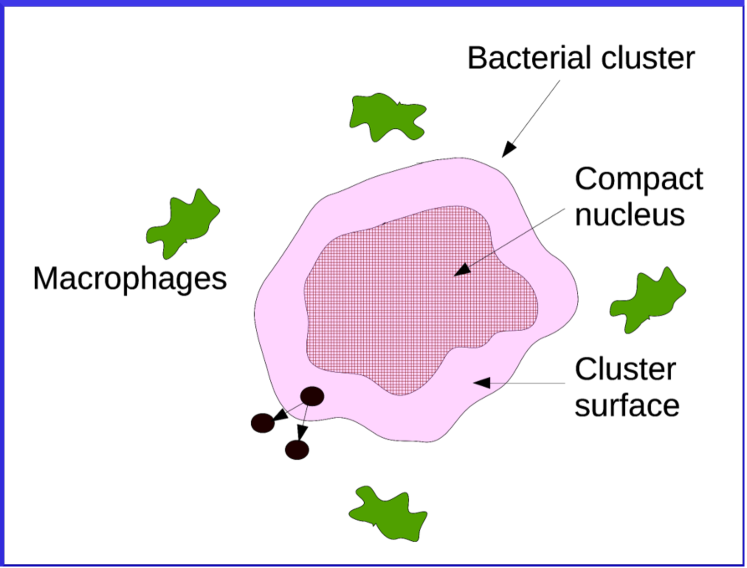
The exponential growth is, however, constrained by geometry. At later times, the pathogen cluster becomes compact, and only bacteria at the surface may divide, as shown in Fig. 1. The number of new pathogens in a time interval is, thus, proportional to the cluster surface:
| (2) |
Indeed, the cluster radius is , and its surface .
With regard to macrophages, I assume that they are uniformly distributed in the tissue, and exhibit high motility. As is large enough, if the bacterial cluster grows above certain limits, in a time interval of about 3 or 4 most of macrophages can be mobilized to the site of infection. Immunity in a tissue requires that the number of new pathogens, Eq. (2), should be lower than those destroyed by macrophages. The latter is , where is the number of macrophages that have already arrived to the site of infection, and is the maximal number of pathogens that a macrophage may engulf in the time interval . Thus:
| (3) |
where is the number of macrophages in the tissue.
Our final expression for comes from the idea of a threshold for , above which neutrophils are called to help fighting the infection. The number of injured cells is naturally related to . And these injured cells should not overcome a fraction of the number of cells in the tissue (let’s say, one hundredth of them, for example). Then, we can write instead of in Eq. (3), and introduce a new coefficient , instead of , arriving to:
| (4) |
This is the main result of the paper. The exponent following from Eq. (3) is , but I have written it more generally in order to consider the effect of different tissue effective dimensionality. With regard to , I guess that it takes similar values for all of the tissues. In around one hour time, a single macrophage in the hyper-activated state may destroy 50 or even a larger number of bacteria nmax , for example.
A schematics of what I expect is represented in Fig. 2 for the tissues analized in Ref picontrol . For simplicity, they are labelled by the organ in which they reside. I rewrite Eq. (4) as . In a log-log plot of vs , I expect a set of tissues to be grouped along a line with slope (a red line in Fig. 2). These are the “normal” tissues picontrol . The coefficient is very similar for all of them. This coefficient is related to the threshold fraction of tissue that is allowed to be injured by the pathogens.
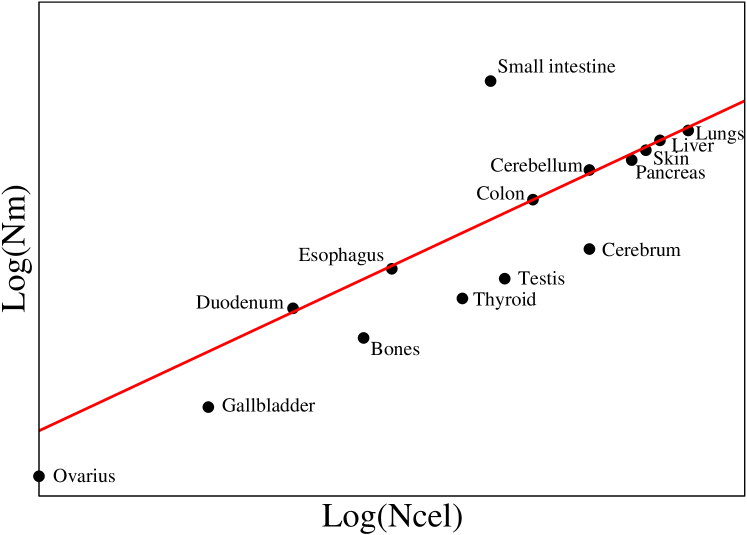
Precisely due to lower values of , tissues with “reduced” (or privileged) immune protection are located below the line of normal tissues. This reduction in the number of macrophages is compensated by physical barriers (cerebrum, testis) or by physiological conditions (high ph of bile in the gallbladder), for example.
On the other hand, I expect at least one tissue well above the line: the small intestine. This time not , but what is higher than normal is the average number of pathogens arriving to the distal end of the small bowel picontrol . Eq. (4) gives a lower bound for . In the small intestine, should be much larger than its lower bound in order to protect the tissue against pathogen overload.
In conclusion, I suggest that the number of macrophages resident in a tissue is proportional to , where . A group of tissues should follow this law (the normal tissues). In addition, there should be a second group located below the line of normal tissues, and at least one tissue, the small intestine, above that line. The hypothesis can be tested in the near future.
Acknowledgments. Support from the National Program of Basic Sciences in Cuba, and from the Office of External Activities of the International Center for Theoretical Physics (ICTP) is acknowledged.
References
- (1) L.C. Davies, S.J. Jenkins, J.E. Allen, and P.R. Taylor, Tissue-resident macrophages, Nat Immunol. 2013; 14(10): 986–995. See also related articles in the same review number of Nat. Immunol.
- (2) J.J.C. Thome, N. Yudanin, Y. Ohmura, et. al., Spatial Map of Human T Cell Compartmentalization and Maintenance over Decades of Life, Cell 159, 814-828, 2014.
- (3) H.J. Beckers and J.S. van der Hoeven, Growth rates of Actinomyces viscosus and Streptococcus mutans during early colonization of tooth surfaces in gnotobiotic rats, Infect. Immun.; 35(2): 583587 (1982).
- (4) E. Colucci-Guyon, J.-Y. Tinevez, S.A. Renshaw and P. Herbomel, Strategies of professional phagocytes in vivo: unlike macrophages, neutrophils engulf only surface-associated microbes, Journal of Cell Science 124, 3053–3059, 2011.
- (5) Augusto Gonzalez, Barrier plus PI control model for the immune system, arXiv:1602.06981.