Amplification of dust loading in Martian dust devils by self-shadowing
Abstract
Insolation of the Martian soil leads to a sub-surface overpressure due
to thermal creep gas flow. This could support particle entrainment into the atmosphere.
Short time shadowing e.g. by the traverse of a larger dust devil would enhance this effect.
We find in microgravity experiments that mass ejection rates are increased
by a factor of 10 for several seconds if a light source of 12.6 kW/m2 is turned off.
Scaled to Mars this implies that self-shadowing of a partially opaque dust devil might
lead to a strongly amplified flux of lifted material. We therefore suggest that
self-shadowing might be a mechanism on Mars to increase the total dust loading
of a dust devil and keep it self-sustained.
Keywords: Mars, surface – Mars, atmosphere – Atmospheres, dynamics – Dust, devils
1 Introduction
It is still a challenge to explain dust entrainment within Martian dust devils. A current overview of lifting mechanisms can be found in Neakrase et al. (submitted). It includes gas drag Greeley et al. (1980), pressure differences associated to a dust devils passage Balme and Greeley (2006) and thermal creep induced overpressures de Beule et al. (2014); Küpper and Wurm (2015). However, it is unclear if the necessary conditions (wind speed, pressure difference) are always met in the low pressure atmosphere on Mars.
This paper is not treating the initial formation of a dust devil in spite of all possible problems but assumes it to be existent. There is no doubt that dust devils can form as they have been observed frequently by now in different locations e.g. by rovers or satellite images Greeley et al. (2006b); Reiss et al. (2014).
While small dust devils might not be totally opaque, observations of larger devils show that they can be optically thick, casting shadows as they move Greeley et al. (2006b); Reiss et al. (2014). Depending on the size of a dust devil and its speed it takes several seconds to cross a spot of Martian soil along the trajectory. This implies that this spot, which is illuminated before the dust devil’s arrival is shadowed for several seconds during the devil’s passage. This change in illumination might have a severe impact on the dust flux lifted from the ground which is the focus of this work.
2 Illumination and lifting
By insolation the dust is heated. This heat can partly be reradiated from the surface as thermal radiation. The absorption length of infrared radiation is normally much shorter than for visible wavelength — therefore only the surface can cool efficiently, but heat is deposited along several layers at the top of the dustbed. Inside the dustbed thermal conduction and radiation between the single grains have to be considered. This results in a relatively flat temperature profile at the top and a decline to ambient temperature deeper inside the dust bed. If the illumination is switched off, the thermal radiation will quickly cool the surface, leading to a temperature profile with a maximum inside the dust bed.
In rarefied gases temperature gradients have peculiar consequences. The Knudsen effect Knudsen (1909) is important here, as it states that in equilibrium the pressures in two chambers communicating through a capillary smaller than the mean free path of the gas is determined by their temperatures
| (1) |
If not in equilibrium, the associated mass flow rate of the gas can be described for an indefinite capillary with a temperature gradient as (Muntz et al., 2002)
| (2) |
where is the average pressure in the capillary, the average temperature, is the cross section of the capillary, its radius, its length, is the Boltzmann constant, the molecular mass of the gas, is the temperature difference across the capillary, the pressure difference, and are the coefficients of thermal and pressure driven flow and depend on the Knudsen number (see Sone and Itakura (1990)).
The details will depend in a complex way on particle optical properties, dust bed morphology, time evolution of the ejections themselves, heat transfer and so on. We do not aim to construct a detailed model at this point but just quantify the ratio of ejected particle rates with and without illumination in measurements. Therefore, experiments have been carried out in microgravity at the drop tower in Bremen, where ejected particles can be observed without gravitational bias. Additional experiments using a centrifuge in parabolic flights provided data for low gravity of 0.3g, close to Martian gravity.
3 Drop tower experiments
The principle of the experiment is straight forward (fig. 2). The microgravity time for an experiment is about 9 s.
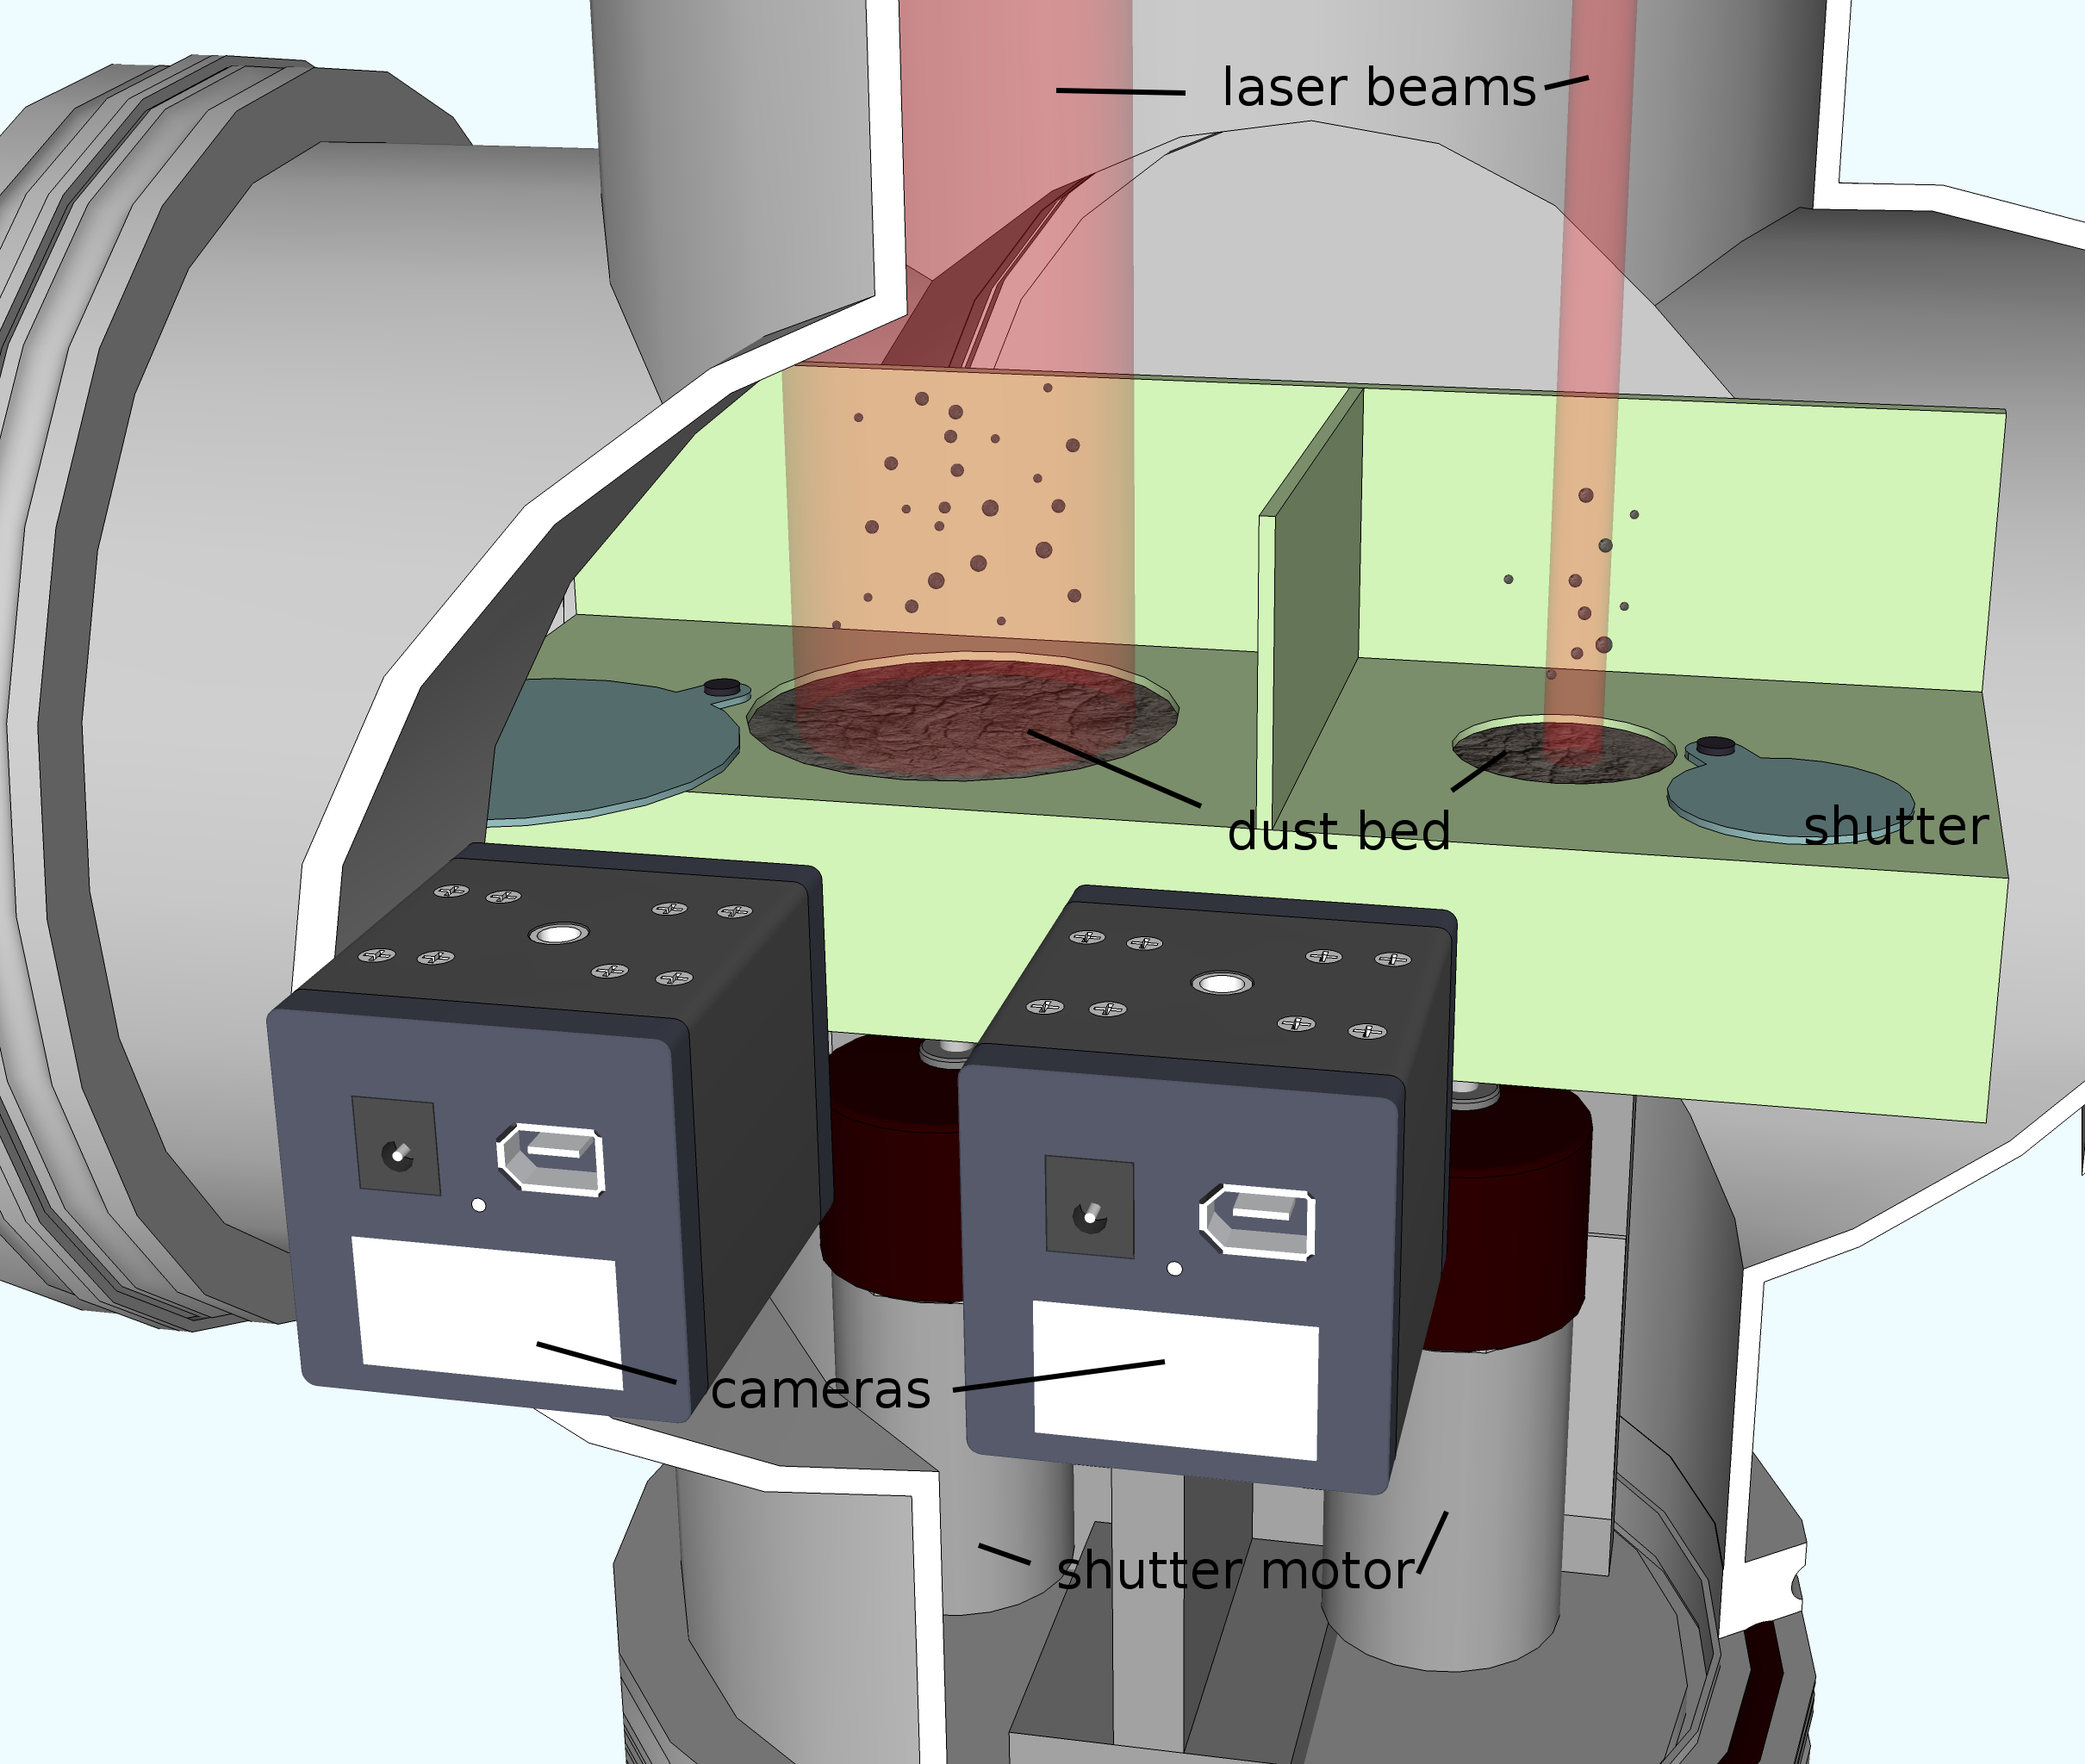
A dust bed is sealed during launch of the experiment capsule by a lid. The dust bed is placed within a vacuum chamber which is evacuated to 2 mbar pressure. Once microgravity is reached the cover is removed. The dust is then exposed to illumination. Illumination is provided by a diode laser. The laser is coupled into a glass fiber. The exiting light beam is shaped to provide an essentially parallel beam with a certain spot diameter on the dust bed surface. This illumination leads to particle ejections from the dust bed. Particles are observed by a camera from the side. The frame rate varied for the experiments considered between the two values of 1000 fps and 500 fps. The spatial resolution of the optical system is 68 /pixel. Illumination for the observations is provided by two means. First, scattered laser light provides imaging for particles ejected. In addition an illuminated background provides dark images of particles not within the laser light. During the course of an individual experiment the laser is turned off. Particles are now still visible in front of the illuminated background. Two slightly different configurations were used, one with a large infrared laserspot (955 nm wavelength, 3.4 cm spot diameter, 7 cm dust bed diameter, 2 cm dust bed depth, radiant flux at the surface of 12.7 kW/m2) and one with a smaler red laserspot (655 nm wavelength, 5.5 mm spot diameter, 3 cm dust bed diameter, 2 cm dust bed depth, radiant flux at the surface of 12.6 kW/m2).
The light sources were selected due to availability and limited number of microgravity experiments. Also, the high power available in IR allowed a larger spot diameter. It should be noted that this illumination differs from the solar spectrum. Ground based experiments of dust lifting with green and blue light do not suggest large differences in the relevant wavelength range but those are unpublished (de Beule, personal communication). Therefore, slight changes might have to be expected.
The dust sample was a JSC-1A Mars simulant (palagonite) which was heated for 1 h at 400∘K to remove residual volatile components. The samples had a broad size distribution below 1mm. The average particle size was 306 .
4 Data Reduction
The light flux used induces particle ejections during illumination and an increased particle ejection once the light source is turned off. Sample images from the video sequence are shown in fig. 3
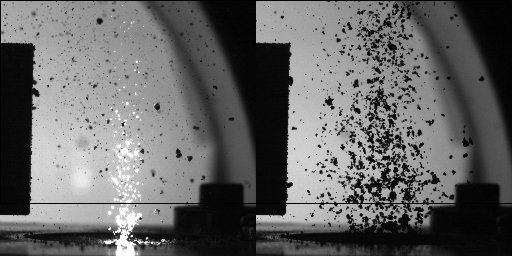
For the different experiments we used the following algorithm to deduce a ration between the ejected mass flux with and without illumination. From the video images with open lid at zero gravity, a median image was calculated. This background was subtracted from every image. The resulting images were binarized by setting a fixed brightness threshold. This outlines the particles illuminated by the laser. A second set of binarized images was generated in the same way to outline particles not illuminated by the laser by inverting the images first. Bright and dark particles were combined. Further image processing then provides the number of particles and the average size of individual particles. These are determined in a region of interest, which is always placed in the same way above the dust bed surface. This is also marked in fig. 3. These data were used to estimate the ejected volume of particles by
| (3) |
We neglect the fact that particles can shadow each other in dense regions. Due to different thresholds chosen for the two kinds of illumination the volume is discontinuous at the moment the light is switched off. Particles appeared larger while beeing illuminated. To account for this the ”light-off” part was scaled to the ”light-on” part right at the moment of switch-off, where no effects are visible yet. We note that we are only interested in ratios between volumes later on and the exact setting of the threshold is of minor importance.
Time series of the ejected volumes in the 5 different experiments available from the drop tower are shown in fig. 4. Time corresponds to the time the laser is switched off. At the laser is switched on and the lid is opened resulting in a slight overshoot of the ejections.
The two used geometries yield different volumes as the observed area and the active area were different. To compare the different datasets the volumes of each set were scaled to the mean volume in the last second before the laser was switched off.
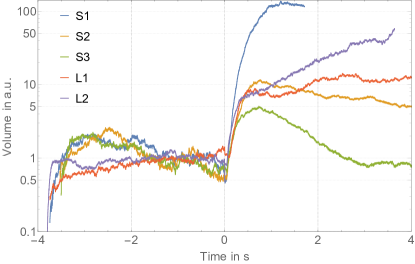
The volume is proportional to the mass ejection rate when the dwelltime of a particle in the image stays constant during the experiment. The data then give a direct measurement of the increase in mass flux if the illumination is turned off. For the measurements with the small laser spot the amplification declines with time. We attribute this to the fact that the local heat transfer changes easily if a pit is created by removing dust. This is not visible in the experiments with larger spots where the ejection rate stays high over the total observation time of 4s after the light source was turned off. Certainly, the ejection rate has to decrease eventually but this might occur on a timescale of rather 10 s not visible during the short time experiments Kelling et al. (2011).
To quantify the amplified flux in a single number we take the value reached 1.5 s after the light is turned off. This is shown in Table 1. The table includes a value from parabolic flights at 0.3 g as described below.
| Experiment | Value |
|---|---|
| Small Spot 1 | 136 |
| Small Spot 2 | 12 |
| Small Spot 3 | 5 |
| Large Spot 1 | 9 |
| Large Spot 2 | 15 |
| Parabolic flight | 15 |
Ignoring the outlier with an increase of a factor of 136 the ejection rate is enhanced by a factor of .
5 Modeling
Seen in fig. 1 there is a (thin) upper layer (length ) and a (thicker) lower layer (lenght ).
The mass flow rate of the two layers have to be equal . Assuming that the magnitude of the temperature difference in both regions can be described by (, and taken as constant) the pressure support on the top layer is:
| (4) |
This pressure difference can be compared for illuminated and shadowed settings. Temperature profiles in a dust bed under similar conditions were calculated by Kocifaj et al. (2011). For an illuminated dust bed . They give and if shadowed for 0.05 s (the timing needed for the first ejecta in the dark) This results in a factor of
| (5) |
which gives an enhancement factor of 10. Assuming that the pressure increase is correlated to the dust mass ejection rate, this matches the data to rough order of magnitude.
6 Scaling
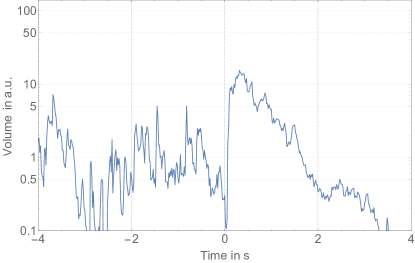
No experimental data is available yet to allow an unambiguous scaling of the amplification factor to other fluxes, dust samples or illumination spectra. Some data could be gained on the gravity dependence on parabolic flights. The setup was similar but placed on a centrifuge. We used a laser of 655 nm, a spot size of 10 mm diameter, a light flux of 9.8 kW/m2 and worked at an ambient pressure of 4 mbar. Here, we find an amplification factor of 15 for a similar kind of dust sample (sieved fraction between 0-125 mu m was used) at 0.3 g (see fig. 5). This matches the other values at 0g very well but it has to be noted that this was only one experiment that could be analyzed along the same line here. However, assuming the amplification is constant at different flux and gravity, an extrapolation to Martian conditions is possible.
A free parameter is the optical thickness of the dust devil casting the shadow. To apply our results to dust devils it has to be considered that most of the lifting initially is not done by the illumination but we assume it to be dominated by gas drag. The force of the threshold wind velocity to lift a particle can be written as force balance with the other acting forces
| (6) |
where is the gravitational force on a grain, the adhesion force which have to be balanced by a lifting force , the illumination induced force and the force due to the shadowing . The last two were considered above.
In a wind dominated entrainment the transport rate scales with
| (7) |
where the wind speed is and is the threshold velocity for particle entrainment.
As Küpper and Wurm (2015) show the reduction of the threshold velocity due to Martian insolation is about 10 % — as the reduction regarding the force is 19 %. By putting this in the threshold equation the relative strength of can be determined. Taking into account the enhancement by a factor 10 for shadowing the ratio between the thresholds then becomes
| (8) |
This gives the interesting result that particle entrainment could be possible by strong shadowing () even without wind. An optical thick dust devil might therefore be self-sustained even if the gas drag related forces would fall below the threshold. While the occurrence of a total shadow is unlikely, reduced flux is possible due to dust devils.
Combined with the transport rate this yields a dust mass flow enhancement of a dust devil due to self shadowing. It can be expressed by the transportrate with reduced threshold velocity compared to the transport rate obtained with neglecting this reduction
| (9) |
with the factor . A dust devil with opacity of 0.1 is plausible (Greeley et al., 2006a), and for a wind 5% over the threshold () this yields an amplification on Mars by a factor 4.4. We note that this enhancement strongly depends on the factor , and was made for a wind dominated flux which may not always be the case. Nevertheless, it is a plausible way to explain the difference in measured and calculated mass flows due to dust devils: Mass fluxes estimated from observations for Gusev Crater are 19 kg/(ms) (Greeley et al., 2006a). Estimations deduced from laboratory measurements by Neakrase and Greeley (2010) however reach only 3.66 kg/(ms), an enhancement of the mass flow by a factor of 5 is therefore needed to reconcile theory and measurement. While both, experiment and observations, need assumptions to derive the mass flux some uncertainty arises. Assumptions are also needed to scale this effect to the Martian surface as the experiment was not conducted under Martian conditions, therefore some uncertainty on the absolute strength of this effect exists.
7 Conclusions and caveats
These first measurements are far from being a complete explanation for enhanced dust mass flow in Martian dust devils. They are but a first set of microgravity experiments. Experiments at higher g-levels are difficult as ejected particles can fall back and escape detection. Ground experiments in wind tunnels might be feasible and are envisioned for future studies to complement pure insolation. However, the experiments stand as they are and clearly point in a direction where a change of insolation on timescales of seconds can have significant influence on soil / atmosphere interaction.
This mechanism cannot explain the initial formation of a dust devil. However if it comes into existence the survival time (as visualized by dust) and loft rates could both be increased. The exact scaling bears more than some uncertainty and should only be regarded as order of magnitude estimate. But if we scale the results in this simplified matter we might carefully speculate that this effect might explain the observed difference between dust loading of Martian dust devils estimated from observations and simulated.
8 Acknowledgments
This project is supported by DLR Space Management with funds provided by the Federal Ministry of Economics and Technology (BMWi) under grant number DLR 50 WM 1242 and DLR 50 WM 1542. Markus Kuepper is supported by the DFG. We appreciate that DLR provided access to parabolic flights and the drop tower. Our sincere thanks also go to C. de Beule for providing the data gathered during the drop tower campaign and also to T. Jankowski who provided Figure 2.
References
- Balme and Greeley (2006) Balme, M., Greeley, R., Sep. 2006. Dust devils on Earth and Mars. Reviews of Geophysics 44, 3003.
- de Beule et al. (2014) de Beule, C., Wurm, G., Kelling, T., Küpper, M., Jankowski, T., Teiser, J., 1 2014. The martian soil as a planetary gas pump. Nature Physics 10, 17–20.
- Greeley et al. (2006a) Greeley, R., Arvidson, R. E., Barlett, P. W., Blaney, D., Cabrol, N. A., Christensen, P. R., Fergason, R. L., Golombek, M. P., Landis, G. A., Lemmon, M. T., McLennan, S. M., Maki, J. N., Michaels, T., Moersch, J. E., Neakrase, L. D. V., Rafkin, S. C. R., Richter, L., Squyres, S. W., de Souza, P. A., Sullivan, R. J., Thompson, S. D., Whelley, P. L., Jan. 2006a. Gusev crater: Wind-related features and processes observed by the Mars Exploration Rover Spirit. Journal of Geophysical Research (Planets) 111, 2.
- Greeley et al. (1980) Greeley, R., Leach, R., White, B., Iversen, J., Pollack, J. B., Feb. 1980. Threshold windspeeds for sand on Mars - Wind tunnel simulations. Geophysical Research Letters 7, 121–124.
- Greeley et al. (2006b) Greeley, R., Whelley, P. L., Arvidson, R. E., Cabrol, N. A., Foley, D. J., Franklin, B. J., Geissler, P. G., Golombek, M. P., Kuzmin, R. O., Landis, G. A., Lemmon, M. T., Neakrase, L. D. V., Squyres, S. W., Thompson, S. D., Dec. 2006b. Active dust devils in Gusev crater, Mars: Observations from the Mars Exploration Rover Spirit. Journal of Geophysical Research (Planets) 111 (E10), 12.
- Kelling et al. (2011) Kelling, T., Wurm, G., Kocifaj, M., Klačka, J., Reiss, D., 2011. Dust ejection from planetary bodies by temperature gradients: Laboratory experiments. Icarus 212, 935–940.
- Knudsen (1909) Knudsen, M., 1909. Eine Revision der Gleichgewichtsbedingung der Gase. Thermische Molekularströmung. Annalen der Physik 336, 205–229.
- Kocifaj et al. (2011) Kocifaj, M., Klačka, J., Kelling, T., Wurm, G., Jan. 2011. Radiative cooling within illuminated layers of dust on (pre)-planetary surfaces and its effect on dust ejection. Icarus 211, 832–838.
- Küpper and Wurm (2015) Küpper, M., Wurm, G., Jul. 2015. Thermal creep-assisted dust lifting on Mars: Wind tunnel experiments for the entrainment threshold velocity. Journal of Geophysical Research (Planets) 120, 1346–1356.
- Muntz et al. (2002) Muntz, E. P., Sone, Y., Aoki, K., Vargo, S., Young, M., 1 2002. Performance analysis and optimization considerations for a Knudsen compressor in transitional flow. Journal of Vacuum Science Technology A: Vacuum, Surfaces, and Films 20 (1), 214–224.
- Neakrase et al. (submitted) Neakrase, L., Balme, M., Esposito, F., Kelling, T., Klose, M., Kok, J., Marticorena, B., Merrison, J., Patel, M., Wurm, G., Mar. submitted. Particle lifting processes in dust devils. Space Science Reviews.
- Neakrase and Greeley (2010) Neakrase, L., Greeley, R., Mar. 2010. Dust devil sediment flux on Earth and Mars: Laboratory simulations. Icarus 206, 306–318.
- Reiss et al. (2014) Reiss, D., Hoekzema, N., Stenzel, O., 2014. Dust deflation by dust devils on mars derived from optical depth measurements using th shadow method in hirise images. Planetary and Space Science 93, 54 – 64.
- Sone and Itakura (1990) Sone, Y., Itakura, E., 1990. Analysis of Poiseuille and thermal transpiration flows for arbitrary Knudsen numbers by a modified Knudsen number expansion method and their database. Journal of the Vacuum Society of Japan 33, 92–94.