Exploring the electron density in plasma induced by EUV radiation: II. Numerical studies in argon and hydrogen
Abstract
We used numerical modeling to study the evolution of EUV-induced plasmas in argon and hydrogen. The results of simulations were compared to the electron densities measured by microwave cavity resonance spectroscopy. It was found that the measured electron densities can be used to derive the integral amount of plasma in the cavity. However, in some regimes, the impact of the setup geometry, EUV spectrum, and EUV induced secondary emission should be taken into account. The influence of these parameters on the generated plasma and the measured electron density is discussed.
I Introduction
In the semiconductor industry, the photolithography process is used to create patterns on silicon wafers, an important step in microchip production. Due to diffraction, the characteristic pattern dimensions depend on the illuminating wavelength. However, it is becoming increasingly complicated to further reduce printed feature sizes with deep ultraviolet (DUV) light sources. As a result, extreme ultraviolet (EUV) lithography, operating at a wavelength of 13.5 nm, is expected to be used to print integrated circuits with very high resolution features.
For various reasons, a buffer gas is frequently used in both laboratory and industrial EUV light sources. However, even at low pressure (1 .. 30 Pa), EUV absorption leads to EUV induced plasma formation. There is a strong need for reliable diagnostics of EUV induced plasmas, because the interaction of an EUV induced plasma with the chamber interior and optical elements can lead to various plasma induced processes, such as surface etching, accelerated deposition of overlayers, and oxidation, depending on the exact constituents of the background gas Madey et al. (2006); Davis et al. (2007).
It was shown in R. M. van der Horst et al. (2014) that it is possible to measure the electron density of an EUV induced plasma, at relevant background gas pressures, by measuring the resonant frequency shift of a microwave cavity that contains the plasma. Although this is a highly sensitive method, it only allows the field average Gundermann et al. (2001) electron density inside the cavity to be determined.
Nevertheless, it is interesting to know the spatial distribution of plasma in the cavity, the electron temperature and other plasma parameters. Unfortunately, measuring all the relevant parameters experimentally is difficult due to the transient nature of the EUV induced plasma. For example, the insertion of a probe can yield unreliable estimates of plasma parameters for EUV induced plasmas, since, during and after the EUV pulse, the probe signal is heavily distorted Velden et al. (2008); Dolgov et al. (2015).
In this paper, we use a particle-in-cell model of the EUV-induced plasma to determine the spatio-temporal distribution of the electron density, the electron-ion balance, and the influence that some confounding factors may have on the spatio-temporal distribution of the plasma. Specifically, we studied how the changes in buffer gas, EUV intensity, EUV spectrum, and secondary electron emission change the plasma in the cavity.
We found that the EUV-induced plasma can be in a distinct “charged” regime. In this regime (as opposed to the quasi neutral regime, that corresponds to usual plasmas, such as glow discharges) the quasi neutrality is violated everywhere in the plasma. This regime forms due to the escape of fast photoelectrons from the plasma to the cavity walls. That leaves a highly charge imbalanced plasma. Such a plasma is not well suited for study with the microwave cavity method. However, it happens that such a regime is on the lower boundary of the methods sensitivity. Therefore, it can be easily detected and avoided.
We evaluated the accuracy of the simulations by comparing of the simulated field averaged electron density with the experimentally measured electron densities. We show that in the quasi-neutral plasma regime, the microwave cavity resonance shift provides an accurate tool for estimating plasma parameters, using only the spatial profile of the cavity mode and the EUV beam profile as input factors. In the charged regime, similar accuracy can only be obtained if on has knowledge of the EUV spectrum and secondary electron emission among other factors.
II Experiment
The experimental setup is described in detail in Ref. R. M. van der Horst et al. (2014). Therefore, here, we provide a minimal outline of the experimental procedure.
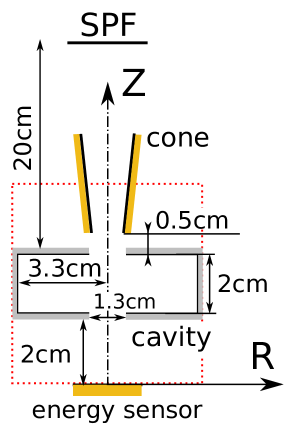
The plasma is ignited in a resonant cavity (see Fig. 1 ) by a beam of EUV radiation, which is introduced along the axis of the cylindrically symmetric cavity with an aperture and beam guide to prevent residual EUV from being incident on the cavity walls. The EUV radiation is produced by a xenon based discharge source and propagated through a spectral purity filter (SPF) to limit the spectrum to photon energies to the range of 70 to 120 eV. The spectrum of the source after transmission through the SPF is shown in Fig. 2.
The EUV power is monitored using a sensitive thermocouple, attached to a copper disk, located approximately 2 cm behind the cavity.
As described earlier, the average electron density in the resonant cavity was determined by measuring the resonant frequency of the microwave cavity (see R. M. van der Horst et al. (2014) for details).
III Model
The dynamics of the EUV-induced plasma was simulated using a two dimensional ( cylindrically symmetric) particle-in-cell plasma model with Monte Carlo collisions (PIC-MC). Both electrons and ions are represented by particles to describe the dynamics of the plasma accurately. The model follows the general PIC scheme, described elsewhere Birdsall and Langdon (1985).
III.1 Photoionization
The absorption of EUV radiation in the volume is included as a source of slow ions and fast electrons. To simulate photoionization, we use the measured spatial (axially averaged) and temporal profiles of the EUV pulse (see Fig. 5 and Fig. 9). We assume that the spatial profile and spectrum of the EUV source does not vary during EUV pulse.
The spatial and temporal coordinates of electron-ion pairs that are created by ionization events are added to the simulation domain using a probability distribution function that is weighted by the spatial and temporal profiles of the EUV pulse. The energy of the injected electrons is set to the difference between the photon energy, which is selected according to the EUV spectrum, and the ionization potential of the gas species (H2 or Ar). The the power spectral density of the EUV beam is recalculated along the axis to take into account absorption by the gas between SPF and cavity entrance using the Lambert–Beer law.
The electrons are emitted preferentially in the plane, with a distribution function
| (1) |
where is the angle between electron velocity and EUV beam direction and is the anisotropy factor. This form of angular distribution corresponds to photoionization by unpolarized light Gallagher et al. (1987). For hydrogen we use , as this agrees with experiments in the energy range of the measurements. For argon, we use data from Houlgate et al. (1976); Taylor (1977) for photon energies below 95 eV, and above 95 eV.
The energy dependent photoionization cross-sections are taken from Chung et al. (1993) and Samson and Haddad (1994) for H2. For argon there are several measurements (e.g. Samson et al. (1991), Chan et al. (1992) and West and Marr (1976)). We followed the recommendation of Berkowitz (2001) and used data from Samson et al. (1991) for the total absorption cross-section. The cross-section for photoionization to Ar++ is taken from Holland et al. (1979).
III.2 EUV the spectrum
To simulate the EUV plasma ignition, the spectrum of the EUV radiation must be taken into account. Unfortunately there is no simple experimental method to control the radiation spectrum in the relevant broad range of VUV to EUV photon energies (15.4 – 120 eV).
Therefore, as input for the simulations, we have used the source spectrum, measured before transmission through the SPF, convolved with the measured transmission spectrum of the Si:Zr SPF. This results in the EUV spectrum shown in Fig. 2.
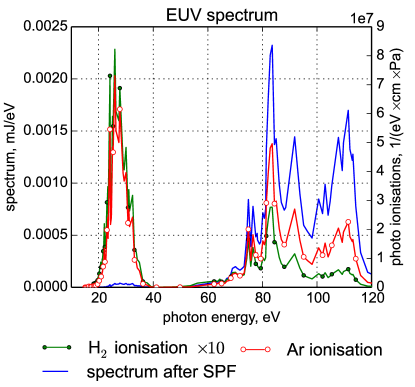
Fig. 2 shows that the transmission of the SPF filter in the 20 - 40 eV range, which is in the range of 1% of the total pulse energy, results in significant additional photoionization. This additional photoionisation is comparable to the direct photoionization due to the high energy part of the spectrum (i.e. 60 – 120 eV), because the photo absorption cross-section is very large in the 20 - 40 eV range compared to the 60 – 120 eV range.
Although the presence of the radiation in the 20 – 40 eV range has been confirmed by measurements, the absolute accuracy of the transmitted spectrum is not accurately known. This introduces an additional uncertainty into the simulations. Because the accuracy of the measurements of the EUV dose per pulse is also not know, we choose to keep spectrum shape constant and vary the EUV dose. This approach has the advantage that the integral accuracy of the simulations can be estimated by the difference between the measured EUV energy per pulse and that required for good agreement between experiments and simulations for both gases (i.e., we require that the same EUV power results in agreement between model and experiment over a range of experimental conditions).
III.3 Secondary electron emission and influence of chamber configuration
Emission of slow electrons from the walls to the plasma due to any reason can significantly decrease the plasma potential, or even lead to the collapse of the plasma sheath Hobbs and Wesson (1967) leading to effective energy transfer from the electrons to the walls. Therefore, it is important to take into account secondary electron emission (SEE) from the the surfaces that are exposed to the plasma.
For the considered setup, energy is only injected into the plasma during the EUV pulse via photoionization and photoelectrons emission from irradiated surfaces. Therefore, the decrease of the plasma potential or sheath collapsed due to SEE can result in significant loss of fast electrons to the walls. Hence, the maximum number of ionization events also decreases.
III.3.1 Secondary electron emission
In order to estimate the role of emission from the aluminum cavity walls due to electron impact, we have considered three cases. The first corresponds to no secondary electron or ion induced emission from the walls. In the second case, electron emission due to both electron and ion impact is taken into account. The data for aluminum shows a significant spread of possible emission yields. Nevertheless, for the energy range of primary photoelectrons (e.g. 50 – 75 eV) the reported values are typically larger than 0.3 Baglin et al. (2000); Lin and Joy (2005) so we use the yield reported for clean aluminum in Ref. Lin and Joy (2005).
The yield also significantly depends on the surface conditions. For aluminum with a native oxide, the emission yield Belhaj et al. (2013) is significantly higher than for pure aluminum and corresponds to the yields found for dielectric materials Dawson (1966); Tondu et al. (2011). Therefore, in the third case, the yield for aluminum with a native oxide is used. The yield is estimated from Ref. Belhaj et al. (2013) for energies below 25 eV, and extrapolated linearly for energies above 25 eV.
We do not discriminate between backscattered electrons and true secondary electrons, because, for our study, only the total flux from the surface is important. In the model, we assume that most of the emitted electrons are cold, i.e. they have a significantly lower energy compared to the energy of the impacting electrons. However, for electron with energies below 10 eV this approximation is not valid, due to the higher probability of elastic backscattering. But, these backscattered electrons do not have sufficient energy to ionize more of the background gas, if not accelerated by a plasma potential. Therefore, the additional error due to this approximation is expected to be small.
III.3.2 influence of chamber configuration
The configuration of the experimental setup is presented in Fig. 1. The SPF filter, copper cone and copper disc of energy sensors emit secondary electrons under EUV irradiation. But, these electrons do not contribute directly to the ionization inside cavity, because the number of high energy secondaries is small and the electron flux is not focused.
To estimate the influence of this effect, we have simulated two geometrical configurations: a large volume, which includes the cone and disc (the dotted rectangle in Fig. 1), and a small volume, which includes only the cavity with periodic boundary conditions at the cavity openings. We have not included the full length of the cone and SPF into simulations, because the aspect ratio of the cone diameter to length is very small ( i.e. 0.05).
III.3.3 Photo electron emission from surface
In order to model the configuration that includes the cone and copper disc, photoelectron emission should be taken into account. The energy spectrum of photoelectrons emitted from the copper disk and cone surfaces are calculated from Henke et al. (1977):
| (2) |
Here is the probability of emitting an electron with energy, , from a surface with a work function, . For copper eV Lide (2003). For electrons emitted from the surface, we assume an angular dependence given by a cosine emission law Henke et al. (1977). The effective photoelectron yield from copper was set to 0.05 electron/photon Day et al. (1981).
III.4 Grid resolution
The grid resolution was chosen to resolve the Debye length. To estimate the minimum Debye radius in simulations, we assumed a temperature of 0.5 eV and an estimated maximum plasma density. The maximum plasma density was estimated from direct photoionization (i.e., Fig. 2), increased by the maximum possible number of impact ionizations that the primary electrons could generate, i.e., for a 90 eV photon, the photoelectron has an energy of 74.6 eV, therefore, the maximum number of ions produced by that electron is 5, increasing the plasma density by a factor of 5. Note, however, that, in the simulation, the contribution of fast photoelectrons is significantly smaller due to the contribution of inelastic collisions, and that many photoelectrons escape to the wall before generating the maximum number of ions.
III.5 Cross-sections sets
Two independent cross-section sets are used for modelling hydrogen and argon. Both sets consists of electron and ion collisions with corresponding neutrals. The collisions between plasma species and three body processes are neglected due to their low probability under the conditions considered here.
We make use of the procedure described in Nanbu (1994) to perform Monte Carlo collisions with the background gas. We tested the consistency of our implementation by modeling swarm experiments and found good agreement with experimental values Dutton (1975) for the first Townsend electron ionization coefficient, the electron mobility, for H+ and H mobility in hydrogen Graham et al. (1973), and for Ar+ and Ar++ mobility in argon Hornbeck (1951); Johnsen and Biondi (1978).
III.5.1 Hydrogen
To accurately model electron collision related processes in hydrogen discharges with a Monte Carlo (MC) model, one needs to take into account the differential cross-sections for ionization and excitation processes. As described in detail in Mokrov and Raizer (2008), the particular choice of the angular dependence of cross-sections significantly influences the simulation results.
For electron – H2 collisions we adopt a set of cross sections found in Ref. Mokrov and Raizer (2008) with small corrections. We use an experimentally determined doubly differential cross-section for the electron impact ionization of hydrogen Shyn et al. (1981); Rudd et al. (1993). Electron elastic scattering and hydrogen electronic excitations, and angular scattering data taken from Brunger and Buckman (2002).
The set of cross-sections for collisions between ions and hydrogen is based on Šimko et al. (1997) because this set provides good agreement with swarm data for ions in hydrogen.
We neglect the formation of H-, because the cross-section of dissociative electron attachment is very low, and the density of vibrationally excited hydrogen molecules too low to significantly contribute to the production of H-.
III.5.2 Argon
For electron – Ar collisions we adopt a set of cross-sections found in Ref. Hayashi (2003); Phe . We add electron impact ionization of Ar to Ar++ from Ref. Rejoub et al. (2002) to the cross-sections set. We use differential cross-section data for electron impact ionization from Ref. Yates and Khakoo (2011). The data from Ref. Yates and Khakoo (2011) covers incident electron energy range 17 – 30 eV. To the authors knowledge there is no systematic differential ionization cross-section measurements for incident electrons in the energy range of 30 – 100 eV. Hence, for energy range above 30 eV, we use empirical formulas from Ref. Fiala et al. (1994).
We neglect ionization via the metastable argon exited state. The density of metastables produced in one EUV pulse is comparable to the plasma density (e.g. 1/cm3). The maximum of cross-section for electron impact ionization of the metastable argon exited state is approximately 1/cm2 Deutsch et al. (1999). Therefore, the maximum corresponding ionization frequency can estimated as 1/s. The simulated plasma evolution is less than 10 , yielding an upper bound of 0.02 ionization events per electron for the step wise ionization. This is negligible compared to the direct EUV ionization and ionization by fast photoelectrons. Moreover, there is no pulse-to-pulse accumulation because the time between EUV pulses is larger than metastable’s lifetime due to quenching on the chamber walls.
III.6 Calculation of the field average electron density
In order to compare the model results with experimental measurements, the simulated spatially-resolved electron density was averaged over the spatial profile of the resonant microwave cavity mode as follows.
| (3) |
The magnitude of the microwave field was very small (mV range), therefore, it was not included in PIC-MC simulations.
IV Results and discussion
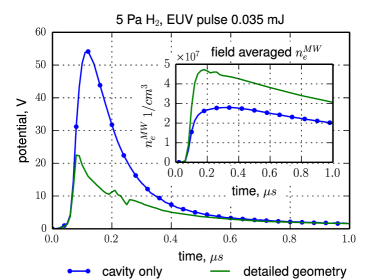
The ignition and decay of the EUV induced plasma was simulated for a series of argon and hydrogen pressures (i.e. 1 Pa, 5 Pa, 10 Pa) to compare with experimental results. The best agreement with experiments for both gases and all considered pressures was obtained in simulations where we have included the larger chamber configuration, and used a spectrum that includes a VUV contribution. The comparison between simulated field averaged electron density and experimental measurements is presented in Fig. 3 and Fig. 4.
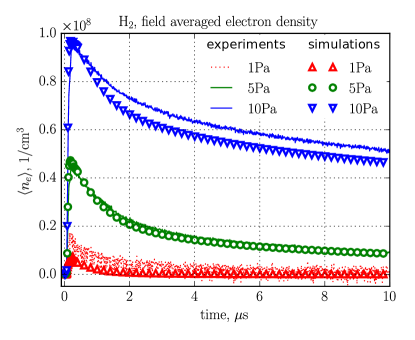
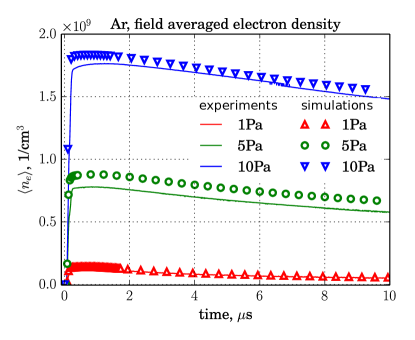
In these simulations, we have decreased the EUV energy per pulse to 0.035 mJ/pulse from the experimentally measured value of 0.044 mJ/pulse. This difference, in combination with relative errors for the field averaged electron densities (i.e. in Fig. 3 and Fig. 4), yields a cumulative uncertainty, which is comparable to the 30% error margin of of the experiment R. M. van der Horst et al. (2014).
IV.1 Relation of field averaged electron density and simulated values
The cavity method allows the field averaged electron density to be determined. But, the relationship of this quantity to the actual plasma density is not straightforward. During the first 1 , the simulated plasma is much denser than that measured by the cavity. However, as the plasma expands, the difference between simulated plasma density and cavity measurements becomes smaller. For 5 Pa H2 at 10 s, the ratio between the simulated plasma density and that measured by the cavity is only about a factor of two (see Fig. 5).
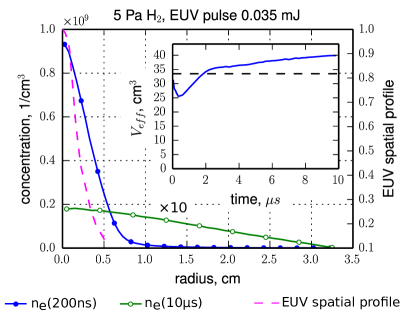
Nevertheless, the plasma density measured by the cavity is very useful to estimate the amount of the plasma in the cavity. Let us define the effective volume of the cavity as ratio of the full number of electrons in the cavity to the cavity measured electron density i.e. . In simulations, this quantity varies only by about a factor of two during the 10 simulation window (see insert in Fig. 5). Moreover, the estimation of the effective volume, based on the EUV spatial profile (as an approximation to the EUV plasma distribution), and the spatial profile of the microwave cavity mode (see Part I) agree well with the simulated values (dashed black line in the insert in Fig. 5)
Therefore, the amount of EUV induced plasma can be estimated from the measured cavity response with a relative accuracy of about 30%. Hence, the amount of absorbed radiation can be estimated with similar accuracy, if the other factors (see below) that effect plasma formation are eliminated.
The simulated evolution of the effective volume is non monotonic in time. A similar effect was observed in experiments via the ratio of the electron densities measured using 010 and 110 cavity modes van der Horst et al. (2015b). However, in simulations, the decrease of the effective volume just after the EUV pulse is caused by the convolution of the plasma density with the spatial profile of the microwave mode in the cavity.
IV.2 Effect of VUV part of the spectrum
As discussed in section III.2, the EUV spectrum after passing through the SPF (see Fig. 2) has two distinct regions: a low energy (20 – 40 eV) VUV part, and a high energy (60 – 120 eV) EUV part. Our simulations show that the VUV contribution is needed to produce consistent results for both gases with the same amount of the radiation dose per pulse. This is because the average number of ionization events per absorbed photon can be larger than one if the emitted fast photoelectron produces addition ionization events.
In our simulations, the average number of ionizations per absorbed EUV photon was observed to be approximately one for H2 and two for Ar. To obtain the observed electron densities without including ionization due to VUV, the EUV pulse energy must be increased and set to different values for argon and hydrogen.
IV.3 Effect of secondary electron emission due to EUV radiation
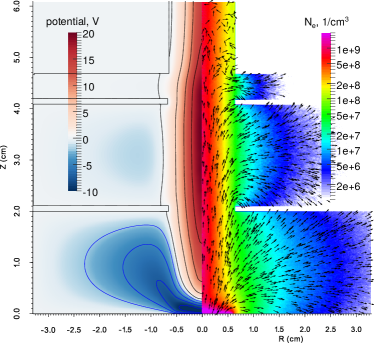
Our simulations of the larger, more complete geometry shows that electron emission from the cone walls and copper disk change of the plasma potential. The large EUV induced secondary electron emission from the copper disk leads to the formation of the space charge potential well during EUV pulse, see Fig. 6. The electron current during the pulse on the symmetry axis of the system is directed from the copper disk towards the cavity, thus replacing a large portion of the fast electrons that reach cavity walls. A comparison between the potential in the cavity for 5 Pa H2 for both geometrical configurations is presented in Fig. 7. For these simulations, the electron induced electron emission from cavity walls was set to zero.
Interestingly, the average electron density decreases for argon gas, but increases for hydrogen, compared to simulations of the cavity only. In the case of hydrogen, the plasma potential is smaller than for argon, due to a lower plasma density. That, in turn, leads to a significant loss of electrons to the cavity walls. Electrons emitted from the cone and copper disc are accelerated into the plasma, compensating for a fraction of the escaped electrons and increase the electron density.
In contrast to hydrogen, the argon plasma is significantly denser, due to the order of magnitude larger absorption of EUV for the same pressure (see Fig. 2). Hence, for argon, the relative charge imbalance between electrons and ions is much smaller than for hydrogen. Therefore, these electrons change the potential landscape of the plasma, increasing the probability of fast photoelectrons escape to the walls and reducing the average number of ionizations per fast electron.
IV.4 Influence of electron induced secondary emission from cavity walls
As discussed in section III.3.1 one can expect a significant secondary electron emission yield from the cavity walls under electron impact. However, the inclusion of this effect in the simulations has a small impact on the plasma formation in the cavity (below for the field averaged electron density).
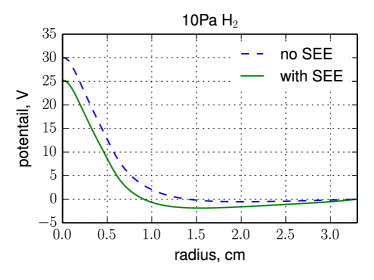
It is explained by changes in the plasma potential (see Fig. 8). Most ionization occurs in the region corresponding to the EUV beam. Electrons that escape from the plasma to the region between the beam and the cavity walls encounter the slow electrons produced on the cavity walls due to electron impact emission. That lead to formation of a local minimum in the plasma potential.
Hence, the potential barrier that electrons in the beam need to overcome in order to escape is similar for both simulations that include and neglect electron induced emission from the cavity wall. Moreover, the potential near cavity wall during the pulse prevents the emitted secondary electron from entering the plasma, thus significantly limiting the influence of SEE on the plasma formation.
IV.5 High charge imbalance plasma for 1Pa H2
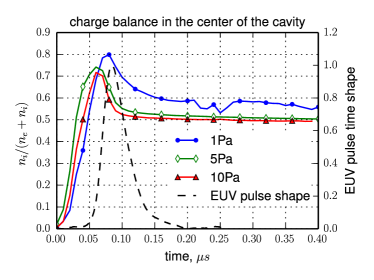
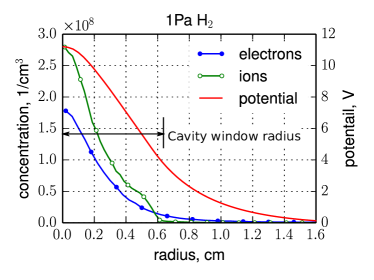
Interestingly, results for 1 Pa H2, even with inclusion of the VUV part of spectrum, show a significant charge imbalance between ions and electron. Due to the low H2 pressure, the absorption of EUV radiation is low. The generated plasma has a peak density in the range of – 1/cm3, see Fig. 10. This plasma can generate only a low plasma potential, that is not enough to confine high energy primary photoelectrons. As result, after the EUV pulse, a significant fraction of electrons leaves the plasma.
The ratio of the ion density to the sum of the ion and electrons densities as a function of time are presented in Fig. 9. For all simulated cases, in the beginning of the pulse, many fast electrons leave the plasma, creating an excess of ions. After the pulse, the simulation show that the plasma returns to quasi-neutrality (i.e. ), except for the case of 1 Pa H2 . In the case of 1 Pa, the generated plasma remains significantly charged, which leads to a faster decay, due to Coulomb repulsion on the time scale of .
V Conclusion
We simulated the evolution of an EUV induced plasma in a microwave resonant cavity. During simulations we observed that the cavity measured electron density can be used to estimate the integral amount of ionization in the cavity.
We show that these estimates are reasonably accurate ( for the considered conditions). This is even the case for estimates that use only the spatial mode profile of the microwave cavity mode and the EUV spatial beam profile. Therefore, a suitable microwave cavity can be used as a valuable diagnostics tool for EUV induced plasmas.
However, the cumulative uncertainties of the SPF transmission and the possible error margin in the measurements of the EUV source spectrum are important for the analysis of EUV plasma formation in hydrogen and argon. This is due to the rapid increase of the absorption cross-section with decreasing photon energy. Even 1 transmission of the SPF filter in the range of 20 – 30 eV has a significant effect on the EUV plasma formation. Moreover, the same spectral range is very important for surface chemistry processes, because the photo-absorption cross-sections are typically very large (e.g. the convolution of the cross-section with the spectrum can be similar for in-band EUV and out-of-band VUV).
The effect of VUV is likely to be significant, because most laboratory sources are discharge based with grazing incidence collector optics, which, without special care will have a significant amount of VUV. Therefore, in laboratory experiments, the EUV spectrum should be measured after the SPF filter, otherwise the remaining VUV radiation can induce a substantial systematic error.
Last but not least, it is important to take into account the EUV (or VUV) induced secondary electron emission (SE) form cavity and/or surroundings. This emission changes the potential distribution in the cavity and, hence, changes the generated plasma density, which further complicates the analysis of the cavity response.
Nevertheless, in case the radiation spectrum and secondary electron emission are known through additional measurements, the microwave cavity response may prove to be a very accurate tool for estimating plasma parameters and related phenomena.
Acknowledgements
This work is part of the research programme ‘Controlling photon and plasma induced processes at EUV optical surfaces (CP3E)’ of the ‘Stichting voor Fundamenteel Onderzoek der Materie (FOM)’, which is financially supported by the ‘Nederlandse Organisatie voor Wetenschappelijk Onderzoek (NWO)’. The CP3E programme is co-financed by Carl Zeiss SMT and ASML. The authors also acknowledge support from the Province of Overijssel, PANalytical, DEMCON, Solmates, and the University of Twente through the programme of the Industrial Focus Group XUV Optics.
References
- Madey et al. [2006] Theodore E. Madey, Nadir S. Faradzhev, Boris V. Yakshinskiy, and N.V. Edwards. Surface phenomena related to mirror degradation in extreme ultraviolet (EUV) lithography. Applied Surface Science, 253(4):1691–1708, 2006. doi:10.1016/j.apsusc.2006.04.065.
- Davis et al. [2007] David J. Davis, Georgios Kyriakou, Robert B. Grant, Mintcho S. Tikhov, and Richard M. Lambert. Toward the In Situ Remediation of Carbon Deposition on Ru-Capped Multilayer Mirrors Intended for EUV Lithography: Exploiting the Electron-Induced Chemistry. The Journal of Physical Chemistry C, 111(33):12165–12168, 2007. doi:10.1021/jp074766y.
- R. M. van der Horst et al. [2014] R. M. van der Horst, J. Beckers, S. Nijdam, and G. M. W. Kroesen. Exploring the temporally resolved electron density evolution in extreme ultra-violet induced plasmas. Journal of Physics D: Applied Physics, 47(30):302001, July 2014. doi:10.1088/0022-3727/47/30/302001.
- Gundermann et al. [2001] S. Gundermann, D. Loffhagen, H.-E. Wagner, and R. Winkler. Microwave diagnostics of the electron density in molecular mixture plasmas. Contributions to Plasma Physics, 41(1):45–60, 2001.
- Velden et al. [2008] van der MHL (Marc) Velden, GMW (Gerrit) Kroesen, van der JJAM (Joost) Mullen, JHJ (Roel) Moors, and Technische Universiteit Eindhoven. Radiation generated plasmas:a challenge in modern lithography. PhD thesis, Technische Universiteit Eindhoven, 2008.
- Dolgov et al. [2015] A Dolgov, O Yakushev, A Abrikosov, E Snegirev, V M Krivtsun, C J Lee, and F Bijkerk. Extreme ultraviolet (EUV) source and ultra-high vacuum chamber for studying EUV-induced processes. Plasma Sources Science and Technology, 24(3):035003, June 2015. doi:10.1088/0963-0252/24/3/035003.
- Birdsall and Langdon [1985] Charles K Birdsall and A. Bruce Langdon. Plasma physics via computer simulation. McGraw-Hill, New York, 1985. ISBN 0-07-005371-5 978-0-07-005371-7.
- Gallagher et al. [1987] J.W. Gallagher, C. E. Brion, J.A.R. Samson, and P.W. Langhoff. Absolute Cross Sections for Molecular Photoabsorption, Partial Photoionization, and Ionic Photofragmentation Processes. Journal of Physical and Chemical Reference Data, 17(1):9–153, 1987. doi:10.1063/1.555821.
- Houlgate et al. [1976] R. G. Houlgate, J. B. West, K. Codling, and G. V. Marr. The angular distribution of the 3p electrons and the partial cross section of the 3s electrons of argon from threshold to 70 eV. Journal of Electron Spectroscopy and Related Phenomena, 9(2):205–209, 1976. doi:10.1016/0368-2048(76)81030-4.
- Taylor [1977] K. T. Taylor. Photoelectron angular-distribution beta parameters for neon and argon. Journal of Physics B: Atomic and Molecular Physics, 10(18):L699, 1977.
- Chung et al. [1993] Y. M Chung, E. M Lee, T. Masuoka, and James A. R Samson. Dissociative photoionization of H2 from 18 to 124 eV. The Journal of Chemical Physics, 99(2):885–889, July 1993. doi:doi:10.1063/1.465352.
- Samson and Haddad [1994] James A. R. Samson and G. N. Haddad. Total photoabsorption cross sections of H2 from 18 to 113 eV. Journal of the Optical Society of America B, 11(2):277–279, February 1994. doi:10.1364/JOSAB.11.000277.
- Samson et al. [1991] J. A.R. Samson, L. Lyn, G. N. Haddad, and G. C. Angel. RECENT PROGRESS ON THE MEASUREMENT OF ABSOLUTE ATOMIC PHOTOIONIZATION CROSS SECTIONS. Le Journal de Physique IV, 01(C1):C1–99–C1–107, March 1991. doi:10.1051/jp4:1991113.
- Chan et al. [1992] W. F. Chan, G. Cooper, X. Guo, G. R. Burton, and C. E. Brion. Absolute optical oscillator strengths for the electronic excitation of atoms at high resolution. III. The photoabsorption of argon, krypton, and xenon. Physical Review A, 46(1):149–171, July 1992. doi:10.1103/PhysRevA.46.149.
- West and Marr [1976] J. B. West and G. V. Marr. The Absolute Photoionization Cross Sections of Helium, Neon, Argon and Krypton in the Extreme Vacuum Ultraviolet Region of the Spectrum. Proceedings of the Royal Society A: Mathematical, Physical and Engineering Sciences, 349(1658):397–421, May 1976. doi:10.1098/rspa.1976.0081.
- Berkowitz [2001] Joseph Berkowitz. Atomic and molecular photoabsorption: absolute total cross sections. Academic Press, 2001. ISBN 978-0-08-052769-7.
- Holland et al. [1979] D. M. P. Holland, K. Codling, G. V. Marr, and J. B. West. Multiple photoionisation in the rare gases from threshold to 280 eV. Journal of Physics B: Atomic and Molecular Physics, 12(15):2465, 1979. doi:10.1088/0022-3700/12/15/008.
- Hobbs and Wesson [1967] G. D. Hobbs and J. A. Wesson. Heat flow through a Langmuir sheath in the presence of electron emission. Plasma Physics, 9(1):85, 1967.
- Baglin et al. [2000] V. Baglin, J. Bojko, C. Scheuerlein, Oswald Gröbner, M. Taborelli, Bernard Henrist, and Noël Hilleret. The secondary electron yield of technical materials and its variation with surface treatments. Technical Report LHC-Project-Report-433 ; CERN-LHC-Project-Report-433, 2000.
- Lin and Joy [2005] Yinghong Lin and David C. Joy. A new examination of secondary electron yield data. Surface and Interface Analysis, 37(11):895–900, November 2005. doi:10.1002/sia.2107.
- Belhaj et al. [2013] M. Belhaj, J. Roupie, O. Jbara, J. Puech, N. Balcon, and D. Payan. Electron emission at very low electron impact energy: Experimental and Monte-Carlo results. 2013. doi:10.5170/CERN-2013-002.137.
- Dawson [1966] P. H. Dawson. Secondary Electron Emission Yields of some Ceramics. Journal of Applied Physics, 37(9):3644, 1966. doi:10.1063/1.1708934.
- Tondu et al. [2011] T. Tondu, M. Belhaj, and V. Inguimbert. Electron-emission yield under electron impact of ceramics used as channel materials in Hall-effect thrusters. Journal of Applied Physics, 110(9):093301, November 2011. doi:10.1063/1.3653820.
- Henke et al. [1977] Burton L. Henke, Jerel A. Smith, and David T. Attwood. 0.1–10-keV x-ray-induced electron emissions from solids—Models and secondary electron measurements. Journal of Applied Physics, 48:1852, 1977. doi:10.1063/1.323938.
- Lide [2003] David R Lide. CRC handbook of chemistry and physics, 2003-2004: a ready-reference book of chemical and physical data. CRC Press, Boca Raton, Fla., 2003. ISBN 0-8493-0484-9 978-0-8493-0484-2.
- Day et al. [1981] R. H. Day, P. Lee, E. B. Saloman, and D. J. Nagel. Photoelectric quantum efficiencies and filter window absorption coefficients from 20 eV to 10 KeV. Journal of Applied Physics, 52(11):6965–6973, November 1981. doi:10.1063/1.328653.
- Nanbu [1994] Kenichi Nanbu. Simple Method to Determine Collisional Event in Monte Carlo Simulation of Electron-Molecule Collision. Japanese Journal of Applied Physics, 33(Part 1, No. 8):4752–4753, August 1994. doi:10.1143/JJAP.33.4752.
- Dutton [1975] J. Dutton. A survey of electron swarm data. Journal of Physical and Chemical Reference Data, 4(3):577–856, July 1975. doi:10.1063/1.555525.
- Graham et al. [1973] E. Graham, D. R. James, W. C. Keever, D. L. Albritton, and E. W. McDaniel. Mobilities and longitudinal diffusion coefficients of mass-identified hydrogen ions in H2 and deuterium ions in D2 gas. The Journal of Chemical Physics, 59(7):3477–3481, October 1973. doi:doi:10.1063/1.1680505.
- Hornbeck [1951] John Hornbeck. The Drift Velocities of Molecular and Atomic Ions in Helium, Neon, and Argon. Physical Review, 84(4):615–620, 1951. doi:10.1103/PhysRev.84.615.
- Johnsen and Biondi [1978] Rainer Johnsen and Manfred A. Biondi. Mobilities of doubly charged rare-gas ions in their parent gases. Physical Review A, 18(3):989–995, September 1978. doi:10.1103/PhysRevA.18.989.
- Mokrov and Raizer [2008] M. S. Mokrov and Yu P. Raizer. Monte Carlo method for finding the ionization and secondary emission coefficients and I–V characteristic of a Townsend discharge in hydrogen. Technical Physics, 53(4):436–444, April 2008. doi:10.1134/S1063784208040075.
- Shyn et al. [1981] T. W. Shyn, W. E. Sharp, and Y.-K. Kim. Doubly differential cross sections of secondary electrons ejected from gases by electron impact: 25-250 eV on H2. Physical Review A, 24(1):79–88, July 1981. doi:10.1103/PhysRevA.24.79.
- Rudd et al. [1993] M. E. Rudd, K. W. Hollman, J. K. Lewis, D. L. Johnson, R. R. Porter, and E. L. Fagerquist. Doubly differential electron-production cross sections for 200–1500-eV e+H2 collisions. Physical Review A, 47(3):1866–1873, March 1993. doi:10.1103/PhysRevA.47.1866.
- Brunger and Buckman [2002] M. J. Brunger and S. J. Buckman. Electron–molecule scattering cross-sections. I. Experimental techniques and data for diatomic molecules. Physics reports, 357(3):215–458, 2002.
- Šimko et al. [1997] T. Šimko, V. Martišovitš, J. Bretagne, and G. Gousset. Computer simulations of H+ and H3+ transport parameters in hydrogen drift tubes. Physical Review E, 56(5):5908–5919, November 1997. doi:10.1103/PhysRevE.56.5908.
- Hayashi [2003] Hayashi. Bibliography of Electron and Photon Cross Sections with Atoms. 2003.
- [38] Arthur V. Phelps. http://jilawww.colorado.edu/~avp/.
- Rejoub et al. [2002] R. Rejoub, B. G. Lindsay, and R. F. Stebbings. Determination of the absolute partial and total cross sections for electron-impact ionization of the rare gases. Physical Review A, 65(4):042713, April 2002. doi:10.1103/PhysRevA.65.042713.
- Yates and Khakoo [2011] Brent R. Yates and Murtadha A. Khakoo. Near-threshold electron-impact doubly differential cross sections for the ionization of argon and krypton. Physical Review A, 83(4):042712, April 2011. doi:10.1103/PhysRevA.83.042712.
- Fiala et al. [1994] A. Fiala, L. C. Pitchford, and J. P. Boeuf. Two-dimensional, hybrid model of low-pressure glow discharges. Physical Review E, 49(6):5607, 1994. doi:10.1103/PhysRevE.49.5607.
- Deutsch et al. [1999] H. Deutsch, K. Becker, S. Matt, and T. D. Märk. Calculated cross sections for the electron-impact ionization of metastable atoms. Journal of Physics B: Atomic, Molecular and Optical Physics, 32(17):4249, 1999.
- Phelps [1994] A. V. Phelps. The application of scattering cross sections to ion flux models in discharge sheaths. Journal of Applied Physics, 76(2):747, 1994. doi:10.1063/1.357820.
- Okuno [1986] Kazuhiko Okuno. Charge Transfer of Ar2+ and Kr2+ in Their Own Gases Studied by the Beam Guide Technique. Journal of the Physical Society of Japan, 55(5):1504–1515, 1986. doi:10.1143/JPSJ.55.1504.
- van der Horst et al. [2015a] R. M. van der Horst, J. Beckers, E. A. Osorio, and V. Y. Banine. Exploring the electron density in plasmas induced by extreme ultraviolet radiation in argon. Journal of Physics D: Applied Physics, 48(28):285203, 2015a. doi:10.1088/0022-3727/48/28/285203.
- van der Horst et al. [2015b] R M van der Horst, J Beckers, E A Osorio, and V Y Banine. Dynamics of the spatial electron density distribution of EUV-induced plasmas. Journal of Physics D: Applied Physics, 48(43):432001, November 2015b. doi:10.1088/0022-3727/48/43/432001.