An efficient ab-initio quasiharmonic approach for the thermodynamics of solids
Abstract
A first-principles approach called the self-consistent quasiharmonic approximation (SC-QHA) method is formulated to calculate the thermal expansion, thermomechanics, and thermodynamic functions of solids at finite temperatures with both high efficiency and accuracy. The SC-QHA method requires fewer phonon calculations than the conventional QHA method, and also facilitates the convenient analysis of the microscopic origins of macroscopic thermal phenomena. The superior performance of the SC-QHA method is systematically examined by comparing it with the conventional QHA method and experimental measurements on silicon, diamond, and alumina. It is then used to study the effects of pressure on the anharmonic lattice properties of diamond and alumina. The thermal expansion and thermomechanics of Ca3Ti2O7, which is a recently discovered important ferroelectric ceramic with a complex crystal structure that is computationally challenging for the conventional QHA method, are also calculated using the formulated SC-QHA method. The SC-QHA method can significantly reduce the computational expense for various quasiharmonic thermal properties especially when there are a large number of structures to consider or when the solid is structurally complex. It is anticipated that the algorithm will be useful for a variety of fields, including oxidation, corrosion, high-pressure physics, ferroelectrics, and high-throughput structure screening when temperature effects are required to accurately describe realistic properties.
I Introduction
Accurately simulating various anharmonic properties, i.e., thermal expansion and thermomechanics, of solids is important for obtaining a deep understanding of their plentiful thermal behaviors and for their realistic applications. The anharmonic properties can be derived from the volume and temperature dependences of the phonon spectra calculated using density-functional theory (DFT) Martin (2004). The most popular approach is the quasiharmonic approximation method (QHA) Baroni et al. (2010); Togo et al. (2010); Togo and Tanaka (2015), where only the volume dependence is considered for the phonon anharmonicity, and temperature is assumed to indirectly affect phonon vibrational frequencies through thermal expansion. Here, the phonon spectra of about ten or more volumes are usually required for a typical QHA simulation, and the thermal expansion and thermomechanics are derived by fitting the free energy-volume relationship. In some cases, e.g., at high temperatures, high-order anharmonicity caused by multi-phonon coupling cannot be omitted as in the QHA method, and some more complicated and time-consuming methods, e.g., molecular dynamics Alfè et al. (2001); Ackland (2002); Vočadlo and Alfè (2002); Grabowski et al. (2009, 2011); Hellman et al. (2011); Kong et al. (2012); Hellman et al. (2013), self-consistent ab-initio lattice dynamics, Souvatzis et al. (2008, 2009) perturbative/nonperturbative renormalized harmonic approximations, Rousseau and Bergara (2010); Errea et al. (2011, 2013); Michel et al. (2015) and vibrational self-consistent field calculations Monserrat et al. (2013), can be used to obtain the temperature-dependent phonons. Nonetheless, approximately ten or more volumes of such phonon spectra are also required to accurately calculate the thermal expansion and thermomechanics with the high-order anharmonicities.
Phonon calculations based on DFT forces are always time consuming, and prior to the actual calculation, various computational parameters Martin (2004); Hafner (2008) also need to be carefully tested to ensure convergence of the vibrational frequencies and anharmonicity, including the pseudopotentials, cutoff energy, -mesh density, energy and force convergence thresholds, and supercell size in the small-displacement method Kresse et al. (1995); Parlinski et al. (1997) or the -mesh density in the density-functional perturbation theory approach Baroni et al. (2001); Giannozzi et al. (2009). The general rule-of-thumb requiring ten or more volumes will make the anharmonic simulation, even when utilizing the simplest QHA method, rather computationally expensive, especially in some condensed matter fields where a large number of structures must be considered or the compound under study has a large unit cell, low symmetry, and numerous inequivalent atoms:
-
(i)
In the fields of solid oxidation and corrosion, there are always many compounds (elements, oxides, hydroxides, oxyhydroxides, etc.) to consider Beverskog and Puigdomenech (1996, 1997a, 1997b, 1997c, 1997d); Chivot et al. (2008) and each composition may have many polymorphs Belsky et al. (2002); Jain et al. (2013); Saal et al. (2013);
- (ii)
- (iii)
-
(iv)
In the perovskite oxides Rondinelli et al. (2012); Benedek et al. (2015); Young et al. (2015), ternary ceramics exhibit complex structures and large unit cells. The phonon calculations for an individual structure is already quite time consuming, not to mention the calculation of anharmonic properties in low-symmetry polymorphs; and
- (v)
To this end, these diverse fields require an efficient method to accelerate the investigation of the anharmonic properties of related solids at finite temperatures.
In this work, we formulate an ab-initio method, called the self-consistent quasiharmonic approximation (SC-QHA) method, for achieving fast anharmonic calculations with high accuracy within the quasiharmonic approximation. Only the phonon spectra of two or three volumes are required in a SC-QHA calculation, which usually is much faster than the conventional QHA method. We carefully test the SC-QHA method using prototypical silicon, diamond, and alumina, and then also study the pressure effect on the anharmonic properties of diamond and alumina. Finally, we apply the SC-QHA method to accurately calculate the thermal expansion and thermomechanics of the structurally complex hybrid-improper ferroelectric Ca3Ti2O7. Apart from the high efficiency, we show that the SC-QHA method is also very convenient for deciphering the microscopic physical origins of lattice dynamical and thermodynamic phenomena. Moreover, it can be readily transferred beyond the quasiharmonic realm to speed up the accurate first-principles simulation of thermal effects for the benefit of multiple fields in condensed-matter physics.
II Thermodynamics and Computation
II.1 Theoretical Basis
The total Gibbs free energy () of a crystal unit cell is expressed as
| (1) |
where , , and are the external pressure, unit-cell volume, and temperature, respectively; and are the electronic and phononic Helmholtz free energies, respectively. To conveniently present the basic algorithm and efficiency of the SC-QHA method, only nonmagnetic insulators are considered here, where the electronic excitation and magnetic excitations are neglected. The transferability of the SC-QHA algorithm for solids with more complex degrees of freedom are discussed below. Therefore, here equals the electronic energy calculated from density functional theory (DFT) and is expressed as
| (2) |
where is the Boltzmann constant, is the number of considered reciprocal points, is the vibrational frequency of the -th phonon branch at the reciprocal coordinate .
The equilibrium state under a specified external pressure fulfills the relationship
| (3) |
Combining Eqs. 1, 2 and 3, we obtain an expression for the unit-cell volume
| (4) |
where and are the internal energy and Grüneisen parameter of the phonon mode (,). (To guarantee that is calculated from the phonon modes with the same symmetry, theory is used to identify and match the phonon branches obtained from different volumes according to the similarity of each mode’s eigenvector.Huang et al. (2014a)) The physics underlying Eq. 4 is due to the balance between the external pressure and internal pressure, i.e., electronic pressure () plus the anharmonic phonon pressure (), such that
| (5) |
In the quasiharmonic approximation, Baroni et al. (2010); Togo et al. (2010); Togo and Tanaka (2015) only depends on such that the – relationship can be described by a Taylor expansion (up to second order) as
| (6) |
where is the reference volume and . Then, we can derive the volume dependence of as
| (7) |
The calculation of the -th order derivative of (i.e., ) requires the phonon spectra of volumes. With Eqs. 4, 6, and 7, the temperature-dependent unit-cell volume can be obtained in a self-consistent manner and it is this formalism which we call herein the self-consistent quasiharmonic approximation (SC-QHA) method. The complete derivation steps for the SC-QHA method, as well as the formula in the next section, can be found in the online Supplemental Material.
The SC-QHA method can also be viewed as an improved nonlinear Grüneisen model that is implemented in a self-consistent way. In a conventional Grüneisen model Wallace (1998); Xie et al. (1999); Mounet and Marzari (2005); Barrera et al. (2005), the linear – relationship usually is considered, and during the calculation of the thermal-expansion coefficient , the parameters , , and are treated as constant. In addition, the zero-point vibration contribution to is also absent in the Grüneisen model for . Although a similar nonlinear – relationship to that given shown in Eq. 6 has been used by Debernardi et al. for beforeDebernardi et al. (2001), the contribution of zero-point vibrations to were omitted. Herein, both the zero-point vibrational contribution and nonlinear – relationship are treated in the SC-QHA method (by Eqs. 4 and 6).
In principle, when we have an analytical expression for (Eq. 6), could be directly derived by minimizing the analytical (Eq. 1) with respect to prior to using Eq. 4. This approach should have a comparable numerical efficiency as the self-consistent method. However, the SC-QHA method is very convenient analytics method for which considerable physical information (as present in Eq. 4) can be obtained through the accompanying the iteration process or from the converged results; the SC-QHAD allows us to understand related properties and to further design materials. Indeed, the lowest-order SC-QHA method with kept constant, has been successfully used to reveal various anharmonic mechanisms in two-dimensional materials Huang et al. (2014a); Huang and Zeng (2013); Huang et al. (2014b); Huang and Zeng (2015); Huang et al. (2015a), while we will show in this work that the higher-order SC-QHA method is necessary for three-dimensional solids at high temperatures (e.g., K).
II.2 Computational Algorithm
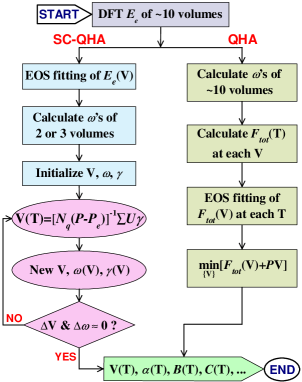
The computational protocol for the SC-QHA method is depicted in Fig. 1, and described below:
-
(1)
First, only the electronic energies () for approximately ten or more volumes are calculated using DFT. This step is required for both the SC-QHA and the conventional QHA methods.
-
(2)
Next, the calculated ’s are fit by an equation of state (EOS). There are various forms available, i.e., Birch-Murnaghan equation, modified Birch-Murnaghan equation, Birch equation, logarithmic equation, Murnaghan equation, Vinet equation, and Morse equation Shang et al. (2010a). The fourth-order Birch-Murnaghan EOS is used here to produce an analytical and expression.
-
(3)
Phonon spectra of two and three volumes are calculated to obtain and , respectively. The 1st-SC-QHA method only requires , whereas the 2nd-SC-QHA requires both and .
-
(4)
Prior to the self-consistent cycle, reasonable initial values for the unit-cell volume, phonon frequencies, and Grüneisen parameters are specified. To have a nonzero in the denominator of Eq. 4, the initial is set to be the 0.2%-expanded DFT equilibrium , which is used to calculate the initial vibrational frequencies (, Eq. 6) and Grüneisen parameters (, Eq. 7).
-
(5)
The initial and values are used to calculate a new using Eq. 4, and the new is taken to recalculate phonon frequencies and Grüneisen parameters using Eq. 6 and 7, respectively. Then, the new ’s and ’s are used to further update the volume , and this kind of self-consistent iteration continues until and the ’s are converged to within an acceptable threshold (e.g., ).
-
(6)
The relationship is then obtained when the specified temperature window is scanned during the self-consistent calculation, where the calculated , ’s, and ’s at one temperature are used as the initial values for the next temperature.
After obtaining converged , ’s, and ’s, then other thermodynamic properties may be calculated, e.g., the thermal-expansion coefficient, bulk modulus, heat capacity, free energy, entropy, etc. From Eq. 4, the volume thermal-expansion coefficient () is derived to be
| (8) |
where is the isothermal bulk modulus, and is the isovolume heat capacity of the phonon mode. can be expressed as the summation of four components
| (9) |
where is the electronic bulk modulus; , as described above, is the anharmonic-phonon pressure, a first-order component; and are the second-order components, and results from the change of . and are expressed as
and
where equals zero in the 1st-SC-QHA method. In addition, by obtaining the thermal expansion and isothermal thermomechanics, the isoentropic thermomechanics can also be readily derived Wang et al. (2010b); Nye (1985); Barrera et al. (2005). Note that the mechanical properties obtained from experimental measurements always reside between the isothermal and isoentropic limits, and this work mainly focuses on the introduction of the SC-QHA method rather than focusing on the detailed mechanical relationships.
To realize a faster SC-QHA calculation, we self-consistently solve Eq. 4 for at very low temperature (e.g., 0.1 K), and then use to obtain at higher temperatures, i.e.,
| (12) |
which help us avoid the self-consistent calculation for each temperature. A temperature increment () of K can yield converged results.
The numerical implementation of the code is written in FORTRAN and can be accessed via a GitHub Repository at http://github.com/MTD-group under GPLv3.
II.2.1 Comparison to the Conventional QHA Approach
In the conventional QHA method (see Fig. 1, right column), Baroni et al. (2010); Togo et al. (2010); Togo and Tanaka (2015) the phonon spectra for approximately ten or more volumes, especially for accurate thermomechanics, are required to be calculated, from which the of each volume within a specified temperature window is calculated. Then, an EOS is used to fit the calculated at each considered temperature. Finally, is minimized with respect to at each considered temperature, which yields various thermodynamic properties, e.g., , , and . Such process is needed in both testing convergence parameters and in performing meaningful QHA calculations. However, the 1st-SC-QHA method using phonon spectra of only two volumes can be efficiently used in such test calculations. After the optimal numerical and computational parameters are determined, the 2nd-SC-QHA method using phonon spectra of three volumes may then be used to simulate accurate thermodynamic quantities.
II.2.2 Extension to Metallic and Magnetic Crystals
Herein nonmagnetic insulators are considered, however, in metals Wang et al. (2004); Grabowski et al. (2007) and magnetic solids Körmann et al. (2008); Wang et al. (2009, 2010c); Shang et al. (2010b, c); Alling et al. (2010a, b); Wang et al. (2011); Liu et al. (2011); Körmann et al. (2012); Steneteg et al. (2012); Körmann et al. (2014), electronic and magnetic excitations, as well as spin-phonon coupling, at finite temperatures should be considered in computing the thermodynamic properties. For the SC-QHA simulation of a metal, we need to additionally treat the derivatives of in a similar way as ; the electronic Grüneisen parameters Barrera et al. (2005) also need to be calculated. The main difference is that the Fermi-Dirac distribution should be used for the electrons in , while the Bose-Einstein distribution is used for the phonons in .
For magnetic solids, the ensemble of magnetic configurations and the spin-phonon coupling should be correctly considered at finite temperatures, while the volume dependence of the phonon spectra is similarly calculated as that for nonmagnetic solids.
II.2.3 Extension to High-Order Anharmonic Cases
In the quasiharmonic approximation, where , only the low-order anharmonicity of phonons is considered van de Walle and Ceder (2002). When multi-phonon interactions are considerable, especially at very high temperatures, the phonon frequency has an additional explicit temperature dependence, i.e., , and some expensive methods beyond the quasiharmonic approximation, as described in the Introduction, should be used to capture such high-order anharmonicity. In the calculation of high-order anharmonic thermal expansion and thermomechanics, if the free-energy EOS fitting algorithm in the conventional QHA method is adopted, the anharmonic phonon spectra of ten or more volumes are required for an accurate fit. Alternatively, the Taylor-expansion and self consistency algorithms in the SC-QHA method can be used to efficiently describe the volume dependence of the anharmonic phonons, and the computational expense for high-order anharmonic cases will be significantly reduced.
II.3 Density-Functional Calculations
The Vienna Ab Initio Software Package (VASP) Hafner (2008); Kresse and Furthmüller (1996a, b) is used to calculate the energies, forces, and stresses at the DFT level. The projector augmented-wave (PAW) method Blöchl (1994); Kresse and Joubert (1999) is used to treat the interaction among the core and valence electrons and a planewave cutoff energy of 800 eV is also used. The electronic exchange-correlation potential is described by the PBEsol Perdew et al. (2008, 2009) parameterization, which we find generally gives more accurate thermodynamic quantities.Huang and Rondinelli (2015) We use a reciprocal-grid density of , where , , and are the lattice constants of the periodic cell scaled by the unit of angstrom. The convergence thresholds for the electronic energy and force are eV and eV Å-1, respectively. The atomic positions, cell volume, and cell shape are globally optimized for the equilibrium states, and only the atomic positions and cell shape are optimized for a solid at a compressed/expanded volume.
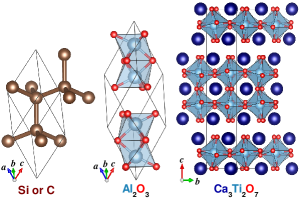
The PHONOPY code Togo et al. (2010); Togo and Tanaka (2015) is used to calculate phonon spectra, where the small-displacement method Kresse et al. (1995); Parlinski et al. (1997) is implemented, and the atomic displacement amount is set to be 0.03 Å. The supercells for the phonon calculation of Si, C, Al2O3, and Ca3Ti2O7 are (250 atoms), (54 atoms), (80 atoms), and (192 atoms) times their respective unit cells (Fig. 2, see also Supplemental Material). For the conventional QHA calculation, 14, 11, and 18 volumes are considered for Si, C, and Al2O3 (see Supplemental Material).
The unexpected large supercell of Si is required for its accurate anharmonic properties according to our fast 1st-SC-QHA benchmark calculations; the underlying physical origin is due to the existence of variable negative Grüneisen parameters in its Brillouin zone (see Supplemental Material). The LO–TO splitting has negligible effect on the anharmonic properties according to our SC-QHA test calculations on Al2O3 (Supplemental Material), because only the LO because only the LO phonons in a very small reciprocal space close to the point are affected Shang et al. (2007, 2010d).
For the 2nd-SC-QHA calculation, the phonon spectra of the equilibrium, 3.0%-compressed, and 3.0%-expanded volumes are used for Si, C, and Al2O3, where the later two volumes are used for the 1st-SC-QHA calculation. When Ca3Ti2O7 is under expansion, portions of the acoustic phonon branches will be spuriously softened and become dynamically unstable in the DFT calculation (Supplemental Material). However, in experimental measurement Senn et al. (2015), Ca3Ti2O7 has no phase instability during its thermal expansion up to temperatures as high as its decomposition temperature (1150 K). Thus, it should be the increased phonon-phonon coupling upon heating that stabilizes those acoustic phonons and makes them behave normally, which is quite similar to what occurs in TiO2 Montanari and Harrison (2004); Shojaee and Mohammadizadeh (2010); Mitev et al. (2010). To avoid this kind of phonon anomaly in expanded Ca3Ti2O7, the phonon spectra of the equilibrium, 1.5%-compressed, and 3.0%-compressed volumes are used in the SC-QHA calculation of Ca3Ti2O7. In addition, the conventional QHA method cannot be used when there is any instability in the quasiharmonic DFT phonons. This is also a numerical advantage of the SC-QHA method compared to the conventional QHA method.
III Results and discussion
III.1 Algorithm Benchmarks
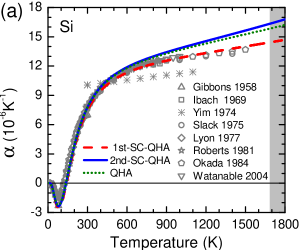
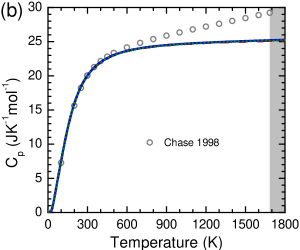
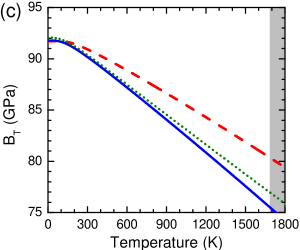
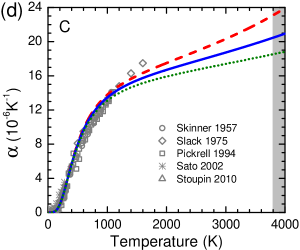
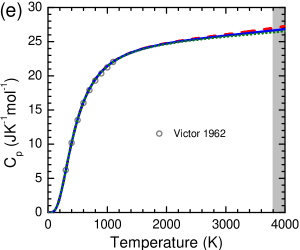
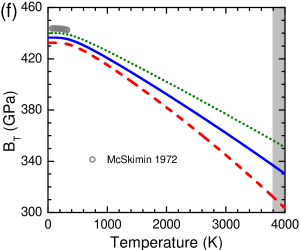
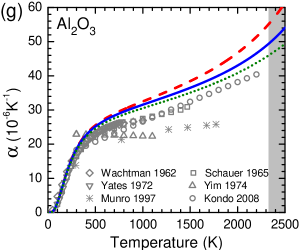
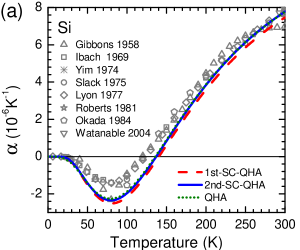
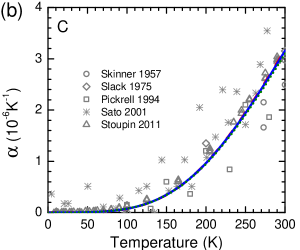
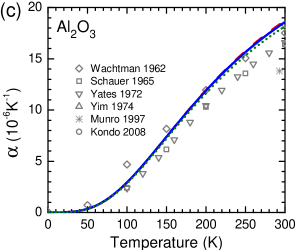
The calculated volume thermal-expansion coefficient (), isobaric heat capacity () Nye (1985), and isothermal bulk modulus () obtained from the 1st-SC-QHA, 2nd-SC-QHA, and QHA methods for silicon (Si), diamond (C), and alumina (Al2O3) under zero pressure and at temperatures from 0 K to the melting point, , are shown in Fig. 3. The low-temperature variations in () and detailed analysis of are given in Fig. 4. The available experimental results for Si, C, and Al2O3 Skinner (1957); Gibbons (1958); Victor (1962); Wachtman et al. (1962); Schauer (1965); Ibach (1969); McSkimin and Andreatch (1972); Yates et al. (1972); Yim and Paff (1974); Slack and Bartram (1975); Lyon et al. (1977); Roberts (1981); Okada and Tokumaru (1984); Pickrell et al. (1994); Munro (1997); Chase (1998); Sato et al. (2002); Watanabe et al. (2004); Giles et al. (2005); Kondo et al. (2008); Stoupin and Shvyd’ko (2010) are also collected to compare with the calculated values in Fig. 3 and 4. The raw data is available in digital format in the Supplemental Material.
III.1.1 Thermal Expansion Coefficients
All three methods generally perform well for when compared with experimental measurements [Fig. 3(a,d,g)]. If we use the QHA results as the theoretical reference for our proposed method, then we find that the 2nd-SC-QHA approach has a higher accuracy than the 1st-SC-QHA method.
At temperatures of K, the () curves from these three methods are in excellent agreement with each other and the experimental results, allowing for a scattering of K-1 in experimental data [Fig. 4(a,b,c)]. At temperatures of , the 2nd-SC-QHA (1st-SC-QHA) thermal expansion coefficients deviate from the QHA ones only by 0.4% (-3.6%), 2.7% (4.9%), and 2.6% (4.3%) for Si, C, and Al2O3, respectively [Fig. 3(a,d,g)]. Thus, both the 1st-SC-QHA and 2nd-SC-QHA methods have high accuracy for the thermal expansion at relatively low temperatures. At higher temperatures, e.g., , the thermal expansion coefficients obtained from the 2nd-SC-QHA (1st-SC-QHA) deviate from the QHA ones by 1.5% (-6.5%), 6.3% (13.0%), and 4.2% (10.1%) for Si, C, and Al2O3, respectively [Fig. 3(a,d,g)], which indicates that the 2nd-SC-QHA method should be preferred to the 1st-SC-QHA method when seeking to achieve an accurate simulation of the thermal expansion at relatively high temperatures.
Here we note that it is also quite challenging to measure accurately in experiment, especially at high temperatures, and the scatter in the experimental data always significantly increases with temperature. In fact, the theory-experiment discrepancy is even smaller than the experimental uncertainty [Fig. 3(a,d,g)]. Apart from some possible theoretical factors (e.g., the exchange-correlation potential and the quasiharmonic approximation itself) causing the inaccuracies in the simulated thermal expansion coefficients, there are also many experimental factors that can influence the measurement accuracy. First, thermal expansion always varies with the crystalline orientation Ibach (1969); Munro (1997). When the crystalline orientation is not well characterized, the derived thermal expansion may vary among single crystals, powders, and polycrystals. Second, the measured samples are readily contaminated by various impurities (e.g., Cu, Fe, Mg, Ca, etc.), which may have profound effect on thermal expansionThewlis and Davey (1956); Ibach (1969); Yim and Paff (1974); Pickrell et al. (1994); Reeber and Wang (1996); Munro (1997); Sato et al. (2002). Next, the precipitation of some metastable phases in the sample at relative high temperatures may influence the thermal expansion. For example, there are many polymorphs (e.g., , , , and phases) of Al2O3 Levin and Brandon (1998); Andersson (2005), and the relative stability among the polymorphs correlates with temperature and impurity concentration Andersson (2005); Huang et al. (2015b). It also has been found that the metastable -Al2O3 has a smaller thermal expansion than the stable -Al2O3 Shang et al. (2010d), which may be related with the fact that the experimental thermal expansion is always smaller than the simulated one for -Al2O3 [Fig. 3(g)].
Moreover there are many methods to measure the thermal expansion of solids, e.g., push-rod dilatometer Roberts (1981), capacitance dilatometer Ibach (1969); Lyon et al. (1977); Falzone and Stacey (1982), interferometric dilatometer Gibbons (1958); Ibach (1969); Roberts (1981); Watanabe et al. (2004), and X-ray diffraction Skinner (1957); Yim and Paff (1974); Slack and Bartram (1975); Okada and Tokumaru (1984); Pickrell et al. (1994); Sato et al. (2002); Giles et al. (2005); Stoupin and Shvyd’ko (2010). Although an accuracy from to K-1 may be declared for each measurement, the discrepancy between different measurements still can be on the order of K-1. Last, the thermal-expansion coefficient is derived from the lattice-constant variation with temperature, where analytical functions are used for the data fitting Yim and Paff (1974); Lyon et al. (1977). When the data is insufficiently large and exhibits obvious scatter, the derived will also depend on the chosen fitting function. For example, a difference of several percentages can be readily found when refitting the data reported by Yim Yim and Paff (1974).
Most of the available experimental thermal expansion coefficients for these compounds are reported in earlier reports (e.g., 1950–1980s), and high-temperature data are still scarce, which makes stringent experiment–experiment and theory–experiment comparisons difficult. Therefore, accurate experimental measurements (especially for high temperatures) on high-quality samples are still needed to precisely understand the thermal expansion of many solids. Nonetheless, according to our current comparison, we find that relatively high accuracy is achieved by the 2nd-SC-QHA method (or even by the 1st-SC-QHA method), which only requires the phonon spectra of three (or two) volumes, rather than ten or more volumes as in the conventional QHA method.
III.1.2 Isobaric Heat Capacity
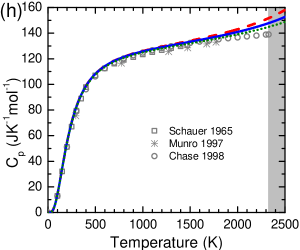
In addition to the good performance of the SC-QHA method for the thermal expansion coefficients, both the 1st-SC-QHA and 2nd-SC-QHA methods also yield highly accurate isobaric heat capacities for Si, C, and Al2O3, with respect to the QHA results [Fig. 3(b,e,h)]. The simulated values are also consistently agree with the experimental ones for C and Al2O3 [Fig. 3(e,h)], although the experimental for Si gradually deviates from the simulated one at temperatures K, e.g., by 8.3% at (1124 K).
Usually the experiment–theory discrepancy for Si is ascribed to the omission of high-order anharmonicity beyond the quasiharmonic approximation, and an ad-hoc anharmonic correction of 8% for the heat capacity has been suggested Trivedi (1985); Kagaya and Soma (1993). However, such a simple anharmonic correction for heat capacity will adversely influence the accuracy of the theoretical : When the quasiharmonic heat capacity is corrected by 8%, the quasiharmonic also correspondingly needs to be increased by about 8% (Eq. 8) Kagaya et al. (1987). Because the quasiharmonic for Si is already higher than the experimental one. e.g., by 8% at , Fig. 3(a), such a correction will further increase the theory-experimental discrepancy in by 16% at .
These results then motivate for a more systematic and improved understanding of the anharmonic properties of Si. Apart from obtaining perhaps more precise experimental measurements on high-quality samples, state-of-art ab-initio simulations of the high-order anharmonicity are needed; here, our SC-QHA algorithm may be used to speed up the calculation of the volume dependence of the anharmonic phonon spectra needed for those higher level theories.
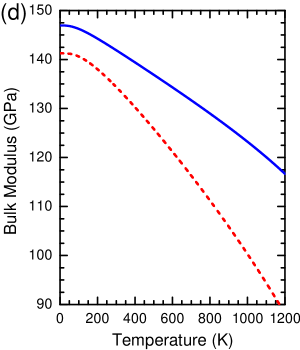
III.1.3 Isothermal Bulk Modulus
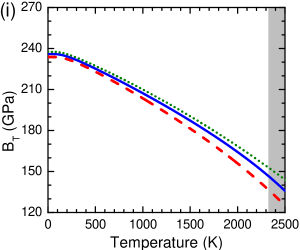
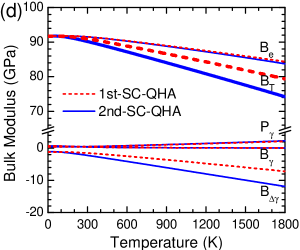
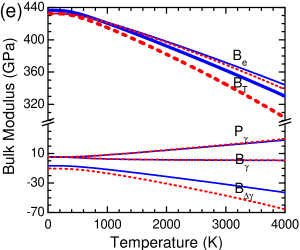
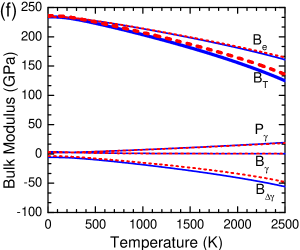
An anticipated thermal softening of materials is observed in the temperature dependence of [Fig. 3(c,f,i)]. From 0 K to , the softening of the isothermal bulk moduli for Si, C, and Al2O3 are 6.8, 69.6, and 55.3 GPa from the 1st-SC-QHA method, 10.1, 59.9, and 51.3 GPa from the 2nd-SC-QHA method, and 9.7, 51.3, and 49.7 GPa from the QHA method, respectively. Although each method results in the same qualitative chemical trends for , the 2nd-SC-QHA method gives a higher quantitative accuracy than the 1st-SC-QHA method with respect to the QHA method.
We understand this improved precision obtained by the 2nd-SC-QHA method as follows: The is calculated from the second derivative of the free energy; thus, it is sensitive to both the method type and the number and range of cell volumes chosen in the QHA method. Nonetheless, the difference between the 2nd-SC-QHA and QHA results is already smaller than the numerical uncertainty in the QHA method (Supplemental Material).
In addition, the SC-QHA method enables us to decompose into four contributing components (Eq. 9), i.e., , , , and , where results from the change of the Grüneisen parameter. The bulk moduli for Si, C, and Al2O3, as well as their corresponding components, are shown in Fig. 4(d,e,f), where the 1st-SC-QHA and the 2nd-SC-QHA results are compared. It can be clearly discerned that the difference between the bulk moduli obtained from the 1st-SC-QHA and the 2nd-SC-QHA mainly originates from deviations in the calculated , indicating the importance of the nonlinear vibrational frequency variation in solid thermomechanics. Moreover, is consistently larger than , indicating that the excitation of anharmonic phonons (i.e., ) has a net softening effect on the bulk modulus. Therefore, beyond achieving a higher computational efficiency, the SC-QHA method also provides a convenient and complementary approach to the conventional QHA for uncovering the physical origins of thermomechanics.
III.2 Algorithm Applications
III.2.1 Pressure Dependent Anharmonicity
In high-pressure physics, the external pressure is controlled by compressing a diamond anvil cell (DAC), and the optical spectra of a ruby (Cr-doped Al2O3) particle adjacent to the sample is used to calculate the actual pressure in the DAC Jayaraman (1983); Boehler (2000); Hemley and Mao (2001); McMahon (2015). Thus, it is useful to study the pressure dependence of the anharmonic properties of C and Al2O3. When using the conventional QHA method to study the pressure effect, a large range of volumes should be considered, and the phonon spectra of numerous volumes probably need to be calculated to give confidence to the results. Considering extra volumes far away from the equilibrium volume, however, will introduce some numerical error to the QHA results for zero and low pressures, because of the decreased weights of the equilibrium and slightly-compressed volumes in the EOS fitting process (Supplemental Material). Thus, simulating the pressure-dependent anharmonic properties using the QHA method is not only computationally expensive, but also prone to intrinsic numerical uncertainties from the EOS fitting.
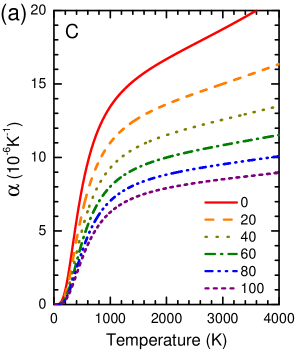
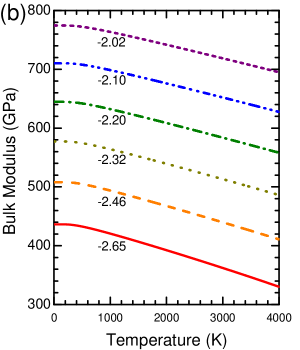
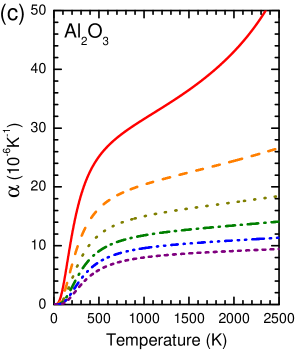
Here we remedy the shortcomings of the conventional QHA and apply our 2nd-SC-QHA method to examine the pressure effects on () and () for C and Al2O3 from 0–100 GPa (Fig. 5). We find that decreases with increasing pressure [Fig. 5(a,c)], which is mainly due to the increased according to Eq. 8 and Fig. 5(b,d). The phonon mode hardening and the corresponding decrease in phononic anharmonicity also makes a minor contribution to the pressure-induced decrease of the thermal expansion coefficient. Interestingly, (Al2O3) is approximately two times that of (C) at 0 GPa, while they become comparable at 100 GPa, because of the faster stiffening rate of (Al2O3) with pressure. increases with increasing pressure, but decreases with increasing temperature. The thermal-softening rate given by decreases with increasing pressure [Fig. 5(b,d)], because of the decreased phonon anharmonicity. When the thermal effects on and are comparable with or even larger than the pressure effect, the simulated results for C and Al2O3 here will be useful for the high-pressure experiments carried out under variable temperature.
III.2.2 Anharmonicity in Complex Ceramics
The accuracy of the SC-QHA method for Si, C, and Al2O3, as well as its application to C and Al2O3 under pressure, motivate us to study the thermal expansion and thermomechanics of Ca3Ti2O7. This compound is an important hybrid-improper ferroelectric (HIF) Benedek and Fennie (2011) that has received considerable attention recently.Oh et al. (2015) Its thermal expansion has also been recently measured in experiment Senn et al. (2015).
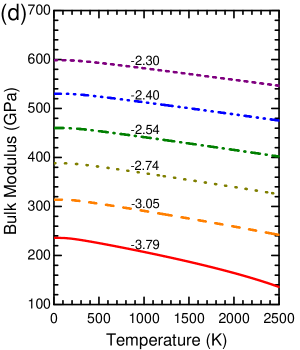
The calculated , , and from both the 1st-SC-QHA and 2nd-SC-QHA methods are shown in Figure 6. We find that the 1st-SC-QHA results deviate from the 2nd-SC-QHA ones, indicating the importance of the nonlinear frequency-volume variation in this ferroelectric material. Thus, it is necessary to use the 2nd-SC-QHA method for such kind of HIFs where multiple lattice modes interact to stabilize the ferroelectric phase. Therefore, we focus our discussion on the results obtained from the 2nd-SC-QHA method below.
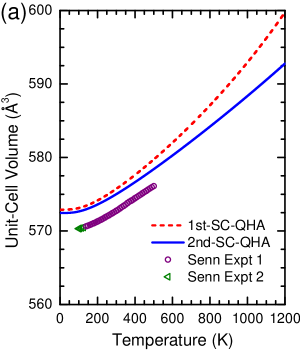
In Fig. 6(a), our theoretical variation is compared with the measured temperature-dependent volume data collected from two experiments (labeled as “Senn Expt 1” and “Senn Expt 2”) by Senn et al. Senn et al. (2015), one of which (Senn Expt 2) was provided by Senn and co-workers through private communications after publication of Ref. Senn et al., 2015. These two sets of experimental data have no observable deviation, though according to Senn’s comments, the X-ray wavelengths used for these two sets of measurements are slightly different, which may introduce a normalization error in the X-ray diffraction analysis. The 2nd-SC-QHA unit-cell volume is about 0.4% higher than Senn’s measurements, indicating the high accuracy of our simulation.
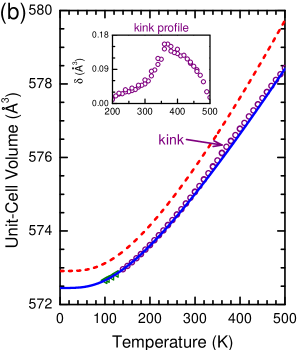
To facilitate a direct theory-experiment comparison for , the experimental data sets are uniformly shifted upwards by 2.3 Å3, such that the lowest temperature experimental data coincides with our 2nd-SC-QHA curve as shown in Fig. 6(b). We find that our 2nd-SC-QHA curve perfectly overlaps with the experimental temperature variation, except for a narrow temperature range, where a very small kink centered at 360 K appears [Fig. 6(b), inset].
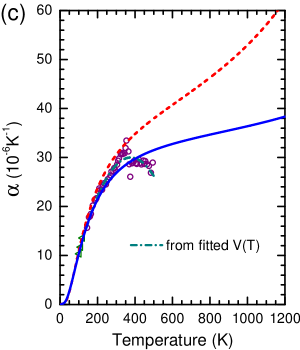
To have a direct theory-experiment comparison for , we extract the from the experimental data in two ways. First, we calculate from the differential between two neighboring data, i.e.,
| (13) |
Second, we analytically derive from a fitted curve using an exponential function of the form . All the experimental thermal expansion data agree well with our 2nd-SC-QHA curve [Fig. 6(c)], except for some scattering in experimental data above 300 K caused by the presence of the kink in [Fig. 6(b)]. This experimental kink may indicate some unknown processes, e.g., impurities and domain dynamics, becoming thermally activated in the sample above 300 K, or certain small uncontrollable uncertainty in the experimental characterization. Upon decreasing temperature, decreases down to zero at 0 K [Fig. 6(c)], thus, the variation becomes less dispersive [Fig. 6(b)]. This is an inevitable quantum-mechanical effect, where fewer quantized phonons are thermally excited upon cooling.
Last, from both experimental measurements and our SC-QHA simulation, no negative thermal expansion is observed in Ca3Ti2O7. This has been ascribed by Senn Senn et al. (2015) to the octahedra tilting ( symmetry) being frozen out in the (or equivalently symmetry) phase in the Ruddlesden-Popper (RP) AO7 (ACa and Ti or Mn) compounds. For a more complete understanding of the thermal expansion and other anharmonic properties of Ca3Ti2O7, further experimental measurements and more detailed analysis are still required.
IV Conclusions
A fast and accurate ab-initio method called the self-consistent quasiharmonic approximation (SC-QHA) method has been formulated to calculate various anharmonic properties of solids at finite temperatures. The SC-QHA method not only is about five times per dimension faster than the conventional QHA method, but also aids in the physical analysis of underlying anharmonic mechanisms. Although we showed the superior performance of the SC-QHA method compared to the conventional QHA using nonmagnetic insulators, the methodology can be readily extended to metallic and magnetic solids, where electronic and magnetic excitations are also important. Moreover, the basic SC-QHA algorithm can be transferred to the realm beyond the quasiharmonic approximation, i.e., to compute high-order anharmonicities, and reduce the computational overhead for the simulation of high-order anharmonic properties.
The efficiency and accuracy calibrations of the SC-QHA method based on silicon, diamond, and alumina show that the 2nd-order SC-QHA method is systematically more accurate than the 1st-order SC-QHA implementation, but the 1st-SC-QHA method is useful for testing the computational parameters required in a density functional theory calculation. After evaluating the SC-QHA method, we examined the pressure-dependent thermal expansion and thermomechanics of diamond and alumina, which are two important materials in high-pressure physics. Finally, the SC-QHA method was also used to study the thermal expansion and thermomechanics of Ca3Ti2O7, which is structurally complex and computationally challenging for the conventional QHA method. No negative thermal expansion was found in Ca3Ti2O7, which is consistent with a recent experimental measurement. The simulated variation also precisely agrees with available experimental data. These results demonstrate that the SC-QHA method is both an efficient computational and useful theoretical tool to understand experimentally determined anharmonic properties of materials.
Acknowledgements.
L.-F.H. and J.M.R. wish to thank Dr. M. Senn (University of Oxford), and Prof. S.-W. Cheong (Rutgers University) for providing additional experimental data for Ca3Ti2O7, as well as for the helpful e-mail exchanges. L.-F.H. and E.T. were supported by the Office of Naval Research MURI “Understanding Atomic Scale Structure in Four Dimensions to Design and Control Corrosion Resistant Alloys” under Grant No. N00014-14-1-0675. X.-Z.L. and J.M.R. were supported by the National Science Foundation (NSF) through the Pennsylvania State University MRSEC under award number DMR-1420620. Calculations were performed using the QUEST HPC Facility at Northwestern University and the HPCMP facilities at the Navy DoD Supercomputing Resource center.Contributions
The study was planned, methods formulated, calculations carried out, and the manuscript prepared by L.-F.H. and J.M.R. X.-Z.L. and E.T. performed analyses on Ca3Ti2O7 and Al2O3, respectively. All authors discussed the results, wrote, and commented on the manuscript.
References
- Martin (2004) R. M. Martin, Electronic structure: Basic theory and practical methods (Cambridge University Press, 2004).
- Baroni et al. (2010) S. Baroni, P. Giannozzi, and E. Isaev, Rev. Mineral. Geochem. 71, 39 (2010).
- Togo et al. (2010) A. Togo, L. Chaput, I. Tanaka, and G. Hug, Phys. Rev. B 81, 174301 (2010).
- Togo and Tanaka (2015) A. Togo and I. Tanaka, Scr. Mater. 108, 1 (2015).
- Alfè et al. (2001) D. Alfè, G. D. Price, and M. J. Gillan, Phys. Rev. B 64, 045123 (2001).
- Ackland (2002) G. J. Ackland, J. Phys.: Condens. Matter 14, 2975 (2002).
- Vočadlo and Alfè (2002) L. Vočadlo and D. Alfè, Phys. Rev. B 65, 214105 (2002).
- Grabowski et al. (2009) B. Grabowski, L. Ismer, T. Hickel, and J. Neugebauer, Phys. Rev. B 79, 134106 (2009).
- Grabowski et al. (2011) B. Grabowski, T. Hickel, and J. Neugebauer, Phys. Status Solidi B 248, 1295 (2011).
- Hellman et al. (2011) O. Hellman, I. A. Abrikosov, and S. I. Simak, Phys. Rev. B 84, 180301 (2011).
- Kong et al. (2012) L. T. Kong, J. F. Li, Q. W. Shi, H. J. Huang, and Z. K., Europhys. Lett. 97, 56004 (2012).
- Hellman et al. (2013) O. Hellman, P. Steneteg, I. A. Abrikosov, and S. I. Simak, Phys. Rev. B 87, 104111 (2013).
- Souvatzis et al. (2008) P. Souvatzis, O. Eriksson, M. I. Katsnelson, and S. P. Rudin, Phys. Rev. Lett. 100, 095901 (2008).
- Souvatzis et al. (2009) P. Souvatzis, O. Eriksson, M. Katsnelson, and S. Rudin, Comput. Mater. Sci. 44, 888 (2009).
- Rousseau and Bergara (2010) B. Rousseau and A. Bergara, Phys. Rev. B 82, 104504 (2010).
- Errea et al. (2011) I. Errea, B. Rousseau, and A. Bergara, Phys. Rev. Lett. 106, 165501 (2011).
- Errea et al. (2013) I. Errea, M. Calandra, and F. Mauri, Phys. Rev. Lett. 111, 177002 (2013).
- Michel et al. (2015) K. H. Michel, S. Costamagna, and F. M. Peeters, Phys. Rev. B 91, 134302 (2015).
- Monserrat et al. (2013) B. Monserrat, N. D. Drummond, and R. J. Needs, Phys. Rev. B 87, 144302 (2013).
- Hafner (2008) J. Hafner, J. Comput. Chem. 29, 2044 (2008).
- Kresse et al. (1995) G. Kresse, J. Furthmüller, and J. Hafner, Europhys. Lett. 32, 729 (1995).
- Parlinski et al. (1997) K. Parlinski, Z. Q. Li, and Y. Kawazoe, Phys. Rev. Lett. 78, 4063 (1997).
- Baroni et al. (2001) S. Baroni, S. de Gironcoli, A. Dal Corso, and P. Giannozzi, Rev. Mod. Phys. 73, 515 (2001).
- Giannozzi et al. (2009) P. Giannozzi, S. Baroni, N. Bonini, M. Calandra, R. Car, C. Cavazzoni, D. Ceresoli, G. L. Chiarotti, M. Cococcioni, I. Dabo, A. Dal Corso, S. de Gironcoli, S. Fabris, G. Fratesi, R. Gebauer, U. Gerstmann, C. Gougoussis, A. Kokalj, M. Lazzeri, L. Martin-Samos, N. Marzari, F. Mauri, R. Mazzarello, S. Paolini, A. Pasquarello, L. Paulatto, C. Sbraccia, S. Scandolo, G. Sclauzero, A. P. Seitsonen, A. Smogunov, P. Umari, and R. M. Wentzcovitch, J. Phys.: Condens. Matter 21, 395502 (2009).
- Beverskog and Puigdomenech (1996) B. Beverskog and I. Puigdomenech, Corrosion Sci. 38, 2121 (1996).
- Beverskog and Puigdomenech (1997a) B. Beverskog and I. Puigdomenech, Corrosion Sci. 39, 107 (1997a).
- Beverskog and Puigdomenech (1997b) B. Beverskog and I. Puigdomenech, Corrosion Sci. 39, 969 (1997b).
- Beverskog and Puigdomenech (1997c) B. Beverskog and I. Puigdomenech, J. Electrochem. Soc. 144, 3476 (1997c).
- Beverskog and Puigdomenech (1997d) B. Beverskog and I. Puigdomenech, Corrosion Sci. 39, 43 (1997d).
- Chivot et al. (2008) J. Chivot, L. Mendoza, C. Mansour, T. Pauporté, and M. Cassir, Corrosion Sci. 50, 62 (2008).
- Belsky et al. (2002) A. Belsky, M. Hellenbrandt, V. L. Karen, and P. Luksch, Acta Crystallogr. B 58, 364 (2002), the online database can be found on https://icsd.fiz-karlsruhe.de.
- Jain et al. (2013) A. Jain, S. P. Ong, G. Hautier, W. Chen, W. D. Richards, S. Dacek, S. Cholia, D. Gunter, D. Skinner, G. Ceder, and K. A. Persson, APL Mater. 1, 011002 (2013), the online database can be found on https://materialsproject.org.
- Saal et al. (2013) J. Saal, S. Kirklin, M. Aykol, B. Meredig, and C. Wolverton, JOM 65, 1501 (2013), the online database can be found on http://oqmd.org.
- Oganov and Glass (2006) A. R. Oganov and C. W. Glass, J. Chem. Phys. 124, 244704 (2006).
- Wang et al. (2010a) Y. Wang, J. Lv, L. Zhu, and Y. Ma, Phys. Rev. B 82, 094116 (2010a).
- Wang et al. (2015) X. Wang, T. Tsuchiya, and A. Hase, Nat. Geosci. 8, 556 (2015).
- Maisel et al. (2012) S. B. Maisel, M. Höfler, and S. Müller, Nature 491, 740 (2012).
- Li et al. (2012) X.-q. Li, J.-j. Zhao, and J.-c. Xu, Front. Phys. 7, 360 (2012).
- Yuan et al. (2014) X.-L. Yuan, M.-A. Xue, W. Chen, and T.-Q. An, Front. Phys. 9, 219 (2014).
- Rondinelli et al. (2012) J. M. Rondinelli, S. J. May, and J. W. Freeland, MRS Bulletin 37, 261 (2012).
- Benedek et al. (2015) N. A. Benedek, J. M. Rondinelli, H. Djani, P. Ghosez, and P. Lightfoot, Dalton Trans. 44, 10543 (2015).
- Young et al. (2015) J. Young, A. Stroppa, S. Picozzi, and J. M. Rondinelli, J. Phys.: Condens. Matter 27, 283202 (2015).
- Curtarolo et al. (2012) S. Curtarolo, W. Setyawan, G. L. W. Hart, M. Jahnatek, R. V. Chepulskii, R. H. Taylor, S. Wang, J. Xue, K. Yang, O. Levy, M. J. Mehl, H. T. Stokes, D. O. Demchenko, and D. Morgan, Comput. Mater. Sc. 58, 218 (2012).
- Curtarolo et al. (2013) S. Curtarolo, G. L. W. Hart, M. B. Nardelli, N. Mingo, S. Sanvito, and O. Levy, Nat. Mater. 12, 191 (2013).
- Rondinelli et al. (2015) J. M. Rondinelli, K. R. Poeppelmeier, and A. Zunger, APL Mater. 3, 080702 (2015).
- Rondinelli and Kioupakis (2015) J. M. Rondinelli and E. Kioupakis, Ann. Rev. Mater. Res. (2015), 10.1146/annurev-matsci-070214-021150.
- Huang et al. (2014a) L. F. Huang, P. L. Gong, and Z. Zeng, Phys. Rev. B 90, 045409 (2014a).
- Wallace (1998) D. C. Wallace, Thermodynamics of Crystals (Dover Publications, Mineola, New York, 1998).
- Xie et al. (1999) J. Xie, S. de Gironcoli, S. Baroni, and M. Scheffler, Phys. Rev. B 59, 965 (1999).
- Mounet and Marzari (2005) N. Mounet and N. Marzari, Phys. Rev. B 71, 205214 (2005).
- Barrera et al. (2005) G. D. Barrera, J. A. O. Bruno, T. H. K. Barron, and N. L. Allan, J. Phys.: Condens. Matter 17, R217 (2005).
- Debernardi et al. (2001) A. Debernardi, M. Alouani, and H. Dreyssé, Phys. Rev. B 63, 064305 (2001).
- Huang and Zeng (2013) L. F. Huang and Z. Zeng, J. Appl. Phys. 113, 083524 (2013).
- Huang et al. (2014b) L. F. Huang, T. F. Cao, P. L. Gong, and Z. Zeng, Solid State Commun. 190, 5 (2014b).
- Huang and Zeng (2015) L. F. Huang and Z. Zeng, J. Phys. Chem. C 119, 18779 (2015).
- Huang et al. (2015a) L. F. Huang, P. L. Gong, and Z. Zeng, Phys. Rev. B 91, 205433 (2015a).
- Shang et al. (2010a) S. L. Shang, Y. Wang, D. E. Kim, and Z. K. Liu, Comput. Mater. Sci. 47, 1040 (2010a).
- Wang et al. (2010b) Y. Wang, J. J. Wang, H. Zhang, V. R. Manga, S. L. Shang, L. Q. Chen, and Z. Q. Liu, J. Phys.: Condens. Matter 22, 225404 (2010b).
- Nye (1985) J. F. Nye, Physical properties of crystals: their representation by tensors and matrices (Oxford university press, Oxford, 1985).
- Wang et al. (2004) Y. Wang, Z.-K. Liu, and L.-Q. Chen, Acta Mater. 52, 2665 (2004).
- Grabowski et al. (2007) B. Grabowski, T. Hickel, and J. Neugebauer, Phys. Rev. B 76, 024309 (2007).
- Körmann et al. (2008) F. Körmann, A. Dick, B. Grabowski, B. Hallstedt, T. Hickel, and J. Neugebauer, Phys. Rev. B 78, 033102 (2008).
- Wang et al. (2009) Y. Wang, L. G. Hector Jr., H. Zhang, S. L. Shang, L. Q. Chen, and Z. K. Liu, J. Phys.: Condens. Matter 21, 326003 (2009).
- Wang et al. (2010c) Y. Wang, S. L. Shang, H. Zhang, L. Q. Chen, and Z. Q. Liu, Philos. Mag. Lett. 90, 851 (2010c).
- Shang et al. (2010b) S.-L. Shang, J. E. Saal, Z.-G. Mei, Y. Wang, and Z.-K. Liu, J. Appl. Phys. 108, 123514 (2010b).
- Shang et al. (2010c) S. L. Shang, Y. Wang, and Z. K. Liu, Phys. Rev. B 82, 014425 (2010c).
- Alling et al. (2010a) B. Alling, T. Marten, and I. A. Abrikosov, Phys. Rev. B 82, 184430 (2010a).
- Alling et al. (2010b) B. Alling, T. Marten, and I. A. Abrikosov, Nat. Mater. 9, 283 (2010b).
- Wang et al. (2011) Y. Wang, S. L. Shang, L. Q. Chen, and Z. K. Liu, Int. J. Quantum Chem. 111, 3565 (2011).
- Liu et al. (2011) Z. K. Liu, Y. Wang, and S. L. Shang, Scr. Mater. 65, 664 (2011).
- Körmann et al. (2012) F. Körmann, A. Dick, B. Grabowski, T. Hickel, and J. Neugebauer, Phys. Rev. B 85, 125104 (2012).
- Steneteg et al. (2012) P. Steneteg, B. Alling, and I. A. Abrikosov, Phys. Rev. B 85, 144404 (2012).
- Körmann et al. (2014) F. Körmann, B. Grabowski, B. Dutta, T. Hickel, L. Mauger, B. Fultz, and J. Neugebauer, Phys. Rev. Lett. 113, 165503 (2014).
- van de Walle and Ceder (2002) A. van de Walle and G. Ceder, Rev. Mod. Phys. 74, 11 (2002).
- Kresse and Furthmüller (1996a) G. Kresse and J. Furthmüller, Comput. Mater. Sci. 6, 15 (1996a).
- Kresse and Furthmüller (1996b) G. Kresse and J. Furthmüller, Phys. Rev. B 54, 11169 (1996b).
- Blöchl (1994) P. E. Blöchl, Phys. Rev. B 50, 17953 (1994).
- Kresse and Joubert (1999) G. Kresse and D. Joubert, Phys. Rev. B 59, 1758 (1999).
- Perdew et al. (2008) J. P. Perdew, A. Ruzsinszky, G. I. Csonka, O. A. Vydrov, G. E. Scuseria, L. A. Constantin, X. Zhou, and K. Burke, Phys. Rev. Lett. 100, 136406 (2008).
- Perdew et al. (2009) J. P. Perdew, A. Ruzsinszky, G. I. Csonka, O. A. Vydrov, G. E. Scuseria, L. A. Constantin, X. Zhou, and K. Burke, Phys. Rev. Lett. 102, 039902 (2009).
- Huang and Rondinelli (2015) L.-F. Huang and J. M. Rondinelli, Phys. Rev. B 92, 245126 (2015).
- Shang et al. (2007) S. Shang, Y. Wang, and Z. K. Liu, Phys. Rev. B 75, 024302 (2007).
- Shang et al. (2010d) S. L. Shang, H. Zhang, Y. Wang, and Z. K. Liu, J. Phys.: Condens. Matter 22, 375403 (2010d).
- Senn et al. (2015) M. S. Senn, A. Bombardi, C. A. Murray, C. Vecchini, A. Scherillo, X. Luo, and S. W. Cheong, Phys. Rev. Lett. 114, 035701 (2015).
- Montanari and Harrison (2004) B. Montanari and N. M. Harrison, J. Phys.: Condens. Matter 16, 273 (2004).
- Shojaee and Mohammadizadeh (2010) E. Shojaee and M. R. Mohammadizadeh, J. Phys.: Condens. Matter 22, 015401 (2010).
- Mitev et al. (2010) P. D. Mitev, K. Hermansson, B. Montanari, and K. Refson, Phys. Rev. B 81, 134303 (2010).
- Skinner (1957) B. J. Skinner, American Mineralogist 42, 39 (1957).
- Gibbons (1958) D. F. Gibbons, Phys. Rev. 112, 136 (1958).
- Victor (1962) A. C. Victor, J. Chem. Phys. 36, 1903 (1962).
- Wachtman et al. (1962) J. B. Wachtman, T. G. Scuderi, and G. W. Cleek, J. Am. Ceram. Soc. 45, 319 (1962).
- Schauer (1965) A. Schauer, Canadian J. Phys. 43, 523 (1965).
- Ibach (1969) H. Ibach, Phys. Status Solidi B 31, 625 (1969).
- McSkimin and Andreatch (1972) H. J. McSkimin and P. Andreatch, J. Appl. Phys. 43, 2944 (1972).
- Yates et al. (1972) B. Yates, R. F. Cooper, and A. F. Pojur, J. Phys. C: Solid State Phys. 5, 1046 (1972).
- Yim and Paff (1974) W. M. Yim and R. J. Paff, J. Appl. Phys. 45, 1456 (1974).
- Slack and Bartram (1975) G. A. Slack and S. F. Bartram, J. Appl. Phys. 46, 89 (1975).
- Lyon et al. (1977) K. G. Lyon, G. L. Salinger, C. A. Swenson, and G. K. White, J. Appl. Phys. 48, 865 (1977).
- Roberts (1981) R. B. Roberts, J. Phys. D: Appl. Phys. 14, L163 (1981).
- Okada and Tokumaru (1984) Y. Okada and Y. Tokumaru, J. Appl. Phys. 56, 314 (1984).
- Pickrell et al. (1994) D. J. Pickrell, K. A. Kline, and R. E. Taylor, Appl. Phys. Lett. 64, 2353 (1994).
- Munro (1997) R. G. Munro, J. Am. Ceram. Soc. 80, 1919 (1997).
- Chase (1998) M. W. Chase, NIST-JANAF Thermochemical Tables (4th Ed.) (American Institute of Physics, New York, 1998).
- Sato et al. (2002) T. Sato, K. Ohashi, T. Sudoh, K. Haruna, and H. Maeta, Phys. Rev. B 65, 092102 (2002).
- Watanabe et al. (2004) H. Watanabe, N. Yamada, and M. Okaji, Int. J. Thermophysics 25, 221 (2004).
- Kondo et al. (2008) S. Kondo, K. Tateishi, and N. Ishizawa, Jpn. J. Appl. Phys. 47, 616 (2008).
- Stoupin and Shvyd’ko (2010) S. Stoupin and Y. V. Shvyd’ko, Phys. Rev. Lett. 104, 085901 (2010).
- Giles et al. (2005) C. Giles, C. Adriano, A. Freire Lubambo, C. Cusatis, I. Mazzaro, and M. Goncalves Hönnicke, J. Synchrotron Rad. 12, 349 (2005).
- Thewlis and Davey (1956) J. Thewlis and A. R. Davey, Philos. Mag. 1, 409 (1956).
- Reeber and Wang (1996) R. R. Reeber and K. Wang, J. Electron. Mater. 25, 63 (1996).
- Levin and Brandon (1998) I. Levin and D. Brandon, J. Am. Ceram. Soc. 81, 1995 (1998).
- Andersson (2005) J. M. Andersson, Controlling the formation and stability of alumina phases, Ph.D. thesis, Linköpings Universitet, Linköpings, Sweden (2005).
- Huang et al. (2015b) L. F. Huang, B. Grabowski, E. McEniry, D. R. Trinkle, and J. Neugebauer, Phys. Status Solidi B 252, 1907 (2015b).
- Falzone and Stacey (1982) A. J. Falzone and F. D. Stacey, Phys. Chem. Minerals 8, 212 (1982).
- Trivedi (1985) P. C. Trivedi, J. Phys. C: Solid State Physics 18, 983 (1985).
- Kagaya and Soma (1993) H.-M. Kagaya and T. Soma, Solid State Commun. 85, 617 (1993).
- Kagaya et al. (1987) H. M. Kagaya, N. Shoji, and T. Soma, Phys. Status Solidi B 142, K13 (1987).
- Jayaraman (1983) A. Jayaraman, Rev. Mod. Phys. 55, 65 (1983).
- Boehler (2000) R. Boehler, Rev. Geophys. 38, 221 (2000).
- Hemley and Mao (2001) R. J. Hemley and H.-K. Mao, Int. Geol. Review 43, 1 (2001).
- McMahon (2015) M. McMahon, Phil. Trans. R. Soc. A 373, 20130158 (2015).
- Benedek and Fennie (2011) N. A. Benedek and C. J. Fennie, Phys. Rev. Lett. 106, 107204 (2011).
- Oh et al. (2015) Y. S. Oh, X. Luo, F.-T. Huang, Y. Wang, and S.-W. Cheong, Nat. Mater. 14, 407 (2015).