The VIRUS-P Exploration of Nearby Galaxies (VENGA): Radial Gas Inflow and Shock Excitation in NGC 1042
Abstract
NGC 1042 is a late type bulgeless disk galaxy which hosts a low luminosity Active Galactic Nuclei (AGN) coincident with a massive nuclear star cluster. In this paper, we present the integral-field-spectroscopy (IFS) studies of this galaxy, based on the data obtained with the Mitchell spectrograph on the 2.7 meter Harlan J. Smith telescope. In the central region of NGC 1042, we find a circumnuclear ring structure of gas with enhanced ionization, which we suggest is mainly induced by shocks. Combining with the harmonic decomposition analysis of the velocity field of the ionized gas, we propose that the shocked gas is the result of gas inflow driven by the inner spiral arms. The inflow velocity is and the estimated mass inflow rate is . The mass inflow rate is about one hundred times the blackhole’s mass accretion rate (), and slightly larger than the star formation rate in the nuclear star cluster (), implying that the inflow material is enough to feed both the AGN activity and the star formation in the nuclear star cluster. Our study highlights that secular evolution can be important in late-type unbarred galaxies like NGC 1042.
1 Introduction
1.1 Feeding of Low Luminosity AGNs
Since the discovery of the tight correlation between the masses of super-massive black holes (SMBHs) and the global properties of their host galaxies (Ferrarese et al., 2000; Gebhardt et al., 2000; Tremaine et al., 2002), the co-evolution of galaxies and SMBHs has become an important topic in the study of the galaxy formation and evolution. One outstanding problem is to understand how the host galaxy can feed the central blackhole and trigger the nuclear activity. Theoretically, galaxies can affect the growth of blackholes via global interaction processes such as major or minor mergers, galaxy interactions and gas accretions (Negroponte & White, 1983; Sanders et al., 1988; Barnes & Hernquist, 1991; Quinn et al., 1993; Mihos & Hernquist, 1996; Kauffmann & Haehnelt, 2000; Di Matteo et al., 2005; Hopkins et al., 2006, 2008). The galaxy-wide secular processes driven by a series of internal non-axisymmetric structures (e.g. large-scale bars, spiral arms, ovals, nuclear spiral arms, and nested bars) can also play important roles in the growth of blackholes (Jogee et al., 2002, 2005; Kormendy & Kennicutt, 2004; Athanassoula, 2008; Sellwood, 2014, and references therein). These processes have been proposed to effectively dissipate the angular momentum and transfer material inward to the central regions of galaxies (Shlosman et al., 1989, 1990; Martini, 2004; Jogee, 2006, and references therein).
Observationally, there have been many statistical studies to investigate the role of different feeding mechanisms. Studies of the links between the nuclear activity and the merger signatures (e.g., close pairs or disturbed hosts) have shown that, major mergers have limited role in triggering the nuclear activities (Cisternas et al., 2011; Schawinski et al., 2010, 2011, 2012; Weinzirl et al., 2011; Kocevski et al., 2012; Simmons et al., 2012, 2013; Karouzos et al., 2014; Villforth et al., 2014) and may only dominate the feeding processes of the most luminous AGNs (Kartaltepe et al., 2010; Koss et al., 2011; Treister et al., 2012; Rosario et al., 2012). The role of secular processes has been mainly tested by exploring the bar-AGN connection, which only presents marginal evidence for a direct correlation (Ho et al., 1997; Mulchaey & Regan, 1997; Hunt & Malkan, 1999; Shlosman et al., 2000; Laine et al., 2002; Laurikainen et al., 2004a; Oh et al., 2012; Lee et al., 2012; Cisternas et al., 2013, 2015; Cheung et al., 2015; Galloway et al., 2015). In addition, the dominant feeding mechanisms for AGNs of different luminosities and within different environments may be different (Jogee, 2006; Kormendy & Ho, 2013).
Another way to explore the feeding mechanisms of AGNs is to study the detailed properties of the interstellar medium (ISM) in the vicinity of the SMBHs. The Hubble Space Telescope (HST) imaging have revealed various dust structures around AGNs, which is thought to be a possible feeding channel of nuclear activity (Malkan et al., 1998). However, further studies about the matched samples of active and inactive galaxies do not find significant correlation between the circumnuclear dust and the nuclear activities (Martini et al., 2003), although there is an exception for the early-type AGN hosts (Simões Lopes et al., 2007).
With the advances of the integral field spectroscopy (IFS), the gas inflows have been directly observed from the two-dimensional gaseous velocity field for more and more nearby AGNs (Fathi et al., 2006; Storchi-Bergmann et al., 2007; Riffel et al., 2008; Müller Sánchez et al., 2009; Davies et al., 2009; van de Ven & Fathi, 2010; Schnorr Müller et al., 2011; Riffel & Storchi-Bergmann, 2011; Riffel et al., 2013; Schnorr-Müller et al., 2014; Schönell et al., 2014). These detailed studies of individual sources have shown that the inflowing material could be multi-phased, with typical inflow velocities of and a large range in mass inflow rates (). While IFS observations mainly probe the ionized and warm molecular phase of the ISM, the gas inflows have also been detected in the cold molecular phase with the observations of millimeter/submillimeter interferometry (García-Burillo & Combes, 2012; Fathi et al., 2013; Combes et al., 2014). Furthermore, the hints of kinematic differences have been observed in the local Seyfert galaxies. Dumas et al. (2007) found that the kinematics of the ionized gas in the circumnuclear regions of Seyfert galaxies show stronger perturbations than those in inactive galaxies. Hicks et al. (2013) reported that Seyfert galaxies have more concentrated stellar and H2 surface brightness, lower stellar velocity dispersion, and elevated H2 luminosity within comparing to inactive galaxies. Davies et al. (2014) further showed that the circumnuclear disks of molecular gas widely exist in Seyfert galaxies. In these disks, the gas presents inflows and outflows kinematics superimposed on the disk rotations.
In this paper, we explore the feeding mechanism of the Low Luminosity AGN (LLAGN) NGC 1042, based on the IFS data taken from the VENGA survey (VIRUS-P Exploration of Nearby Galaxies) (Blanc et al., 2013). We are interested in this object because it is a late-type bulgeless galaxy with an accreting intermeidate-mass black hole (Shields et al., 2008). In recent years, LLAGNs have been found in the pesudobulges of late-type galaxies and even in the bulgeless/dwarf galaxies (Ho, 2008; Greene, 2012; Kormendy & Ho, 2013, and references therein). These blackholes generally have low masses ranging from to (Greene & Ho, 2004, 2007; Dong et al., 2012; Reines et al., 2013). The scaling relations between these blackholes and their host galaxies are less certain, and may show much larger scatters than those of SMBHs in the classical bulges and ellipticals(Hu, 2008; Greene et al., 2010; Kormendy et al., 2011; Sani et al., 2011; McConnell & Ma, 2013; Kormendy & Ho, 2013). This suggests their mass growth may not significantly correlate with the global processes in the hosts. Here, we use NGC 1042 as an example to study the mass growth of blackholes at the low mass end.
The paper is organized as follows. First, we describe the relevant properties of NGC 1042 in §1.2. In §2, we describe the observations and the data reduction. In §3, we present the 2D maps of emission-line fluxes, emission-line ratios, the velocity field, and the velocity dispersions of ionized gas and stars in NGC 1042. We find a circumnuclear ring-like structure of ionized gas at region that shows LINER-like emission. In §4, we characterize the nature of this structure and quantify the kinematic properties of the ionized gas. We propose that this structure is the result of the gas moving inwards driven by the inner spiral arms of NGC 1042. In §5, we calculate the mass inflow rate of the ionized gas and discuss its implications for the AGN feeding and star formation in the nuclear star cluster. We summarize in §6.
1.2 NGC 1042
NGC 1042 is a nearby late-type (morphological type SAB(rs)cd, de Vaucouleurs et al., 1991) bulgeless galaxy. The basic properties of this galaxy are listed in Table 1. The spiral arms in NGC 1042 are composed of two symmetric inner arms and multiple long and continuous outer arms, which are classified as in the classification of spiral arms in Elmegreen & Elmegreen (1987). In the RC3 catalogue (de Vaucouleurs et al., 1991), NGC 1042 is classified as a weakly barred (SAB) spiral galaxy. Marinova & Jogee (2007) performed ellipse fitting on the B and H band images of this galaxy and also classified it as barred galaxy (with a deprojected bar ellipticity of 0.6 and bar semi-major axis in the H-band). However, using a different approach of multi-component (bulge, bar, disk) decomposition, Weinzirl et al. (2009) found that NGC 1042 is best fit with a bulge and disk only, and re-classify it as unbarred. The unbarred classification is also proposed by some other works. Laurikainen & Salo (2002) and Laurikainen et al. (2004b) used Fourier techniques on the B,J,H and K band images and classified it as an unbarred galaxy. Buta et al. (2005) decomposed the perturbation strengths of gravitational potential induced by the bar and the spiral arms and proposed that the contribution of the spiral arms are dominant. They point out that the inner spiral arms sharply curve towards to the central region and produce a bar-like structure in NGC 1042, which can be misidentified as a bar. Based on the potential-density phase-shift method, Buta & Zhang (2009) confirmed their previous unbarred classification. In the Carnegie-Irvine Galaxy Survey, Li et al. (2011) also classify NGC 1042 as an unbarred galaxy based on the visual inspection, the geometric analysis and the Fourier method.
The coincidence of a nuclear star cluster and an AGN has been found in NGC 1042. The nuclear star cluster was first identified by the isophotal analysis of the HST images (Böker et al., 2002). After a detailed structural analysis, Böker et al. (2004) found that the effective radius of the cluster is ( at their adopted distance of ). The dynamical mass and stellar population of the cluster were also presented by Walcher et al. (2005, 2006) with the VLT UVES spectroscopy. The obtained dynamical mass of the cluster is . The observed mean cluster age and metallicity is and , respectively. There is a young stellar population with stellar age of in the underlying old () population of stars. The mass of this young stellar component is (Walcher et al., 2006).
Based on the high-resolution optical spectrum done within the central region, Shields et al. (2008) claimed that there exists a low-luminosity AGN (classified as LINER) coincident with the nuclear star cluster in NGC 1042. They found that the peak of the H flux has an offset () from the peak of the forbidden lines and the stellar continuum. They also found that the profile of the [NII]+H emission lines is unusual: The [NII] lines deviate from Gaussian profiles and present high velocity wings extending to about from the line center. Additionally, the full width at half maximum (FWHM) of the [NII] is observed to be larger than that of the H. They proposed that this unusual profile can be explained as the blended emission from a LLAGN and an offset HII region. The HII region dominates the H emission and produces the offset of the peak of the H flux. After removing the contamination from the adjacent HII region, they estimated the bolometric luminosity of the AGN to be using the H luminosity and use it to set a lower limit on the mass of the blackhole (). Walcher et al. (2005, 2006) found that the M/L of the nuclear star cluster from the dynamical estimation is smaller than that from the stellar population analysis. Considering that the M/L estimated from the stellar components do not include any contributions from the blackhole, Shields et al. (2008) concluded that the mass of the blackhole and the nuclear cluster should be of the similar order. They used as the upper limit of the blackhole mass of NGC 1042. In addition, they used the velocity dispersion of the nuclear stellar cluster and the M- relation to estimate the blackhole mass, which is , implying an intermediate-mass blackhole.
Interestingly, the distance of NGC 1042 has dramatically different values in the literature, ranging from (Tully et al., 2008) to (Böker et al., 2002). There are mainly two independent methods to determine the distance of this galaxy. The first method is based on the heliocentric velocity and using the Hubble’s law to calculate the redshift distance. The motion of the local universe is corrected in the calculation. This method depends on the selection of the value and the models of local motions. The redshift distance estimated by this method is found to be by Tully (1988), by Böker et al. (2002), and by Theureau et al. (2007). The former two estimations only correct for the infall of the Galaxy to the Virgo cluster, while Theureau et al. (2007) made a full model of the peculiar velocity to the Galaxy within . In addition, they also corrected the peculiar velocity of NGC 1042. The second method is to make use of the Tully-Fisher (TF) relation. This method is therefore independent with the redshift. Several earlier estimations using this method determined the distance of NGC 1042 at ( from Tully et al. 1992, , , from J,H,K band estimations of Theureau et al. 2007), but a later estimation by Tully et al. (2008) places NGC 1042 at . This work adopts the Tully-Fisher relation calibrated in Tully & Pierce (2000) and shifts slightly its zero point to be consistent with the results of the HST Cepheid Key Project (Freedman et al., 2001). Interestingly, we find that the distance estimated by this method is very sensitive to the inclination angle adopted for the galaxy. Tully et al. (2008) used the B-band photometry to determine the inclination angle to be . If we use the inclination angle of which is indicated by the 2MASS photometry, and use the same method of Tully et al. (2008), we find the distance of NGC 1042 is . If we use the kinematic inclination () measured from the harmonic decomposition modelling of this paper (see Appendix B of this paper), the obtained distance changes to . Since the large scatter of the distance estimations of NGC 1042 may require further exploration, which is beyond the focus of this paper, we choose the estimation from the latest literature (Tully et al., 2008), adopting as the distance of NGC 1042 in this paper. It is also the smallest distance estimation of all in literature so far, so our analyses can be considered as a reference for others by simply scaling up. We remind the readers to be cautious on the big uncertainties of the distance estimation of NGC 1042.
2 Observations and Data Reduction
2.1 Observations
Observations of NGC 1042 were carried out as part of the VENGA survey (Blanc et al., 2013) which is a wide-field optical () IFS survey of 30 nearby spiral galaxies. It uses the Mitchell spectrograph (formerly known as VIRUS-P, Hill et al., 2008) on the 2.7 meter Harlan J. Smith telescope to observe about 44000 individual spectra across the disks of these objects. As a fiber-fed integral field unit (IFU), Mitchell consists of 246 fibers sampling a field of view with a 1/3 filling factor. The diameter of each fiber is corresponding to on the sky. The VP1 grating was used in a blue and a red setup to cover from to spectral range with a spectral resolution of (FWHM).
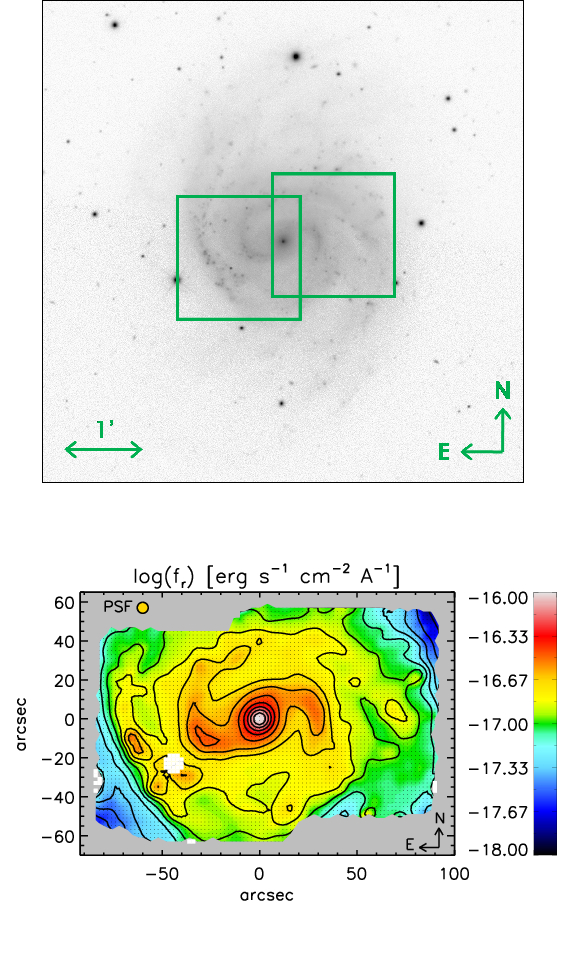
Figure 1 shows the r-band SDSS image of NGC 1042, overlaid with the area covered by the Mitchell observations. Two slightly offset pointings of the Mitchell are used to map this galaxy across a area. For each pointing, three dithers are observed at relative positions , , and from the origin, to fill the whole area of the Mitchell field of view. The observation of each dither is divided into several science frames with exposure times ranging from 20 min to 30 min. The 5 min off-source frames are observed between each science frame, which are used to perform sky subtraction. The calibration frames (bias, arc lamps, twilight flats, and spectrophotometric standard stars) are also observed in the same night. A detailed description of the VENGA observing strategy is presented in Blanc et al. (2013).
The observational details of NGC 1042 are summarized in Table 2. For each dither in each pointing we list the total on-source exposure time, the number of science frames, the average seeing of the frames, and the mean atmospheric transparency. NGC 1042 was observed in five runs of the VENGA survey. Observing conditions were variable between different runs and within different nights during the same observing run, ranging from photometric to partly cloudy with average atmospheric transparency down to . 17 out of 76 frames () are rejected due to the pointing errors or bad sky subtraction problems. The seeing of the remaining good frames ranged from to , with a median at .
Overall we spent 27 hours of exposure time on the 59 good frames of this galaxy. As a result, the spectra have high S/N ratios per spectral resolution element, with a median value at in the continuum. In the central parts () of the galaxy we typically have , while the spectra in the most outer regions (from to ) have a median . We only have 20 out of 4789 spaxels () with S/N less than 10. They mainly locate at the right top corner of the galaxy as shown in Figure 1.
2.2 Data Reduction
The details of the data processing and spectral analysis of the VENGA survey have been described in Blanc et al. (2013). As part of this survey, we reduce and analyse the data of NGC 1042 in the same way.
All raw data are reduced by the VACCINE pipeline (Adams et al., 2011; Blanc et al., 2013). VACCINE performs bias and overscan subtraction, flat fielding, cosmic-ray rejection, wavelength calibration, and sky subtraction. Then the frames of spectrophotometric standard stars are used to perform the relative flux calibration for the 2D spectra in each observing run. Afterwards, the broad-band images reconstructed from these 2D spectra are compared with the SDSS broad-band images to perform the absolute flux calibration and astrometry. The flux errors are obtained by combining the read-noises and Poisson uncertainties in the CCD processing, and then propagated throughout the rest of the data reduction. The instrumental spectral resolution is measured from the emission lines in the arc lamp frames and fitted as a function of wavelength. All these information are combined together to generate a datacube and a row-stacked spectra (RSS) file of NGC 1042.
In these datasets, the spectra are re-sampled to a common wavelength grid at for regularly linear sampling and for regularly logarithmic sampling. The spaxel has a regular scale of , which can roughly Nyquist sample the final spatial PSF. For each spaxel the final spectrum is obtained by combining the spectra of surrounding fibers using a Gaussian spatial filter and adopting an inverse variance weighting scheme. The FWHM of the Gaussian filter is , matching the fiber size. The final spatial PSF is obtained by convolving the top-hat profile of the fiber ( diameter) with the seeing () and the Gaussian filter ( FWHM). This PSF can be well described as a Gaussian with FWHM. At the distance of for NGC 1042, it corresponds to . For a detailed description of the data combining process and data format, see §4.7 of Blanc et al. (2013).
The spectral analysis are performed by the PARADA pipeline, which involves the pPXF (Cappellari & Emsellem, 2004) and GANDALF (Sarzi et al., 2006) softwares as the main fitting procedures. Before fitting the spectra, the Galactic extinctions are corrected by adopting a Milky Way extinction law as parametrized by Pei (1992) and the extinction values from the maps of Schlegel et al. (1998). The pPXF is used to fit the stellar continuum. The stellar line-of-sight velocity () and the velocity dispersion () are estimated from the fit. The spectrum of each spaxel is fitted individually with a linear combination of stellar templates convolved with a line-of-sight velocity dispersion (LOSVD) by using the “penalized pixel” technique (Cappellari & Emsellem, 2004). The stellar templates are the same as those in Blanc et al. (2013). These templates are selected from MILES stellar library version 9.1 (Sánchez-Blázquez et al., 2006; Falcón-Barroso et al., 2011) and include 48 stars which span a wide range in spectral types (O through M), luminosity classes (I through V), and metallicities (). The spectral resolution of the templates and the observed spectra are matched to the worst instrumental resolution at any given wavelength in the datacube, which translates in a final spectral resolution of in the red setup and in the blue setup. The LOSVD can be parametrized by a Gauss-Hermite polynomial in pPXF, but we only fit for the first two moments and , which means that we actually fit a Gaussian LOSVD.
After constraining the stellar kinematics, we measure the emission-line properties with the GANDALF. GANDALF fits the full spectrum by re-computing the weights given to the different stellar templates and adding Gaussian profiles to model the emission lines. The stellar line-of-sight velocity () and the velocity dispersion () derived in the pPXF fitting are fixed in the GANDALF fitting. We tie the kinematics of all emission lines to a common set of parameters (, ) in order to improve the fitting quality of faint lines. This ensures that the kinematic parameters obtained are mostly constrained by the brightest emission lines in the spectrum (typically H, [OIII]5007, and [OII]3727). The errors of emission line parameters are estimated based on the covariance matrix computed during the non-linear Levenberg-Marquardt fitting. In Table 3, we report the median S/N of each emission line over all spaxels in the datacube and the fraction of the observed area in which the emission lines are detected at and . We detect H at over of the full datacube with a median . Most of the strong lines ([NII]6548,6583, [SII]6717,6731, H, [OIII]5007, [OII]3726,3729 doublets) are detected at over more than of the observed area.
We construct a series of 2D maps of NGC 1042, including the emission-line flux maps, the emission-line ratio maps, the maps of the velocity field, and the maps of the velocity dispersions. We identify the foreground Milk Way stars from the visual inspection of the stellar velocity field and the SDSS images. In all maps, we flag the spaxels contaminated by these stars and mask the surrounding spaxels within as blank regions. For the emission-line flux and ratio maps (Figure 2 and Figure 5), we adopt a S/N cut of 5 for each line used in the corresponding maps to select the regions with reliable measurements. The spaxels that do not satisfy the above S/N cut are masked with blank regions. In the maps of the velocity field and the velocity dispersion of the ionized gas (Figure 7), the regions having a velocity error or a velocity dispersion error larger than are masked as blank regions.
3 Results
3.1 Maps of the Emission Line Fluxes and the Line Ratios
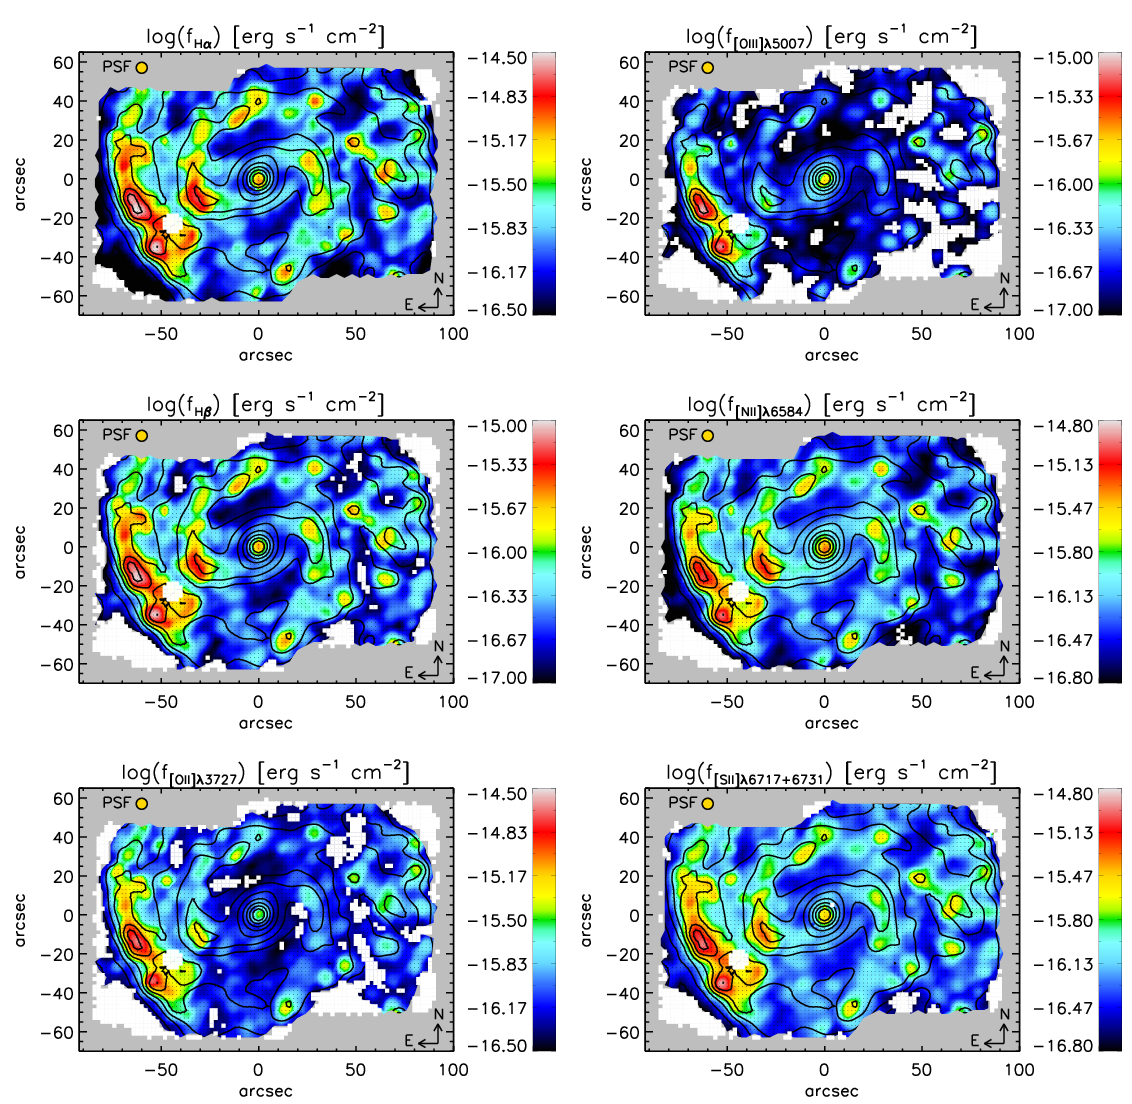
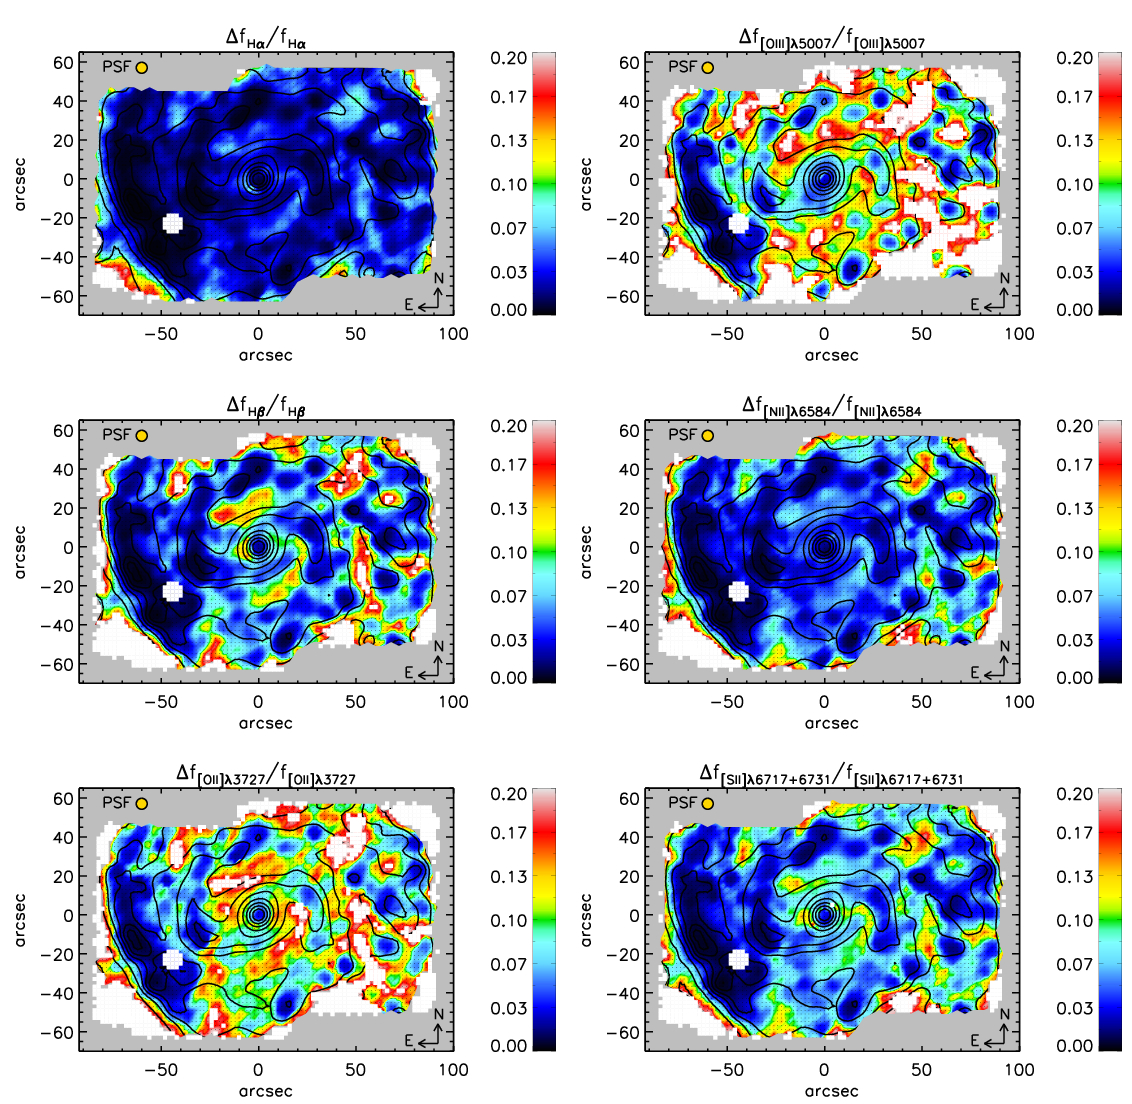
Figure 2 presents the maps of emission-line fluxes of H, H, [OII]3726+3729, [OIII]5007, [NII]6584 and [SII]6716+6731 in NGC 1042. Figure 3 illustrates the errors corresponding to these flux measurements. The morphology of the Balmer-linestrengths and the forbidden-linestrengths agree very well, all show clear spiral arms. The overall distribution of these emissions is significantly asymmetric. The emission in the eastern arms is stronger than that in the western arms, suggesting that the eastern arms contain more active star-forming regions. In the inter-arm regions we can detect significant amounts of emission, with a surface brightness that is one to two orders of magnitude fainter than that in the arms. There is also an enhanced emission in the center.
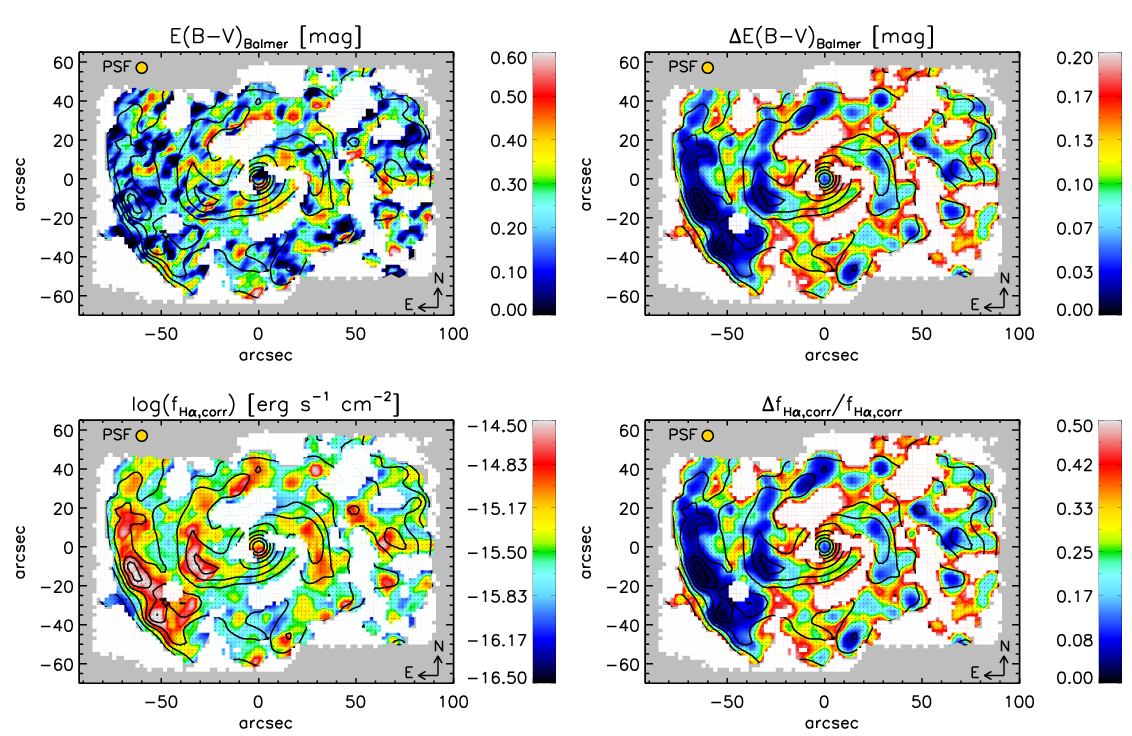
The amount of dust reddening can be determined by comparing the observed H/H ratio with the intrinsic H/H ratio expected from the recombination theory. We assume an intrinsic H/H ratio of 2.87 (Osterbrock & Ferland, 2006) and a Milk Way extinction law parameterized by Pei (1992). Figure 4 presents the map of and the extinction-corrected H flux. The measured errors of are obtained by propagating the uncertainties in the H and H line fluxes. In Figure 4 we masked the spaxels with error of larger than , which roughly amounts to an uncertainty of in the extinction correction factor at the wavelength of H. The median extinction of NGC 1042 is about (assuming ). Considering many spaxels have large errors in because of weak H fluxes, we decide not to perform the extinction corrections for the analysis in the remaining of the paper since we mainly focus on the emission-line ratios from now on. The effect of dust reddening will not significantly influence the values of emission line ratios we are interested in, as the central wavelengths of these lines are relatively close.
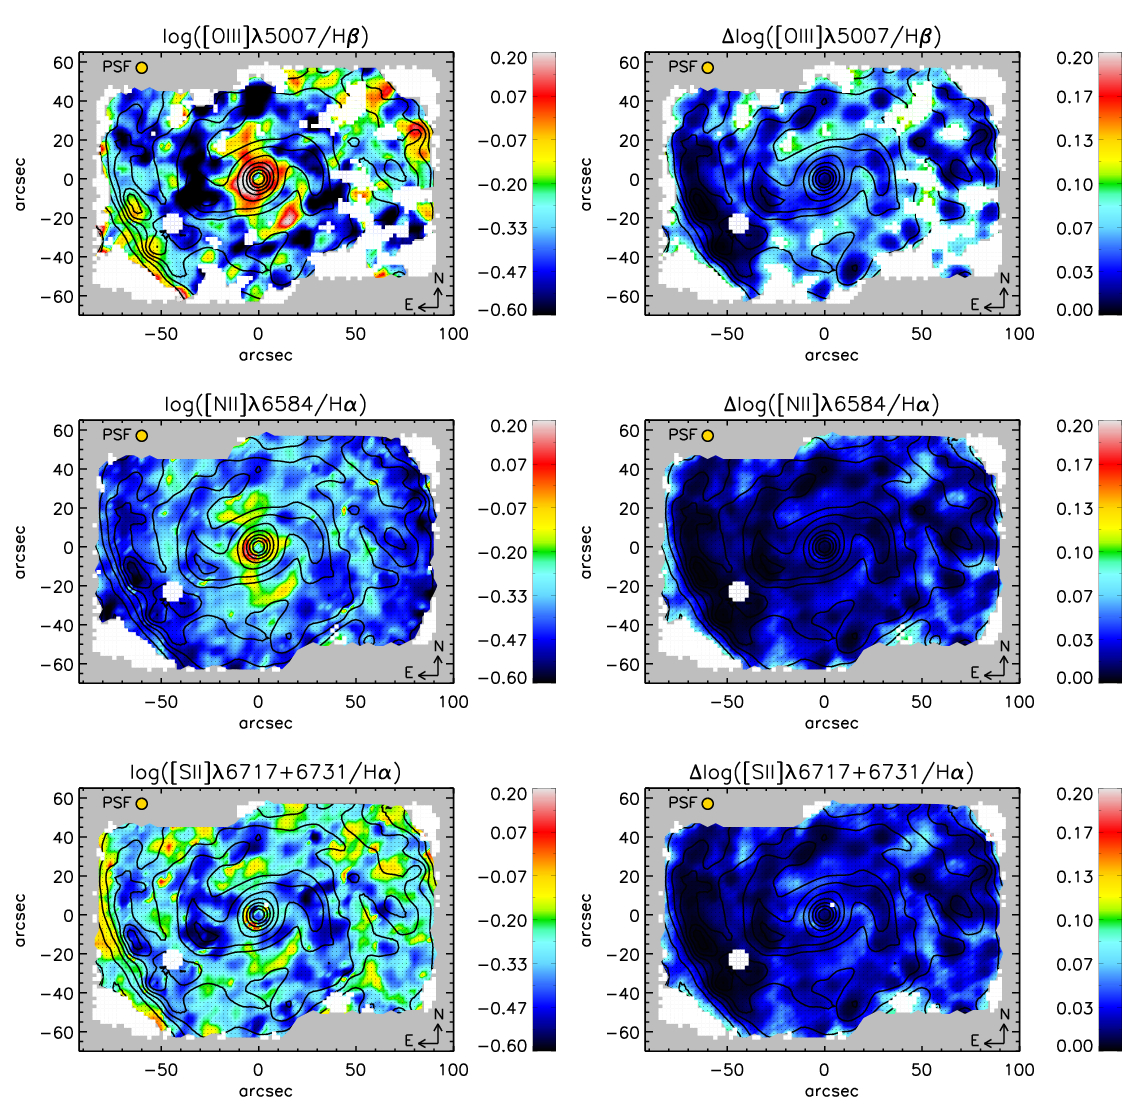
Figure 5 presents the maps of [OIII]5007/H, [NII]6584/H, and [SII]6716+6731/H. The line ratios of [OIII]5007/H and [NII]6584/H are sensitive to the ionization state and metallicity of the ionized gas. The line ratio of [SII]6716+6731/H traces a combination of temperature, ionization state and metallicity of ionized gas (Blanc et al., 2015). The higher values of these line ratios means a higher ionization state of the gas. The higher [OIII]5007/H, [NII]6584/H and [SII]6716+6731/H are detected in the inter-arm regions, with greater than those detected in the arms. This can be attributed to the existence of the diffuse ionized gas (DIG). The DIG is a layer of nearly fully ionized hydrogen around bright HII regions, which can extend to the inter-arm regions and several kpc above and below the mid-plane of disk galaxies (Mathis, 2000; Haffner et al., 2009; Blanc et al., 2009). It has been considered as a major component of the interstellar medium of the Milky Way and other disk galaxies (see reviews by Mathis 2000 and Haffner et al. 2009). The main ionization source of the DIG is the Lyman continuum photons leaking from the HII regions associated with the hot stars (Haffner et al., 2009, and references therein). In DIG the detected Balmer and forbidden emission are more diffused and the observed line ratios of [OIII]5007/H, [NII]6584/H and [SII]6716/H are always enhanced (Bland-Hawthorn et al., 1991; Haffner et al., 1999; Reynolds et al., 1999; Hoopes & Walterbos, 2003; Madsen et al., 2006; Voges & Walterbos, 2006; Blanc et al., 2009, Kaplan et al. submitted).
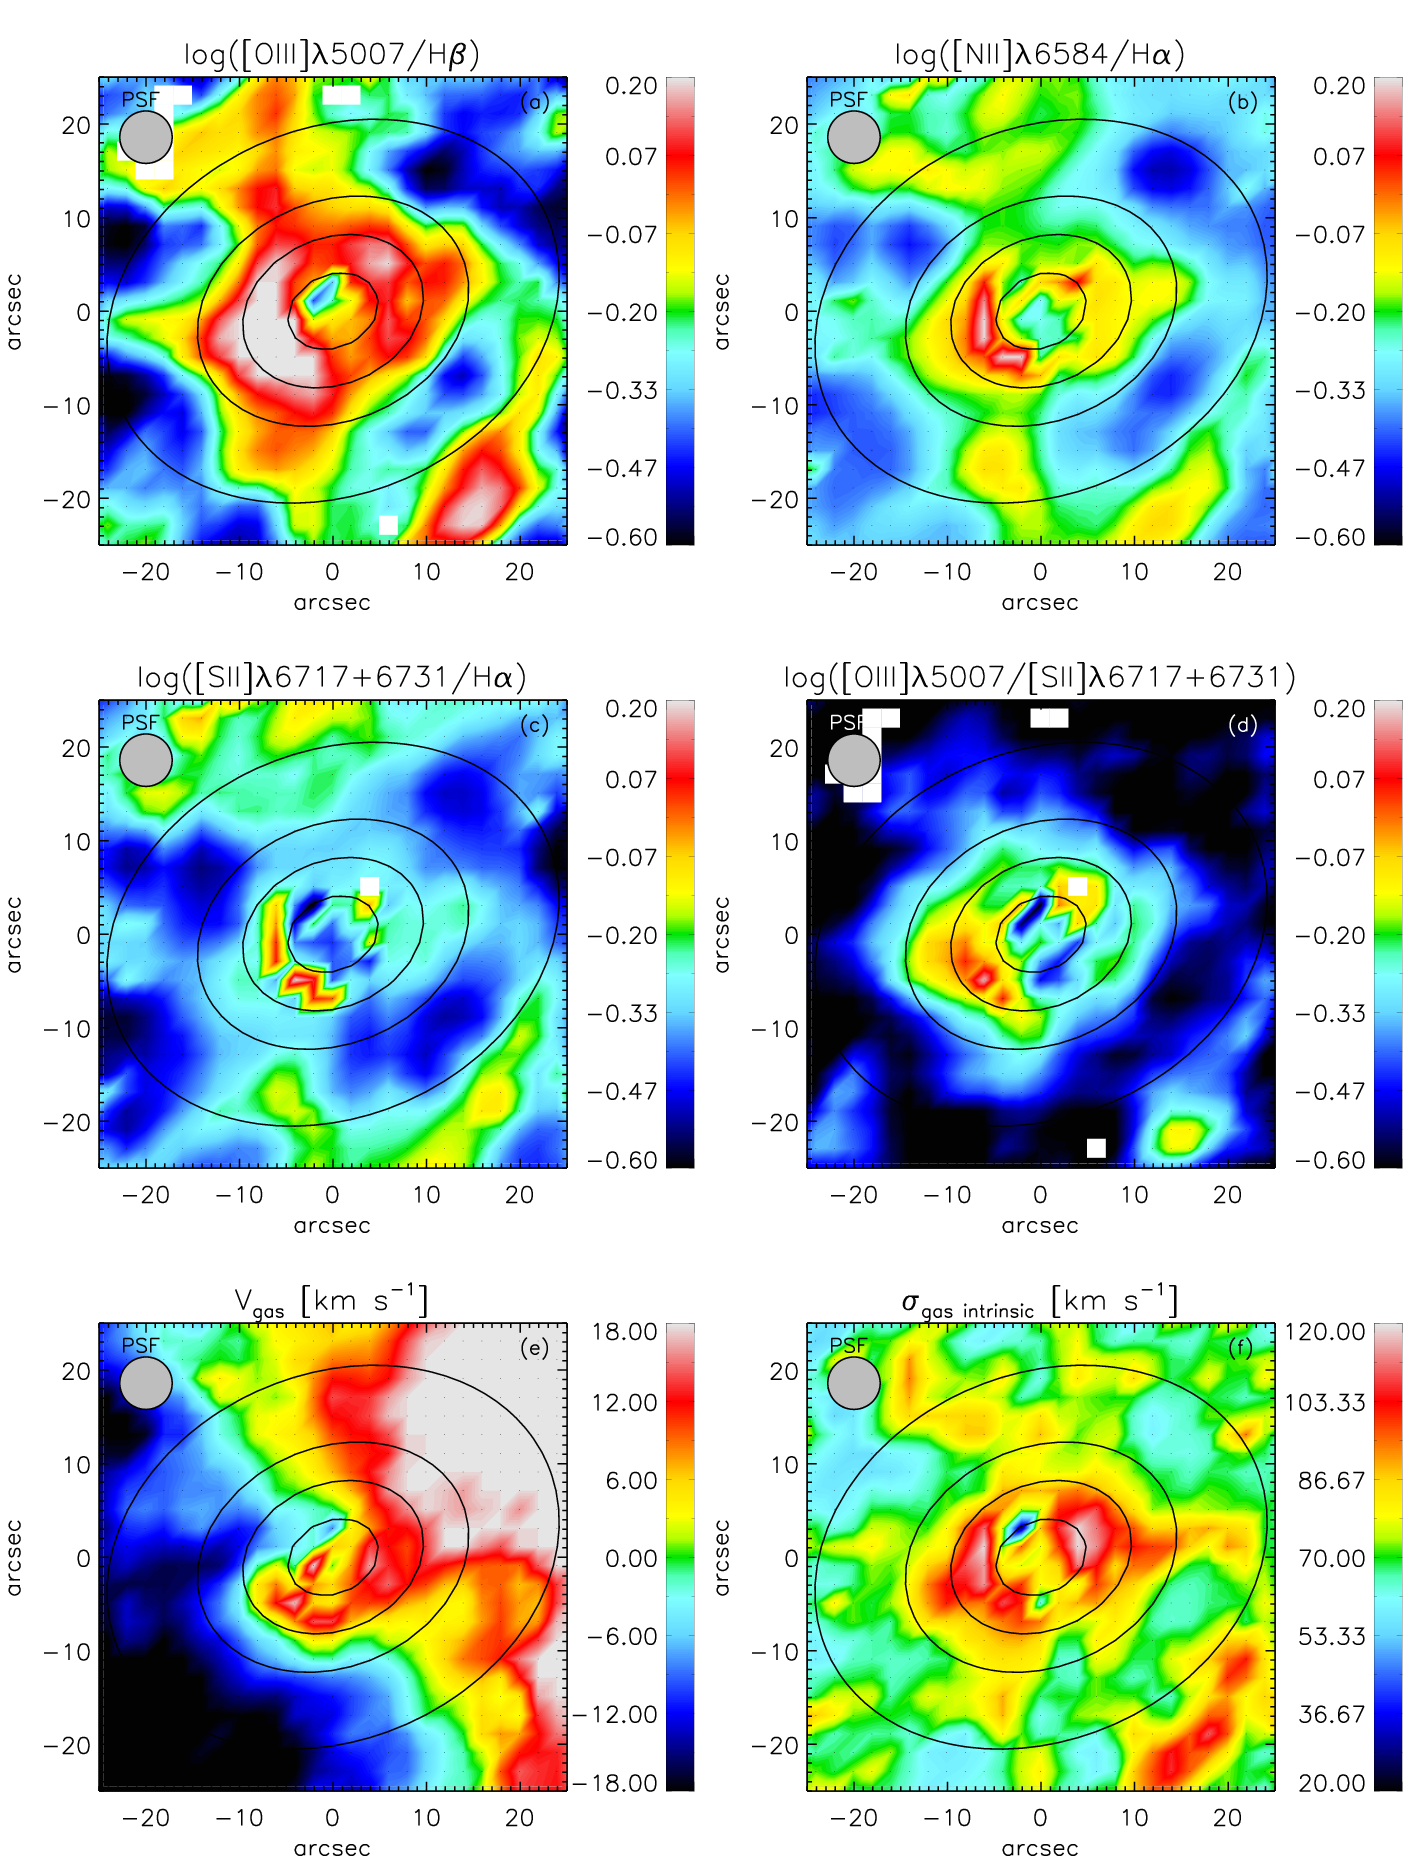
In addition to the DIG component, we also find a Circumnuclear Ring-like Ionized Gas Structure (hereafter, we use an abbreviate name as CRIGS) that shows enhanced line ratios in the central region. We show the zoomed-in maps of the emission line ratios in the central region in Figure 6. This structure extends from to from the center. The values of [OIII]5007/H, [NII]6584/H and [SII]6716+6731/H in the CRIGS are higher than the typical values seen in the spiral arm, and higher than the typical values of DIG in the inter-arm regions. The enhanced [OIII]5007/H in this location has also been observed by the SAURON survey (Ganda et al., 2006). This ring structure is different from the well-known circumnuclear star-forming rings in some galaxies that are located at several hundreds pc from the center (Comerón et al., 2010, 2014). These star-forming rings show enhanced star formation, thus, enhanced Balmer emission-line fluxes compared to their disk regions. For the CRIGS in NGC 1042, neither H nor H fluxes are enhanced. On the contrary, they show slight deficits. The [OIII]5007, [NII]6584, and [SII]6716+6731 fluxes are also slightly weaker in the CRIGS, but the line ratios of [OIII]5007/H, [NII]6584/H and [SII]6716+6731/H are enhanced compared to other regions of NGC 1042.
3.2 Maps of the Velocity Field and the Velocity Dispersion of Ionized Gas
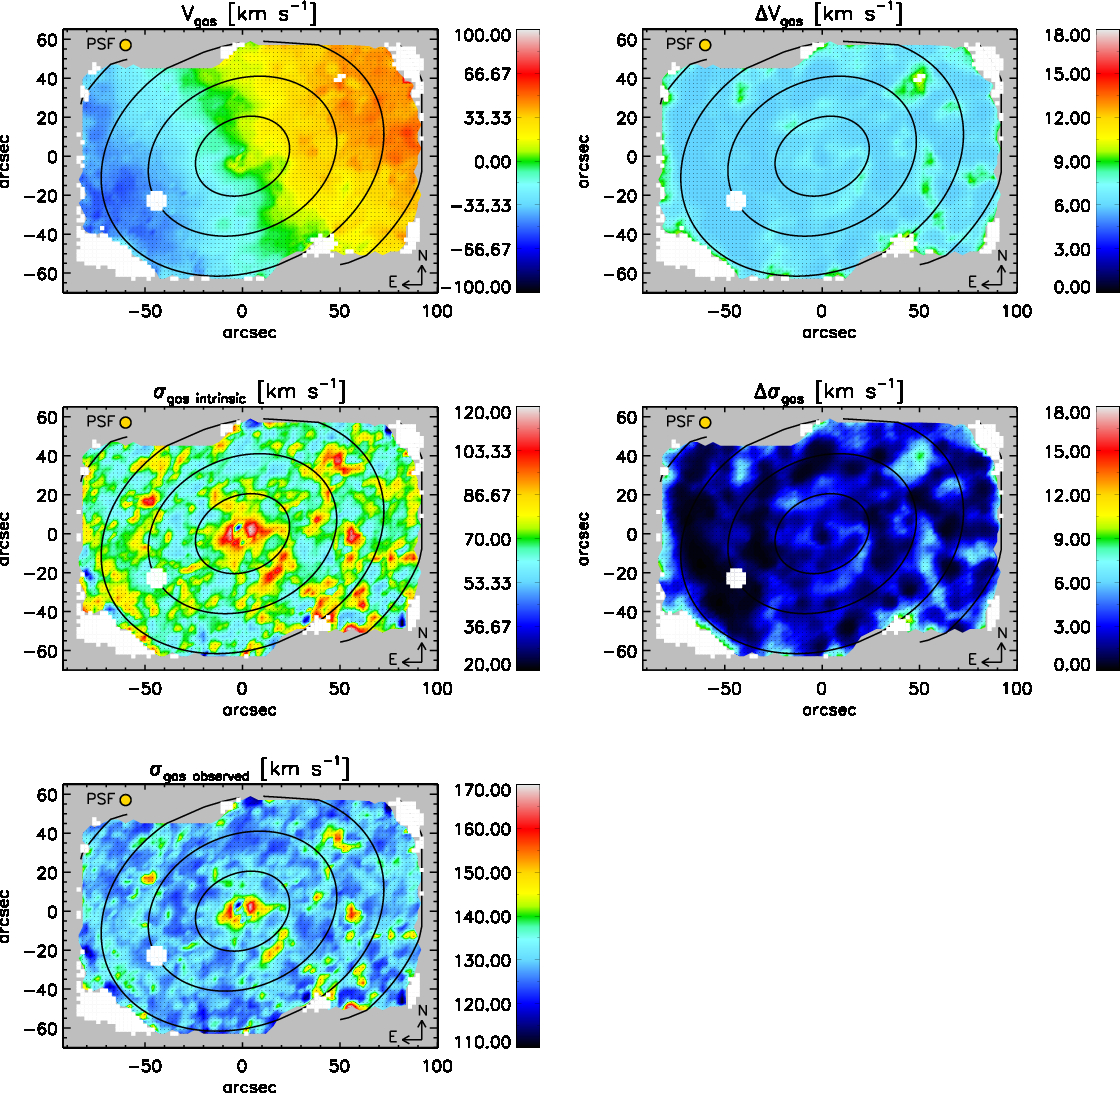
In Figure 7 we present the maps of the velocity field and the velocity dispersion of the ionized gas in NGC 1042. The error associated with the velocity is a combination of the errors in the emission line measurements and in wavelength calibrations. The errors for the velocity dispersion are obtained from the GANDALF fitting.
In addition to the map of the observed velocity dispersion, we also show the map of the intrinsic velocity dispersion of the ionized gas, which is obtained by subtracting the instrumental spectral resolution of the red setup (, see section §2.2) in quadrature from the observed velocity dispersion. Blanc et al. (2013) showed that the stellar velocity dispersion of the VENGA galaxies can be largely overestimated when the intrinsic velocity dispersion is significantly smaller than the instrumental resolution, using the Monte Carlo simulations. We do not perform similar analysis to the velocity dispersion of the ionized gas, and it could also be overestimated for the regions with relatively low intrinsic velocity dispersion. However, for the regions with intrinsic velocity dispersion comparable to or larger than the instrumental resolution, our measurements are robust.
In general, the ionized gas follows the regular circular rotation. Some extent of twists exists in the central region. The velocity dispersion in the inter-arm region is relatively higher than that in the spiral arm, while some bright HII regions also show enhanced velocity dispersions. As shown in Figure 6 (e) and (f), the ionized gas in the central region presents a strongly spiral-like kinematic twist and a significant enhancement of velocity dispersion in the CRIGS, reaching to 90-130 . This is higher than the typical values of the ionized gas in spiral galaxies (, Epinat et al., 2008).
3.3 The LINER-like emission in the CRIGS of NGC 1042
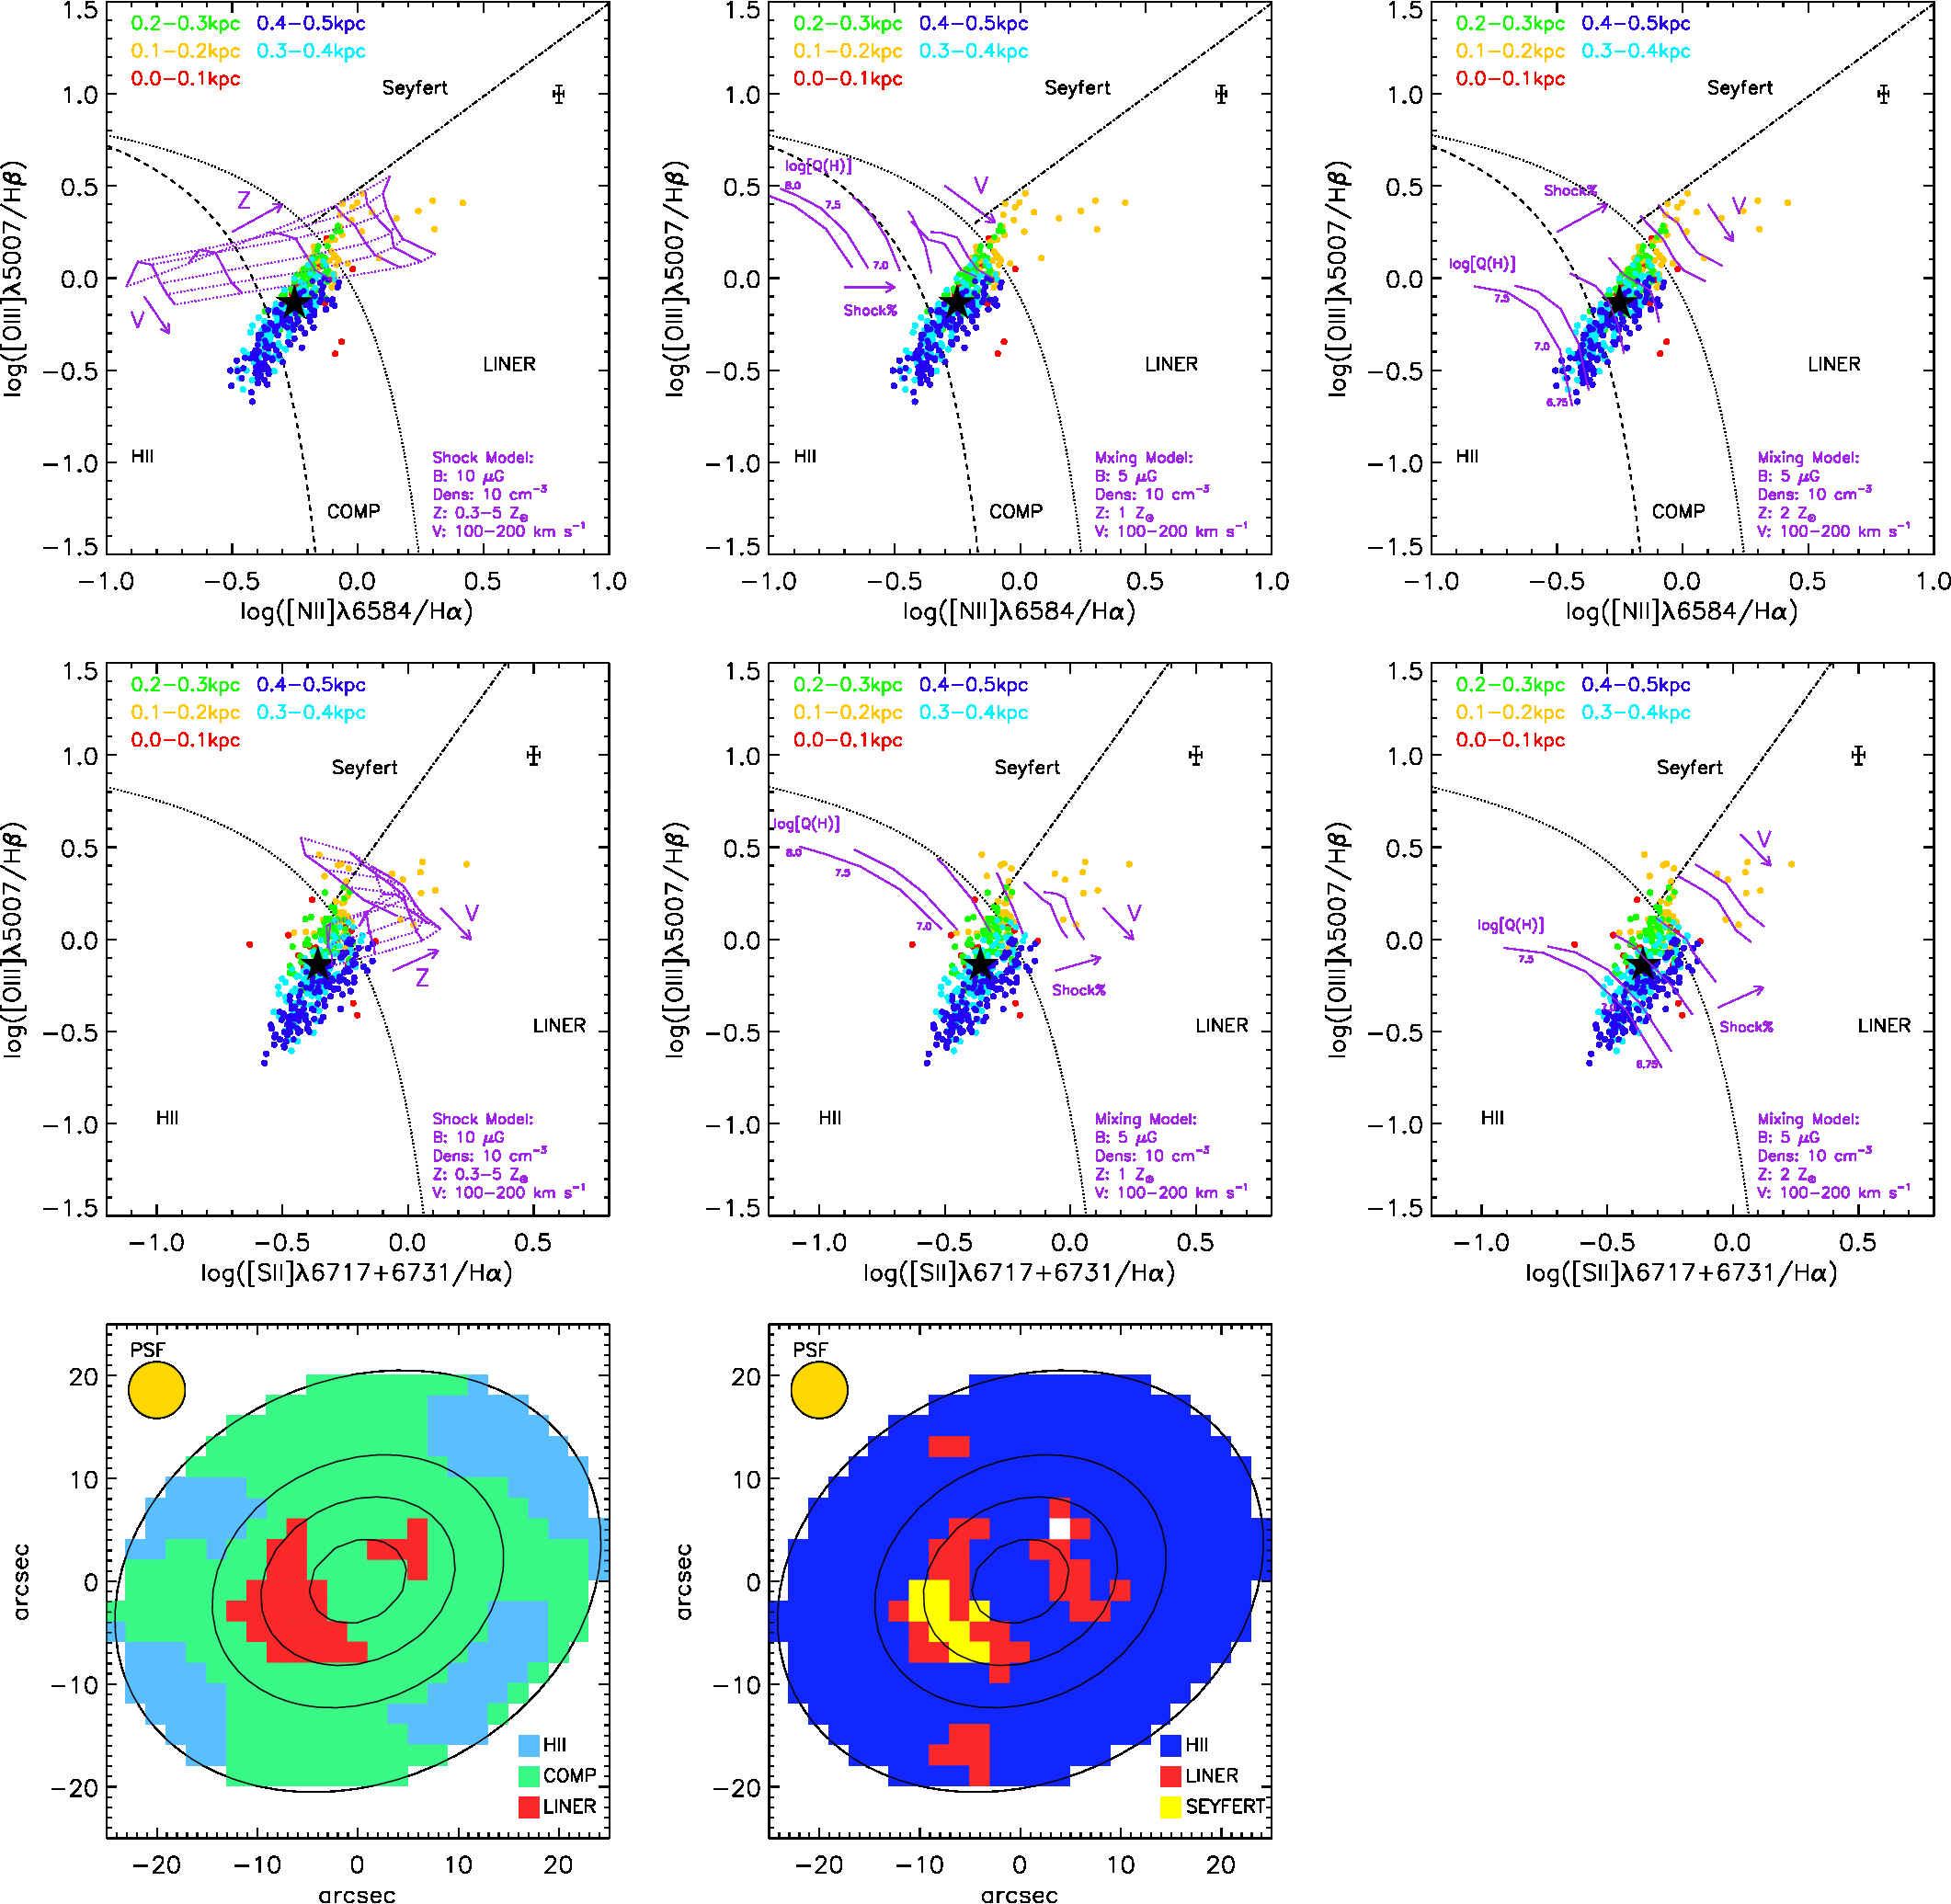
The “Baldwin, Phillips, Terievich”(BPT) diagrams (Baldwin et al., 1981; Veilleux & Osterbrock, 1987) of spectra in the central region are shown in the top panel of Figure 8. We ignore the data points with emission lines in the corresponding diagram having . The data points are color coded with different galactocentric radii. In the bottom panel of Figure 8, we present the schematic maps of classifications based on the BPT diagrams. In the [OIII]5007/H vs [NII]6584/H diagram, regions with nebular emission dominated by the HII regions only lie at galactocentric radius larger than , while most regions within the are located in the composite part. The regions associated with the CRIGS are mainly located at the LINER part. In the [OIII]5007/H vs [SII]6716+6731/H diagram, most regions are located in the star-forming part, although a large fraction of them are located in the composite part of the [OIII]5007/H vs [NII]6584/H diagram. The regions associated with the CRIGS are also located in the Seyfert/LINER region.
As shown in the classification schematic map, most regions in the CRIGS present LINER-like emission. In the rest of this paper, we aim at characterizing the nature of this structure through analysing the excitation mechanism of the LINER-like emission (§4.1) and quantifying the kinematics properties of the ionized gas (§4.2) in the CRIGS.
4 Analysis
4.1 Excitation Mechanism of the CRIGS in NGC 1042
Several ionization mechanisms can give rise to a LINER-like emission. The dominant mechanism can vary in different galaxies and even in different regions within the same galaxy. AGNs, post-asymptotic giant branch (p-AGB) stars and shocks are the main candidates. (Ho, 2008). In this section, we discuss the dominant ionization mechanism of the CRIGS in NGC 1042.
4.1.1 Photoionization from the Central AGN
Photoionization from the central AGNs has been considered as the most important ionization mechanism of the LINER-like emission in the central few hundred pc of galaxies (Ferland & Netzer, 1983; Halpern & Steiner, 1983; Pequignot, 1984; Binette, 1985; Ho et al., 1993; Groves et al., 2004). We investigate the role of this mechanism in the CRIGS through analysing the distribution of the ionization parameter as a function of radius in the central region of NGC 1042.
The dimensionless ionization parameter has been widely used to describe the ionization state of gas in galaxies. This parameter is defined as , where Q is the flux density of the ionizing photons passing through the gas clouds, ne is the electric density of the ionized gas, and c is the speed of light. Due to the central ionizing property of AGNs, one can predict an r2 dilution of Q around this ionization source. When combining with the observed ne of the ionized gas, we can estimate the behaviour of U as a function of radius if the gas is photoionized by AGNs.
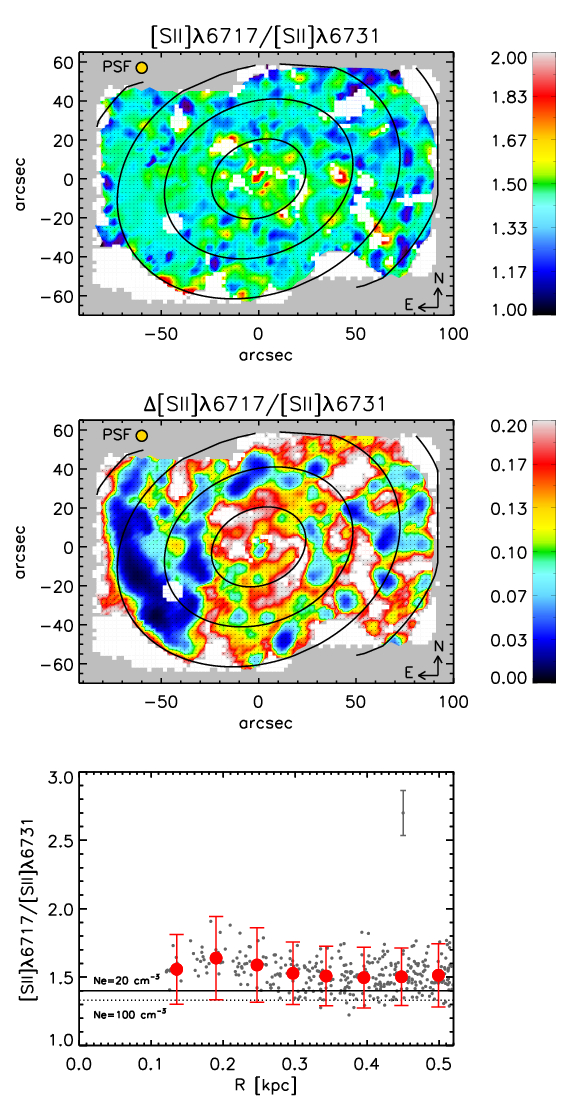
Figure 9 shows the maps of [SII]6716/[SII]6731 and its error, and the radial profile of [SII]6716/[SII]6731 in the central scale. The [SII]6716/[SII]6731 is a function of ne and only weakly depends on the gas temperature. It has been widely used as an indicator for ne. As shown in Figure 9, the line ratio of the [SII] doublets indicates a fairly constant ne as a function of radius in the central . Thus, if the clouds are photoionized by the central AGN, the predicted behaviour of U in this region should in principle follow that of Q and also shows an dilution. This argument assumes a constant gas filling factor throughout the inner few hundred pc of the galaxy. An increased filling factor could result in a slope shallower than 2, but we should still expect a continuous decrease in U as a function of radius.
The observed distribution of U, which can be indicated by the [OIII]5007/H (Figure 6 (a)), are inconsistent with this prediction. Based on the photoionization models, Yan & Blanton (2012) found that the [OIII]5007/[SII]6716+6731 ratio can also be used to trace U. Thus, we also present in Figure 6 (d) the map of the [OIII]5007/[SII]6716+6731. This line ratio has similar characteristics with the [OIII]5007/H map, which shows an enhancement in the CRIGS, - away from the nucleus. Therefore, from a morphological point of view, photoionization from the central AGN can not be the mechanism of the observed LINER-like emission in the CRIGS.
4.1.2 post-AGB Stars
Photoionization from post-AGB stars is another mechanism for the LINER-like emission in galaxies. These stars can produce a diffuse radiation field and provide sufficient ionizing photons to account for the extended LINER-like emission in galaxies (Binette et al., 1994; Stasińska et al., 2008; Sarzi et al., 2010; Cid Fernandes et al., 2011; Yan & Blanton, 2012; Singh et al., 2013).
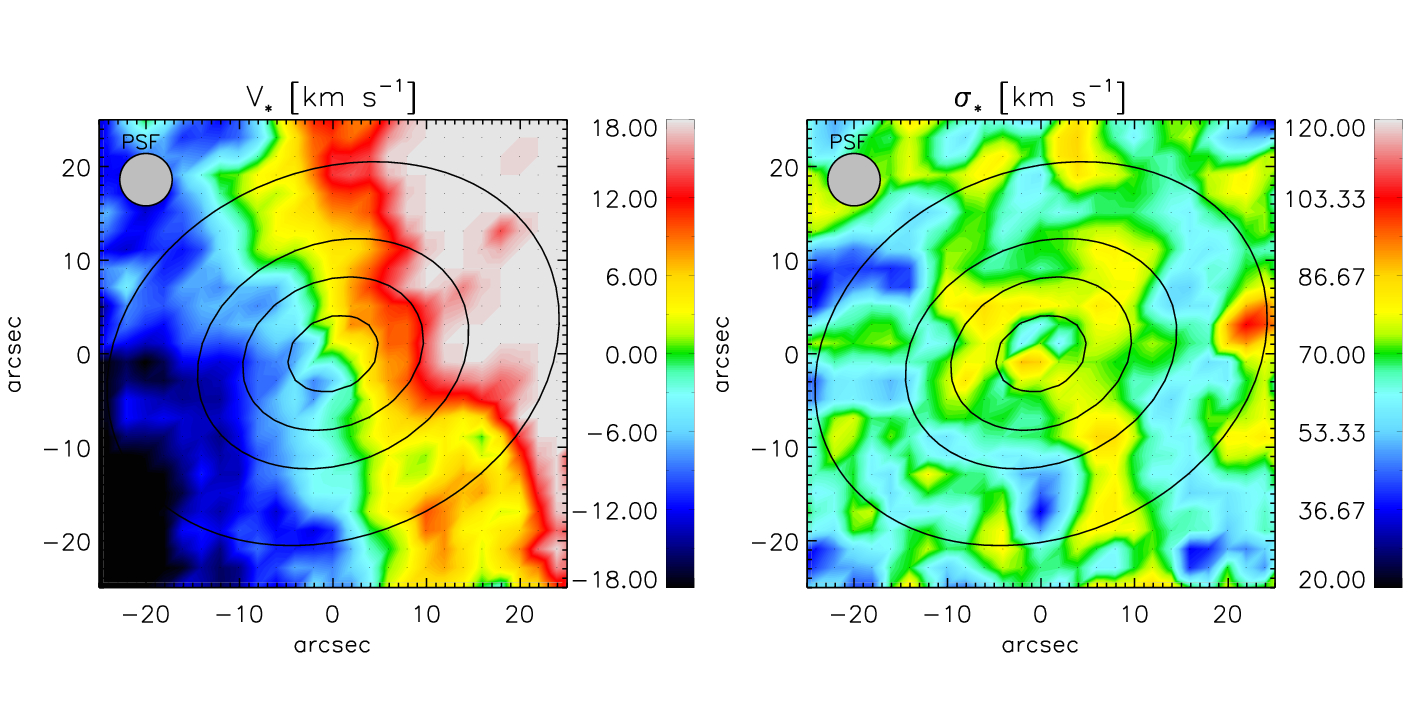
However, we do not think that the post-AGB stars are the dominant mechanism behind the observed nebular emission in the CRIGS. Post-AGB star is the final phase of the stellar evolution for stars with low and intermediate initial masses (van Winckel, 2003). Therefore, the spatial distribution of post-AGB stars should follow that of the overall stellar distribution and present an extended smooth ionization field over the whole galaxy. This is inconsistent with the morphology of the CRIGS. In addition, as shown in Figure 10, the stars follow the regular circular rotation in the CRIGS, the disturbed motion and enhanced velocity dispersion only appear in the gas. This suggests that the underlying ionization mechanism in the CRIGS is strongly connected with the gas, not with the stars.
4.1.3 Shock Excitation
Radiative shocks can also produce the LINER-like emissions in galaxies. The collisional excitation in the post-shock region radiates a large amount of photons and can generate the LINER-like emission in galaxies. The shock-induced LINER-like emission has been observed in systems associated with the galactic winds (Veilleux et al., 2003; Monreal-Ibero et al., 2006; Sharp & Bland-Hawthorn, 2010; Rich et al., 2010, 2011; Kehrig et al., 2012; Ho et al., 2014; Arribas et al., 2014) and IGM in clusters (Farage et al., 2010; McDonald et al., 2012).
We compare the observed properties of the ionized gas (line ratios and velocity dispersion) in the CRIGS with the predictions of the radiative shock models. The models of steady-flow radiative shocks have been developed by Sutherland & Dopita (1993); Dopita & Sutherland (1995, 1996) and summarized in Dopita & Sutherland (2003). In these models, the radiative fluxes and emission-line spectra of different shock components are calculated under four physical parameters: preshock density, shock velocity, magnetic parameter and medium metallicity. The model-predicted flux ratios of different diagnostic lines and the corresponding shock velocities can be used to compare with the observed emission line ratios and velocity dispersion of gas. Of course, the shock-induced enhancement of gas velocity dispersion strongly depends on the shock geometry and we do not expected a one-to-one match. But considering that the shocks can always accelerate the medium and the shock front can not be fully resolved within the observed spatial resolution, some positive correlation between the shock velocity and the velocity dispersion of shocked gas is excepted. This kind of correlation has indeed been observed in Micro-quasar S26 (Dopita et al., 2012).
In the fast radiative shock models (), the ionizing photos from the post-shock region will go through the preshock medium and generate a photoionization front (precursor) ahead the shock front, which is also included in the calculation of emission line spectrum. In the slow radiative shock models (), the ionizing photos from the post-shock region will be absorbed in the vicinity of the shock front. The radiation contribution of photoionization precursor is negligible and the detailed emission line spectrum is more related to the shock itself. Since the velocity dispersion of the ionized gas in the CRIGS () is significantly lower than the typical velocities of the fast radiative shock models, we only compare our observations with the slow radiative shock models.
In recent years, a series of slow radiative shock models have been developed and used to test the shock excitation in different environments (Farage et al., 2010; Rich et al., 2010, 2011; McDonald et al., 2012; Ho et al., 2014). In Rich et al. (2010), the model grids are calculated for fully pre-ionized medium with cloud densities , metallicities and , shock velocities range from 100 to (in steps of ) and . In Rich et al. (2011), the slow radiative shock model is combined with the photoionization model of HII regions to produce a mixing model, in which the line ratios vary with the fraction of the shock components. The model grids of the HII region are generated with varying ionization parameters and metallicities. For the model grids with and , log[Q(H)] is from to and from to , respectively.
We plot our observed BPT diagrams together with the models from Rich et al. (2010, 2011) in Figure 8. In general, these models can explain some of the data points in the CRIGS. The models in the [OIII]5007/H vs [SII]6716+6731/H diagram can provide a better match to the data points in the CRIGS than that in the [OIII]5007/H vs [NII]6584/H diagram. In the mixing models, the grids with higher shock fractions can match the data better. The matched shock velocities in these models range from to , which is roughly consistent with the velocity dispersion of the ionized gas in the CRIGS (). Based on the above comparisons, we propose that the enhanced emission-line ratios and velocity dispersion in the CRIGS are related to the shock phenomenon.
4.2 Kinematic Analysis of the Ionized Gas
Radiative shocks are strongly related to the kinematic behaviour of the ionized gas. Inflows induced by the non-asymmetric structures, outflows driven by the starbursts or AGNs and cloud collisions can produce shocks in the ISM. The kinetic energy of gas supersonic motions can be effectively dissipated through radiative shocks. In order to understand the kinematic properties of the ionized gas in the CRIGS, we compare the observed velocity field of the ionized gas with the velocity field model of a pure rotating disk.
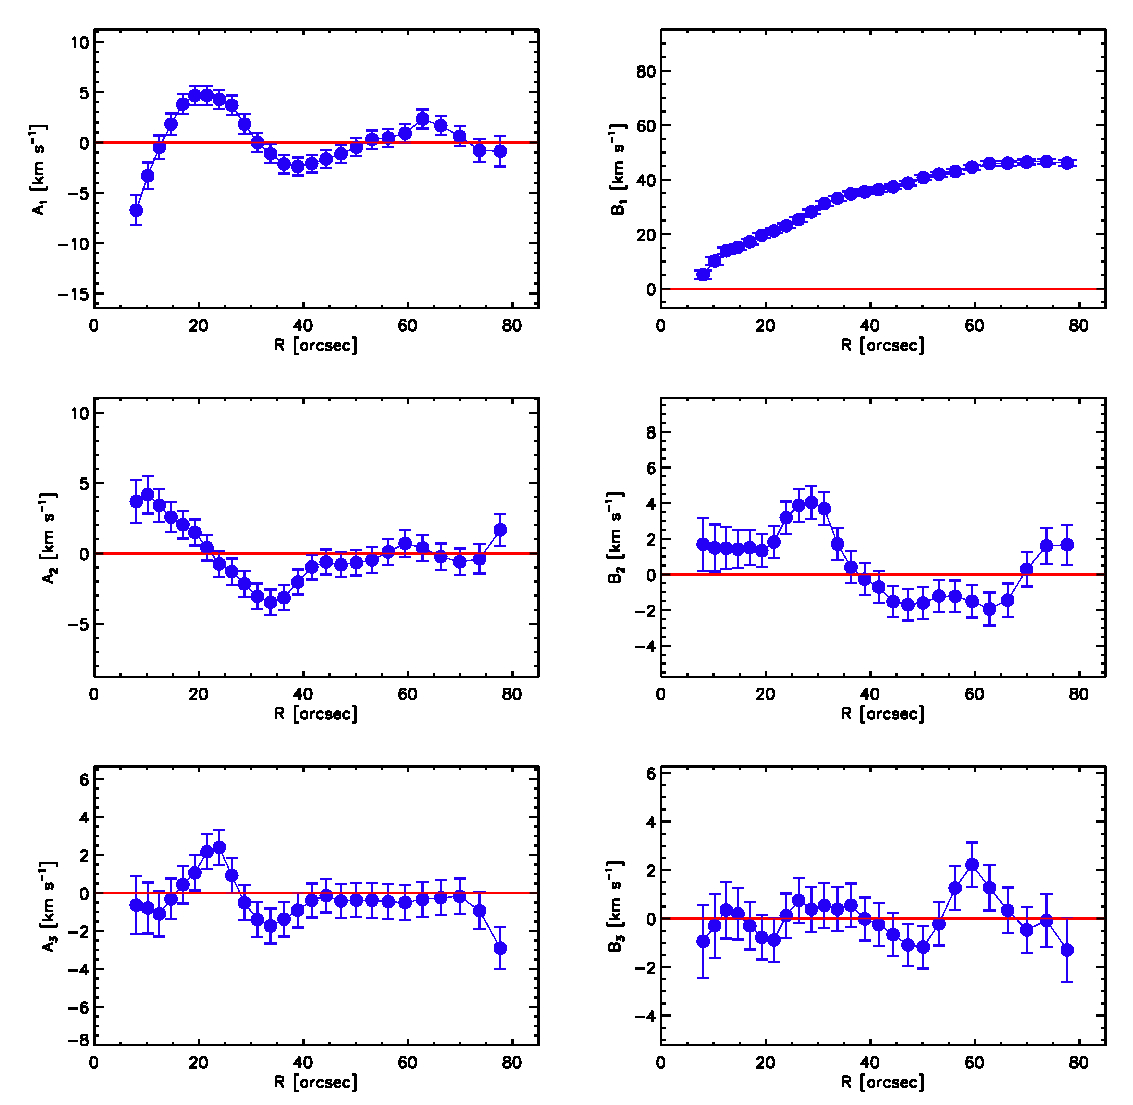
We construct the velocity field model using the method of harmonic decomposition modelling. This method uses different Fourier components of the line-of-sight (LOS) velocity to describe the kinematic properties of galaxies and construct the corresponding velocity field models (A more detailed description of the harmonic decomposition modelling is in Appendix A). We use the IDL package KINEMETRY (Krajnović et al., 2006) to perform the harmonic decomposition modelling. First, we determine the geometry parameters of the pure rotating disk and the systemic velocity of NGC 1042 (see Appendix B for details). Next, we fix these parameters and decomposed the LOS velocity field into a series of Fourier components in a set of elliptical annuli along the semi-major axis of the galaxy. We expand the Fourier terms to the third order () and show the radial profiles of their coefficients in Figure 11. As the term describe the rotational velocity component of the LOS velocity, we use it to build the velocity field model of the pure rotating disk. The range of the elliptical major axis is from to , corresponding to the physical scale from to . The minimum radius is set to be slightly larger than the FWHM of the PSF () in our observation. The outermost radius is set by the requirement that there are at least of the data available in the elliptical annuli.
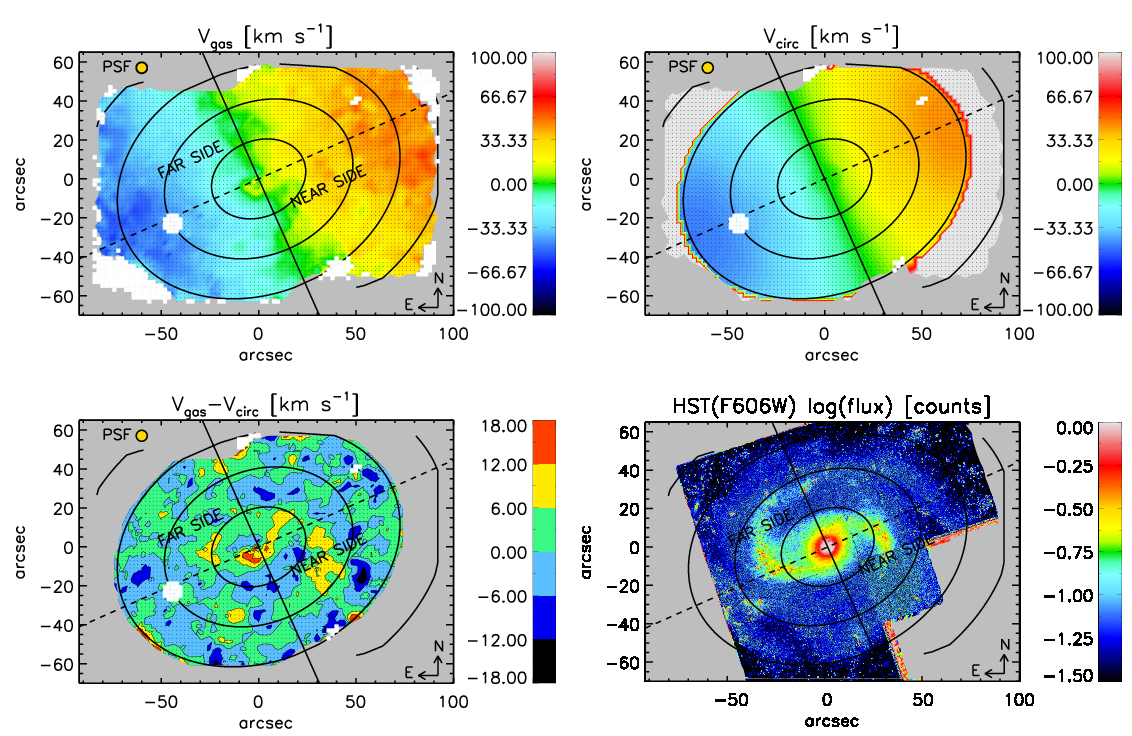
The observed velocity field of the ionized gas, the velocity field model of the pure rotating disk, the residual velocity field (subtract model from the observed map) and the HST 606W image of NGC 1042 are shown in Figure 12. The minimum error of our velocity measurements is about . Thus, we show the residual velocity field with velocity bin of . Assuming the spiral arms are trailing and considering the rotation direction of the velocity field, we determine the near side and far side of this galaxy to be Southwest (SW) and Northeast (NE), respectively. The typical value of the residual velocity ranges from 0 to , which is within the error bars of the LOS velocity. For the bright star-forming regions in the spiral arms, the residual velocity can enhance to . This could be the result of supersonic turbulence maintained by the energy output through supernovae and stellar winds (Scalo & Elmegreen, 2004; Sellwood, 2014). However, we notice that only part of the bright star-forming regions are associated with the enhancement of the residual velocity.
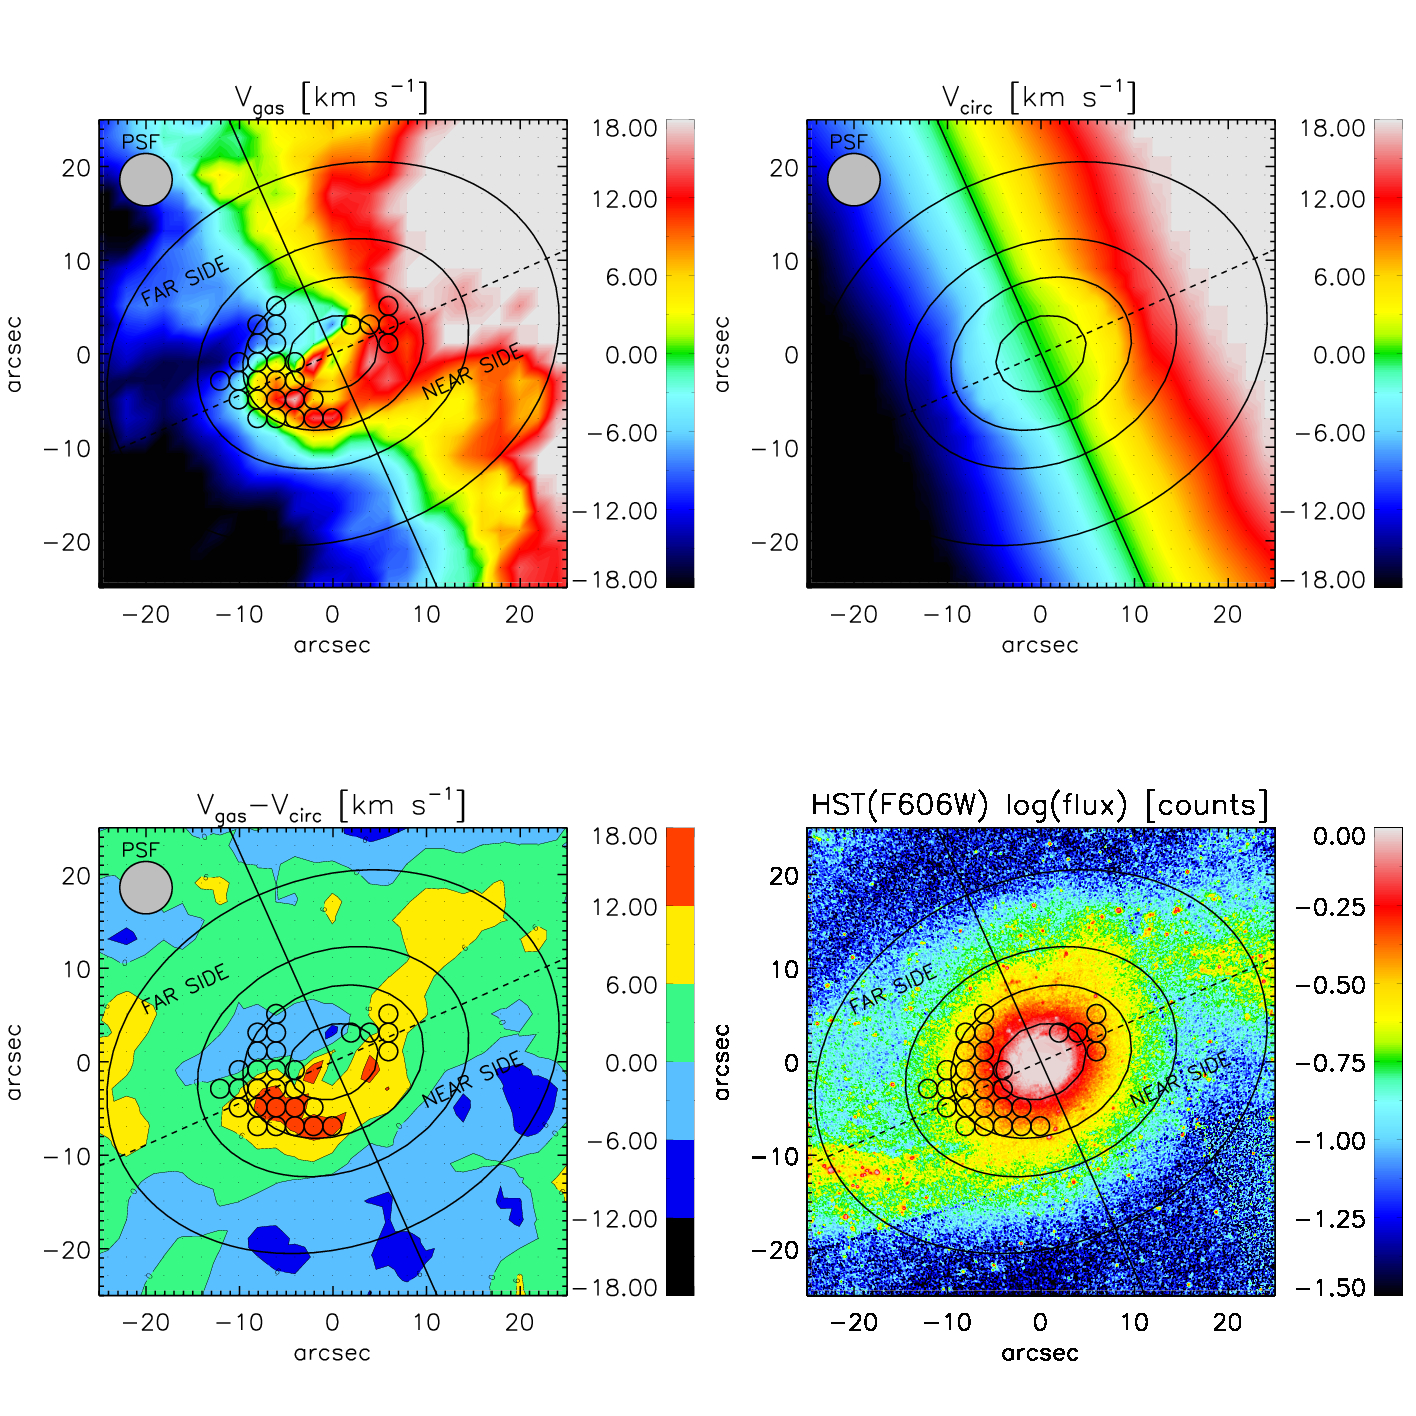
As shown in Figure 13, in the central region, we find that the residual velocity associated with the CRIGS has a significant enhancement and reach to the largest value in the residual velocity field (), indicating strong non-circular motions in this structure. On the near side we see redshifted velocities and on the NE quadrant of the far side we see blueshifted emission. This amounts for a clear signature of ionized gas inflow associated with the CRIGS. Further evidences come from the radial profiles of different Fourier coefficients obtained from the harmonic decomposition modelling. As we introduced in Appendix A, the first-order Fourier terms ( and ) describe the radial and rotational velocity components of the LOS velocity. The higher-order Fourier terms ( and , ) can provide the information about the perturbations of the gravitational potential. As shown in Figure 11, the radial velocity component () ranges from to in the central 8-15 (160 pc-300 pc) region, associated with the CRIGS. The negative sign indicates the inflowing feature of this component. In this region, the absolute value of this inflowing velocity component is comparable to that of the rotational velocity component (), ranging from to . Although the velocity component also have some contribution within the inner 15 (), which may indicate the potential perturbation in this region (e.g. lopsided disk), the other higher order velocity components (, , ) only have limited contribution to the LOS velocity. These results suggest the ionized gas inflow is the main contributor of the non-circular motions in the CRIGS.
Interestingly, the morphology of the inflowing gas is asymmetric. As shown in Figure 13, the inflow signature is dominated by the redshifted velocities in the near side of NGC 1042. In order to quantify the significance of this asymmetry, we compare the inflow timescale (the timescale of the inflowing gas moving to the galaxy center) with the dynamical timescales in the central disk (at radius of ()). Based on the measured rotation velocity (), we obtain the dynamical timescale . In the meantime, assuming a constant inflow velocity (, see §5.1 for details), we obtain the inflow timescale . is about 8 times , suggesting that the gas inflows cannot last for one rotation period. Thus, the asymmetry of the inflowing gas is expected as the gas does not have time to circle the disk before it is being induced to the center.
In disk galaxies, the gravity torques induced by the non-axisymmetric features (such as bars, ovals, and spiral arms) can drive gas inward to the central region of galaxies (Shlosman et al., 1989, 1990; Kormendy & Kennicutt, 2004; Martini, 2004; Jogee, 2006). The inflowing gas is usually shocked and can be traced by dust lanes (Athanassoula, 1992). As we introduced in §1.1 and shown in Figure 12 and 13, the inner spiral arms in NGC 1042 are very open and sharply curve towards the central region, which can produce a bar-like structure and enhance the perturbation strength of the gravitational potential (Buta et al., 2005; Buta & Zhang, 2009). In Figure 13, we find that the shocked gas is located at the trailing side and the end of the inner spiral arms. Thus, we propose that this spiral arm structure can produce a similar dynamical effect as a bar to drive the radial gas inflow. If two spiral arms are considered as the boundary of a “bar”, we would expect the shocked gas inflow appear along the trailing side of the spiral arms and at the point where spiral arms end (Li et al., 2015), which is supported by our observation. Previous studies have found two excellent examples (NGC 4321 and M 51) of secular evolution induced by spiral arms (Kormendy & Cornell, 2004; Kormendy & Kennicutt, 2004). In these galaxies, the regular global spiral arms directly wind down to the galaxy center and produce nuclear star formation. Our observational results of NGC 1042 provide another example of spiral arm induced gas inflows in disk galaxies.
5 Discussion
In §4 we demonstrate that the CRIGS is shock excited and the shock is produced by the inflow of the ionized gas driven by the inner spiral arms in NGC 1042. Here we estimate the mass inflow rate of the ionized gas and further discuss its implications for the AGN feeding and star formation in the nuclear star cluster.
5.1 Mass Inflow Rate of the Ionized Gas
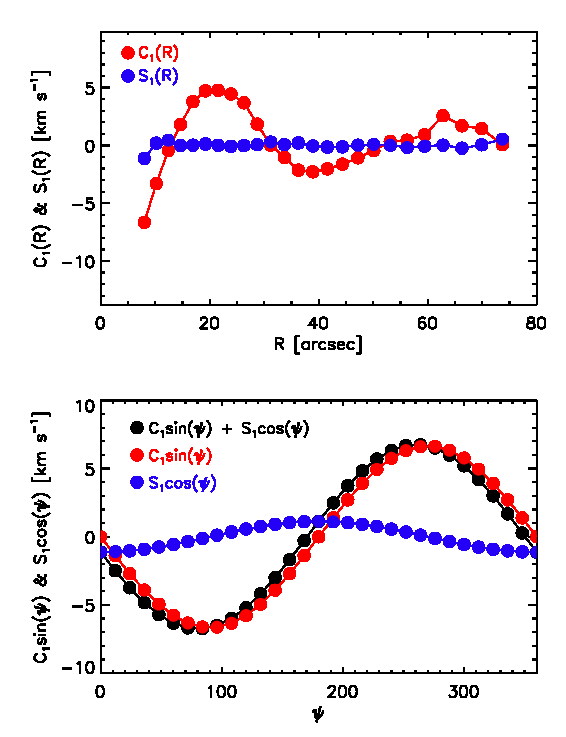
As shown in §4.2.3, the observed LOS velocity in the CRIGS is mainly dominated by the inflowing velocity component ( term). In order to quantify this and separate the radial flow (which points towards the center, and may feed the nuclear activities) and the azimuthal streaming flow (which may just circle around the CRIGS, and not contribute to the feeding of the nuclear activities), we decompose the residual velocity field shown in Figure 12 into two Fourier terms, as . The components and correspond to the radial flow component and the azimuthal streaming component, respectively. We again use the Kinemetry software to execute the decomposition and show the results in Figure 14. The top panel shows the and as a function of radius. It shows that the radial inflow dominates the residual velocity and the azimuthal streaming flow is negligible. In the bottom panel of Figure 14, we also show the azimuthal distribution of the components , and their sum at the annulus with radius of (the median radius of the CRIGS). In the whole annulus, the azimuthal streaming flow is negligible. Thus, we use the whole residual velocity () associated with the CRIGS to approximate the inflow velocity along the line of sight. By adapting the inclination angle of , we obtain the deprojected inflow velocity as .
Having estimated the inflow velocity, we now estimate the mass inflow rate of the ionized gas. Since the CRIGS has a ring-like morphology, we assume that the inflowing gas is ring-like at radius and with height , and we calculate the integral of the flux of matter through a cylindric area of radius and height . Thus the mass inflow rate can be described as below:
| (1) |
where is the electron density, is the mass of the proton, is the filling factor of the ionize gas, and is the deprojected inflow velocity.
and can be estimated based on the position and size of the inflow region. We use the outer boundary of the CRIGS as the border of the inflow region, thus is about . The inflow region extends from to from the galaxy center, thus the size of this region is . Assuming the value of has similar order of magnitude as that of the radial span of the inflow region, and considering the projection effect, should be , which gives . Even though this is an assumption, can not be larger than this value, otherwise, the inflow region would appear wider. Therefore, can be considered as an upper limit of . Adopting an average (see Figure 9) and (Schnorr Müller et al., 2011), we obtain the mass inflow rate as . The uncertainty of distance of NGC 1042 (describe in §1.1) can affect the value of , , and the estimation of mass inflow rate, thus, we also calculate the mass inflow rate corresponding to the distance of NGC 1042 at , which is .
5.2 Implication for Feeding the Nuclear Activities
The mass accretion rate () at the last stable orbit of the blackhole can be calculated as:
| (2) |
where is the velocity of light, is the bolometric luminosity of AGN, and is the radiation efficiency which describe the efficiency of accreted mass energy converted into radiation. depends on the nature of different accretion disks and flows. For LINERs, it has been suggested that the accretion disk is geometrically thick, and optically thin (Nemmen et al., 2006; Yuan, 2007). This kind of accretion flow is known as RIAF (Radiatively Inefficient Accretion Flow; Narayan, 2005), and has a typical value of . Using the bolometric luminosity of for NGC 1042 (Shields et al., 2008), we obtain the mass accretion rate .
The mass inflow rate described in §5.1 is about 100 times the mass accretion rate. This result suggests that, the inflowing gas is sufficient to feed the AGN activity in NGC 1042, and only a small portion (a few percent) may be transferred into the center to feed the blackhole. This is in agreement with many previous studies. As discussed in Ho (2008, 2009), most LLAGNs in the nearby universe reside in a low or quiescent state and undergo the radiative inefficient accretion, even though the fuel is plentiful in the central region of these galaxies. They show that the local processes (e.g. mass loss from evolved stars and Bondi accretion of hot gas) can provide sufficient fuel for nuclear activity. Based on the lack of correlation of blackholes with disks and pseudobulges, Kormendy et al. (2011) and Kormendy & Ho (2013) also proposed that the local stochastic processes can feed the growth of blackholes in disk-dominated galaxies at redshift . In addition, Genzel et al. (2010) summarized the effective mass accretion rate from a few hundred pc to several schwarzschild radius in the Milk Way and proposed that the angular momentum transport of the gas surrounding the Galactic center blackhole could be inefficient. High-spatial-resolution observations (e.g. Thirty Meter Telescope, Atacama Large Millimeter/submillimeter Array) will be important for the study of AGN feeding within of galaxies, which can help to understand the relationship between the accretion process of balckholes and its surrounding materials.
In addition to the AGN activity, the nuclear star cluster in NGC 1042 has a young stellar population component with the age of and mass of . This implies an averaged star formation rate of in this component. The mass inflow rate we obtained above is at similar order of magnitude of this star formation rate, which means the inflowing gas is sufficient to feed the star formation in the nuclear star cluster and make it grow.
6 Summary
Using the IFS data from the VENGA survey, we have explored the feeding process of the LLAGN in late-type bulgeless galaxy NGC 1042. The large spatial coverage of the Mitchell spectrograph observation () enables us to map the emission of the ionized gas from several kpc down to several hundred pc in this galaxy. By studying the excitation and kinematic properties of the ionized gas using various emission-line properties, we directly identify the radial gas inflows in the central of the galaxy.
From the flux and flux ratio maps of emission lines (including [OII]3726,3729, [OIII]5007, H, H, [NII]6548,6583, and [SII]6717,6731), we find a cirumnuclear ring-like structure of ionized gas (which we call CRICS) in the central region. Using the spatically-resovled BPT diagnostics, we find that this structure presents the LINER-like emission. By comparing with the prediction of shock ionization models, we conclude that shocks are the dominant ionization source in this structure. This result is also supported by the disturbed kinematics of the ionized gas (distorted velocity field and enhance velocity dispersion) in this structure.
The harmonic decomposition modelling is used to analyse the velocity field of the ionized gas and quantify the possible non-circular motions driven by the gas flows. We do not find significant non-circular motions of the ionized gas at large radii of the disk. Strong non-circular motions of the ionized gas only exist within the central , especially at the CRIGS. On the near side we see redshifted velocities and on the NE quadrant of the far side we see blueshifted emission, indicating the ionized gas in the CRIGS is inflowing. Combining with the HST image of NGC 1042, we find that the CRIGS takes place at the end of the inner spiral arms. Since the inner spiral arms in NGC 1042 sharply curve towards the central region, which produce a bar-like structure, we propose that the inner spiral arms of NGC 1042 can produce a similar dynamical effect as a bar to drive the shocked ionized gas inflow.
We calculate the de-projected inflow velocity at and further estimate the mass inflow rate at . The mass inflow rate is about one hundred times the BH’s mass accretion rate () and at similar order of magnitude of the star formation rate in the nuclear star cluster (). It is large enough to feed both the nuclear activity and the star formation in the nuclear star cluster. The BH’s mass accretion rate is significantly less than the mass inflow rate, suggesting that only a small portion of these material may be transferred into the center to feed the blackhole. Although the exact feeding processes of the nuclear activity need to be further explored via the high-spatial-resolution observation within the central region, our study highlights that secular evolution can be important in late-type unbarred galaxies like NGC 1042.
Appendix A Harmonic Decomposition Modelling
Harmonic decomposition modelling (HDM) can decompose the line-of-sight (LOS) velocity field of a galaxy into a series of Fourier components which are considered as kinematic components with different azimuthal symmetry. By matching the kinematic symmetry of the observed velocity field, these components can be used to construct a model velocity field. This method has been used to study the stellar and gas kinematics in late-type galaxies (Binney, 1978; Begeman, 1987; Teuben, 1991; Franx et al., 1994; Schoenmakers et al., 1997; Wong et al., 2004), early-type galaxies (Krajnović et al., 2006; Emsellem et al., 2007; Krajnović et al., 2008, 2011, 2013) and high-z merging systems (Shapiro et al., 2008; Gonçalves et al., 2010; Swinbank et al., 2012; Alaghband-Zadeh et al., 2012; Bellocchi et al., 2012).
The Fourier components in the HDM are obtained in a set of elliptical annuli along the semi-major axis of a galaxy. The shapes of these elliptical annuli are described by their geometry parameters, including the positions of the centers, position angles (P.A.) and inclinations. For each elliptical annulus, the LOS velocity is fitted as
| (A1) |
where is the semi-major axis of the elliptical annuli, and is the eccentric anomaly angle. , and are the corresponding coefficients of different Fourier components. The zero-order term () is the systemic velocity of the galaxy. The first-order terms ( and ) describe the radial and rotational velocity components. The higher-order terms ( and , ) can provide information about the perturbations of gravitational potential (Schoenmakers et al., 1997; Wong et al., 2004).
In disk galaxies, we assume the gas locate on the galaxy plane and ignore their motions in the vertical direction. The LOS velocity along each elliptical annulus of a pure rotating disk can be described as: . In this case, the geometry parameters of elliptical annuli and the systemic velocity do not change with . The other Fourier components in Equation (1) describe the departures from circular rotation, which can be used to quantify different gas flows in disk galaxies.
Appendix B Determining Disk Parameters
In general, the kinematic center is consistent with the photometric center in galaxies (Trachternach et al., 2008; Haan et al., 2008; Neumayer et al., 2011; Andersen & Bershady, 2013). Considering the effective PSF FWHM of in our data cube, we assume the kinematic center and photometric center are in agreement and use the photometric center from SDSS DR8 (Aihara et al., 2011) as the center coordinates (, ) of NGC 1042. This parameter will be fixed in the subsequent analysis.
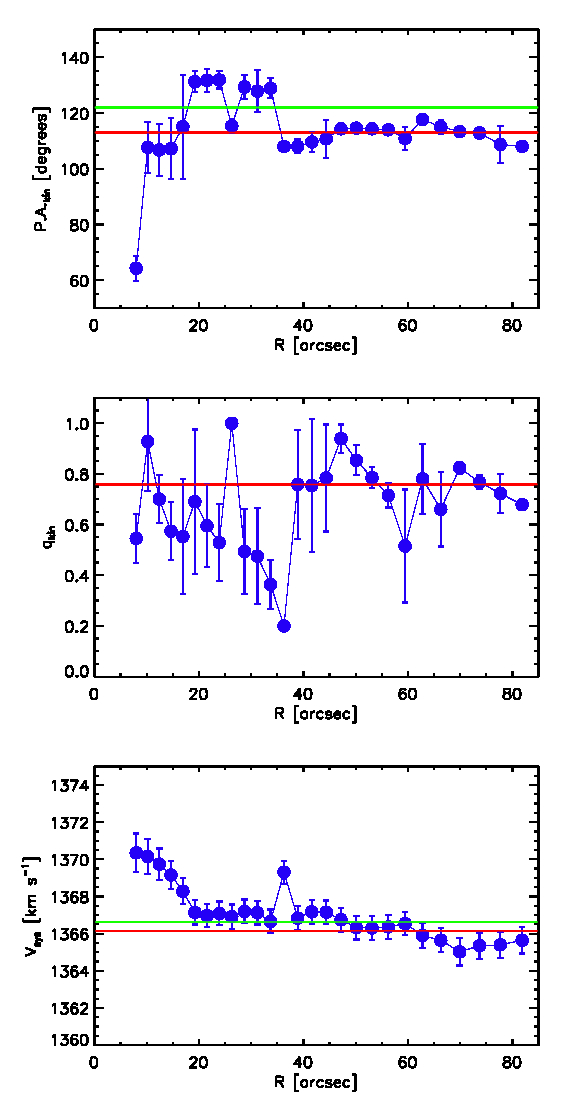
In order to determine the systemic velocity, position angle (P.A.) and inclination of NGC 1042, we first use Kinemetry (Krajnović et al., 2006) to quantify the observed velocity field of the ionized gas and present the radial profiles of these parameters. As shown in Figure 15, all parameters have significant variances within the inner , which could be caused by the kinematic twist due to gas flow in this region and the existence of the inner spiral arms. While in the outer , these parameters show a relatively flat profile and the kinematics also presents the signature of regular circular motion. Therefore, we determine the systemic velocity, P.A. and inclination of NGC 1042 to be the radial average of these parameters within . The obtained systemic velocity, kinematic P.A. and flattening are , and (corresponding to a kinematic inclination of ).
We also use IDL routine FIT_KINEMATIC_PA111http://www-astro. physics.ox.ac.uk/ mxc/software/ to measure the kinematic P.A. and systemic velocity, which can provide a double check on the values obtained above. In this code the symmetrization method (see Appendix C of Krajnović et al., 2006) are performed, which minimize the differences between observed velocity field and a bi-antisymmetric velocity field to obtain the kinematic P.A. and systemic velocity. The obtained kinematic P.A. and systemic velocity are and , respectively. While the systemic velocity is consistent with the value obtained from radial average, the kinematic P.A. has a difference of , which could be due to the kinematic twist in the inner region of NGC 1042. We prefer to adopt the kinematic P.A. obtained from the radial average at .
The disk parameters of NGC 1042 can also be measured from other observations. We compare these measurements with our kinematic results. Integrated HI and optical observations have provided several measurements of the systemic velocity of NGC 1042: (Koribalski et al., 2004), (Springob et al., 2005) and (compilation of Hyperleda222http://leda.univ-lyon1.fr/). These measurements are in agreement with the systemic velocity we derived here within the error range.
The photometric P.A. of NGC 1042 measured from SDSS r-band and 2MASS K-band images are (Adelman-McCarthy et al., 2008) and (Jarrett et al., 2003), which are in significant disagreement with the kinematic P.A. obtained above. The discrepancy between photometric and kinematic P.A. in many other galaxies has been observed in GHASP, (Epinat et al., 2008), SAURON (Krajnović et al., 2008), Atlas 3D (Krajnović et al., 2011) and CALIFA survey (García-Lorenzo et al., 2015). The photometric P.A. has large systematic uncertainties associated with its covariance with the inclination, and with possible photometric deviations from axisymetry in disks which can also be color dependent. Thus we prefer to adapt the kinematically derived position angle.
In terms of inclination, we use the photometric axis ratios to derive the photometric inclination of NGC 1042. By adopting the method of (Tully, 1988), we obtain for RC3 B-band measurement (de Vaucouleurs et al., 1991) and for 2MASS K-band photometry (Jarrett et al., 2003), respectively. All these inclination measurements are consistent with the obtained kinematic inclination.
The final disk parameters used in the kinematic analysis are: center position at , ; systemic velocity at ; P.A. at ; and inclination at .
| Parameters (Unit) | Value |
|---|---|
| (J2000.0)a | 02:40:24.0 |
| (J2000.0)a | -08:26:02 |
| TypeaaCoordinates, inclination (), position angle (), isophotal diameter (), and effective -band surface brightness () taken from RC3 (de Vaucouleurs et al. 1991) except when indicated. | SAB(rs)cd |
| aaCoordinates, inclination (), position angle (), isophotal diameter (), and effective -band surface brightness () taken from RC3 (de Vaucouleurs et al. 1991) except when indicated.(deg) | 40 |
| aaCoordinates, inclination (), position angle (), isophotal diameter (), and effective -band surface brightness () taken from RC3 (de Vaucouleurs et al. 1991) except when indicated.(deg) | 6eeFrom Paturel et al. (2000). |
| aaCoordinates, inclination (), position angle (), isophotal diameter (), and effective -band surface brightness () taken from RC3 (de Vaucouleurs et al. 1991) except when indicated.(arcmin) | |
| (Mpc) | |
| pc/” | 20 |
| ccFrom Jarrett et al. (2000). | |
| aaCoordinates, inclination (), position angle (), isophotal diameter (), and effective -band surface brightness () taken from RC3 (de Vaucouleurs et al. 1991) except when indicated. | 23.27 |
| NPddThe number of Mitchell spectrograph pointings covering the galaxy. | 2 |
| Pointing | Equatorial Coord. | Setup | Dither | Exposure Time | N | Seeing | Transparency |
|---|---|---|---|---|---|---|---|
| hours | ′′ | ||||||
| red | D1 | 2.00 | 4 | 2.20 | 0.87 | ||
| P1 | 2:40:26.28 -8:26:07.70 | red | D2 | 3.5 | 7 | 2.29 | 0.87 |
| red | D3 | 4 | 8 | 2.25 | 0.89 | ||
| blue | D1 | 0.83 | 2 | 2.00 | 0.71 | ||
| blue | D2 | 2.08 | 5 | 2.00 | 0.64 | ||
| blue | D3 | 1.67 | 4 | 2.00 | 0.73 | ||
| red | D1 | 2.06 | 6 | 2.20 | 0.65 | ||
| P2 | 2:40:21.34 -8:25:56.10 | red | D2 | 2.50 | 5 | 2.52 | 0.67 |
| red | D3 | 3.50 | 7 | 1.90 | 0.68 | ||
| blue | D1 | 2.08 | 5 | 2.58 | 0.68 | ||
| blue | D2 | 1.25 | 3 | 2.93 | 0.69 | ||
| blue | D3 | 1.25 | 3 | 1.63 | 0.65 |
| Transition | Wavelength | Median S/N | Fraction - | Fraction - |
|---|---|---|---|---|
| Å | ||||
| [OII]aaSince we cannot resolve the [OII]3727 and [NI]5200 doublets, we report the median S/N and fraction of the observed area in which the lines are significantly detected for the sum of the two doublet components. | 3726.03 | 9.7 | 0.84 | 0.94 |
| [OII]aaSince we cannot resolve the [OII]3727 and [NI]5200 doublets, we report the median S/N and fraction of the observed area in which the lines are significantly detected for the sum of the two doublet components. | 3728.73 | - | - | - |
| [NeIII] | 3868.69 | 1.4 | 0.02 | 0.07 |
| [NeIII] | 3967.40 | 0.5 | 0.01 | 0.01 |
| H8 | 3889.06 | 1.7 | 0.09 | 0.20 |
| H | 3970.08 | 1.7 | 0.08 | 0.18 |
| H | 4101.73 | 2.3 | 0.18 | 0.34 |
| H | 4340.47 | 5.3 | 0.52 | 0.77 |
| [OIII] | 4363.15 | 0.9 | 0.01 | 0.01 |
| HeII | 4685.74 | 0.6 | 0.01 | 0.01 |
| H | 4861.32 | 16 | 0.91 | 0.95 |
| [OIII] | 4958.83 | 2.8 | 0.23 | 0.42 |
| [OIII] | 5006.77 | 8.6 | 0.78 | 0.90 |
| [NI]aaSince we cannot resolve the [OII]3727 and [NI]5200 doublets, we report the median S/N and fraction of the observed area in which the lines are significantly detected for the sum of the two doublet components. | 5197.90 | 1.3 | 0.01 | 0.06 |
| [NI]aaSince we cannot resolve the [OII]3727 and [NI]5200 doublets, we report the median S/N and fraction of the observed area in which the lines are significantly detected for the sum of the two doublet components. | 5200.39 | - | - | - |
| [NII] | 6547.96 | 6.9 | 0.63 | 0.80 |
| H | 6562.80 | 38.9 | 0.98 | 0.99 |
| [NII] | 6583.34 | 21.2 | 0.94 | 0.97 |
| [SII] | 6716.31 | 13.3 | 0.93 | 0.96 |
| [SII] | 6730.68 | 9.2 | 0.83 | 0.94 |
References
- Adams et al. (2011) Adams, J. J., Blanc, G. A., Hill, G. J., et al. 2011, ApJS, 192, 5
- Adelman-McCarthy et al. (2008) Adelman-McCarthy, J. K., Agüeros, M. A., Allam, S. S., et al. 2008, ApJS, 175, 297
- Aihara et al. (2011) Aihara, H., Allende Prieto, C., An, D., et al. 2011, ApJS, 193, 29
- Alaghband-Zadeh et al. (2012) Alaghband-Zadeh, S., Chapman, S. C., Swinbank, A. M., et al. 2012, MNRAS, 424, 2232
- Andersen & Bershady (2013) Andersen, D. R. & Bershady, M. A. 2013, ApJ, 768, 41
- Arribas et al. (2014) Arribas, S., Colina, L., Bellocchi, E., Maiolino, R., & Villar-Martín, M. 2014, A&A, 568, A14
- Athanassoula (1992) Athanassoula, E. 1992, MNRAS, 259, 345
- Athanassoula (2008) Athanassoula, E. 2008, MNRAS, 390, L69
- Baldwin et al. (1981) Baldwin, J. A., Phillips, M. M., & Terlevich, R. 1981, PASP, 93, 5
- Barnes & Hernquist (1991) Barnes, J. E. & Hernquist, L. E. 1991, ApJ, 370, L65
- Begeman (1987) Begeman, K. G. 1987, PhD thesis, , Kapteyn Institute, (1987)
- Bellocchi et al. (2012) Bellocchi, E., Arribas, S., & Colina, L. 2012, A&A, 542, A54
- Binette (1985) Binette, L. 1985, A&A, 143, 334
- Binette et al. (1994) Binette, L., Magris, C. G., Stasińska, G., & Bruzual, A. G. 1994, A&A, 292, 13
- Binney (1978) Binney, J. 1978, MNRAS, 183, 779
- Blanc et al. (2009) Blanc, G. A., Heiderman, A., Gebhardt, K., Evans, II, N. J., & Adams, J. 2009, ApJ, 704, 842
- Blanc et al. (2015) Blanc, G. A., Kewley, L., Vogt, F. P. A., & Dopita, M. A. 2015, ApJ, 798, 99
- Blanc et al. (2013) Blanc, G. A., Weinzirl, T., Song, M., et al. 2013, AJ, 145, 138
- Bland-Hawthorn et al. (1991) Bland-Hawthorn, J., Sokolowski, J., & Cecil, G. 1991, ApJ, 375, 78
- Böker et al. (2002) Böker, T., Laine, S., van der Marel, R. P., et al. 2002, AJ, 123, 1389
- Böker et al. (2004) Böker, T., Sarzi, M., McLaughlin, D. E., et al. 2004, AJ, 127, 105
- Buta et al. (2005) Buta, R., Vasylyev, S., Salo, H., & Laurikainen, E. 2005, AJ, 130, 506
- Buta & Zhang (2009) Buta, R. J. & Zhang, X. 2009, ApJS, 182, 559
- Cappellari & Emsellem (2004) Cappellari, M. & Emsellem, E. 2004, PASP, 116, 138
- Cheung et al. (2015) Cheung, E., Trump, J. R., Athanassoula, E., et al. 2015, MNRAS, 447, 506
- Cid Fernandes et al. (2011) Cid Fernandes, R., Stasińska, G., Mateus, A., & Vale Asari, N. 2011, MNRAS, 413, 1687
- Cid Fernandes et al. (2010) Cid Fernandes, R., Stasińska, G., Schlickmann, M. S., et al. 2010, MNRAS, 403, 1036
- Cisternas et al. (2013) Cisternas, M., Gadotti, D. A., Knapen, J. H., et al. 2013, ApJ, 776, 50
- Cisternas et al. (2011) Cisternas, M., Jahnke, K., Inskip, K. J., et al. 2011, ApJ, 726, 57
- Cisternas et al. (2015) Cisternas, M., Sheth, K., Salvato, M., et al. 2015, ApJ, 802, 137
- Combes et al. (2014) Combes, F., García-Burillo, S., Casasola, V., et al. 2014, A&A, 565, A97
- Comerón et al. (2010) Comerón, S., Knapen, J. H., Beckman, J. E., et al. 2010, MNRAS, 402, 2462
- Comerón et al. (2014) Comerón, S., Salo, H., Laurikainen, E., et al. 2014, A&A, 562, A121
- Davies et al. (2014) Davies, R. I., Maciejewski, W., Hicks, E. K. S., et al. 2014, ApJ, 792, 101
- Davies et al. (2009) Davies, R. I., Maciejewski, W., Hicks, E. K. S., et al. 2009, ApJ, 702, 114
- de Vaucouleurs et al. (1991) de Vaucouleurs, G., de Vaucouleurs, A., Corwin, Jr., H. G., et al. 1991, Third Reference Catalogue of Bright Galaxies. Volume I: Explanations and references. Volume II: Data for galaxies between 0h and 12h. Volume III: Data for galaxies between 12h and 24h.
- Di Matteo et al. (2005) Di Matteo, T., Springel, V., & Hernquist, L. 2005, Nature, 433, 604
- Dong et al. (2012) Dong, X.-B., Ho, L. C., Yuan, W., et al. 2012, ApJ, 755, 167
- Dopita et al. (2012) Dopita, M. A., Payne, J. L., Filipović, M. D., & Pannuti, T. G. 2012, MNRAS, 427, 956
- Dopita & Sutherland (1995) Dopita, M. A. & Sutherland, R. S. 1995, ApJ, 455, 468
- Dopita & Sutherland (1996) Dopita, M. A. & Sutherland, R. S. 1996, ApJS, 102, 161
- Dopita & Sutherland (2003) Dopita, M. A. & Sutherland, R. S. 2003, Astrophysics of the diffuse universe
- Dumas et al. (2007) Dumas, G., Mundell, C. G., Emsellem, E., & Nagar, N. M. 2007, MNRAS, 379, 1249
- Elmegreen & Elmegreen (1987) Elmegreen, D. M. & Elmegreen, B. G. 1987, ApJ, 314, 3
- Emsellem et al. (2007) Emsellem, E., Cappellari, M., Krajnović, D., et al. 2007, MNRAS, 379, 401
- Epinat et al. (2008) Epinat, B., Amram, P., Marcelin, M., et al. 2008, MNRAS, 388, 500
- Falcón-Barroso et al. (2011) Falcón-Barroso, J., Sánchez-Blázquez, P., Vazdekis, A., et al. 2011, A&A, 532, A95
- Farage et al. (2010) Farage, C. L., McGregor, P. J., Dopita, M. A., & Bicknell, G. V. 2010, ApJ, 724, 267
- Fathi et al. (2013) Fathi, K., Lundgren, A. A., Kohno, K., et al. 2013, ApJ, 770, L27
- Fathi et al. (2006) Fathi, K., Storchi-Bergmann, T., Riffel, R. A., et al. 2006, ApJ, 641, L25
- Ferland & Netzer (1983) Ferland, G. J. & Netzer, H. 1983, ApJ, 264, 105
- Ferrarese et al. (2000) Ferrarese, L., Ford, H. C., Huchra, J., et al. 2000, ApJS, 128, 431
- Franx et al. (1994) Franx, M., van Gorkom, J. H., & de Zeeuw, T. 1994, ApJ, 436, 642
- Freedman et al. (2001) Freedman, W. L., Madore, B. F., Gibson, B. K., et al. 2001, ApJ, 553, 47
- Galloway et al. (2015) Galloway, M. A., Willett, K. W., Fortson, L. F., et al. 2015, MNRAS, 448, 3442
- Ganda et al. (2006) Ganda, K., Falcón-Barroso, J., Peletier, R. F., et al. 2006, MNRAS, 367, 46
- García-Burillo & Combes (2012) García-Burillo, S. & Combes, F. 2012, Journal of Physics Conference Series, 372, 012050
- García-Lorenzo et al. (2015) García-Lorenzo, B., Márquez, I., Barrera-Ballesteros, J. K., et al. 2015, A&A, 573, A59
- Gebhardt et al. (2000) Gebhardt, K., Bender, R., Bower, G., et al. 2000, ApJ, 539, L13
- Genzel et al. (2010) Genzel, R., Eisenhauer, F., & Gillessen, S. 2010, Reviews of Modern Physics, 82, 3121
- Gonçalves et al. (2010) Gonçalves, T. S., Basu-Zych, A., Overzier, R., et al. 2010, ApJ, 724, 1373
- Greene (2012) Greene, J. E. 2012, Nature Communications, 3, 1304
- Greene & Ho (2004) Greene, J. E. & Ho, L. C. 2004, ApJ, 610, 722
- Greene & Ho (2007) Greene, J. E. & Ho, L. C. 2007, ApJ, 670, 92
- Greene et al. (2010) Greene, J. E., Peng, C. Y., Kim, M., et al. 2010, ApJ, 721, 26
- Groves et al. (2004) Groves, B. A., Dopita, M. A., & Sutherland, R. S. 2004, ApJS, 153, 75
- Haan et al. (2008) Haan, S., Schinnerer, E., Mundell, C. G., García-Burillo, S., & Combes, F. 2008, AJ, 135, 232
- Haffner et al. (2009) Haffner, L. M., Dettmar, R.-J., Beckman, J. E., et al. 2009, Reviews of Modern Physics, 81, 969
- Haffner et al. (1999) Haffner, L. M., Reynolds, R. J., & Tufte, S. L. 1999, ApJ, 523, 223
- Halpern & Steiner (1983) Halpern, J. P. & Steiner, J. E. 1983, ApJ, 269, L37
- Hicks et al. (2013) Hicks, E. K. S., Davies, R. I., Maciejewski, W., et al. 2013, ApJ, 768, 107
- Hill et al. (2008) Hill, G. J., Gebhardt, K., Komatsu, E., et al. 2008, in Astronomical Society of the Pacific Conference Series, Vol. 399, Panoramic Views of Galaxy Formation and Evolution, ed. T. Kodama, T. Yamada, & K. Aoki, 115
- Ho et al. (2014) Ho, I.-T., Kewley, L. J., Dopita, M. A., et al. 2014, MNRAS, 444, 3894
- Ho (2008) Ho, L. C. 2008, ARA&A, 46, 475
- Ho (2009) Ho, L. C. 2009, ApJ, 699, 626
- Ho et al. (1993) Ho, L. C., Filippenko, A. V., & Sargent, W. L. W. 1993, ApJ, 417, 63
- Ho et al. (1997) Ho, L. C., Filippenko, A. V., & Sargent, W. L. W. 1997, ApJ, 487, 591
- Hoopes & Walterbos (2003) Hoopes, C. G. & Walterbos, R. A. M. 2003, ApJ, 586, 902
- Hopkins et al. (2006) Hopkins, P. F., Hernquist, L., Cox, T. J., et al. 2006, ApJS, 163, 1
- Hopkins et al. (2008) Hopkins, P. F., Hernquist, L., Cox, T. J., & Kereš, D. 2008, ApJS, 175, 356
- Hu (2008) Hu, J. 2008, MNRAS, 386, 2242
- Hunt & Malkan (1999) Hunt, L. K. & Malkan, M. A. 1999, ApJ, 516, 660
- Jarrett et al. (2003) Jarrett, T. H., Chester, T., Cutri, R., Schneider, S. E., & Huchra, J. P. 2003, AJ, 125, 525
- Jogee (2006) Jogee, S. 2006, in Lecture Notes in Physics, Berlin Springer Verlag, Vol. 693, Physics of Active Galactic Nuclei at all Scales, ed. D. Alloin, 143
- Jogee et al. (2005) Jogee, S., Scoville, N., & Kenney, J. D. P. 2005, ApJ, 630, 837
- Jogee et al. (2002) Jogee, S., Shlosman, I., Laine, S., et al. 2002, ApJ, 575, 156
- Karouzos et al. (2014) Karouzos, M., Jarvis, M. J., & Bonfield, D. 2014, MNRAS, 439, 861
- Kartaltepe et al. (2010) Kartaltepe, J. S., Sanders, D. B., Le Floc’h, E., et al. 2010, ApJ, 721, 98
- Kauffmann & Haehnelt (2000) Kauffmann, G. & Haehnelt, M. 2000, MNRAS, 311, 576
- Kauffmann et al. (2003) Kauffmann, G., Heckman, T. M., Tremonti, C., et al. 2003, MNRAS, 346, 1055
- Kehrig et al. (2012) Kehrig, C., Monreal-Ibero, A., Papaderos, P., et al. 2012, A&A, 540, A11
- Kewley et al. (2001) Kewley, L. J., Dopita, M. A., Sutherland, R. S., Heisler, C. A., & Trevena, J. 2001, ApJ, 556, 121
- Kewley et al. (2006) Kewley, L. J., Groves, B., Kauffmann, G., & Heckman, T. 2006, MNRAS, 372, 961
- Kocevski et al. (2012) Kocevski, D. D., Faber, S. M., Mozena, M., et al. 2012, ApJ, 744, 148
- Koribalski et al. (2004) Koribalski, B. S., Staveley-Smith, L., Kilborn, V. A., et al. 2004, AJ, 128, 16
- Kormendy et al. (2011) Kormendy, J., Bender, R., & Cornell, M. E. 2011, Nature, 469, 374
- Kormendy & Cornell (2004) Kormendy, J. & Cornell, M. E. 2004, in Astrophysics and Space Science Library, Vol. 319, Penetrating Bars Through Masks of Cosmic Dust, ed. D. L. Block, I. Puerari, K. C. Freeman, R. Groess, & E. K. Block, 261
- Kormendy & Ho (2013) Kormendy, J. & Ho, L. C. 2013, ARA&A, 51, 511
- Kormendy & Kennicutt (2004) Kormendy, J. & Kennicutt, Jr., R. C. 2004, ARA&A, 42, 603
- Koss et al. (2011) Koss, M., Mushotzky, R., Veilleux, S., et al. 2011, ApJ, 739, 57
- Krajnović et al. (2013) Krajnović, D., Alatalo, K., Blitz, L., et al. 2013, MNRAS, 432, 1768
- Krajnović et al. (2008) Krajnović, D., Bacon, R., Cappellari, M., et al. 2008, MNRAS, 390, 93
- Krajnović et al. (2006) Krajnović, D., Cappellari, M., de Zeeuw, P. T., & Copin, Y. 2006, MNRAS, 366, 787
- Krajnović et al. (2011) Krajnović, D., Emsellem, E., Cappellari, M., et al. 2011, MNRAS, 414, 2923
- Laine et al. (2002) Laine, S., Shlosman, I., Knapen, J. H., & Peletier, R. F. 2002, ApJ, 567, 97
- Laurikainen & Salo (2002) Laurikainen, E. & Salo, H. 2002, MNRAS, 337, 1118
- Laurikainen et al. (2004a) Laurikainen, E., Salo, H., & Buta, R. 2004a, ApJ, 607, 103
- Laurikainen et al. (2004b) Laurikainen, E., Salo, H., Buta, R., & Vasylyev, S. 2004b, MNRAS, 355, 1251
- Lee et al. (2012) Lee, G.-H., Park, C., Lee, M. G., & Choi, Y.-Y. 2012, ApJ, 745, 125
- Li et al. (2015) Li, Z., Shen, J., & Kim, W.-T. 2015, ApJ, 806, 150
- Li et al. (2011) Li, Z.-Y., Ho, L. C., Barth, A. J., & Peng, C. Y. 2011, ApJS, 197, 22
- Madsen et al. (2006) Madsen, G. J., Reynolds, R. J., & Haffner, L. M. 2006, ApJ, 652, 401
- Malkan et al. (1998) Malkan, M. A., Gorjian, V., & Tam, R. 1998, ApJS, 117, 25
- Marinova & Jogee (2007) Marinova, I. & Jogee, S. 2007, ApJ, 659, 1176
- Martini (2004) Martini, P. 2004, in IAU Symposium, Vol. 222, The Interplay Among Black Holes, Stars and ISM in Galactic Nuclei, ed. T. Storchi-Bergmann, L. C. Ho, & H. R. Schmitt, 235–241
- Martini et al. (2003) Martini, P., Regan, M. W., Mulchaey, J. S., & Pogge, R. W. 2003, ApJ, 589, 774
- Mathis (2000) Mathis, J. S. 2000, ApJ, 544, 347
- McConnell & Ma (2013) McConnell, N. J. & Ma, C.-P. 2013, ApJ, 764, 184
- McDonald et al. (2012) McDonald, M., Veilleux, S., & Rupke, D. S. N. 2012, ApJ, 746, 153
- Mihos & Hernquist (1996) Mihos, J. C. & Hernquist, L. 1996, ApJ, 464, 641
- Monreal-Ibero et al. (2006) Monreal-Ibero, A., Arribas, S., & Colina, L. 2006, ApJ, 637, 138
- Mulchaey & Regan (1997) Mulchaey, J. S. & Regan, M. W. 1997, ApJ, 482, L135
- Müller Sánchez et al. (2009) Müller Sánchez, F., Davies, R. I., Genzel, R., et al. 2009, ApJ, 691, 749
- Narayan (2005) Narayan, R. 2005, Ap&SS, 300, 177
- Negroponte & White (1983) Negroponte, J. & White, S. D. M. 1983, MNRAS, 205, 1009
- Nemmen et al. (2006) Nemmen, R. S., Storchi-Bergmann, T., Yuan, F., et al. 2006, ApJ, 643, 652
- Neumayer et al. (2011) Neumayer, N., Walcher, C. J., Andersen, D., et al. 2011, MNRAS, 413, 1875
- Oh et al. (2012) Oh, S., Oh, K., & Yi, S. K. 2012, ApJS, 198, 4
- Osterbrock & Ferland (2006) Osterbrock, D. E. & Ferland, G. J. 2006, Astrophysics of gaseous nebulae and active galactic nuclei
- Pei (1992) Pei, Y. C. 1992, ApJ, 395, 130
- Pequignot (1984) Pequignot, D. 1984, A&A, 131, 159
- Quinn et al. (1993) Quinn, P. J., Hernquist, L., & Fullagar, D. P. 1993, ApJ, 403, 74
- Reines et al. (2013) Reines, A. E., Greene, J. E., & Geha, M. 2013, ApJ, 775, 116
- Reynolds et al. (1999) Reynolds, R. J., Haffner, L. M., & Tufte, S. L. 1999, ApJ, 525, L21
- Rich et al. (2010) Rich, J. A., Dopita, M. A., Kewley, L. J., & Rupke, D. S. N. 2010, ApJ, 721, 505
- Rich et al. (2011) Rich, J. A., Kewley, L. J., & Dopita, M. A. 2011, ApJ, 734, 87
- Riffel & Storchi-Bergmann (2011) Riffel, R. A. & Storchi-Bergmann, T. 2011, MNRAS, 411, 469
- Riffel et al. (2013) Riffel, R. A., Storchi-Bergmann, T., & Winge, C. 2013, MNRAS, 430, 2249
- Riffel et al. (2008) Riffel, R. A., Storchi-Bergmann, T., Winge, C., et al. 2008, MNRAS, 385, 1129
- Rosario et al. (2012) Rosario, D. J., Santini, P., Lutz, D., et al. 2012, A&A, 545, A45
- Sánchez-Blázquez et al. (2006) Sánchez-Blázquez, P., Peletier, R. F., Jiménez-Vicente, J., et al. 2006, MNRAS, 371, 703
- Sanders et al. (1988) Sanders, D. B., Soifer, B. T., Elias, J. H., et al. 1988, ApJ, 325, 74
- Sani et al. (2011) Sani, E., Marconi, A., Hunt, L. K., & Risaliti, G. 2011, MNRAS, 413, 1479
- Sarzi et al. (2006) Sarzi, M., Falcón-Barroso, J., Davies, R. L., et al. 2006, MNRAS, 366, 1151
- Sarzi et al. (2010) Sarzi, M., Shields, J. C., Schawinski, K., et al. 2010, MNRAS, 402, 2187
- Scalo & Elmegreen (2004) Scalo, J. & Elmegreen, B. G. 2004, ARA&A, 42, 275
- Schawinski et al. (2012) Schawinski, K., Simmons, B. D., Urry, C. M., Treister, E., & Glikman, E. 2012, MNRAS, 425, L61
- Schawinski et al. (2011) Schawinski, K., Treister, E., Urry, C. M., et al. 2011, ApJ, 727, L31
- Schawinski et al. (2010) Schawinski, K., Urry, C. M., Virani, S., et al. 2010, ApJ, 711, 284
- Schlegel et al. (1998) Schlegel, D. J., Finkbeiner, D. P., & Davis, M. 1998, ApJ, 500, 525
- Schnorr-Müller et al. (2014) Schnorr-Müller, A., Storchi-Bergmann, T., Nagar, N. M., & Ferrari, F. 2014, MNRAS, 438, 3322
- Schnorr Müller et al. (2011) Schnorr Müller, A., Storchi-Bergmann, T., Riffel, R. A., et al. 2011, MNRAS, 413, 149
- Schoenmakers et al. (1997) Schoenmakers, R. H. M., Franx, M., & de Zeeuw, P. T. 1997, MNRAS, 292, 349
- Schönell et al. (2014) Schönell, A. J., Riffel, R. A., Storchi-Bergmann, T., & Winge, C. 2014, MNRAS, 445, 414
- Sellwood (2014) Sellwood, J. A. 2014, Reviews of Modern Physics, 86, 1
- Shapiro et al. (2008) Shapiro, K. L., Genzel, R., Förster Schreiber, N. M., et al. 2008, ApJ, 682, 231
- Sharp & Bland-Hawthorn (2010) Sharp, R. G. & Bland-Hawthorn, J. 2010, ApJ, 711, 818
- Shields et al. (2008) Shields, J. C., Walcher, C. J., Böker, T., et al. 2008, ApJ, 682, 104
- Shlosman et al. (1990) Shlosman, I., Begelman, M. C., & Frank, J. 1990, Nature, 345, 679
- Shlosman et al. (1989) Shlosman, I., Frank, J., & Begelman, M. C. 1989, Nature, 338, 45
- Shlosman et al. (2000) Shlosman, I., Peletier, R. F., & Knapen, J. H. 2000, ApJ, 535, L83
- Simões Lopes et al. (2007) Simões Lopes, R. D., Storchi-Bergmann, T., de Fátima Saraiva, M., & Martini, P. 2007, ApJ, 655, 718
- Simmons et al. (2013) Simmons, B. D., Lintott, C., Schawinski, K., et al. 2013, MNRAS, 429, 2199
- Simmons et al. (2012) Simmons, B. D., Urry, C. M., Schawinski, K., Cardamone, C., & Glikman, E. 2012, ApJ, 761, 75
- Singh et al. (2013) Singh, R., van de Ven, G., Jahnke, K., et al. 2013, A&A, 558, A43
- Springob et al. (2005) Springob, C. M., Haynes, M. P., Giovanelli, R., & Kent, B. R. 2005, ApJS, 160, 149
- Stasińska et al. (2008) Stasińska, G., Vale Asari, N., Cid Fernandes, R., et al. 2008, MNRAS, 391, L29
- Storchi-Bergmann et al. (2007) Storchi-Bergmann, T., Dors, Jr., O. L., Riffel, R. A., et al. 2007, ApJ, 670, 959
- Sutherland & Dopita (1993) Sutherland, R. S. & Dopita, M. A. 1993, ApJS, 88, 253
- Swinbank et al. (2012) Swinbank, A. M., Sobral, D., Smail, I., et al. 2012, MNRAS, 426, 935
- Teuben (1991) Teuben, P. J. 1991, in Warped Disks and Inclined Rings around Galaxies, ed. S. Casertano, P. D. Sackett, & F. H. Briggs, 40
- Theureau et al. (2007) Theureau, G., Hanski, M. O., Coudreau, N., Hallet, N., & Martin, J.-M. 2007, A&A, 465, 71
- Trachternach et al. (2008) Trachternach, C., de Blok, W. J. G., Walter, F., Brinks, E., & Kennicutt, Jr., R. C. 2008, AJ, 136, 2720
- Treister et al. (2012) Treister, E., Schawinski, K., Urry, C. M., & Simmons, B. D. 2012, ApJ, 758, L39
- Tremaine et al. (2002) Tremaine, S., Gebhardt, K., Bender, R., et al. 2002, ApJ, 574, 740
- Tully (1988) Tully, R. B. 1988, Nearby galaxies catalog
- Tully & Pierce (2000) Tully, R. B. & Pierce, M. J. 2000, ApJ, 533, 744
- Tully et al. (2008) Tully, R. B., Shaya, E. J., Karachentsev, I. D., et al. 2008, ApJ, 676, 184
- Tully et al. (1992) Tully, R. B., Shaya, E. J., & Pierce, M. J. 1992, ApJS, 80, 479
- van de Ven & Fathi (2010) van de Ven, G. & Fathi, K. 2010, ApJ, 723, 767
- van Winckel (2003) van Winckel, H. 2003, ARA&A, 41, 391
- Veilleux & Osterbrock (1987) Veilleux, S. & Osterbrock, D. E. 1987, ApJS, 63, 295
- Veilleux et al. (2003) Veilleux, S., Shopbell, P. L., Rupke, D. S., Bland-Hawthorn, J., & Cecil, G. 2003, AJ, 126, 2185
- Villforth et al. (2014) Villforth, C., Hamann, F., Rosario, D. J., et al. 2014, MNRAS, 439, 3342
- Voges & Walterbos (2006) Voges, E. S. & Walterbos, R. A. M. 2006, ApJ, 644, L29
- Walcher et al. (2006) Walcher, C. J., Böker, T., Charlot, S., et al. 2006, ApJ, 649, 692
- Walcher et al. (2005) Walcher, C. J., van der Marel, R. P., McLaughlin, D., et al. 2005, ApJ, 618, 237
- Weinzirl et al. (2011) Weinzirl, T., Jogee, S., Conselice, C. J., et al. 2011, ApJ, 743, 87
- Weinzirl et al. (2009) Weinzirl, T., Jogee, S., Khochfar, S., Burkert, A., & Kormendy, J. 2009, ApJ, 696, 411
- Wong et al. (2004) Wong, T., Blitz, L., & Bosma, A. 2004, ApJ, 605, 183
- Yan & Blanton (2012) Yan, R. & Blanton, M. R. 2012, ApJ, 747, 61
- Yuan (2007) Yuan, F. 2007, in Astronomical Society of the Pacific Conference Series, Vol. 373, The Central Engine of Active Galactic Nuclei, ed. L. C. Ho & J.-W. Wang, 95