GR 290 (Romano’s Star): 2. Light history and evolutionary state
Abstract
We have investigated the past light history of the luminous variable star GR 290 (M33/V532, Romano’s Star) in the M 33 galaxy, and collected new spectrophotometric observations in order to analyse links between this object, the LBV category and the Wolf-Rayet stars of the nitrogen sequence. We have built the historical light curve of GR 290 back to 1901, from old observations of the star found in several archival plates of M 33. These old recordings together with published and new data on the star allowed us to infer that for at least half a century the star was in a low luminosity state, with 18-19, most probably without brighter luminosity phases. After 1960, five large variability cycles of visual luminosity were recorded. The amplitude of the oscillations was seen increasing towards the 1992-1994 maximum, then decreasing during the last maxima. The recent light curve indicates that the photometric variations have been quite similar in all the bands, and that the color index has been constant within 0.1m despite the 1.5m change of the visual luminosity. The spectrum of GR 290 at the large maximum of 1992-94, was equivalent to late-B type, while, during 2002-2014, it has varied between WN10h-11h near the visual maxima to WN8h-9h at the luminosity minima. We have detected, during this same period, a clear anti-correlation between the visual luminosity, the strength of the He II 4686 Å emission line, the strength of the 4600-4700 Å lines blend and the spectral type. From a model analysis of the spectra collected during the whole 2002-2014 period we find that the Rosseland radius , changed between the minimum and maximum luminosity phases by a factor of 3, while varied between about 33,000 K and 23,000 K. We confirm that the bolometric luminosity of the star has not been constant, but has increased by a factor of 1.5 between minimum and maximum luminosity, in phase with the apparent luminosity variations. Presently, GR 290 falls in the H-R diagram close to WN8h stars, being probably younger than them. In the light of current evolutionary models of very massive stars, we find that GR 290 has evolved from a 60 progenitor star and should have an age of about 4 million years. From its physical charcteristics, we argue that GR 290 has left the LBV stage and presently is moving from the LBV stage to a Wolf-Rayet stage of a late nitrogen spectral type.
1 Introduction
GR 290, also known as Romano’s star or M33/V532, in M 33 galaxy was discovered as a variable star in 1978 by Romano (1978a), who later described its ample variation as similar to that of Hubble-Sandage variables (Romano, 1978b).
Extensive studies of GR 290 were performed in the last years, see for example Polcaro et al. (2011), hereafter Paper 1, Sholukhova et al. (2011), Clark et al. (2012) and references therein. In Paper 1 we have investigated the spectral and photometric variations of GR 290 during the 2003–2010 period and have underlined many important features of the star, namely the spectral type being constantly hotter than for other LBV, and the anti-correlation between the visual luminosity and the excitation of the emission lines. In spite of the many studies on GR 290, several questions remain unresolved, for example: the light curve so far measured seems peculiar with respect to the well photometrically studied LBVs. Furthermore, the hot spectrum of GR 290 is unusual for an LBV and be an indication of the star leaving (or having already left) the LBV stage (cf. Paper 1, Humphreys et al. (2014) ). Recently, a new light minimum, still ongoing at the time of writing, has been reported by Calabresi et al. (2014). This has stimulated us to investigate the nature of this star in more depth.
The aim of this paper is to use the light and spectral variations to trace the past evolution of GR 290, define its present stage and possible predict its future behavior. Following the introduction, the second section will tackle the historical and recent light curve. The third section will be devoted to the spectral variations of the star, while the fourth section will discuss with its evolutionary phase.
2 The light curve
The earliest, targetted observations of GR 290 as performed by Romano (1978b) covered the period 1960-1977. New observations for the period 1982-1999 were published by Kurtev et al. (2001), while a very extended list of observations collected at the Crimea Observatory (since 1961) and the Special Astrophysical Observatory (SAO, since 2001) were reported by Sholukhova et al. (2011). These observations, together with those published in Paper 1 allow us to analyse only the recent ”active phase” of the star. Since nothing is known about the behavior of GR 290 before 1960, we have searched for available old plates of the M 33 galaxy containing our target.
2.1 Historical plates
We have found many digitised images of historical plates obtained by several observatories before 1940.
Nine useful plates of M 33 can be found in the Hamburg Observatory archive, taken with the 1 m F/3 Newtonian telescope The digitized images are available on-line in fits format 111http://plate-archive.hs.uni-hamburg.de/index.php/en/.
We have found also a good number of useful plates taken with the 72 cm F/3.9 reflector between 1907 and 1922
in the Heidelberg on-line archive 222http://dc.zah.uni-heidelberg.de/lswscans/res/positions/fullplates/form.
Other plates, found in the Pulkovo Photographic Plate Database 333http://www.puldb.ru/db/plates/index.php
(Kiseleva & Khrutskaya, 2007) were obtained between 1935 and 1938 with the the 33cm F/11 Normal astrograph of the observatory.
Several plates have also been found in the Yerkes Observatory plate archive, most of them obtained with the
Yerkes old 24-inch (60-cm) F/3.87 reflector, exposed between 1901 and 1952.
Further historic photometric points could be obtained from the POSS plates available on-line, and from some Asiago
plates not used by G. Romano in his original paper.
The blue plate of the POSS-I survey is not available on line, thus we only measured the red plate: GR 290 in this plate is rather faint, outside the range of our photometric sequence, so its magnitude is extrapolated and must be considered rather uncertain. In this case, we included in the comparison sequence the star M31a-314 (R=17.83) to extend the calibration range. In all Hamburg plates GR 290 is clearly visible except in S02396, although it is generally close to the plate magnitude limit. The bright flux measured in the S02436 plate is uncertain due to the strong coma and the noisy appearance of the emulsion: it would indicate a variation of half magnitude in three months, which however is not unusual for this source as also shown below. In several Heidelberg and Yerkes plates the star is not visible, hence only upper limits could be derived. In all the plates the star was substantially fainter than the values reported by Romano (1978b) for the years 1960-62, but is consistent with the magnitude measured during the recent minima.
All the technical details concerning the data reduction of the archival images are reported in Appendix A. Table 1 lists all the archival magnitudes as derived from our photometric procedure.
All the old photometric observations are reported in the upper panel of Figure 1, where we also give the more recent B-filter observations. Some upper limits, that better define the star light curve, have also been shown.
2.2 New photometry
Since December 2010 new photometric observations in the B, V and R bands were collected in Italy with the 1.52 m Cassini telescope at the Loiano Station of the Bologna Astronomical Observatory-INAF, with the 37 cm telescope of Frasso Sabino of the Associazione Romana Astrofili (ARA), and with the 30 cm telescope of Franco Montagni at Greve. We also observed GR 290 with the 80 cm Tenerife telescope of the Instituto Astrofisico de Canarias (IAC) in October 2012 and October 2013. We made also use of data collected with the 61 cm robotic telescope of the Sierra Stars Observatory Network in Mount Lemmon (Arizona). Table 2 reports our new photometric observations, including two U band values recorded at the Loiano Observatory on November 14 and December 11, 2015. These new B, V, R observations collected since 2010 are shown, together with the old ones, in the lower panel of Figure 1.
2.3 Discussion of the light curve of GR 290
As can be seen in Figure 1, the historical light curve of GR 290 covers a period of more than one century, including a long period of low apparent brightness at 17.5 B 18.5 (0.2 mag) during the first half of the 20th Century (), followed by a sequence of transitions between low and high visual luminosity (). According to Figure 1 one can identify at least five broad light maxima (before 1974, 1983, 1992-94, 2004 and 2010) occurred since 1960, and five light minima (in 1975-79, 1983-86, 2000-2002, 2007-2009 and 2013 to present). In particular, the recorded maxima are characterised by different peak luminosities: the first three maxima increased their peak luminosity, which culminated with the 1992-94 maximum, while the last two occurred with a decreasing peak luminosity. Also the last three light minima were of decreasing luminosity. Hence, the photometric trend following the largest 1992-94 maximum might suggest that the star is gradually recovering a probably new stationary state through a sequence of oscillations with decreasing apparent brightness. As discussed below, this trend is also marked by the spectroscopic variations of the star. In addition, the light curve shows irregular photometric variations on time scales of weeks to months. For instance, one can see in the lower panel of Figure 1 that between October 1994 and December 1995 GR 290 was subject to a short event during which its luminosity dropped by at least one magnitude with fairly rapid luminosity decrease and increase. No light oscillation of such amplitude has been detected in the recent light curve.
It is generally observed that, during the S Dor phase, the color of LBVs is bluer at the light minimum than near the light maximum. In Paper 1 we show that the light curves in the B, V and R bands nearly overlap without a clear luminosity variation (see also Figure 1 in Paper 1). Having now at our disposal a conspicuous amount of multicolor photometric observations covering an ample time interval, we have plotted in Figure 2 the color index versus visual magnitude between February 2003 and December 2014.
The variations in are well within the error bars, with a mean value of about -0.06 mag, and there is no clear evidence for a variation of as a function of the visual magnitude. The different behavior of the color with the stellar magnitude given by Sholukhova et al. (2011) has to be attributed to the larger uncertainty of their photometry. We conclude that, within the errors, the color index of GR 290 has been basically constant during the last cycles, suggesting that the blue-visual slope of the spectrum has remained substantially unchanged in spite of the ample spectral and brightness variation. This behavior, different from what is generally expected for the S Dor variations of LBVs, can be attributed to the continuum opacity which, at the high temperatures of the star, is all the time dominated by electron scattering. In fact, in agreement with the observed and theoretical continuum energy distribution of WN stars (Morris et al., 1993), we also expect the slope of the blue-visual continuum of GR 290 to be nearly independent of Teff during its recent WN-phase. Through the end of 2015 we measured two additional U-band magnitudes: U=17.98 0.08 (November 14) and 17.78 0.1 (December 11). The corresponding color index is the same within the errors as that we obtained in December 2004 (Viotti et al., 2006) when we derived =16.22 and =17.09. The fact that in spite of the large luminosity difference between the two epochs, the blue-ultraviolet color index did not significantly change further supports to the above conclusion.
3 The spectrum of GR 290
The first recorded spectrum of GR 290 was taken by Thomas Szeifert at Calar Alto on October 15, 1992, when the star was near its absolute luminosity maximum with =16.5. According to the analysis of Szeifert (1996), this early spectrum is most likely to be of late-B spectral type. However, the next spectrum (1994), obtained in the 5500-7600 Å range at the SAO Russian 6 m telescope, when the star was still in its photometric maximum, led Sholukhova et al. (1997) to suggest that Romano’s star could have been a WN, because of the very broad He I 6678 A line. After the 1992-1994 maximum, GR 290 started to become fainter and hotter. In September 1998, when the magnitude had already faded to about =17.5, the spectrum of GR 290 displayed weak [N II] emissions and strong He I lines with P Cygni profiles consistent with a WN10-WN11 spectral type (Fabrika et al., 2005).
The following spectral evolution until 2010 was described in details by Viotti et al. (2007), Polcaro et al. (2011), Sholukhova et al. (2011), Maryeva & Abolmasov (2010) and Humphreys et al. (2014). As illustrated in the lower panel of Figure 1, the spectrum of GR 290 was WN9h-WN10h during the 2000-2003 minimum, then became WN11h at the following 2004 maximum. A new hot (WN8h-WN9h) phase was recorded at the 2007 minimum. The subsequent apparent luminosity increase in 2010 was marked only by a slightly cooler spectrum (WN9h-WN10h), while a new hot (WN8h-WN9h) phase took place during the last minimum phase that is still on-going.
New observations were obtained since 2010 with the BFOSC camera mounted on the 1.52 m Loiano telescope and with the SCORPIO camera available with the SAO Russian 6-m telescope 444We used both public data from the SAO RAS archive (http://www.sao.ru/oasis/cgi-bin/fetch) and the data acquired by O. Maryeva during dedicated observations..
In Figure 3 we present a selection of the spectra acquired since 2010 in the range 4500-4800 Å, which contains the most diagnostic lines for spectral typing. In Table 3 we report the spectral types together with the corresponding V magnitudes and the equivalent widths of some H and He lines.
The spectral evolution of the star during the last years is mainly described by the changes in the equivalent width of helium lines and of the broad blend of emission lines around 4650 Å (the so called f-feature). Neutral and ionised helium lines have an opposite behavior. The hydrogen Balmer lines, H and H are irregularly variable, but their variations seem not to follow the light curve, except for a probable gradual weakening in the last years. In particular, during the 2003-2014 period the H/H equivalent width ratio did not significantly vary around a mean value of 4.2. Figure 4 illustrates the time evolution of the hydrogen emission lines top panel) and the ratio H/H (lower panel) during the 2002-2015 period. The lower panel shows also the equivalent width ratio (He II 4686)/(He I 5876) which is smaller when the stellar apparent luminosity is higher. Furthermore, the apparently dumped EW oscillation of both the He II 4686 Å line and the 4686/5876 ratio might suggest a trend of increasing temperature.
The He II 4686 Å and He I 5876 Å lines have been used by Crowther & Smith (1997) to distinguish stars with different spectral types. Polcaro et al. (2011) used the equivalent widths diagrams EW(5876) vs EW(4686) to mark the path of GR 290 through the WN sub-classes during its recent luminosity variations. Since January 2010 the star has moved in the Crowther & Smith diagram towards the WN8 locus and from December 2013 to December 2015 its representative point is well inside the WN8 locus, as it was at the beginning of 2008 during the previous minimum (see Figure 5).
The growing excitation temperature of WR stars from late to earlier subtypes is best described by the intensity of the emission lines between 4600 and 4700 Å. The blend forming the f-feature as well as the He II 4686 Å emission become prominent when the star is fainter as was ascertained by Polcaro et al. (2011) and shown in Figure 3. In order to study quantitatively this behavior, we have measured the equivalent width of the emission in the 4600-4700 Å range avoiding the lower excitation He I 4713 Å line which is too strong in the later WN spectral types. In Figure 6 we plot the EW (in logarithm) of both the He II 4686 Å line and the 4600-4700 Å blend as a function of the magnitude. The 4600-4700 Å blend presents a marked linear correlation with the V magnitude in an ample luminosity range with a mean slope of 0.544 0.027. We remark that this correlation does not vary, within the errors, during three different optical variability cycles. For the HeII line the linearity fails when the star is bright, possibly because of the large uncertainty on the lowest equivalent widths.
4 Physical parameters of GR 290
Maryeva & Abolmasov (2012a) and Clark et al. (2012), using the cmfgen atmospheric modeling code (Hillier & Miller, 1998) have derived the physical parameters of GR 290 using spectra taken in February 2005 (V=17.2) and October 2007-January 2008(V=18.6), and in September 2010 (V=17.9). Presently, we have at our disposal many spectra of the star collected mainly at the Loiano Observatory and at the Special Astrophysical Observatory covering the period of October 2002 – December 2014 when the star displayed an ample range of variation in visual luminosity. This time interval covers two light maxima and three minima. In order to see how the parameters of GR 290 changed with time we have modelled the most representative spectra with best quality, obtained during this period.
We have applied the same procedure as Maryeva & Abolmasov (2012a) and have constructed nine models. Details on the procedure may be found in Maryeva & Abolmasov (2012a) and are not repeated here except where necessary.
Every model is defined by a hydrostatic stellar radius R∗, luminosity L∗, mass-loss rate , filling factor , wind terminal velocity , stellar mass M∗ and by the abundances Zi of the element species.
We started modelling by fitting the spectra obtained in January 2005 during a phase of maximum brightness and in December 2008. These spectra are most suitable as having the widest spectral range and the best resolution among our spectra. Then for every spectrum we have calculated few models giving a similar fit with slightly different mass loss rate, velocity, temperature, radius, filling factor. The uncertainties reported below include the range of parameters of the models. We assumed that element abundances do not change with changing phases. Thus we used the abundances derived for the December 2008 spectrum for fitting all the remaining data.
Various attempts to derive the H/He abundance ratio gave a large range of possible values from 1.5 to 1.9; differences between the models are not evident unless all the others parameters are fixed. Ultimately we decided to assign a value of 1.7 to the H/He ratio. We estimated the abundances of carbon (N(C)/N(He) = ) and nitrogen (N(N)/N(He) =) by fitting the WR blue bump of the blend at 4630-4713 Å. The determination of the oxygen fraction is a more difficult task since there are no oxygen emission lines in the spectrum of GR 290. We, however, noticed that the intensity of the He II lines decreases when we include oxygen in our model. Thus we estimated the oxygen abundance indirectly by fitting the He II lines and obtained N(O)/N(He) = . For the abundances of Ar, S and Ne we used those of M 33 from Magrini et al. (2010). For the abundances of other elements (Mg, Al, Si, Ca and Fe) we assumed a value of half solar as the metallicity of M 33 is low. We compared several models and concluded that the abundances of these elements do not affect model spectra significantly.
cmfgen allows to build the models with different velocity laws describing the radial dependence of the wind velocity. Often the same spectrum may be equally well described by either simple law or more complex double- profile, yielding different values of luminosity and temperature. In this work our main task is to track the changes of stellar parameters over time. Due to the lack of theoretical works on this topic, it is difficult to say now which velocity profile is more physically justified; this is a question we leave for a separate publication. Here we found sufficient to use the same simple wind velocity law with for all models. Due to fact that the profiles of spectral lines are very sensitive to the value of the terminal velocity, we can estimate using even low resolution spectra. At minimum brightness we used the P Cyg profiles of the He I triplet lines (such as 3889 Å, 4025 Å, 4471 Åand 6678 Å) and derived V∞ = 400 km. At maximum brightness we used the emission lines fits and found V∞ = 200-250 km. Thus V∞ changes from the hot phase to the cool phase, and this changing is real. Indeed, if at maximum brightness the velocity were equal to 400 km, then we would have detected P Cyg profiles even in our low resolution spectra. However P Cyg profiles are not observed at maximum brightness in the spectrum obtained in January 2005 with spectral resolution Å.
For measuring with cmfgen we compared the intensities of different ion lines (HeI,II; CIII,IV; NII,III; SiIII,IV), i.e we used the traditional ionization-balance method. For the C ionization structure, we used the C III 4647-50 Å diagnostic lines. For the N: N II 4601-07-30-43 Å, N III 4510-15-18-24-31-35-47 Å, N III 4634-40 Å. The Si ionization structure was constrained through the relative strength of Si III, and Si IV lines, using lines of Si III 4553-4568-4575 Å and Si IV 4088-4116 Å. By cross-checking all these indicators we estimated an uncertainty of 1.000 K.
To estimate the luminosity of the object, hence the stellar radius, the magnitudes of the star were calculated in the and filters from the model spectra and compared with observations. The model is determined by the temperature, which was estimated as described above; this model color is then compared with the observed from which comparison the reddening is determined.
Result is that the model is consistent with observed B-V only if E0.08, assuming for M 33 a distance of D=84760 kpc (Galleti et al., 2004).
Actually the Galaxy foreground extinction is (according to the NED extinction calculator, Schlegel et al. 1998) and the intrinsic extinction in M 33 is negligible according to the detailed dust maps by Hippelein et al. (2003).
Furthermore E have also been computed for four close stars whose magnitudes and spectral types are given in Massey et al. (2006). The closest star, a B0.5Ib, has E(B-V)=0.06, nearly the same as found for GR290.
Finally we have computed models with extinction up to E = 0.15, as assumed by Humphreys et al. (2014). Of course higher extinction would imply a significant increase of the luminosity. However, in all the minimum phases GR290 would lie still outside the instability strip of LBV stars.
The mass-loss rate was obtained by reproducing the intensities of the strongest lines – namely, those of hydrogen, helium, and nitrogen.
The parameters of GR 290 were also obtained by Maryeva & Abolmasov (2012a) during the maximum brightness in 2004-2005. For this goal these authors used a spectrum obtained in February 2005 at the Russian 6-m telescope with spectrograph SCORPIO with spectral resolution Å. To reproduce that spectrum a volume-filling factor =0.5 was necessary. Clark et al. (2012) modeled the spectrum of Romano’s star obtained in September 2010 when the -band magnitude of the object was between 17.75 and 17.85. They also used the cmfgen code; the best fit was obtained with =0.25. Since in the current work we used the spectrum obtained in January 2005 with better resolution ( Å), we tried to fit the observed spectra with several values of the filling factor. We found that already models with =0.1 well describe all spectra; =0.2 equally gives good results. The other parameters change very little with respect to the first case, the main difference, being in Teff, is always within the errors. Models with =0.3 give a worse fit for every other parameters. From the comparison of observed with model spectra it is not clear which value of is more correct. We assumed as final value =0.15.
Table 4 lists all spectroscopic observations of GR 290 used to construct the models. Details on the instrumental characteristics are described in Paper 1 and in Maryeva & Abolmasov (2012a). The observed spectra and the models themselves are shown in Figure 7. Table 5 lists the parameters of these models.
The accuracy on the derived estimates of luminosity and radius depends on several parameters, including the uncertainty on the distance and on the interstellar extinction. However, since the main scope of our work is to estimate the amplitude of the variation of the parameters and its accuracy, in Table 5 we only give the errors derived from the fitting procedure. It is worth noting that at maximum brightness HeII and NIII lines are absent (or very weak), thus our estimations give effective temperature in the range 20-23 kK . This range of values of leads to a large scatter in the luminosities, which at maximum brightness results in the range .
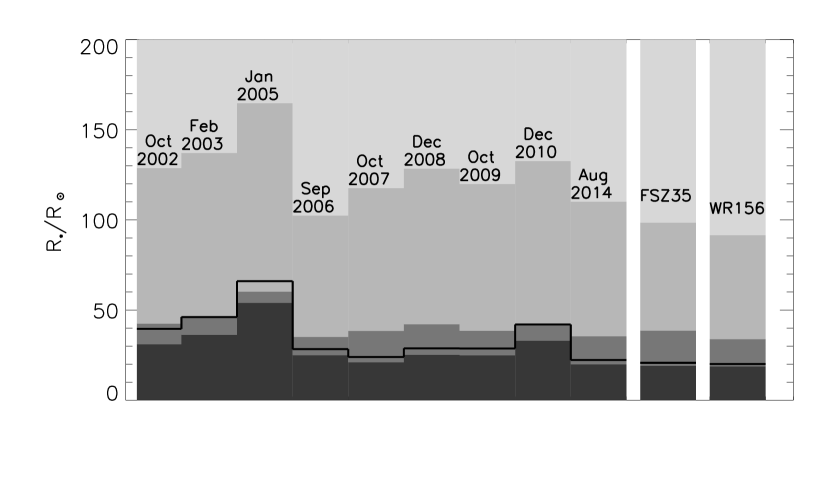
We can see from Table 5 that the radius , where the Rosseland optical depth is equal to 2/3, is as low as 22-26 near the minima and increases up to 63 during the 2005 maximum. On the other hand, the temperature at decreases from 31-33 kK (with WN8-9h spectral type) to 25 kK (WN11h). The nature of the stellar wind significantly changes, being much denser and slower during the eruption in 2005. Figure 8 illustrates the structure of the wind-filled envelope of GR 290 during different luminosity phases. Note that the surface moves deeper in the wind during the minima. For comparison Figure 8 shows the structure of the wind of two WN8h stars: FSZ35 (Maryeva & Abolmasov, 2012b) and WR156 (Maryeva et al., 2013), belonging to M 33 and our Galaxy, respectively. It is clear that the wind structure of GR 290 during the minimum of brightness is fairly similar to the one of typical WN8h (non variable) stars.
Our estimates are consistent with those by Clark et al. (2012) within the errors, with the exception for the luminosity. It must be noted that Clark et al. (2012) assumed a distance to M 33 of 964 kpc, while we adopted a distance of 847 kpc. Due to this difference in the assumed distances, we cannot directly compare the model luminosities, as the luminosity influences both the apparent magnitude of the star and the mass loss rate, which is crucial for all other parameters.
The main result of this analysis is that the bolometric luminosity of GR 290 is variable, being higher during the phases of greater optical brightness. Previously, Polcaro et al. (2011) found a significant decrease in the bolometric luminosity between the 2005 maximum and the 2008 minimum. Later, Maryeva & Abolmasov (2012a) gave further proofs that the bolometric luminosity of GR 290 has really decreased by about 40%. The present model fitting of a large sample of spectra obtained during two successive luminosity cycles definitely confirm their result and allows to trace the recent path of the star in the Hertzsprung-Russell (H-R) diagram shown in Figure 9.
As a further check of the above result, we tried to construct models with constant bolometric luminosity, but the resulting model stellar magnitudes differ from the observed ones. For example, if we take =const then the difference between the December 2008 model stellar magnitude and the observed one is about 0.2 mag. Such difference might be due to photometric errors. But for the February 2005 model such difference exceeds 0.7 mag, and this can not be in any way attributed to photometric uncertainties. Therefore we conclude that the bolometric luminosity variation is real.
5 The evolutionary state of GR 290
5.1 GR 290 and the LBV stars
As discussed in the previous sections, GR 290, from the observational point of view, shares some properties of the strongly active LBVs as classified by van Genderen (2001). However, GR 290 is different from all other known LBVs for being at any luminosity phase much hotter, since it presently exhibits a WN9-11h spectral type during brightness maxima and a WN8h spectral type at the minima. Also the spectral type shown by GR 290 during the 1992-94 absolute maximum (equivalent to B, probably late spectral type) is hotter than the ones of the majority of other LBVs, that usually have A phases. or even F spectral types during their maximum. Furthermore, if the present correlation between the visual magnitude and the spectral type had been valid also before 1960, GR 290 (being its luminosity weaker than B=17.5 mag in all the recorded data) would have been much hotter than all the so far known dormant LBVs (all having an Ofpe - or WN 9-11 - spectral type) also during its long lasting quasi-quiescent phase in the first half of the 20th Century.
Last, all the stars so far considered to be dormant LBVs (but one: HDE326823, that was suggested to be in a post-LBV phase by Sterken et al. 1995) are placed near to the lower boundary of the instability strip (Wolf, 1989). On the contrary, the GR 290 representative point in the H-R diagram, as seen in Figure 9, presently is far from the instability strip.
We also stress that the spectral and luminosity variations of GR 290 in the last years occurred at nearly constant color index, contrary to what expected for an LBV.
It is thus unavoidable to conclude that presently there are no known LBV stars that can be directly compared with GR 290 in every aspect.
5.2 GR 290 and the WNL stars
A point to be considered is the present high temperature of GR 290 and its spectrum at minimum very similar to that of WN8h stars. Figure 9 shows that the luminosity and temperature of GR 290 fit well that of late WN stars. The mass loss rate of GR 290 is also similar, but the wind velocity of GR 290, = 400 km s-1, is significantly lower than that of WN8h stars (see Maryeva & Abolmasov 2012a,b). Also the hydrogen abundance of the envelope appears higher than in WNL stars. Figure 10 shows the diagram of the hydrogen mass-fraction as a function of luminosity for different evolutionary tracks. GR 290 lies higher than WN8h stars. These results give evidence that, from the evolutionary and structural point of view, GR 290 is younger than WN8h stars.
5.3 Evolutionary considerations
According to the above derived bolometric luminosity, ( =5.8–5.9) and effective temperature of 2233 kK the position of GR 290 fits the 60 evolutionary tracks of Chieffi & Limongi (2013) with and without rotation, just to the left of the low temperature loop in the H-R diagram. The Geneva evolutionary tracks for non rotating models suggest a similar initial mass (see e.g. Groh et al. (2013)). Although all these tracks were computed for solar metallicity, the initial mass of GR 290 cannot be too far from this value. According to the evolutionary models of Chieffi & Limongi (2013) GR290 should now be 4 Myr old and have a mass of 26 . The star is thus in the mass range where theoretical evolutionary models foresee that, after the O phase and before the Hydrogen-poor Wolf-Rayet (WR) star phase, stars transit from an Of/WN (or WN 9-11) through the LBV phase to a WNL phase. Groh et al. (2014) computed the spectral evolution of a non-rotating 60 M star, that could be appropriate to the case of GR 290. They found that the star first evolves to the right part of the H-R diagram through the hot LBV phase (near the end of core H-burning) to the cool LBV loop of the evolutionary track. Then, after the beginning of core He burning, the star leaves the LBV phase and evolves to early WN, rapidly crossing in a few thousand years the late-WN phase. In the Groh et al. framework, the effective temperature and spectral type of GR 290 would clearly place the star in the WNL phase. The post LBV phase is further supported by the helium and nitrogen abundances derived in Section 4, which are higher than in the classical LBVs. One should also note that, according to Groh et al. (2014), the lifetime of a 60 M star in the LBV phase is 50 times longer than that in the post-LBV WNL phase, hence we should expect WNL stars to be very rare. The question is whether in the post LBV phase stars may still undergo large luminosity variation such as those observed in GR 290.
5.4 Luminosity variation
As discussed in Section 4, a distinguishing peculiarity of GR 290 is the variation of its bolometric luminosity during its recent apparent luminosity cycles. The evolution of LBVs during the S Dor cycles seems to occur in most cases roughly at constant bolometric luminosity (see, e.g., Smith, Crowther & Prinja (1994); de Koter et al. (1996); Walborn et al. (2008)). Indeed, the variation of the bolometric luminosity is a point so far observed only in a few LBV cases: Groh et al. (2009a) have found that the bolometric luminosity of AG Car has decreased by a factor of 1.5 from minimum towards the light maximum of the S Dor cycle. A reduction of the bolometric luminosity during the cycle was also derived by Lamers (1995) for S Dor itself. Lamers (1995) interpreted this result in terms of the radiative power being partially transformed into mechanical power in order to expand the outer layers of the star from minimum to maximum. The same explanation was given by Groh et al. (2009a) in the case of AG Car and by Andriesse et al. (1978) to explain the one magnitude decrease of the bolometric luminosity of Car after the 1843 giant outburst. In the case of GR 290 the power associated to its mass loss rate is by far too low to explain its changes in bolometric luminosity. In addition, contrary to the cases discussed above, the Lbol increases of GR 290 are recorded during its visual luminosity maxima. If, as for instance suggested by Lovekin & Guzik (2014a), the GR 290 active phase were triggered by bursts of nuclear energy, an associated increase in bolometric luminosity could well occur at the light maxima as observed, due to the energy release associated with these nuclear runaway events. Since changes of the bolometric luminosity of such an amplitude have not been so far recorded in any LBVs we may argue that the higher temperature of GR 290 plays an important role in the above suggested process.
6 Conclusions
In summary, we have shown that:
1) During the last one hundred years GR 290 experienced two phases: one long lasting quasi-stationary, presumably hot phase. Then an active phase started in mid-20th Century with five luminosity maxima separated by 7-10 years.
2) The amplitude of the last variability cycles is decreasing with an associated increase of the stellar temperature at minimum. During this period of time the stellar temperature is modulated in anti-correlation with the visual luminosity.
3) The star is in all phases much hotter than the other LBVs, reaching an effective temperature of 33 kK at the apparent luminosity minima.
4) During the last two variability cycles the bolometric luminosity changed following the variation of visual luminosity, being a factor 1.5 higher at maximum.
5) The bolometric luminosity of GR 290 fits the evolutionary tracks of a 60 star. The high effective temperature and WNL-type spectrum place the star after the low temperature loop of the evolutionary tracks which is thought to be occupied by the LBV stars.
6) At present, the representative point of GR 290 in the H-R diagram is close to that of WN8h stars, but the chemical abundances suggest the star be younger than them.
The above discussed points lead us to conclude that GR 290 is presently in a short, and thus very rare, transition phase between the LBV evolutionary phase and the nitrogen rich W-R stellar class, as also suggested by Polcaro et al. (2011) and Humphreys et al. (2014).
GR 290, though is no longer near the LBV minimum instability strip, still might be subject to structural instabilities similar to those which gave rise to the last observed large variability cycles.
We cannot foresee how long these instabilities will last. Following Lovekin & Guzik (2014a) the instability is due to the hydrogen mixing in the core generating a burst of nuclear energy: presently, such repeated nuclear events should be the extra-energy input to increase the bolometric luminosity of GR 290 during its last outbursts. They will end when the hydrogen percentage in the envelope will become too low to be mixed in the core. However, the steady decreasing amplitude of the last cycles and gradual increasing of the temperature of GR 290 both suggest that this instability phase will not last too long. This point will require new theoretical studies on the internal instabilities in luminous stars and GR 290 could probably be an ideal target to study this process.
| Plate no. | date | JD | emulsion | exp | rms | slope | mag | band | remarks |
|---|---|---|---|---|---|---|---|---|---|
| (1) | (2) | (3) | (4) | ||||||
| Hamburg | |||||||||
| S00332 | 1914 09 21 | 2420397 | Hauff-Ultra | 30 | 0.08 | 1.03 | 18.4 | B | poor |
| S02358 | 1920 10 18 | 2422616 | unknown | 94 | 0.07 | 0.99 | 18.2 | B | good |
| S02396 | 1920 11 12 | 2422641 | Agfa-Isorapid | 40 | 0.12 | 0.95 | 18.4 | B | poor |
| S02436 | 1921 02 09 | 2422730 | Agfa-Isorapid | 40 | 0.18 | 1.03 | 17.9 | B | poor |
| S02587 | 1921 09 09 | 2422942 | Hauff-Ultra | 114 | 0.13 | 1.11 | 18.5 | B | fair |
| S02676 | 1921 11 24 | 2423018 | Agfa-Isorapid | 60 | 0.12 | 0.92 | 18.5 | B | fair |
| S02982 | 1922 11 18 | 2423377 | Agfa-Isorapid | 30 | 0.12 | 1.02 | 18.4 | B | fair |
| S04042 | 1928 11 09 | 2425560 | Agfa-Astro-Inhalo | 60 | 0.10 | 1.13 | 18.4 | B | good |
| S04295 | 1930 08 24 | 2425483 | Agfa-Astro-Inhalo | 47 | 0.08 | 1.09 | 18.4 | B | good |
| Pulkovo | |||||||||
| K235 | 1935 11 16 | 2428123 | unknown | 60 | 0.05 | 0.78 | 16.5 | B | not visible |
| K397 | 1937 09 30 | 2428807 | unknown | 100 | 0.28 | 1.20 | 18.67 | B | faint |
| K412 | 1937 10 07 | 2428814 | unknown | 90 | 0.20 | 1.02 | 18.45 | B | faint |
| K413 | 1937 10 07 | 2428814 | unknown | 105 | 0.08 | 0.84 | 17.95 | B | faint |
| K508 | 1938 11 27 | 2429230 | unknown | 66 | 0.12 | 0.84 | 17.93:: | B | very faint |
| K510 | 1938 12 17 | 2429250 | unknown | 80 | 0.08 | 1.09 | 18.54 | B | very faint |
| Heidelberg | |||||||||
| D0154 | 1907 08 08 | 2417795 | unknown | 35 | 0.10 | 1.31 | 18.19 | B | faint |
| D0169 | 1908 08 12 | 2417799 | unknown | 124 | 0.10 | 1.31 | 17.5 | B | not visible |
| D0359 | 1908 07 25 | 2418165 | unknown | 40 | 0.10 | 1.98 | 18.85 | B | faint |
| D1615 | 1917 12 10 | 2421572 | unknown | 40 | 0.15 | 1.00 | 17.79 | B | faint |
| D1616 | 1917 12 17 | 2421579 | unknown | 40 | 0.21 | 1.04 | 17.97 | B | faint |
| D1617 | 1917 12 17 | 2421579 | unknown | 40 | 0.11 | 1.04 | 17.5 | B | not visible |
| D1631 | 1918 01 30 | 2421623 | unknown | 40 | 0.13 | 1.35 | 17.5 | B | not visible |
| D1632 | 1918 01 30 | 2421623 | unknown | 40 | 0.20 | 1.54 | 17.5 | B | not visible |
| D2118 | 1920 08 15 | 2422551 | unknown | 60 | 0.19 | 1.46 | 17.5 | B | not visible |
| D2119 | 1920 08 15 | 2422551 | unknown | 70 | 0.20 | 1.42 | 17.5 | B | not visible |
| D2485 | 1922 10 14 | 2423341 | unknown | 90 | 0.12 | 1.02 | 17.90 | B | visible |
| D2498 | 1922 10 25 | 2423352 | unknown | 64 | 0.20 | 1.48 | 18.40 | B | faint |
| Yerkes | |||||||||
| Ry-8: | 1901 08 15 | 2415613 | unknown | 210 | 0.14 | 18.33 | B | ||
| scanMP | 1902 09 04 | 2415999 | unknown | 240 | 0.10 | 18.50 | B | ||
| G107a | 1910 08 06 | 2418890 | unknown | 510 | 0.10 | 18.26 | B | 60” Mt Wilson | |
| R-3481: | 1916 09 19 | 2421127 | unknown | 50 | 17.95 | B | not visible | ||
| R-3518: | 1916 12 09 | 2421208 | unknown +W12 | 240 | 14.81 | V ? | very dark plate | ||
| R-5478 | 1936 11 10 | 2428484 | I-O | 30 | 0.5 | 17.75 | B | poor | |
| R-5523: | 1937 01 10 | 2428545 | I-C+ red | 60 | 16.95 | V-R | poor | ||
| R-5531: | 1937 01 15 | 2428550 | I-O | 37 | 17.95 | B | not visible | ||
| R-5614: | 1938 10 24 | 2429197 | Agfa pan+yellow | 60 | 14.95 | V | not visible | ||
| R-5616: | 1938 10 24 | 2429197 | Agfa pan+yellow | 60 | 14.95 | V | not visible | ||
| R-5618: | 1938 10 27 | 2429200 | E-40 | 5 | 15.43 | B | not visible | ||
| R-5621: | 1938 10 27 | 2429200 | unknown | 5 | 15.45 | B | not visible | ||
| R-5625: | 1938 11 29 | 2429233 | Agfa SPP+#28 | 40 | 14.59 | R | not visible | ||
| cl 204 | 1947 09 13 | 2432442 | unknown | 402 | 17.95 | B | not visible | ||
| vB9404 | 1952 10 12 | 2434299 | 0.06 | 18.40 | B | ||||
| Palomar | |||||||||
| POSS-IE | 1949 12 21 | 2433272 | 103aE+plexi | 45 | 0.15 | 2.11 | 18.68 | R | |
| Quick-V | 1982 10 18 | 2445261 | IIaD+W12 | 20 | 0.06 | 1.86 | 17.81 | V | |
| POSS-IIB | 1991 09 30 | 2448530 | IIIaJ+GG395 | 60 | 0.05 | 2.58 | 16.54 | B | |
| POSS-IIR | 1991 10 05 | 2448535 | IIIaF+RG610 | 75 | 0.06 | 2.66 | 16.04 | R | |
| Asiago | |||||||||
| 5624 | 1972 09 16 | 2441577 | 103aO+GG13 | 30 | 0.18 | 1.72 | 17.25 | B | good |
| 5831 | 1972 11 07 | 2441629 | 103aD+GG14 | 20 | 0.08 | —- | 17.43 | V | good |
| 6804 | 1973 10 27 | 2441983 | 103aO+GG13 | 20 | 0.21 | 1.93 | 17.15 | B | good |
| 6940 | 1973 12 15 | 2442032 | 103aD+GG14 | 30 | 0.13 | —- | 17.83 | V | good |
| 11699 | 1982 10 14 | 2445257 | 103aO clear | 30 | 0.19 | 1.78 | 16.70 | B | high background |
| 12338 | 1983 11 28 | 2445667 | 103aD+GG14 | 30 | 0.12 | 17.60 | B | not visible |
| Date | Obs aa observatories: Greve: 30 cm telescope at Greve in Chianti (Firenze). ARA: 37 cm telescope of the Associazione Romana Astrofili at Frasso Sabino (Rieti). Loiano: 1.52 m telescope at the Loiano station of the Bologna Astronomical Observatory-INAF. SSON: the Sierra Stars Observatory Network in Mount Lemmon (Arizona). IAC80: 80 cm Tenerife telescope of the Astrofisico de Canarias. | ||||
|---|---|---|---|---|---|
| 2010 12 10 | - | 17.95 .10 | - | - | Greve |
| 2010 12 28 | - | 17.88 .07 | - | - | ARA |
| 2011 01 03 | 17.96 .05 | 17.95 .05 | 17.73 .04 | - | Loiano |
| 2011 01 05 | 17.81 .05 | - | - | - | SSON |
| 2011 01 08 | - | 17.92 .05 | - | - | ARA |
| 2011 01 23 | - | 17.92 .07 | - | - | Greve |
| 2011 02 05 | - | 17.80 .10 | - | - | Greve |
| 2011 02 05 | - | 17.82 .06 | - | - | ARA |
| 2011 02 26 | - | 17.79 .10 | - | - | ARA |
| 2011 07 30 | - | 18.08 .10 | - | - | ARA |
| 2011 08 02 | 18.10 .07 | 18.07 .06 | 17.86 .04 | - | Loiano |
| 2011 08 28 | - | 18.50 .09 | - | - | ARA low quality |
| 2011 09 07 | 18.23 .09 | 18.26 .06 | 18.07 .03 | - | Loiano |
| 2011 09 21 | - | 18.35 .09 | 17.94 .12 | - | ARA |
| 2011 10 02 | - | 18.22 .08 | - | - | ARA |
| 2011 10 05 | - | 18.17 .10 | - | - | ARA |
| 2011 10 29 | - | 18.22 .07 | - | - | ARA |
| 2011 11 15 | - | 18.36 .05 | 18.39 .04 | 18.17 .02 | Loiano |
| 2011 11 26 | - | 18.33 .08 | 18.18 .06 | - | ARA |
| 2011 12 17 | - | 18.45 .09 | - | - | ARA |
| 2011 12 23 | - | 18.51 .09 | - | - | ARA |
| 2011 12 23 | - | 18.44 .06 | - | - | ARA |
| 2011 12 26 | - | 18.42 .08 | 18.26 .08 | - | ARA |
| 2012 01 21 | - | 18.31 .09 | - | - | ARA |
| 2012 02 25 | - | 18.62 .12 | - | - | ARA |
| 2012 07 28 | - | 18.19 .09 | - | - | ARA |
| 2012 08 24 | - | 18.42 .09 | - | - | ARA |
| 2012 10 21 | 18.39 .05 | 18.49 .04 | 18.37 .05 | 18.46 .08 | IAC80 |
| 2012 12 12 | 18.47 .06 | 18.52 .06 | 18.30 .04 | - | Loiano |
| 2012 12 30 | - | 18.29 .08 | - | - | ARA |
| 2013 01 07 | - | 18.48 .08 | - | - | ARA |
| 2013 02 04 | - | 18.38 .07 | - | - | ARA |
| 2013 09 04 | - | 18.23 .10 | - | - | ARA |
| 2013 10 01 | - | 18.68 .10 | - | - | IAC80 |
| 2013 10 02 | 18.62 .02 | 18.66 .03 | 18.46 .03 | 18.81 .18 | IAC80 |
| 2013 10 04 | 18.62 .03 | 18.70 .03 | 18.46 .03 | 18.71 .07 | IAC80 |
| 2013 10 05 | 18.60 .02 | 18.67 .02 | 18.45 .03 | 18.69 .07 | IAC80 |
| 2013 11 26 | 18.60 .05 | 18.72 .06 | 18.43 .05 | - | Loiano |
| 2013 12 23 | - | 18.88 .14 | 18.40 .12 | - | ARA |
| 2013 12 23 | - | - | 18.40 .12 | - | ARA |
| 2013 12 30 | - | 18.68 .13 | - | - | SSON |
| 2014 01 01 | - | - | 18.49 .04 | - | Loiano |
| 2014 01 25 | 18.65 .07 | 18.68 .04 | 18.60 .04 | - | Loiano |
| 2014 08 08 | - | - 18.74 .10 | - | - | ARA |
| 2014 08 31 | - | - 18.79 .10 | - | - | ARA |
| 2014 09 27 | - | - | 18.97 .13 | - | ARA |
| 2014 10 04 | - | 18.76 .05 | 18.65 .03 | - | Loiano |
| 2014 10 20 | - | 18.87 .12 | - | - | ARA |
| 2014 11 21 | - | 18.75 .12 | - | - | ARA |
| 2014 12 11 | 18.67 .07 | 18.78 .07 | 18.55 .05 | - | Loiano |
| 2015 08 21 | - | 18.77 .08 | - | - | ARA |
| 2015 11 06 | - | 18.78 .08 | - | - | ARA |
| 2015 11 18 | 18.70 0.03 | 18.84 .04 | 18.50 0.04 | - | Loiano1 |
| 2015 12 02 | 18.64 0.05 | 18.73 .05 | 18.60 0.06 | 18.74 0.07 | Loiano |
| 2015 12 10 | 18.70 0.04 | 18.71 .04 | 18.50 0.04 | - | Loiano1 |
Note. — 1On November 14, 2015, U=17.98 0.08, on December 10, 2015, U=17.70 0.1
| date | band | 468.6 | 587.6 | sp.typ. | Obs | remarks | |||
|---|---|---|---|---|---|---|---|---|---|
| (1) | (2) | (3) | (4) | (5) | (6) | (7) | (8) | (9) | (10) |
| 1992 10 06 | 16.4* | 47.7 1.0 | 10.0 1.0 | 1.25 0.1 | late-B | CalarA | 468 np | ||
| 2002 10 04 | 17.98 | 113.0 3.0 | 23.0 0.4 | 30.0 3.0 | 12.0 3.0 | 18.0 2.0 | WN10h | SAO-M | |
| 2003 02 02 | 17.70 | 97.6 3.0 | 27.3 0.5 | 15.5 1.0 | 6.6 1.0 | 22.3 1.0 | WN10.5h | Loiano | |
| 2004 02 14 | 17.56 | 100. 2.0 | 26.4 1.0 | 11. 1.0 | 1.3 0.5 | 22.2 2.0 | WN11h | Ekar | 468 v.un. |
| 2004 11 12 | 17.18 | 97.3 2.0 | 24.0 1.0 | 7.0 2.0 | 21.0 1.0 | WN11h | SAO-M | 468 n.m. | |
| 2004 12 07 | 17.18 | 113. 2.0 | 27.0 0.5 | 6.5 0.7 | 1.4 0.3 | 23.7 0.5 | WN11h | Ekar | 468 uncer. |
| 2005 01 13 | 17.26 | 111. 3.0 | 27.5 1.0 | 6.4 1.5 | 1.1 0.5 | 21.5 0.5 | WN11h | Loiano | 468 v.un.. |
| 2005 02 06 | 17.24 | 112.5 0.5 | 26.0 0.3 | 7.6 1.0 | 1.4 0.3 | 25.5 0.7 | WN11h | SAO-S | |
| 2005 08 31 | 17.5 | 120.0 5.0 | 26.7 0.5 | 18.5 1.5 | 7.0 0.8 | 26.0 1.5 | WN10h | SAO-S | |
| 2005 11 08 | 17.6 | 150.0 7.0 | 36.7 1.0 | 30.3 0.5 | 11.0 0.7 | 34.5 0.8 | WN9h | SAO-S | |
| 2006 08 03 | 18.43 | 25.1 0.7 | 37.5 1.0 | 11.2 0.5 | WN8h | SAO-S | |||
| 2006 09 29 | 18.4 | 22.1 0.5 | 31.1 0.5 | 9.0 0.3 | WN8h | WIYN | |||
| 2006 11 21 | 18.50 | 144. 7.0 | 32. 2.0 | 47. 5. | 19. 3.0 | 33. 3.0 | WN8h | Loiano | low |
| 2006 12 14 | 18.55 | 129. 7.0 | 27.2 1.0 | 39.9 0.5 | 17.5 0.3 | 36.1 1.5 | WN9h | Loiano | |
| 2007 01 29 | 18.57 | 119. 4.0 | 27.3 1.0 | 36.5 3.0 | 13.1 2.0 | 26.9 0.5 | WN8h | Loiano | |
| 2007 08 10 | 18.5 | 24.7 0.5 | 44.6 0.5 | 16.8 1.0 | WN8h | SAO-S | |||
| 2007 10 06 | 18.6 | 24.3 0.3 | 46.0 1.0 | 16.6 0.5 | WN8h | SAO-S | |||
| 2008 01 08 | 18.62 | 23.7 0.3 | 43.0 2.0 | 14.4 1.0 | WN8h | SAO-S | |||
| 2008 01 10 | 18.62 | 109.6 1.0 | 26.3 0.3 | WN8h | SAO-S | ||||
| 2008 01 23 | 18.65 | 128. 5.0 | 29.0 3.0 | 55.8 5.0 | 27.2 3.0 | 30.0 2.0 | WN8h | Loiano | 465 uncer. |
| 2008 02 07 | 18.65 | 132. 4. 0 | 30.6 1.0 | 44.0 3.0 | 21.3 1.0 | 27.5 1.0 | WN8h | Loiano | |
| 2008 09 08 | 18.44 | 115. 4. 0 | 28.1 0.5 | 33.4 1.5 | 12.8 0.3 | 30.1 1.0 | WN9h | Loiano | |
| 2008 12 04 | 18.31 | 126. 2. 0 | 25.0 0.5 | 36.6 0.5 | 13.1 0.3 | 28.8 0.5 | WN9h | WHT | |
| 2009 02 15 | 18.36 | 117. 3. 0 | 27.9 0.3 | 38.5 2.0 | 12.8 0.5 | 31. 2. | WN9h | Loiano | low q |
| 2009 10 09 | 18.36 | 115.2 1. 5 | 26.0 0.5 | 38.8 1.0 | 18.4 1.5 | 27.8 0.5 | WN9h | SAO-S | |
| 2010 01 21 | 18.38 | 114. 2. 0 | 27.7 0.4 | 32.5 1.5 | 13.8 0.7 | 26.2 0.4 | WN9h | Loiano | low q. |
| 2010 12 06 | 17.66 | 26.2 0.3 | 20.1 0.5 | 7.6 0.5 | WN10h | SAO-S | |||
| 2010 12 18 | 17.93 | 106. 2. 0 | 28.2 0.5 | 21.2 2.5 | 8. 2. | 32.5 2.0 | WN10h | Loiano | 468 uncer. |
| 2011 01 03 | 17.95 | 114. 2. 5 | 29.0 0.5 | 16.6 1.5 | 6.9 0.5 | 25.6 0.3 | WN10h | Loiano | |
| 2011 08 03 | 18.07 | 114.5 1. 0 | 29.2 0.5 | 23.4 1.5 | 8.0 0.7 | 30.5 0.5 | WN10h | Loiano | |
| 2011 09 20 | 18.26 | 122. 5. 0 | 30.8 0.3 | 31.7 1.0 | 13.0 0.5 | 34.6 0.5 | WN9h | Loiano | |
| 2012 12 09 | 18.50 | 111. 2. 0 | 23.5 0.3 | 39.0 2.0 | 16.3 0.5 | 30.0 1.0 | WN8h | Loiano | |
| 2013 11 27 | 18.72 | 98.5 1. 0 | 23.1 0.3 | 44.7 0.5 | 21.4 0.5 | 23.2 0.5 | WN8h | Loiano | |
| 2014 01 01 | 18.68 | 94.2 2. 0 | 22.4 0.2 | 38.7 2.0 | 17.6 0.5 | 20.3 1.0 | WN8h | Loiano | |
| 2014 08 03 | 18.74 | 20.0 0.3 | 45.3 1.0 | 14.4 0.1 | WN8h | SAO-S | |||
| 2014 12 11 | 18.78 | 92.9 0. 7 | 21.1 1.0 | 44.5 0.5 | 20.2 0.5 | 18.7 0.3 | WN8h | Loiano | |
| 2014 12 30 | 18.74 | 94.0 2. 0 | 21.9 0.5 | 43.9 1.5 | 20.0 0.5 | 20.8 1.0 | WN8h | Loiano | |
| 2015 01 26 | 18.7 | 83. 2. | 23.5 1.5 | 50. 5. | 24.1 1.5 | 18.4 1.0 | WN8h | Loiano | low q. |
| 2015 02 19 | 18.61 | 19.6 1.0 | 42.1 5.0 | 16.3 1.0 | WN8h | SAO-S | low q. | ||
| 2015 12 02 | 18.64 | 88.3 0.8. | 20.5 1.3 | 47.0 3. | 21.7 1.1 | 22.4 0.7 | WN8h | Loiano | |
| 2015 12 10 | 18.70 | 89.5 1.0 | 20.5 0.5 | 35.0 0.7 | 20.0 0.7 | 19.5 0.8 | WN8h | Loiano |
Note. — 1) year, month, day. (2) V magnitude (B for the 1992 spectrum). (3) EW and error of H excluding the nearby [N II] doublet. (4) EW and error for H. (5) EW of the 4600-4700 Å , emission blend excluding He I 4713 Å. (6) EW of the He II 4686 line. (7) EW of He I 5876. (8) spectral type. (9) Observatory: CalarA.: Calar Alto Obs. Ekar: Cima Ekar (Padova Observatory). Loiano: Loiano Station (Bologna Observatory). SAO-M/-S: 6 m Special Astronomical Observatory equipped with MPFS (M) or SCORPIO (S) cameras. WHT: 4m William Hershel Observatory. WIYN 3.5 m Observatory (Kitt Peak). (10) remarks: 486: He II 4686 Å line; 465: the 4600-4700 Å emission blend; np: not present; n.m.: not measurable; (v.) uncer: (very) uncertain; low q.: low quality spectrum (noisy, bad skv).
| Date | Obs. | Spectral | [Å] | S/N |
| range | ||||
| Oct 2002 | SAO-M | 4250-6700 | 6 | 16 |
| Feb 2003 | Loiano | 3650-8600 | 11 | |
| Jan 2005 | Loiano | 4150-6600 | 3.5 | |
| Sep 2006 | WIYN1 | 4000-5100 | ||
| Oct 2007 | SAO-S | 4000-5700; 5700-7500 | 5; 5 | 40; 20 |
| Dec 2008 | WHT | 3000-10 000 | 0.8; 1.8 | 30; 20 |
| Oct 2009 | SAO-S | 3700-7800 | 5 | 35 |
| Dec 2010 | SAO-S | 4100-5800 | 5 | 60 |
| Aug 2014 | SAO-S | 4000-5650 | 5 | 20 |
| 1 – data taken from Clark et al. (2012). | ||||
| Date | V | Sp. | f | H/He | ||||||
| [mag] | type | [kK] | [] | [] | [] | [] | [] | |||
| Oct 2002 | 17.98 | WN10h | 28.0 | 39 | 8.0 | 5.90 | 2.4 | 0.15 | 1.7 | |
| Feb 2003 | 17.70 | WN10.5h | 27.5 | 44 | 9.5 | 5.98 | 2.4 | 0.15 | 1.7 | |
| Jan 2005 | 17.24 | WN11h | 23.51 | 61 | 10.05 | 6.021 | 4.0 | 0.15 | 1.7 | |
| Sep 2006 | 18.4 | WN8h | 31.0 | 28 | 6.7 | 5.83 | 1.5 | 0.15 | 1.7 | |
| Oct 2007 | 18.6 | WN8h | 33.3 | 23.8 | 6.3 | 5.8 | 1.9 | 0.15 | 1.7 | |
| Dec 2008 | 18.31 | WN8h | 31.5 | 28.5 | 7.2 | 5.86 | 2.3 | 0.15 | 1.7 | |
| Oct 2009 | 18.36 | WN9h | 32.0 | 28.4 | 7.5 | 5.875 | 2.0 | 0.15 | 1.7 | |
| Dec 2010 | 17.95 | WN10h | 26.7 | 42 | 8.0 | 5.9 | 2.6 | 0.15 | 1.7 | |
| Aug 2014 | 18.74 | WN8h | 33.0 | 22.5 | 5.3 | 5.72 | 1.7 | 0.15 | 1.7 | |
| Errors | ||||||||||
| Sep 20102 | 17.8 | WN10h | 26 | 41.5 | 5.85 | 2.18 | 0.25 | 265 | 1.5 |


Appendix A Appendix
The Hamburg plates have four different types of Agfa emulsions and no filters. All plates were digitized in transparency mode at the Hamburg Observatory with Epson Expression 10000 XL scannners, at 2400 dpi step, giving a scale of 0.74 arcsec/pixel, in the framework of a legacy project (P.I. D. Groote). Given the fast telescope focal ratio, the images are substantially affected by coma but the region around GR 290 is fairly usable for aperture photometry. We transformed the plate transparency into pseudo-intensity with the formula I=(U-B)/(T-B), where T is the transparency of a given pixel, U the average transparency of the unexposed plate and B the transparency in the center of saturated stars (Nesci et al., 2005). Then we performed aperture photometry on GR 290 with IRAF/apphot, using as calibration the brightest reference stars of the sequence given in Viotti et al. (2006) (namely from ku-a to ku-h), in the range =14.8-19.08. We adopted the magnitude scale, as it is more similar to that of the old plate emulsions. Further stars of the sequence were not usable due to crowding or because too faint. The adopted aperture radius was 4 pixels (3 arcsec), comparable to the FWHM of the stars. For each plate, a linear fit between instrumental and nominal magnitudes was derived and found quite satisfactory, with a slope near to the ideal case of 1.00; from these fits we derived the magnitude of GR 290 together with the rms deviation of the comparison stars from the calibration and the slope of the linear fit. To estimate the photometric accuracy of our magnitudes we measured also a field star of comparable magnitude and used its deviation from the fit as a photometric error, which resulted to be about 0.2 mag.
The Heidelberg plates were digitized with the Heidelberg Nexscan F4100, with a resolution from 100 to 200 pixels per millimeter. The plates found in the Pulkovo archive have been digitized with a Canon 5D MarkII camera. The Yerkes plates were scanned with an EPSON 10000XL at 2400 dpi.
All the POSS plates and the Asiago blue plates (103aO emulsion + GG13 filter) showed calibration curves fully compatible with a linear relation between instrumental and reference magnitudes; the Asiago V plates (103aD emulsion + GG14 filter) instead showed a marked curvature, requiring a parabolic fit. We therefore added a further star in the comparison sequence, fainter than GR 290, in order not to extrapolate its magnitude. The only suitable star in the Viotti et al. (2007) sequence is M31a-262 with V=17.61.
References
- Andriesse et al. (1978) Andriesse,C. D., Donn, B.D., Viotti, R., 1978 MNRAS, 185, 771
- Calabresi et al. (2014) Calabresi, M., Rossi, C., Gualandi, R., et al. 2014 Astr.Telegram 5846
- Chieffi & Limongi (2013) Chieffi, A., Limongi, M. 2013, ApJ, 764, 1
- Clark et al. (2012) Clark, J.S., Castro, N., Garcia, M., et al., 2012, A&A, 541, A146
- Crowther & Smith (1997) Crowther, P.A., Smith, L.J., 1997, A&A320, 500
- de Koter et al. (1996) de Koter, A., Lamers, H. J. G. L. M., & Schmutz, W. 1996, A&A, 306, 501
- Fabrika et al. (2005) Fabrika, S., Sholukhova, O., Becker, T., et al., 2005, A&A, 437, 217
- Galleti et al. (2004) Galleti, S., Bellazzini, M., Ferraro, F. R., 2004, A&A, 423, 925
- Groh et al. (2009a) Groh, J.H., Hillier, D.J., Damineli, A., et al., 2009, ApJ, 698, 1698
- Groh et al. (2009b) Groh J.H., Damineli A., Hillier D.J., et al., 2009, ApJ, 705, L25
- Groh et al. (2013) Groh, J. H., Meynet, G., Georgy, C., and Ekström, S., 2013, A&A, 558,131.
- Groh et al. (2014) Groh, J. H., Meynet, G., Ekström, S., Georgy, C.,2014, A&A, 564,30.
- Hainich et al. (2014) Hainich, R., Rühling, U., Todt, H., et al. 2014, A&A, 565, A27
- Hillier & Miller (1998) Hillier, D.J., Miller, D.L., 1998, ApJ, 496, 407
- Hippelein et al. (2003) Hippelein, H., Haas, M., Tuffs, R.J., et al., 2003, A&A, 407, 137
- Humphreys & Davidson (1994) Humphreys, R.M., Davidson, K., 1994, PASP, 106, 1025
- Humphreys et al. (2014) Humphreys, R.M., Weis, K., Davidson, K., et al. 2014, ApJ, 790, 48
- Kiseleva & Khrutskaya (2007) Kiseleva T. P., Khrutskaya E. V., 2007, Solar System Research, 41, 72
- Kurtev et al. (2001) Kurtev, R., Sholukhova, O., Borissova, J., Georgiev, L., 2001, Rev. Mex. A. A., 37, 57
- Lamers (1995) Lamers, H. J. G. L. M., 1995, in ASP Conf. Ser. 83, IAU Colloq. 155
- Lovekin & Guzik (2014a) Guzik, C.C., Lovekin, J.A., 2014, IAUS 301, 449
- Lovekin & Guzik (2014) Lovekin J.A., Guzik C.C., 2014, MNRAS, 445, 1766
- Magrini et al. (2010) Magrini, L., Stanghellini, L., Corbelli, E., et al., 2010, A&A, 512, A63
- Maryeva & Abolmasov (2010) Maryeva, O., Abolmasov, P., 2010, Rev. Mexicana Astron. Astrofis., 46, 279
- Maryeva & Abolmasov (2012a) Maryeva, O., Abolmasov, P., 2012a MNRAS419, 1455
- Maryeva & Abolmasov (2012b) Maryeva, O., Abolmasov, P., 2012b, MNRAS, 421, 1189
- Maryeva et al. (2013) Maryeva, O. V., Afanasiev, V. L., Panchuk, V. E., 2013, New Astronomy, 25, 2
- Morris et al. (1993) Morris, P.W., Brownsberge,r K.R., Conti, P.S., et al. 1993 ApJ, 412, 324
- Nesci et al. (2005) Nesci, R., Massaro, E., Rossi, C., et al., 2005, AJ, 130, 1466
- Najarro (2001) Najarro F., 2001, in de Groot M., Sterken C., eds. ASPCS Vol. 233, 133
- Polcaro et al. (2003) Polcaro V. F., Gualandi R., Norci L., et al., 2003, A&A, 411, 193
- Polcaro et al. (2011) Polcaro, V. F., Rossi, C., Viotti, R. F., et al., 2011, AJ, 141, 18
- Romano (1978a) Romano, G., 1978, Inf. Bul. Var. Stars, 1433
- Romano (1978b) Romano, G., 1978, A&A, 67, 291
- Sander et al. (2014) Sander A., Todt H., Hainich R., and W.-R. Hamann, 2014, A&A, 563, 89
- Schlegel et al. (1998) Schlegel, D. J., Finkbeiner, D. P., Davies, M. 1998, ApJ, 500, 525
- Sholukhova et al. (1997) Sholukhova, O. N., Fabrika, S. N., Vlasyuk, V. V., Burenkov, A. N., 1997, Astronomy letters., 23, 458
- Sholukhova et al. (2011) Sholukhova, O. N., Fabrika, S. N. Zharova, A. V., Valeev, A. F., Goranskij, V. P., 2011, Astrophysical Bulletin, Volume 66, Issue 2, pp 123-143
- Smith, Crowther & Prinja (1994) Smith, L.J., Crowther, P.A., Prinja, R. K.. 1994, A&A, 281, 833
- Szeifert (1996) Szeifert, T., 1996, Liege International Astrophysical Colloquia, 33, 459
- Sterken et al. (1995) Sterken, C., Sthal, O., Wolf B, Szeifert, Th., Lones A, 1995, Å p, 303, 766
- van Genderen (2001) van Genderen, A. M., 2001, A&A, 366, 508
- Viotti et al. (2006) Viotti, R. F., Rossi, C., Polcaro, V. F., et al., 2006, A&A, 458, 225
- Viotti et al. (2007) Viotti, R. F., Galleti, S., Gualandi, R., et al., 2007, A&A, 464, L53
- Walborn et al. (2008) Walborn, N. R., Stahl, O., Gamen, R. C., et al. 2008, ApJ, 683, L33
- Wolf (1989) Wolf, B., 1989, A&A, 217, 87