The effect of stirring on the heterogeneous nucleation of water and of clathrates of tetrahydrofuran/water mixtures
Abstract
The statistics of liquid-to-crystal nucleation are measured for both water and for clathrate-forming mixtures of tetrahydrofuran (THF) and water using an automatic lag time apparatus (ALTA). We measure the nucleation temperature using this apparatus in which a single sample is repeatedly cooled, nucleated and thawed. The effect of stirring on nucleation has been evaluated numerically and is discussed. We find that stirring of the solution makes no difference to the nucleation temperature of a given solution in a given tube.
Key words: hydrate, THF, nucleation, ALTA, stirring, water
PACS: 64.60.Q-
Abstract
Вимiрюється статистика нуклеацiї рiдина-до-кристалу для води i для граткоформуючих сумiшей тетрагiдрофурану та води, використовуючи апарат автоматичної часової затримки (ALTA). Ми вимiрюємо температуру нуклеацiї, використовуючи цей апарат, в якому той самий зразок повторювально охолоджується, проходить нуклеацiю i розплавлюється. Ефект перемiшування на нуклеацiю був оцiнений чисельно i дискутується. Ми отримали, що перемiшування не дає ефекту для температури нуклеацiї даного розчину в данiй комiрцi.
Ключовi слова: гiдрати, тетрагiдрофуран, нуклеацiя, апарат ALTA, перемiшування, вода
1 Introduction
We have measured the heterogeneous nucleation of both water and a clathrate-forming liquid mixture, tetrahydrofuran (THF)/water in order to determine if stirring the solution has any effect on the nucleation temperature. All measurements were made at one atmosphere pressure.
Tetrahydrofuran (THF) C4H8O is also known as butylene oxide, 1,4-epoxybutane, cyclotetramethylene oxide, oxacyclopentane, diethylene oxide, oxolane, and furanidine. With water it is known to form Structure II clathrates, at one atmosphere, below a temperature which depends on concentration. For a THF/water mixture at a concentration of 81 mass % water (a 17:1 mole ratio), the melting point of the clathrate is raised to approximately C.
The lag-time before a supercooled sample nucleates to a solid is a stochastic quantity, strongly dependent on the degree of supercooling. In chemical engineering, and some other fields, it is called the ‘‘induction’’ time [1].
Our experimental procedure involves taking a small volume of solution and cooling it linearly to below its equilibrium melting point until it nucleates and freezes. The time for the actual freezing to occur is very, very short compared to the cooling time and is not taken into account in any further analysis below. A supercooled solution will often spontaneously freeze when bumped or tapped. What is less well known is any possible effect that stirring of the solution may have on nucleation. Stirring was also designed to mimic turbulence in oil pipelines, where the nucleation of hydrates is a flow assurance problem.
2 Materials and methods
The measurements described here are made on a purpose built automated nucleation device that we have termed automatic lag time apparatus (ALTA) [2] The water used is Ultrapur reagent grade water (Merck, Germany) filtered through a 0.2 µm filter. The THF is reagent grade from Scharlau, Spain.
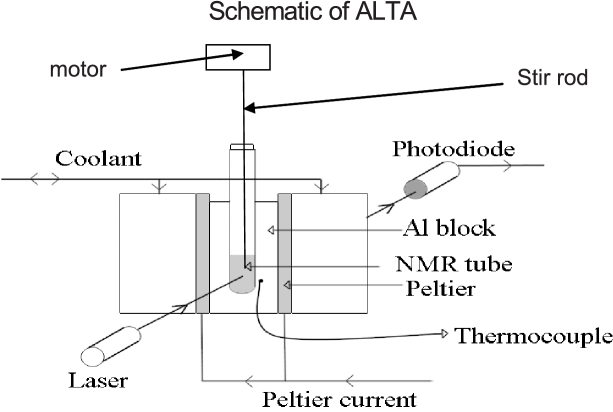
Sample volumes of 300 µl have been used in each case and are placed in purpose built sample tubes made from borosilicate glass with an outside diameter of 5.0 mm and a length of 65 mm. These glass tubes are inserted with a snug fit into a hole drilled into an aluminium sample holder in the ALTA (see figure 1). The aluminium block is cooled by thermoelectric units on each side and the temperature control is by a PID package built into a Genie software package (Advantech Inc.) which controls the experiment via a multipurpose DAQ card and PC interfacing. A cooling rate of 4.5 K min.-1 is used and freezing of the samples is detected optically due to a sudden lowering in the optical transmission of a laser beam passed through the sample tube. Once freezing has been detected, the software causes heating of the tube for 300 s to ensure a complete melting of any ice or hydrates, before the same tube and sample is cooled again. This cycle is repeated more than 300 times in any single measurement run to gather statistically valid data about the nucleation temperature of the sample in that tube.
A glass capillary (2 mm diameter) with a scalloped lower section of 2 mm length was also inserted in the sample tube for every measurement. For some series of runs (usually 50 freeze/thaw cycles), it was stationary and then rotated around the vertical axis at either 600 (slow) or 2000 (fast) revolutions per minute. A motor speed controller was used to control a small DC motor connected to the stir rod, which passed through a bush in the top of the box of ALTA, which is flushed with dry nitrogen in order to avoid condensation on all the cold parts.
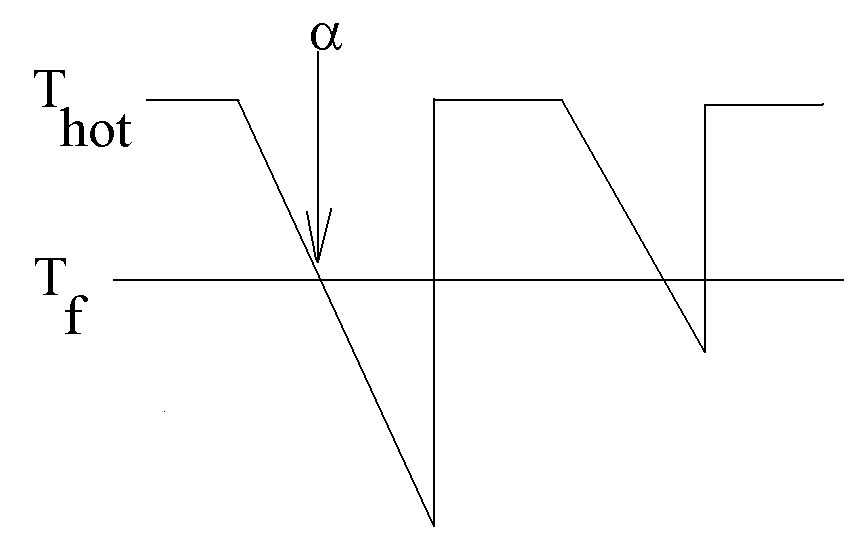
Figure 2 shows the experimental protocol for the ramping down of the sample temperature until freezing occurs. This cycle is repeated more than 300 times in any single measurement run to gather statistically valid data about the nucleation temperature of the sample in that tube.
3 Results and discussion
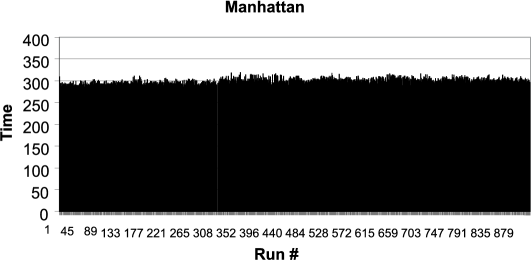
The data collected are the lag-time until nucleation and the super cooled temperature T at which nucleation occurs for each run. When the time for each successive run is plotted as a histogram, we produce a data set such as that shown in figure 3, usually known as a Manhattan [3].
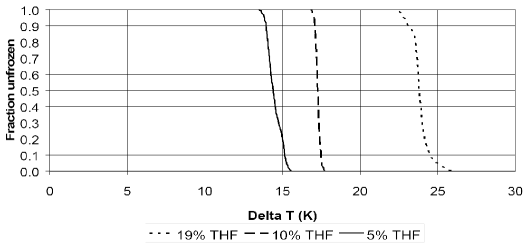
We now define the ‘survival curve’ as the number of samples unfrozen after time , divided by the total number of samples . The survival curves for a typical set of three runs, is shown in figure 4. The -axis is the fraction of runs as yet unfrozen at that temperature while at colder temperatures all of the runs had frozen. We are defining the T50% as the kinetic freezing point (also known as the supercooling point), i.e., the temperature at which half runs on that sample are still unfrozen. The -axis is the fraction unfrozen at a given temperature. Clearly, at warmer temperatures all of the runs were as yet unfrozen while at colder temperatures all of the runs had frozen. Note also that the -axis in now level of supercooling, , and not the actual temperature in ∘C. This is because the melting points of the various concentrations of THF vary. We plot the levels of supercooling in this way in order to compare the effects of both concentration and the added substances or changed conditions (such as stirring) on the nucleation temperatures. The curves in figure 4 are typical of all the curves we have generated for each series at each concentration. For the three data sets shown in figure 4, the T50s are 14, 17 and 23.5 degrees of supercooling for the 5, 10 and 19 wt % THF concentrations, respectively.
| Sample | No stir bar | No stirring | Slow stirring | Fast stirring |
|---|---|---|---|---|
| water | ||||
| water | ||||
| water | ||||
| THF (19%) |
4 Conclusions
Our experiments have shown that THF/water mixtures behave similarly, in general, to pure water solutions. We find that THF at 19% concentration, stirred at either 600 or 2000 r.p.m. does not markedly affect the nucleation temperature in either direction. Thus, we conclude that turbulence probably does not affect the nucleation temperature in pipelines, but more likely it will be insoluble particles acting as nucleation sites.
References
- [1] Heneghan A., Wilson P.W., Wang G., Haymet A.D.J., J. Chem. Phys., 2001, 115, 7599; doi:10.1063/1.1407290.
-
[2]
Heneghan A.F., Wilson P.W., Haymet A.D.J.,
Proc. Natl. Acad. Sci. U.S.A., 2002, 99, 9631;
doi:10.1073/pnas.152253399. - [3] Wilson P.W., Heneghan A.F., Haymet A.D.J., Cryobiology, 2002, 46, 88; doi:10.1016/S0011-2240(02)00182-7.
Ukrainian \adddialect\l@ukrainian0 \l@ukrainian
Ефект перемiшування на гетерогенну нуклеацiю води
i клатратiв
з сумiшей тетрагiдрофуран/вода
П.В. Вiльсон, А.Д.Дж. Геймет
Факультет науки, iнженерiї i технологiї, Унiверситет Тасманiї,
Гобарт 7001, Австралiя
Iнститут океанографiї Скрiппса, Унiверситет Калiфорнiї Сан-Дiєго, Сан-Дiєго, Калiфорнiя 92093-0210, США