Salt-specific effects in lysozyme solutions††thanks: We dedicate this contribution to our friend and coworker Professor A.D.J. Haymet on occasion of his 60 birthday.
Abstract
The effects of additions of low-molecular-mass salts on the properties of aqueous lysozyme solutions are examined by using the cloud-point temperature, , measurements. Mixtures of protein, buffer, and simple salt in water are studied at (phosphate buffer) and (acetate buffer). We show that an addition of buffer in the amount above mol dm-3 does not affect the values. However, by replacing a certain amount of the buffer electrolyte by another salt, keeping the total ionic strength constant, we can significantly change the cloud-point temperature. All the salts de-stabilize the solution and the magnitude of the effect depends on the nature of the salt. Experimental results are analyzed within the framework of the one-component model, which treats the protein-protein interaction as highly directional and of short-range. We use this approach to predict the second virial coefficients, and liquid-liquid phase diagrams under conditions, where is determined experimentally.
Key words: lysozyme, salt-specific effects, cloud-point temperature
PACS: 64.60.My, 64.70.Ja, 87.15.km, 87.15.nr, 87.80.Dj
Abstract
Ефекти додавання солей з малою молекулярною масою на властивостi водних розчинiв лiзозиму встановлюються з вимiрювань температури точки хмари, . Дослiджуються сумiшi протеїну, буферного електролiту i простої солi у водi при (фосфатний буфер) i (ацетатний буфер). Ми показуємо, що додавання буферного електролiту вище моль дм-3 не впливає на значення . Однак, при замiнi певної кiлькостi буферного електролiту iншою сiллю, тримаючи постiйною повну iонну мiцнiсть, ми можемо суттєво змiнити температуру точки хмари. Усi солi дестабiлiзують розчин, i величина ефекту залежить вiд природи солi. Експериментальнi результати аналiзуються в рамках однокомпонентної моделi, яка розглядає взаємодiю протеїн-протеїн як сильно направлену та короткодiючу. Ми використовуємо цей пiдхiд для передбачення других вiрiальних коефiцiєнтiв та фазових дiаграм рiдина-рiдина при умовах, коли визначається експериментально.
Ключовi слова: лiзозим, ефекти специфiки солi, температура точки хмари
1 Introduction
Studies of the physico-chemical behaviour of mixtures of proteins and simple salts in water [1, 2, 3, 4, 5, 6, 7, 8, 9, 10, 11, 12] are important to understand the stability of such mixtures and may yield improvements of methods for protein precipitation and crystallization [13, 14, 15, 16, 17, 18, 19, 20, 21, 22, 23, 24, 25, 26, 27, 28, 29, 30, 31, 32, 33, 34, 35, 36, 37, 38, 39]. The list of references presented here is far from being complete — there are more papers published than we can possibly mention. Protein aggregation may be desired or undesired. In the downstream processing, proteins should be salted-out in such a way that their native form is preserved. From the undesired viewpoint: the bio-pharmaceutical formulations should be free of aggregates, and their formation must be inhibited during storage [40]. Further, (the pathological) protein aggregation appears to be connected with several diseases [41]. A better understanding of the factors that influence the aggregation of proteins in a mixture with various salts is, therefore, of great importance.
The temperature-induced liquid-liquid phase separation in an aqueous protein-water solution was performed for lysozyme solutions, first reported by Ishimoto and Tanaka [42]. So far the method has been used many times [13, 15, 18, 22, 5], having proved to be useful in studying the salt-specific effects in protein solutions. Having cooled the protein solution at a constant concentration, a well-defined and reversible opacification is observed when a certain temperature, named , is reached. Above this temperature, the solution exists in one phase, while below the , two equilibrium phases are observed. The onset of the cloud-point temperature depends, not only on pH of the solution, but also on the electrolyte concentration and its nature or composition if several salts are present. For this reason, the measurements represent a useful tool in the studies of salt-specific effects in protein solutions.
A seminal study in this direction was contributed by Taratuta et al. [15]. These authors investigated the dependence of cloud-point temperature on the ionic strength of the sodium phosphate buffer (figure 2 of that paper). In the range of from to mol dm-3 and keeping constant, they found no change in cloud-point temperature upon further increase of the ionic strength of the buffer. It appears that due to strong electrostatic screening, the Coulomb part of the protein-protein interaction does not change upon further increase of the buffer concentration. In continuation of this interesting work, Taratuta and coworkers added low-molecular-mass salts to the buffer, at the same time decreasing the buffer content to keep the total ionic strength equal to mol dm-3. In other words, they varied the composition of the low-molecular-mass electrolyte, keeping its total ionic strength constant. In the present experimental study we follow this approach to examine the effects of the added low-molecular-mass salts on the stability of protein solutions.
Recently [38] we proposed a new approach to analyze the cloud-point temperature measurements. We modelled protein molecules as hard spheres, with a number of square-well attractive sites located on the surface. To obtain measurable quantities we applied the thermodynamic perturbation theory developed by Wertheim [43, 44]. The approach was used to analyze experimental data for in lysozyme solutions. The calculations provided good fits to the cloud-point curves of lysozyme in buffer-salt mixtures as a function of the type and concentration of salt. In a spirit of the chemical engineering theories, the approach was capable of predicting full coexistence curves, osmotic compressibilities and second virial coefficients within the domain of concentrations where were measured.
The work presented here is a continuation of our previous study [38] with one major difference that we analyze our own measurements performed recently. The review of literature revealed that experimental studies of salt-specific effects are rarely systematic: sometimes salts are added to protein solution in addition to buffer, sometimes alone, forming the protein-salt mixture. Further, for the chosen experimental method, the data collected in different laboratories may scatter much more than it is suggested by the precision of a single measurement. One reason for this lies in the details of protein solution preparation, which appears to be more important than it is actually recognized by most of the researchers. The protein solutions are prone to ‘‘age’’ and one can obtain different results with the freshly prepared or a few weeks old samples. Such differences can be seen even within a single paper [15].
Taking all these into account, and to avoid possible experimental inconsistencies, we decided to perform our own measurements on the well characterized solutions. The data were taken on lysozyme samples purchased from a single producer (Merck, Germany). We took all the necessary precautions in preparing the solutions, for details see the experimental part of the manuscript, to ensure a consistency of the results and a fair comparison with theory. The measurements were analyzed using the one-component model published recently [38]. Based on this analysis and on our new measurements, we predicted other thermodynamic quantities, including the full binodal curves and osmotic second virial coefficients for lysozyme in phosphate and acetate buffers in presence of low-molecular-mass salts.
2 Experimental details
2.1 Materials and solution preparations
Hen egg white lysozyme ( g mol-1) was purchased from Merck Milipore, product number 105281, lot K46535581 514. The alkali metal salts (%, KCl, NaCl, KBr, NaBr, NaI, NaNO3, NaH2PO2H2O, and Na2HPO4) were obtained from Merck Milipore as well, while CH3CH2COONa and NaSCN were obtained from Sigma Aldrich. The first step was preparation of the lysozyme-buffer and salt-buffer stock solutions. Dialyzing buffer was NaH2PO4/Na2HPO4 with ionic strength of 0.1 mol dm-3 and . Lysozyme was dissolved in buffer and dialyzed against it for 24 h, using the Spectra/Por Membrane® dialysis membrane with the cutoff of 3500 Da. During this time, the buffer was changed three times. Concentrations of protein and salts in stock solution were two times higher than in the solution used in measurements. As often for mixed electrolytes, the salt and buffer amounts are given in ionic strength, , where sum goes over all ionic species of salt, of concentration and electrovalence . For : salt is equal to its concentration, in mol dm-3.
The low-molecular-mass salts were in presence of P2O5 dried for two hours at C. Stock salt-buffer solutions were prepared in such a way that solid components were weighted and then filled with distilled water in a filling flask up to the mark. Mixtures of salts and protein were prepared just before the measurements. The lysozyme concentration was determined by measuring the absorbance at nm and C using a Cary 100 Bio (Varian) spectrophotometer, which uses the Peltier block for temperature regulation. The same instrument was used for the determination. The extinction coefficient of lysozyme was dm3g-1cm-1 at C. pH was measured using the Iskra pH meter model MA5740 (Ljubljana, Slovenia), using combined glass micro-electrode of type InLab 423 from Mettler Toledo (Schwerzenbach, Switzerland). pH of solutions were determined at the beginning and at the end of the experiment. The deviations from the desired pH values were always within .
2.2 Cloud-point temperature measurements
is defined as the temperature where upon cooling the first opacification is noticed in solution under study. The cloudiness was in our case detected by an increase in the solution absorbance at wavelength nm. As noticed before, the measured cloud-point temperatures may depend on the cooling rate [22]. In an initial investigation of the system, we measured at three different cooling rates: 0.1, 0.5, and C min-1 and extrapolated these results to cooling rate equal to zero. In the measurements reported here, we used the cooling rate equal to C min-1, which yields the results very close (within C) to the extrapolated value. Reversibility of the process was verified by warming up the sample above the and by cooling it again to repeat the measurement. Like some other authors before us, we measured both the and ; the latter is the temperature where the solution becomes clear again. The differences between these two temperatures were in the range from 1.0 to C, depending on the salt type and concentration. While other researchers [22] take the average of and as a final value, we report the actual values in our results. In view of the observed differences between and values, the absolute error in temperature of cloud-point determination is estimated to be between and C.
3 Theoretical part
The theoretical model used in this study [38] is based on the observation that the range and directionality of the attractive interactions between protein molecules determine their phase behaviour [45, 46, 20, 24, 47]. Previous studies suggested the appearance of a liquid-liquid coexistence region, which turns out to be meta-stable with respect to the solidification [24, 48, 19, 49]. This is in contrast with the behavior of the systems composed of van der Waals type of particles, where the range of interaction between molecules is comparable with their size. Theoretical methods suitable to the study of systems of molecules interacting with strong directional forces have been proposed by Wertheim [43, 44] and further developed by many other authors [50, 51]. The one-component model of protein solution, which in some aspects resembles simple water models [52, 53], has recently been used to analyze the experimental data for phase diagrams of lysozyme and -crystallin solutions [38]. For convenience of a reader, the descriptions of the model and theory are briefly repeated below.
We model the solution as a system of protein molecules with number density at temperature and volume . Protein molecule is pictured as a sphere of diameter with the attractive square-well sites through which it interacts with other protein molecules. The solution is treated as a quasi one-component system, where the solvent (water, buffer, and low-molecular-mass salt) merely modifies the interaction between solutes. We assume the protein-protein pair potential to be composed of: (i) the hard-sphere part and (ii) attractive contributions, , caused by the (short-range) square-well sites localized on the surface of the protein [43]
| (3.1) |
In this expression, () is the vector between the centers of molecules, is the vector connecting sites A and B on two different protein molecules and denotes the set of sites, see figure 1.
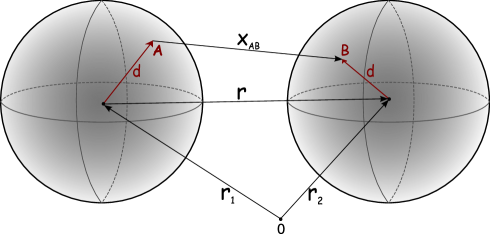
We examine the case where equal sites are distributed over the surface of the spherical protein; in other words, the displacement length is . The pairwise additive potential is then written as follows:
| (3.4) | |||||
| (3.7) |
Here, () is the square-well potential depth and is its range. The interaction between the sites is only effective for the site-site distance being smaller than . The multiple site bonding is prevented by applying the condition [43, 54]
| (3.8) |
As usually in such studies, the additivity of the free energy terms is assumed
| (3.9) |
where is the ideal part [55], is the hard-sphere part [56], while stands for the site-site association contribution [43, 44, 51]
| (3.10) |
where and is Boltzmann’s constant. The association parameter defines the average fraction of the molecules not bonded to any site [51]
| (3.11) |
Further, the term is related to the hard-sphere fluid through the radial distribution function via the expression [54]
| (3.12) |
The radial distribution function is calculated by the Ornstein-Zernike integral equation theory using the Percus-Yevick (PY) closure [55], yielding
| (3.13) |
where is the packing fraction of hard spheres. Further, , is the angular average of the Mayer function, obtained analytically [54]
| (3.14) |
Once the Helmholtz free energy, equation (3.9), is known, other thermodynamic quantities, among them the osmotic pressure and chemical potential of the protein species, , can be calculated. By using equations (3.10), (3.11) and (3.13), we get expressions for osmotic pressure and then for the chemical potential
| (3.15) | |||||
| (3.16) |
Ideal and hard sphere contributions to the free energy and pressure can be found elsewhere [55]. At this step we can calculate the cloud point temperature, as well as the whole liquid-liquid coexistence curve, by applying the Maxwell construction. Another important theoretical and experimental quantity is the second virial coefficient, , defined as:
| (3.17) |
We calculated this quantity as suggested by Bianchi et al. [32]
| (3.18) |
Here, is the second virial coefficient of hard spheres. Note that the integral in equations (3.12) and (3.18) can be calculated analytically. Model parameters used in calculations are given in table 1.
| [nm] | 3.430 |
|---|---|
| [nm] | 1.715 |
| [nm] | 0.180 |
| [g mol-1] | 14388 |
| 10 |
4 Results and discussion
4.1 Cloud-point temperatures for lysozyme-buffer-salt mixtures
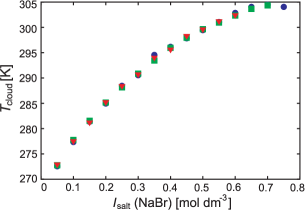
Taratuta et al. [15] noticed that after a sufficient amount of buffer is added, becomes insensitive to a further increase of ionic strength. This observation suggests that at certain ionic strength, the Coulomb interaction between proteins becomes sufficiently screened. We confirmed this finding for lysozyme in mixture with phosphate buffer () and NaBr (see figure 2). In this graph we present taken as a function of the ionic strength of the added sodium bromide () at a constant total ionic strength , with equal to 0.7, 0.8, and 0.9 mol dm-3, respectively. Symbols representing the measurements at different fall — within the experimental error — on the same curve. These results indicate that for a given value of , is insensitive to the variations above 0.6 mol dm-3. Due to the experimental limitations of our apparatus, no values could be determined below C.
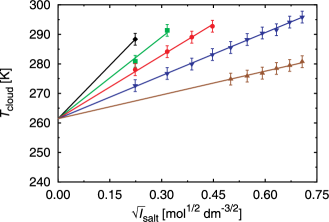
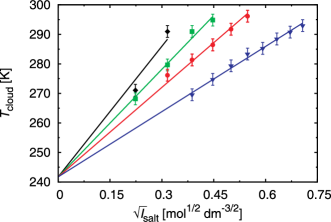
In figure 3, the experimental results for at , lysozyme concentration g dm-3, and total ionic strength ( + ) equal to 0.6 mol dm-3 are shown. Analogous results for acetate buffer are shown in figure 4. The experiments suggest a square root functional dependence between the and ionic strength of the added electrolyte. Notice that the at should be the same for all the salts. The extrapolated value of to , as we have already mentioned, this point is experimentally not accessible, is C. The salt-specific effects in measurements have been observed in several previous experimental papers [15, 5]. An increase of the cloud-point temperature can be interpreted as a decrease of stability of the system. Considering that the total ionic strength is constant for all the samples studied in figure 3, this instability has been ascribed to the salt adsorption occurring at the protein surface [15]. Lysozyme solutions at assume a positive net charge. That is why the effects of anions are strong.
In our model, the strength of the protein-protein attraction can only be regulated by the depth of the attractive square-well potential, . In view of the new experimental results, shown in figure 3, we suggest this quantity to be correlated with the ionic strength of the added low-molecular-mass salt () as follows:
| (4.1) |
The parameters of this equation, leading to a good agreement with experimental data for solutions in phosphate buffer, are given in table 2. As we see, the slope of equation (4.1) (parameter ) varies from salt to salt.
| [K dm3/2 mol-1/2] | [K] | |
|---|---|---|
| NaSCN | 1055 | 2293 |
| NaI | 807 | |
| NaNO3 | 625 | |
| NaBr | 426 | |
| NaCl | 235 |
The parameters leading to a good agreement with experimental data for acetate buffer, are given in table 3. The extrapolated value of at is in this case equal to C. It is of interest to correlate the slope in equation (4.1), which depends solely on the potential well-depth, with the hydration free energy of the salt anion. These results are shown in figure 5 for two different buffers — phosphate (lower curve) and acetate (upper curve). As we see, the two lines show the same trend. The ion dependent shift between the two lines seem to reflect the effects of the buffers present in systems. We see that, as found before for polyelectrolyte [58] and lysozyme solutions [38, 59], the strength of protein-protein interaction is roughly correlated with the free energy of counterion solvation .
| [K dm3/2 mol-1/2] | [K] | |
|---|---|---|
| NaSCN | 1293 | 2120 |
| NaI | 1065 | |
| NaNO3 | 886 | |
| KBr | 646 |
4.2 From to and liquid-liquid phase-diagram
We can use experimental information collected in tables (2) and (3), to calculate from equation (4.1) and then to predict full binodal curves under conditions (, ), where no such experiments have been done yet. These results are for NaBr and NaI in aqueous mixture of lysozyme shown in our next figure 6 in phosphate buffer, and in acetate buffer, for KBr and NaI. Notice that total ionic strength () is constant and equal to 0.6 mol dm-3, while varies.

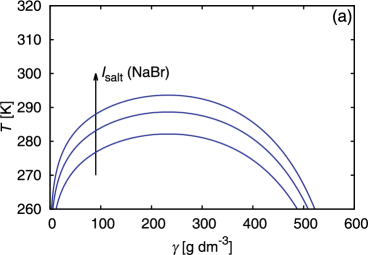
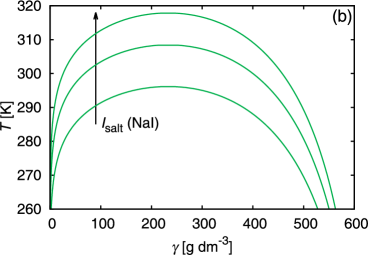
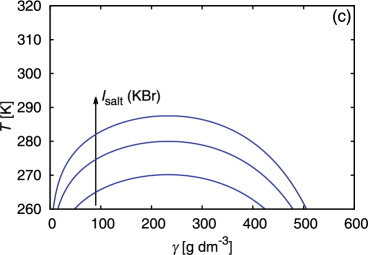
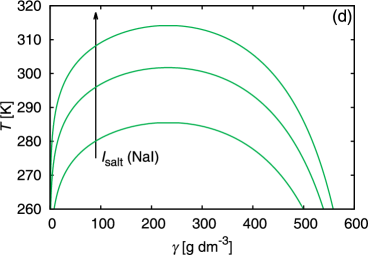
It is important to stress that for proteins, the liquid-liquid boundary is located below the solid-liquid boundary, indicating the meta-stability of such systems [24, 27]. When the saturated protein solution is cooled, it may undergo liquid-liquid phase transition before it actually crystalizes. This discriminates proteins from most of low-molecular weight mixtures, where such meta-stabilities were not observed. The liquid-liquid coexistence curve can be determined experimentally [18, 5].
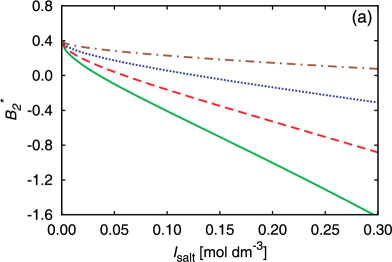
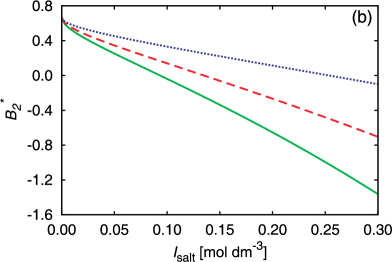
Another quantity of interest is the second virial coefficient , a critical parameter in controlling the protein aggregation. The latter process is of practical interest for pharmaceutical industry [40, 60]. Wilson and co-workers [61, 62] discovered that in order to grow well-defined crystals, the second virial coefficient should be slightly negative. The salt-specific effects can be observed also in figure 7. For each of the two buffers (they determine the pH of solutions), the reduced second virial coefficient decreases with increasing . The decrease is faster in case of the phosphate buffer (), where the protein net charge is around [63]. For a certain amount of the added low-molecular-mass salt, the stability of the solutions (as indicated by values) decreases in the order: . This is the so-called inverse Hofmeister series, which has been observed experimentally in several papers [5, 64]. Unfortunately, the experimental results for the exact conditions studied in figure 7 are not available so far.
5 Concluding remarks
We present new measurements of the cloud-point temperature, , for various lysozyme-buffer-salt mixtures. The salts mixed with the protein were NaSCN, NaI, NaNO3, NaBr, and NaCl in phosphate buffer () and NaSCN, NaI, NaNO3, and KBr in acetate buffer (). Our measurements, in agreement with some previous studies, suggest strong salt-specific effects. The values, after a certain amount of buffer is added, do not depend any more on the total ionic strength of the present electrolyte () but rather on its composition; i.e., on content. The cloud-point temperature values can be modelled as a function of the square root of ; cf. equation (4.1). From the measurements we extracted an information on the protein-protein interaction under conditions where varies. Using this information, we predicted the relevant liquid-liquid phase diagrams and reduced second virial coefficients. The critical temperature of the phase diagram increases with an increasing salt content, but for iodide salts, the effect is much stronger than for bromide salts. This holds true for both buffers studied here. The results for reduced second virial coefficients, , are consistent with these observations: the addition of iodide salt destabilizes the protein solutions more than the addition of bromide salt. We believe that the reason lies in a relatively high (comparing to Cl- or Br- ions) hydration free energy of I- ion, which is prone to release some hydration water upon binding to the protein charges. This assumption is supported by figure 5, where the correlation between the strength of the protein-protein interaction and the free energy of solvation of various counterions is shown.
Acknowledgements
This study was supported by the Slovenian Research Agency fund through the Program 0103–0201 and by NIH research grant GM063592. Miha Kastelic and Tadeja Janc were supported by the ARRS Grants for Young researchers.
References
- [1] Collins K.D., Biophys. J., 1997, 72, No. 1, 65; doi:10.1016/S0006-3495(97)78647-8.
-
[2]
Tavares F.W., Bratko D., Prausnitz J.M., Curr. Opin. Colloid Interface Sci.,
2004, 9, No. 1–2, 81;
doi:10.1016/j.cocis.2004.05.008. - [3] Finet S., Skouri-Panet F., Casselyn M., Bonneté F., Tardieu A., Curr. Opin. Colloid Interface Sci., 2004, 9, No. 1–2, 112; doi:10.1016/j.cocis.2004.05.014.
- [4] Zhang Y., Cremer P.S., Curr. Opin. Chem. Biol., 2006, 10, No. 6, 658; doi:10.1016/j.cbpa.2006.09.020.
- [5] Zhang Y., Cremer P.S., Proc. Natl. Acad. Sci. U.S.A., 2009, 106, No. 36, 15249; doi:10.1073/pnas.0907616106.
- [6] Kunz W., Neueder R., Specific Ion Effects, World Scientific, Singapore, 2009.
- [7] Kunz W., Curr. Opin. Colloid Interface Sci., 2010, 15, No. 1–2, 34; doi:10.1016/j.cocis.2009.11.008.
- [8] Ninham B.W., Lo Nostro P., Molecular Forces and Self Assembly: In Colloid, Nano Sciences and Biology, Cambridge University Press, Cambridge, 2010.
- [9] Parsons D.F., Boström M., Lo Nostro P., Ninham B.W., Phys. Chem. Chem. Phys., 2011, 13, No. 27, 12352; doi:10.1039/C1CP20538B.
- [10] Lo Nostro P., Ninham B.W., Chem. Rev., 2012, 112, No. 4, 2286; doi:10.1021/cr200271j.
- [11] Medda L., Carucci C., Parsons D.F., Ninham B.W., Monduzzi M., Salis A., Langmuir, 2013, 29, No. 49, 15350; doi:10.1021/la404249n.
- [12] Jungwirth P., Cremer P.S., Nat. Chem., 2014, 6, No. 4, 261; doi:10.1038/nchem.1899.
- [13] Thomson J.A., Schurtenberger P., Thurston G.M., Benedek G.B., Proc. Natl. Acad. Sci. U.S.A., 1987, 84, No. 20, 7079; doi:10.1073/pnas.84.20.7079.
- [14] Ries-Kautt M.M., Ducruix A.F., J. Biol. Chem., 1989, 264, No. 2, 745.
- [15] Taratuta V.G., Holschbach A., Thurston G.M., Blankschtein D., Benedek G.B., J. Phys. Chem., 1990, 94, No. 5, 2140; doi:10.1021/j100368a074.
-
[16]
Guilloteau J.P., Ries-Kautt M.M., Ducruix A.F., J. Cryst. Growth, 1992,
122, No. 1–4, 223;
doi:10.1016/0022-0248(92)90249-I. - [17] Coen C.J., Blanch H.W., Prausnitz J.M., AlChE J., 1995, 41, No. 4, 996; doi:10.1002/aic.690410430.
- [18] Broide M.L., Tominc T.M., Saxowsky M.D., Phys. Rev. E, 1996, 53, No. 6, 6325; doi:10.1103/PhysRevE.53.6325.
- [19] Rosenbaum D.F., Zukoski C.F., J. Cryst. Growth, 1996, 169, No. 4, 752; doi:10.1016/S0022-0248(96)00455-1.
-
[20]
Lomakin A., Asherie N., Benedek G.B., Proc. Natl. Acad. Sci. U.S.A., 1999,
96, No. 17, 9465;
doi:10.1073/pnas.96.17.9465. -
[21]
Rosenbaum D.F., Kulkarni A., Ramakrishnan S., Zukoski C.F., J. Chem. Phys.,
1999, 111, No. 21, 2114;
doi:10.1063/1.480328. - [22] Grigsby J.J., Blanch H.W., Prausnitz J.M., Biophys. Chem., 2001, 91, No. 3, 231; doi:10.1016/S0301-4622(01)00173-9.
-
[23]
Curtis R.A., Montaser A., Prausnitz J.M., Blanch H.W., Biotechnol. Bioeng.,
1998, 57, No. 1, 11;
doi:10.1002/(SICI)1097-0290(19980520)58:4<451::AID-BIT13>3.0.CO;2-E. - [24] Sear R., J. Chem. Phys., 1999, 111, No. 10, 4800; doi:10.1063/1.479243.
-
[25]
Moon Y.U., Anderson C.O., Blanch H.W., Prausnitz J.M., Fluid Phase
Equilib., 2000, 168, No. 2, 229;
doi:10.1016/S0378-3812(99)00337-4. - [26] Curtis R.A., Urlich J., Montaser A., Prausnitz J.M., Blanch H.W., Biotechnol. Bioeng., 2002, 79, No. 4, 367; doi:10.1002/bit.10342.
-
[27]
Tavares F.W., Bratko D., Blanch H.W., Prausnitz J.M., J. Phys. Chem. B,
2004, 108, No. 26, 9228;
doi:10.1021/jp037809t. - [28] Tavares F.W., Bratko D., Striolo A., Blanch H.W., Prausnitz J.M., J. Chem. Phys., 2004, 120, No. 20, 9859; doi:10.1063/1.1697387.
- [29] Tavares F.W., Prausnitz J.M., Colloid Polym. Sci., 2004, 282, No. 6, 620; doi:10.1007/s00396-003-0987-x.
- [30] Boström M., Tavares F.W., Finet S., Skouri-Panet F., Tardieu A., Ninham B.W., Biophys. Chem., 2005, 117, No. 3, 217; doi:10.1016/j.bpc.2005.05.010.
-
[31]
Zhang Y., Furyk S., Bergbreiter D.E., Cremer P.S., J. Am. Chem. Soc., 2005,
127, No. 41, 14505;
doi:10.1021/ja0546424. -
[32]
Bianchi E., Largo J., Tartaglia P., Zaccarelli E., Sciortino F., Phys. Rev.
Lett., 2006, 97, No. 16, 168301;
doi:10.1103/PhysRevLett.97.168301. - [33] Lima E.R.A., Biscaia E.C., Bostrom M., Tavares F.W., Prausnitz J.M., J. Chem. Phys. C, 2007, 111, No. 43, 16055; doi:10.1021/jp074807q.
- [34] Annunziata O., Payne A., Wang Z., J. Am. Chem. Soc., 2008, 130, No. 40, 13347; doi:10.1021/ja804304e.
- [35] Mehta C.M., White E.T., Lister J.T., Biotechnol. Progr., 2011, 28, No. 1, 163; doi:10.1002/btpr.724.
- [36] Zhang L., Zhang J., Mol. Pharmaceutics, 2012, 9, No. 9, 2582; doi:10.1021/mp300183a.
- [37] Quang L.J., Sandler S.I., Lenhoff A.M., J. Chem. Theory Comput., 2014, 10, No. 2, 835; doi:10.1021/ct4006695.
- [38] Kastelic M., Kalyuzhnyi Y.V., Hribar-Lee B., Dill K.A., Vlachy V., Proc. Natl. Acad. Sci. U.S.A., 2015, 112, No. 21, 6766; doi:10.1073/pnas.1507303112.
- [39] Gunton J.D., Shiryayev A., Pagan D.L., Protein Condensation: Kinetic Pathways to Crystallization and Disease, Cambridge University Press, Cambridge, 2007.
- [40] Frokjaer S., Otzen D.E., Nat. Rev. Drug Discovery, 2005, 4, No. 4, 298; doi:10.1038/nrd1695.
- [41] Chiti F., Dobson C.M., Ann. Rev. Biochem., 2006, 75, 333; doi:10.1146/annurev.biochem.75.101304.123901.
- [42] Ishimoto C., Tanaka T., Phys. Rev. Lett., 1977, 39, No. 8, 474; doi:10.1103/PhysRevLett.39.474.
- [43] Wertheim M.S., J. Stat. Phys., 1986, 42, No. 3–4, 459; doi:10.1007/BF01127721.
- [44] Wertheim M.S., J. Stat. Phys., 1986, 42, No. 3–4, 477; doi:10.1007/BF01127722.
- [45] Ten Wolde R.R., Frenkel D., Science, 1997, 277, No. 5334, 1975; doi:10.1126/science.277.5334.1975.
- [46] Lomakin A., Asherie N., Benedek G.B., J. Chem. Phys., 1996, 104, No. 4, 1646; doi:10.1063/1.470751.
- [47] Rosch T.W., Errington J.R., J. Phys. Chem. B, 2007, 111, No. 43, 12591; doi:10.1021/jp075455q.
- [48] Broide M.L., Berland C.R., Pande J., Ogun O.O., Benedek G.B., Proc. Natl. Acad. Sci. U.S.A., 1991, 88, No. 13, 5660; doi:10.1073/pnas.88.13.5660.
- [49] Muschol M., Rosenberger F., J. Chem. Phys., 1997, 107, No. 6, 1953; doi:10.1063/1.474547.
-
[50]
Kalyuzhnyi Y.V., Vlachy V., Cummings P.T., Chem. Phys. Lett., 2007,
438, No. 4–6, 238;
doi:10.1016/j.cplett.2007.03.028. - [51] Chapman W.G., Jackson G., Gubbins K., Mol. Phys., 1988, 65, No. 5, 1057; doi:10.1080/00268978800101601.
- [52] Kolafa J., Nezbeda I., Mol. Phys., 1987, 61, No. 1, 161; doi:10.1080/00268978700101051.
- [53] Bizjak A., Urbic T., Vlachy V., Dill K.A., J. Chem. Phys., 2009, 131, No. 19, 194504; doi:10.1063/1.3259970.
- [54] Wertheim M.S., J. Chem. Phys., 1986, 85, No. 5, 2929; doi:10.1063/1.451002.
- [55] Hansen J.P., McDonald I.R., Theory of Simple Liquids, Elsevier, Amsterdam, 2006.
- [56] Mansoori G.A., Carnahan N.F., Starling K.E., Leland T.W., J. Chem. Phys., 1971, 54, 1523; doi:10.1063/1.1675048.
- [57] Marcus Y., Ion Properties, Marcel Dekker, New York, 1997.
-
[58]
Seručnik M., Bončina M., Lukšič M., Vlachy V., Phys. Chem. Chem. Phys.,
2012, 14, No. 19, 6805;
doi:10.1039/C2CP40571G. - [59] Bončina M., Reščič J., Lah J., Vlachy V., J. Phys. Chem. B, 2010, 114, No. 12, 4313; doi:10.1021/jp9071845.
- [60] Valente J.J., Payne R.W., Manning M.C., Wilson W.W., Henry C.S., Current Pharm. Biotechnol., 2005, 6, No. 6, 427; doi:10.2174/138920105775159313.
- [61] George A., Wilson W.W., Acta Crystallogr. D, 1994, 50, No. 4, 361; doi:10.1107/S0907444994001216.
-
[62]
George A., Chiang Y., Guo B., Arabshahi A., Cai Z., Wilson W.W., Methods
Enzymol., 1997, 276, 100;
doi:10.1016/S0076-6879(97)76052-X. - [63] Kuehner D.E., Engmann J., Fergg F., Wernick M., Blanch H.W., Prausnitz J.M., J. Phys. Chem. B, 1999, 103, No. 8, 1368; doi:10.1021/jp983852i.
- [64] Bončina M., Reščič J., Vlachy V., Biophys. J., 2008, 95, No. 3, 1285; doi:10.1529/biophysj.108.128694.
Ефекти специфiки солi в розчинах лiзозиму Т. Янч, М. Кастелiч, М. Бончiна, В. Влахi
Факультет хiмiї i хiмiчної технологiї, Унiверситет Любляни, вул. Вечна, 113, 1000 Любляна, Словенiя