Continued decay in the cyclotron line energy in Hercules X-1
The centroid energy of the cyclotron line in the spectrum of the binary X-ray pulsar Her~X-1 has been found to decrease with time on a time scale of a few tens of years - surprisingly short in astrophysical terms. This was found for the pulse phase-averaged line centroid energy using observational data from various X-ray satellites over the time period 1996 to 2012, establishing a reduction of 4 keV. Here we report on the result of a new observation by NuSTAR performed in August 2015. The earlier results are confirmed and strengthened with respect to both the dependence of on flux (it is still present after 2006) and the dependence on time: the long-term decay continued with the same rate, corresponding to a reduction of 5 keV in 20 years.
Key Words.:
magnetic fields, neutron stars, – radiation mechanisms, cyclotron scattering features – accretion, accretion columns – binaries: eclipsing – stars: Her X-1 – X-rays: general – X-rays: stars1 Introduction
This note is a continuation, an update, and an extension of Staubert et al. (2014), hereafter “Paper 1”, which established the long-term change in the cyclotron line energy in Her X-1. For the introduction to this source, a well-studied accreting X-ray binary pulsar, we therefore refer to Paper 1, except for brief remarks on the cyclotron line. The continuum spectrum (a power law with exponential cutoff) is modified by a line-like feature. This feature, discovered in 1976 in a balloon observation (Trümper et al., 1978), has been re-measured numerous times and is now generally accepted as an absorption feature around 40 keV due to resonant scattering of photons off electrons on quantized energy levels (Landau levels) in the teragauss magnetic field at the polar cap of the neutron star. The feature is therefore also referred to as a cyclotron resonant scattering feature (CRSF). The energy spacing between the Landau levels is given by = eB/(mec) = 11.6 keV , where =B/1012 G, providing a direct method of measuring the magnetic field strength at the site of the emission of the X-ray spectrum. The observed line energy is subject to gravitational redshift at the location where the line is formed, such that the magnetic field can be estimated by = (1+z) /11.6 , with being the observed cyclotron line energy. The discovery of the cyclotron feature in the spectrum of Her X-1 provided the first ever direct measurement of the magnetic field strength of a neutron star, in the sense that no other model assumptions are needed. Originally considered an exception, cyclotron features are now known to be rather common in accreting X-ray pulsars; binary pulsars have now been confirmed as cyclotron line sources (Caballero & Wilms, 2012).
The centroid energy of the cyclotron line of Her X-1 has been found to
vary systematically with respect to the following variables:
- Variation with phase of the 1.24 s pulsation, with a peak-to-peak
amplitude of % (Voges et al., 1982; Vasco et al., 2013);
- Variation with X-ray luminosity, on both long and on short time
scales (Staubert et al., 2007; Klochkov et al., 2011);
- Variation with phase of the 35 d precessional period (albeit
rather weak) (see Paper 1);
- Variation with time: 1) a rather sharp jump upwards in energy around 1992
(Gruber et al. 2001, Paper 1), and
2) a true decrease in the phase-averaged line energy after 1993 with
a magnitude of keV over 20 years
(Paper 1; Staubert 2014; Klochkov et al. 2015).
Here we present the results of a new measurement of the line energy by NuSTAR, performed in August 2015. The earlier results presented in Paper 1, Staubert (2014), and Klochkov et al. (2015) are confirmed and strengthened with respect to both the dependence of on flux (it is still present after 2006) and the dependence on time: the long-term decay continued at the same rate.
2 Observations
Her X-1 was observed on August 3–4, 2015, in a campaign coordinated by NuSTAR (Harrison et al., 2013) and INTEGRAL (Winkler et al., 2003). For this contribution we restrict ourselves to the results of the first 13.5 hr NuSTAR observation (ObsIDs 90102002002, MJD 57237.70 – 57238.26) with a total on-source integration time of 27.1 ksec. This is a Main-On observation of 35-day cycle 457 at phase 0.13111For cycle number and phase see Staubert et al. (1983, 2013). The mean NuSTAR count rate during this time was cts/s (5-79 keV). This count rate is very low for Her X-1, but turned out to be quite useful since it extended the dynamical range of observed fluxes (in fact the lowest level at which the cyclotron line energy has ever been measured). We note that for comparing flux, we use the maximum Main-On flux in units of RXTE/ASM-cts/s, as today it is determined through the monitoring observations by Swift/BAT. The conversion between these two units is as follows: (2-10 keV ASM-cts/s) = 93.0 (15-50 keV BAT-cts cm-2 s-1). We determined the relationship by using flux measurements of times when both instruments operated simultaneously (see the Appendix). The corresponding Main-On-flux for cycle 457 was ) ASM-cts/s. We have verified that the maximum flux of the Main-On is a good measure of the luminosity of the source during the cycle (Vasco et al., 2011).
For this work we have neglected the point measured by INTEGRAL in 2012 because of the unexplained high value (see discussion in Paper 1). A re-analysis of these data with the newest calibration, which will be contained in the new analysis software (OSA-11)222http://www.isdc.unige.ch/integral/analysis#Software, to be released later this year, has shown, that this data point indeed needs to be corrected downward. A publication in which calibration issues and the evolution of the various software releases will be discussed in depth is in preparation. We also stress that the inclusion of this point (even with the high value) in no way alters the fit results and the overall conclusions (the statistical weight is simply too low). The results of the other observations from the Agust 2015 campaign will be presented elsewhere.333The data from the simultaneous observations by NuSTAR and INTEGRAL will allow the respective inter-calibration to be studied again.
3 Spectral results
The spectral analysis was performed using the standard software as part of HEASoft444http://heasarc.nasa.gov/lheasoft (Version 6.16) provided by the NuSTAR team. NuSTAR employs two focussing X-ray telescopes allowing observations in the 3–79 keV energy range, each with its own CdZnTe pixel detector (Harrison et al., 2013). The calibration of these instruments is described in Madsen et al. (2015). For the Her X-1 analysis, detector events from a region of 120 arcsec radius around the source position were used. A region at the periphery of the field of view with a radius of 80 arcsec was used for background determination (with 1.510-3 of the Her X-1 flux, which is negligible). Both telescopes/detectors were used to generate spectra in the 5–79 keV range. When combining these data for a common spectrum, a normalization factor was a free parameter.
For the spectral model we chose the highecut555 http://heasarc.nasa.gov/xanadu/xspec/manual/ model, which is based on a power law continuum with exponential cut-off; the CRSF is modeled by a multiplicative absorption line with a Gaussian optical depth profile. In order to smooth the jump in the derivative of the highecut function at Ecut, a multiplicative Gaussian was used, as in Coburn et al. (2002). The spectral fit is good (reduced =1.14 for 1777 degrees of freedom (dof)), yielding parameters that are very consistent with those found previously. The observed centroid energy of the CRSF is = keV. Throughout this work uncertainties quoted are at the 1 () level.
4 Variation of with luminosity
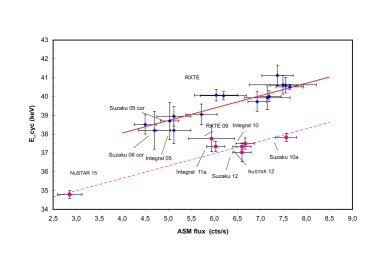
After the first observations of Her X-1 by RXTE in 1996 and 1997 which yielded values slightly lower than those of CGRO/BATSE and Beppo/SAX a few years earlier, we had suspected that there might be a slow decay of with time. This motivated repeated and successful observing proposals over the following two decades. In a series of RXTE observations until 2005, the apparent decrease seemed to continue until this date. While working with a uniform set of RXTE data between 1996 and 2005 trying to establish this decrease, we instead discovered that there was a dependence of on X-ray flux (Staubert et al., 2007). This degraded the suspected decrease with time significantly, such that it was neglected at this time. The correlation found between and flux (luminosity) was positive, i.e., the cyclotron line energy increases with increasing X-ray luminosity . Her X-1 was thus the first source that showed the opposite behavior to those high luminosity transient sources in which a negative correlation had already been seen in 1995 (Mihara, 1995). Today we know more confirmed sources with a positive correlation than with the negative one, see Sect. 7.
Figure 1 reproduces the correlation graph of Paper 1 (Fig. 1) with the new data point added (“NuSTAR 15”): the observed pulse phase averaged CRSF centroid energy is = keV. As noted in Paper 1, the values after 2006 are significantly lower than those before, which already clearly signals a decrease in the cyclotron line energy with time. In the earlier plot of 2014 the flux dependence for data after 2006 was less obvious. The new data point nicely confirms our previous assumption that the same flux dependence prevailed after 2006 (dotted red line in Fig. 1 is a fit through the data after 2006 with the same slope as the solid red line).
5 Variation of with time: the long-term decay
The long-term decay of the pulse phase-averaged cyclotron line energy was finally established by Staubert et al. (2014) (Paper 1) using data from different observatories taken between 1996 and 2012. A linear reduction in of 5 keV over a time frame of 20 yrs was measured with high significance ( standard deviations).
Here, we add the latest data point taken by NuSTAR in August 2015. First, we consider the time evolution of the flux-normalized for two different time periods: 1996 – 2006 and 2006 – 2015 (separated at MJD 54000) . The normalization to the reference flux of 6.8 ASM-cts/s was done using a slope of 0.44 keV per ASM-cts/s, which is the best fit slope from the simultaneous flux- and time-dependence of the previous data set. The slopes for those two time periods are keV/day and keV/day, respectively, constituting a significant steepening in the later period.
We then repeat the simultaneous fit with two variables (the dependence on X-ray flux and the dependence on time) as in Paper 1, with the NuSTAR 2015 point added, such that the complete data set of 1996 – 2015 is used.666All points in this data set are from observations taken during the Main-On of Her X-1 at 35 d phases less than 0.2. In order to separate the two variables, the following function was used:
| (1) |
with being the X-ray flux (the maximum flux of the respective 35d cycle) in units of ASM-cts/s, as observed by RXTE/ASM (and/or Swift/BAT), with = 6.80 ASM-cts/s, and being time in MJD with = 53500. The bi-linear fit is a good description of the complete 1996–2015 data set. The fit parameters are given in Table LABEL:tab:3D_3. A comparison of the fit parameters with those of fit No. 4 in Table 4 of Paper 1, shows that all parameters are unchanged (only the uncertainty of parameter “a” describing the flux dependence is slightly smaller now).
| E0 | dof | |||
| [keV/ASM-cts/s] | [ keV/d] | |||
| 20.4 | 19 |
Equation (1) constitutes a plane in 3D space defined by the three quantities ASM-flux, time, and . In principle, the situation could be displayed by a 3D plot. Such a plot (also including the data points), however, is not easy to read in practice. We therefore show two corresponding 2D plots that make use of normalized values.
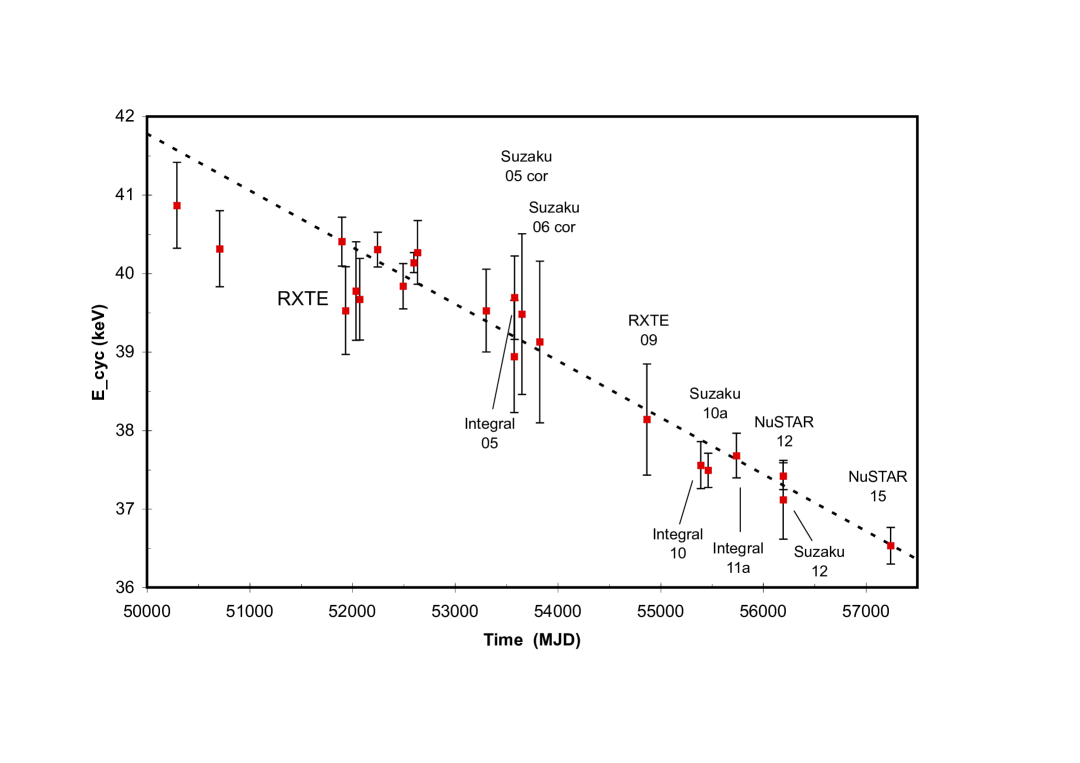
1) We normalized the observed values to the reference flux of 6.8 (ASM-cts/s) using the flux dependence found in the simultaneous fit and plotted it against time. Figure 2 shows the remaining linear time dependence of , demonstrating the long-term decay of with a slope of keV/day (or keV/yr) . The dashed line is the linear best fit. The new data point (“NuSTAR 15”) is very consistent with the earlier data.
2) We normalize the observed values to the reference time T0 = MJD 53500 using the time dependence found in the simultaneous fit and plotte against flux. Figure 3 shows the remaining linear flux dependence of . The slope is keV/(ASM-cts/s), which is the same as in Paper 1, but slightly lower than the value first found in the discovery paper of Staubert et al. (2007), where only data until 2005 and no time dependence were considered.
After including the 2015 data point of NuSTAR, the fact noted in Paper 1 that the fit is slightly better when an additional quadratic term () in the time dependence is introduced, continues to be valid: E0 = keV, = keV/ASM-cts/s, = keV/d, and = keV/d2, with = 16.7 for 18 degrees of freedom. The improvement in with respect to the purely linear fit is, however, marginal; an F-test gives a probability of 6.1% for the improvement in being by chance when introducing the quadratic term.
If we determine the decay rate of in the very recent time frame, using only the two values measured by NuSTAR in 2012 and 2015, we find keV/day. We note that, owing to the very accurate measurements by NuSTAR, the uncertainty is quite small (similar to that of the fit to the complete data).
We also refer to the independent analysis of spectral measurements by Swift/BAT, which confirms the decay of over the time frame 2005–2014 (Klochkov et al., 2015). In this work each data point is an average over several 35-day cycles, neglecting (in a sense averaging over) the flux dependence of the cyclotron line energy. Adding these points (which generally have larger uncertainties) to the previous data set, we find that they closely match the earlier picture and the parameters of the linear fit (simultaneous in flux and time) are not changed. However, owing to the wider spread of the BAT data, the reduced is significantly increased (from to beyond 3).
With reference to the Appendix and Fig. 5 we need to modify the statement made in Paper 1 that the mean maximum X-ray flux (when averaged over several 35d cycles) is constant. A new analysis has now found that the data of the last 20 yrs formally define a slight flux reduction of ASM-cts/s. We note, however, that the scattering of the individual maximum flux measurements is on the same order of magnitude, the observed variation over several 35d cycles can even exceed 100% (a factor of two).
6 Summary of observational results
The current situation regarding the variation of the phase-averaged cyclotron line energy with luminosity and with time is the following:
-
1.
The latest measurement of confirms that the long-term decay of the cyclotron line energy continues as before, with a rate of keV/yr (see Fig. 2). An independent confirmation of the decay is provided by Swift/BAT observations for the time interval 2005–2014 (Klochkov et al., 2015). This work provides an idea about the evolution of the originally measured (not flux normalized) values, in a similar way to that in Fig. 4 of Paper 1.
-
2.
The dependency of on flux (or luminosity) as detected by Staubert et al. (2007) is still valid after 2006 (see Fig. 1 and Fig. 3). In the combined flux- and time-dependent analysis of the data available until 2012 (Paper 1) this was an assumption that has now been nicely confirmed (with the help of the accidentally low flux during the last observation - even though regrettable from the statistics point of view).
We would like to add another remark related to the unusually low flux level that we encountered during the 2015 NuSTAR observation. We have since realized that Her X-1 was on its way to a new anomalous low that was reached around MJD 57340. Such lows happen irregularly on a time scale of 5 yrs or 10 yrs. It is a known feature that the flux fades gradually when going into such a low (Coburn et al., 2000). We would like to point out that the perfect correlation between flux and (Fig. 3) indicates a true reduction of luminosity (accretion rate) in the source, and not a reduction in observable flux by a progressing shading of the X-ray emitting region by the accretion disk. This view is further supported by the fact that the entrance into a new anomalous low coincides with a strong spin-down777The Gamma Ray Burst Monitor (GBM) on Fermi provides pulse frequencies: http:/gammaray.msfc.nasa.gov/gbm/science/pulsars.html (owing to a reduced mass accretion rate).
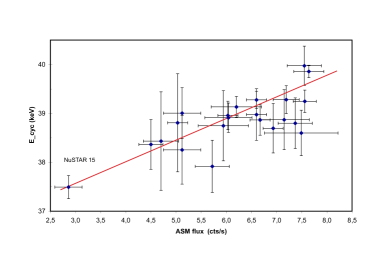
Figure 3: Her X-1 pulse-phase-averaged cyclotron line energies normalized to the reference time MJD 53500 using a time dependence of keV. The new time-normalized NuSTAR 2015 value is keV . The solid line defines the linear best fit for the flux dependence of with a slope of 0.44 keV/(ASM-cts/s).
-
3.
It is conceivable that the decay of is actually accelerating with time. Even though the combined fit with a quadratic term in the time dependence yields only marginal evidence for a true (negative) quadratic term, a change in the decay rate is supported by the following two facts. First, using flux-normalized values, we find that the decay of is stronger during the more recent period 2006–2015 than during 1996–2006 (see Section 5). This steepening is highly significant, and is in line with the remark already made in Paper 1 that in the earlier period the flux dependence is the dominant effect, while in the later period it is the time dependence. Second, using the two observations by NuSTAR in 2012 and 2015 alone, a decay rate of keV/day is found, which is slightly steeper than the slope for the overall decay from 1996–2015 (see Table LABEL:tab:3D_3).
-
4.
The slight flux reduction of 15% between 1996 and 2016 (see Fig. 5 in the Appendix) corresponds to a reduction in by 0.4 keV, when the found flux dependence of -0.44 keV/(ASM-cts/s) (see Table LABEL:tab:3D_3) is applied. We emphasize that this in no way interferes with the reduction of with time (by 5 keV over 20 yrs), since the long-term flux variation is also taken into account when the two-variable fit (Eq. 1) is applied.
7 Discussion
How common are the two dependencies of - on luminosity and on time - among binary X-ray pulsars? With regard to the dependence on luminosity, the negative correlation (a decrease in with increasing ), was actually discovered first: in high luminosity transient sources from observations by Ginga (Mihara, 1995). However, of the three sources originally quoted (V 0332+53, 4U 0115+63, and Cep X-4) only one, V 0332+53, can today be considered a secure source.888http://users.ph.tum.de/ga24wax/2015_W6_slides/Staubert_Talk.pdf In Cep X-4 the effect was never confirmed, and in 4U 0115+63, although apparently re-measured (Tsygankov et al., 2006; Nakajima et al., 2006; Tsygankov et al., 2007; Klochkov et al., 2011), Müller et al. (2013) have shown that the anti-correlations are most likely an artifact introduced by the way the continuum was modeled (see also Iyer et al. (2015)).
To the contrary, the positive correlation was only discovered in 2007 by Staubert et al. (2007) in Her X-1, a persistent medium luminosity source. Since then four more sources (all at moderate to low luminosities) have been found with increasing with increasing luminosity: GX 304-1 (Yamamoto et al., 2011; Klochkov et al., 2012), Vela X-1 (Fürst et al., 2014), A 0535+26 (Klochkov et al., 2011; Sartore et al., 2015) and Cep X-4 (Fürst et al., 2015). As noted above, Cep X-4 is among those sources that were originally considered to show a negative corelation (Mihara, 1995), even though the evidence for this source was not very strong and it was never confirmed. It would, however, be quite interesting to find both behaviors (positive and negative correlation) in the same source at very different luminosities. The postive / correlation might well be a general property of binary X-ray pulsars at low to medium luminosties.
With regard to the long-term change of the cyclotron line energy, Her X-1 is the first and still the only object, for which this phenomenon has been securely established.999 There are indications, though still fairly weak, for the opposite behavior in 4U 1538522 (Hemphill et al., 2014).
For the physical interpretation of the observed phenomena, / correlation and the long-term change of , we refer to the discussions in Paper 1 and Staubert (2014). Here we re-iterate only the following general ideas.
We assume that we can distinguish between two accretion regimes: (super-critical) and (sub-critical). The early explanation for the decrease of with increasing at super-critical accretion is still popular: based on Basko & Sunyaev (1976), who had shown that the height of the radiative shock above the neutron star surface should grow linearly with increasing accretion rate, Burnard et al. (1991) noted that this means a reduction in field strength and therefore in . For the positive / correlation (first seen in Her X-1), Staubert et al. (2007) had proposed that at sub-critical accretion the stopping mechanism of the accreted material is not photon pressure, but is due instead to Coulomb interactions (Nelson et al., 1993), which should lead to the opposite behavior (see also Becker et al. 2012). An alternative explanation, not connected to the height of line emitting region, is to assume changes in the B-field configuration (orginally assumed to be a dipole field), suffering distortions due to loading with a variable amount of accreted material (Mukherjee & Bhattacharya, 2012). Recently, a new idea has been put forward by Mushtukov et al. (2015), suggesting that a variation in accretion rate should lead to a variation in the velocity distribution of the infalling material in which the cyclotron line is assumed to be generated, such that a variable Doppler effect is responsible for a shift in the observed line energy.
Regarding the long-term change of the cyclotron line energy, we repeat here our earlier suggestion (Staubert, 2014) that a slight imbalance between the rate of accretion and the rate of “losing” material at the bottom of the accretion mound, either by incorporation into the neutron star crust or leaking of material to larger areas of the neutron star surface (Mukherjee et al., 2013, 2014), can lead to a change in the mass loading and consequently in the structure of the accretion mound (height or B-field configuration).
Acknowledgements.
The motivation for this paper are new observational data taken by the NASA satellite NuSTAR. We would like to acknowledge the dedication of all the people who have contributed to the great success of this mission, here especially Karl Forster for his effort with respect to the non-standard scheduling of the observations. Further important data were provided by the equally successful missions RXTE and Swift of NASA and INTEGRAL of ESA. This work was supported by the Deutsche Forschungsgemeinschaft (DFG) through joint grants KL 2734/2-1 and WI 1860/11-1. We thank the anonymous referee for useful comments and suggestions.References
- Barthelmy et al. (2005) Barthelmy, S. D., Barbier, L. M., Cummings, J. R., et al. 2005, Space Science Reviews, 120, 143
- Basko & Sunyaev (1976) Basko, M. M. & Sunyaev, R. A. 1976, MNRAS, 175, 395
- Becker et al. (2012) Becker, P. A., Klochkov, D., Schönherr, G., et al. 2012, A&A, 544, A123
- Burnard et al. (1991) Burnard, D. J., Arons, J., & Klein, R. I. 1991, ApJ, 367, 575
- Caballero & Wilms (2012) Caballero, I. & Wilms, J. 2012, Mem. Soc. Astron. Italiana, 83, 230
- Coburn et al. (2002) Coburn, W., Heindl, W. A., Rothschild, R. E., et al. 2002, ApJ, 580, 394
- Coburn et al. (2000) Coburn, W., Heindl, W. A., Wilms, J., et al. 2000, ApJ, 543, 351
- Fürst et al. (2015) Fürst, F., Pottschmidt, K., Miyasaka, H., et al. 2015, ApJ, 806, L24
- Fürst et al. (2014) Fürst, F., Pottschmidt, K., Wilms, J., et al. 2014, ApJ, 780, 133
- Gruber et al. (2001) Gruber, D. E., Heindl, W. A., Rothschild, R. E., et al. 2001, ApJ, 562, 499
- Harrison et al. (2013) Harrison, F. A., Craig, W. W., Christensen, F. E., et al. 2013, ApJ, 770, 103
- Hemphill et al. (2014) Hemphill, P. B., Rothschild, R. E., Markowitz, A., et al. 2014, ApJ, 792, 14
- Iyer et al. (2015) Iyer, N., Mukherjee, D., Dewangan, G. C., Bhattacharya, D., & Seetha, S. 2015, MNRAS, 454, 741
- Klochkov et al. (2012) Klochkov, D., Doroshenko, V., Santangelo, A., et al. 2012, A&A, 542, L28
- Klochkov et al. (2015) Klochkov, D., Staubert, R., Postnov, K., et al. 2015, A&A, 578, A88
- Klochkov et al. (2011) Klochkov, D., Staubert, R., Santangelo, A., Rothschild, R. E., & Ferrigno, C. 2011, A&A, 532, A126
- Klochkov et al. (2006) Klochkov, D. K., Shakura, N. I., Postnov, K. A., et al. 2006, Astronomy Letters, 32, 804
- Levine et al. (1996) Levine, A. M., Bradt, H., Cui, W., et al. 1996, ApJ, 469, L33
- Madsen et al. (2015) Madsen, K. K., Harrison, F. A., Markwardt, C. B., et al. 2015, ApJS, 220, 8
- Mihara (1995) Mihara, T. 1995, PhD thesis, Univ. of Tokyo
- Mukherjee & Bhattacharya (2012) Mukherjee, D. & Bhattacharya, D. 2012, MNRAS, 420, 720
- Mukherjee et al. (2013) Mukherjee, D., Bhattacharya, D., & Mignone, A. 2013, MNRAS, 435, 718
- Mukherjee et al. (2014) Mukherjee, D., Bhattacharya, D., & Mignone, A. 2014, in European Physical Journal Web of Conferences, Vol. 64, European Physical Journal Web of Conferences, 2004
- Müller et al. (2013) Müller, S., Ferrigno, C., Kühnel, M., et al. 2013, A&A, 551, A6
- Mushtukov et al. (2015) Mushtukov, A. A., Tsygankov, S. S., Serber, A. V., Suleimanov, V. F., & Poutanen, J. 2015, MNRAS, 454, 2714
- Nakajima et al. (2006) Nakajima, M., Mihara, T., Makishima, K., & Niko, H. 2006, ApJ, 646, 1125
- Nelson et al. (1993) Nelson, R. W., Salpeter, E. E., & Wasserman, I. 1993, ApJ, 418, 874
- Sartore et al. (2015) Sartore, N., Jourdain, E., & Roques, J. P. 2015, ApJ, 806, 193
- Staubert (2014) Staubert, R. 2014, in PoS(INTEGRAL2014)024
- Staubert et al. (1983) Staubert, R., Bezler, M., & Kendziorra, E. 1983, A&A, 117, 215
- Staubert et al. (2009) Staubert, R., Klochkov, D., Postnov, K., et al. 2009, A&A, 494, 1025
- Staubert et al. (2013) Staubert, R., Klochkov, D., Vasco, D., et al. 2013, A&A, 550, A110
- Staubert et al. (2014) Staubert, R., Klochkov, D., Wilms, J., et al. 2014, A&A, 572, A119
- Staubert et al. (2007) Staubert, R., Shakura, N. I., Postnov, K., et al. 2007, A&A, 465, L25
- Tananbaum et al. (1972) Tananbaum, H., Gursky, H., Kellogg, E. M., et al. 1972, ApJ, 174, L143
- Trümper et al. (1978) Trümper, J., Pietsch, W., Reppin, C., et al. 1978, ApJ, 219, L105
- Tsygankov et al. (2006) Tsygankov, S. S., Lutovinov, A. A., Churazov, E. M., & Sunyaev, R. A. 2006, MNRAS, 371, 19
- Tsygankov et al. (2007) —. 2007, Astronomy Letters, 33, 368
- Vasco et al. (2011) Vasco, D., Klochkov, D., & Staubert, R. 2011, A&A, 532, A99
- Vasco et al. (2013) Vasco, D., Staubert, R., Klochkov, D., et al. 2013, A&A, 550, A111
- Voges et al. (1982) Voges, W., Pietsch, W., Reppin, C., et al. 1982, ApJ, 263, 803
- Winkler et al. (2003) Winkler, C., Courvoisier, T. J.-L., Di Cocco, G., et al. 2003, A&A, 411, L1
- Yamamoto et al. (2011) Yamamoto, T., Sugizaki, M., Mihara, T., et al. 2011, PASJ, 63, 751
Appendix A Determination of X-ray flux and ASM / BAT intercalibration
Here we provide technical details on the procedures used to determine the X-ray flux as well as the intercalibration between RXTE/ASM and Swift/BAT. Since the start of the operation of the All Sky Monitor (ASM) (Levine et al. 1996) on board the NASA satellite RXTE in 1996, a high quality continuous monitoring of sufficiently strong X-ray sources has been underway. ASM provides average count rates in the 2–10 keV range (in units of cts/s) for 90 sec long “dwells” and for one day101010http://xte.mit.edu. The operation of ASM ended in early 2010. Since early 2005 the Burst Alert Telescope (BAT) (Barthelmy et al. 2005) on board the NASA satellite Swift monitors X-ray sources (in addition to detecting gamma-ray bursts). The BAT average count rates are given for the 15–50 keV range in units of cts/(cm2 s), both per satellite orbit and per day111111http://swift.gsfc.nasa.gov/results/transients. Between 2005 and 2010 both monitors operated simultanously, allowing an inter-calibration of the two instruments to be established.
A.1 Determination of X-ray flux
As stated in the main text, we take the maximum flux encountered in each Main-On as a measure of the local luminosity of this 35d cycle. How is this flux determined? Since the discovery of Her X-1 as an accreting binary X-ray pulsar by UHURU in 1972 (Tananbaum et al. 1972), it has been known that the flux varies strongly on three different time scales (in addition to the 1.237 s pulsation): the 35 d on-off period, the 1.70 d binary eclipses (of 6 hours duration) and the 1.62 d period with similarly long “dips”. For details on these modulations and the underlying physics, see e.g., Klochkov et al. (2006) and Staubert et al. (2013). Fig. 4 (upper panel) shows the Her X-1 light curve of the Main-On of 35d cycle 462, as measured (in orbital averages) by Swift/BAT. All three types of flux modulations are apparent. In order to find a measure of the true intrinsic luminosity (accretion rate), the observed light curves were cleaned by removing data points from times of the eclipses121212For the binary ephemeris of Her X-1 see Staubert et al. 2009. and the dips, and also from some other extreme outliers. The cleaned light curve of cycle 462 is shown in the lower panel of Fig. 4. Such cleaning was performed and two characteristic parameters were extracted interactively for all 35d Main-Ons observed by ASM and by BAT, the maximum flux and the turn-on time. For the maximum flux an interval (of 3 d) around the maximum was selected and the formal average (and its corresponding uncertainty) of all data points within this interval determined. The turn-on time was found by taking the center between the time of the first significant flux measurement (at the rise from the off-state) and the time of the previous data point. The corresponding uncertainty is half of the difference between those two times.
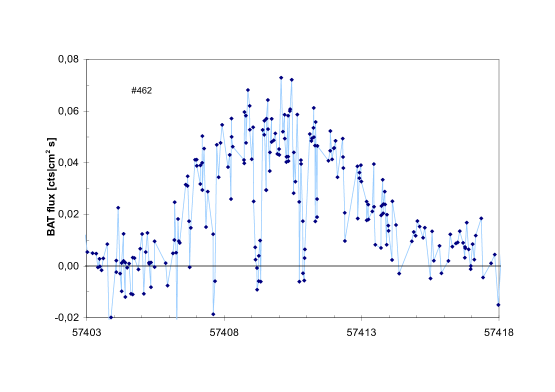
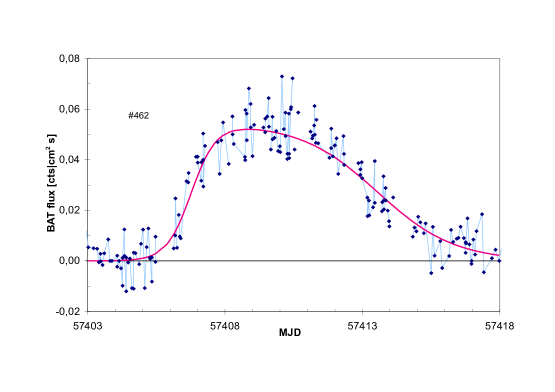
In addition to the above procedure, a second method was applied for a limited number of 35d cycles, namely a formal best fit to the cleaned light curve using the following function:
| (2) |
This second method yielded results that were in good agreement with the former procedure. The solid red line in Fig. 4 is the best fit to the cleaned light curve of 35d cycle 462.
A.2 Intercalibration between ASM and BAT
To be able to use flux measurements of the two monitoring instruments
RXTE/ASM and Swift/BAT in a common analysis, an
intercalibration was performed. We used the overlapping time
period of about 5 yrs (2005–2010) for which both instruments
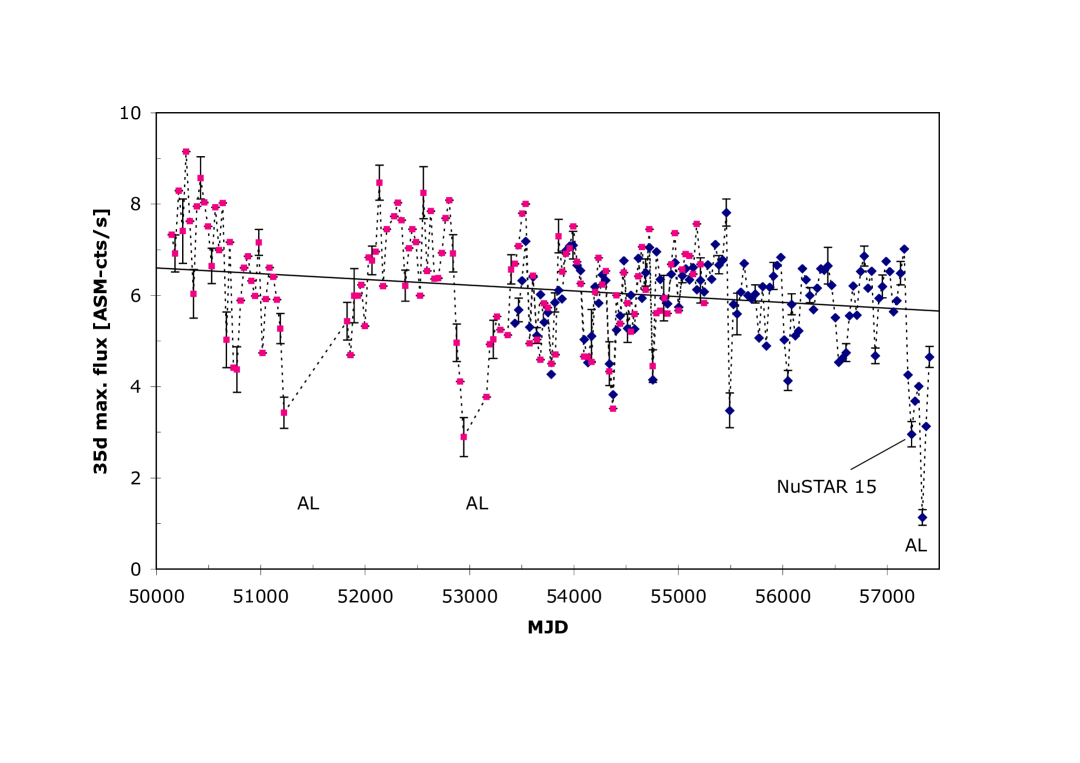
operated simultaneously. Fig. 5 shows a common light
curve of Her X-1 from 1997 to 2016, showing the maximum
Main-On flux (see previous section). For this light curve the
observed BAT maximum values were multiplied with the scaling
factor
(2-10 keV ASM-cts/s) = 93.0 (15-50 keV BAT-cts cm-2 s-1).
This scaling factor was found by plotting the measured maximum values of both monitors against each other: a linear fit to those values yielded the conversion factor of . As a second method, we used the measured one-day averages from both monitors: the correlation yielded the same result. In order to test, whether the conversion factor showed any time dependence, we divided the overlapping period into five intervals and determined the individual conversion factors. The results are summarized in Table LABEL:tab:tableA2. We conclude that the values are consistent with a constant conversion factor. When producing frequency distributions of the maximum flux values of Fig. 5 (over a time period of a few years), we find that they are all consistent with Gaussian distributions with a standard deviation of 1 ASM-cts/s (around 15% of the mean flux). The variation over several 35d cycles, however, can exceed 100%.
(2-10 keV ASM-cts s-1) = f (15-50 keV BAT-cts cm-2 s-1).
| Time interval | f |
|---|---|
| MJD | |
| 53430–53800 | |
| 53800–54200 | |
| 54200–54600 | |
| 54600–54950 | |
| 54950–55250 | |
| total time | |
| 53430–55250 |