Unifying impacts in granular matter from quicksand to cornstarch
Abstract
A sharp transition between liquefaction and transient solidification is observed during impact on a granular suspension depending on the initial packing fraction. We demonstrate, via high-speed pressure measurements and a two-phase modeling, that this transition is controlled by a coupling between the granular pile dilatancy and the interstitial fluid pressure generated by the impact. Our results provide a generic mechanism for explaining the wide variety of impact responses in particulate media, from dry quicksand in powders to impact-hardening in shear-thickening suspensions like cornstarch.
pacs:
???Impacts on particulate media like granular materials and suspensions present an astonishingly rich phenomenology RuizSuarez_2013 ; Omidvar_2014 . Along with its astrophysical Melosh_book and ballistics applications Wagner_2009 , impact dynamics is an object of active research to understand the high-speed response of granular matter Clark_PRL2015 . In dry granular media, impact by a solid object results in the formation of a corona of granular ejecta and a solid–like plastic deformation leading to a permanent crater Walsh_PRL2003 ; Uehara_2003 ; Yamamoto_2006 ; Deboeuf_2009 ; Marston_JFM2012 ; Zhao_PNAS2015 . For fine powders in air, granular jets and cavity collapse occur during impact Thoroddsen_2001 ; Lohse_2004 . Subsequent studies showed that the ambient pressure of the interstitial fluid (air) is an important element for the observed fluid–like behavior Royer_Nature2005 ; Caballero_PRL2007 ; Royer_2008 , while for denser packing the impact penetration is much reduced Royer_EPL2011 . However, the question of the physical mechanisms and control parameters that give rise to such a wide variety of phenomena is still largely open. Recently, studies on shear–thickening suspensions (cornstarch) showed completely different behaviors. Above a critical velocity, an impacting object immediately stops Waitukaitis_2012 , or in some cases generates cracks Roche_PRL2013 , as if hitting a solid. This phenomenon has been related to the propagation of dynamic jamming fronts in the bulk Waitukaitis_2012 but the mechanism remains unclear and overlooks the role of fluid/grains couplings, which are known to strongly affect the transient behavior of saturated granular materials Iverson_RevGeoPhy1997 ; Pailha_JFM2009 ; Andreotti_Forterre_Pouliquen_2013 . Whether impact-activated solidification relies on such couplings or on the complex rheology of the suspension is a pivotal question for clarifying the physics of shear-thickening fluids – a still highly debated topic Fernandez_2013 ; Seto_2013 ; Brown_2014 ; Wyart_2014 ; Fall_2015 .
The objective of this Letter is to address these questions and elucidate the role of the interstitial fluid and the initial volume fraction on the diverse impact phenomenology observed in granular materials and dense suspensions during the last decade. To avoid difficulties associated with colloidal interactions between particles (like in shear-thickening suspensions) or fluid compressibility (like in powders in air), we study here the impact of a freely-falling rigid sphere on a simple granular suspension Boyer_PRL2011 made up of macroscopic, heavy particles (glass beads in the range 0.1–1 mm) immersed in an incompressible liquid (water, viscous oil). The initial packing fraction of the suspension (the ratio of the volume of the glass beads to the total volume) is controlled by first fluidizing the mixture and then compacting the sediment, before removing the excess liquid (see Fig. 1(a) and Supplemental Materials for the detailed set-up). For a granular pile of frictional spherical particles, typically takes values between 0.55 and 0.62 Andreotti_Forterre_Pouliquen_2013 . The suspension is kept fully saturated so that surface tension effects can be neglected.
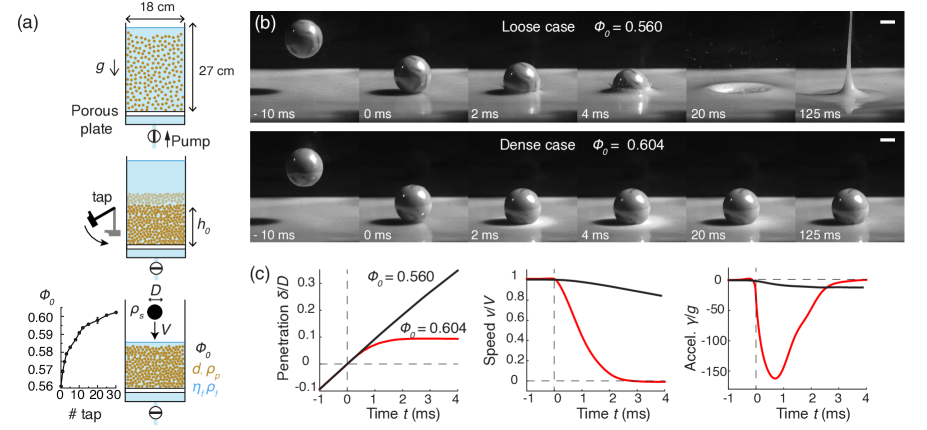
Remarkably, two very distinct impact regimes are observed depending on the initial packing fraction [Fig. 1(b)]. For initially loose packing (), the ball readily sinks in the suspension, giving rise to a collapsing cavity and a central jet (see movie 1 in Supplemental Material). This is the typical behavior of a sphere impacting a liquid pool wherein the dynamics is dominated by fluid inertia Wor1908 . Such fluid-like behavior is also strikingly similar to that observed when a rigid sphere hits a dry loose powder under atmospheric pressure Thoroddsen_2001 ; Lohse_2004 . By contrast, for dense packing (), the ball stops abruptly within a few milliseconds as it hits the surface (see movie 2 in Supplemental Material), with a huge deceleration of about (where m s-2) [Fig. 1(c)]. This solid-like behavior is strongly reminiscent of the impact–activated solidification observed in shear-thickening suspension like cornstarch Waitukaitis_2012 . It also clearly depends on the grain size and viscosity of the interstitial fluid between the particles. Using coarser particles in the same fluid tends to suppress the extreme deceleration, which can be restored by increasing the fluid viscosity (see movie 3 in Supplemental Material). The impact dynamics is also very different when the same grains are put in air instead of water. In this case, as reported in previous studies Walsh_PRL2003 ; Yamamoto_2006 ; Marston_JFM2012 , grains ejecta followed by the formation of a permanent crater is observed (see movie 4 in Supplemental Material). Therefore both the initial packing fraction and the interstitial fluid play a key role on the suspension behavior during impact.
To explain how such a drastic change in behavior can occur with only a slight change of packing fraction (), we rely on a pore-pressure feedback mechanism: a coupling between the deformation of the granular medium and the pressure of the interstitial fluid between the grains Iverson_RevGeoPhy1997 ; Pailha_JFM2009 . As first described by O. Reynolds Reynolds_1885 , when a dense granular packing starts to flow, it must dilate. Since the medium is saturated with an incompressible liquid, the fluid is sucked in, as evidenced by the bright zone developing beneath the impacting sphere in the dense case [Fig. 1(b)]. Therefore, when the ball hits the pile, the interstitial fluid pressure (pore–pressure) drops instantaneously, which in turn presses the grains against each other thereby enhancing the friction. Thus, the medium is transiently solidified. A loosely packed granular bed, on the other hand, tends to compact when it deforms. Therefore, a rise in pore–pressure is produced during impact that can balance the weight of the grains. This suppresses the contact network, resulting in local or global fluidization.
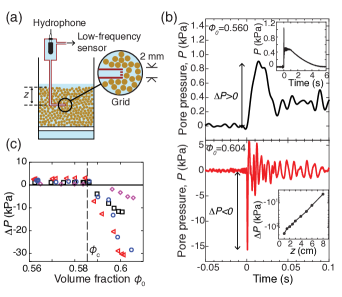
We proceed a direct verification of this mechanism by developing a high-frequency measurement of the interstitial fluid pressure inside the suspension, just under the impact [Fig. 2(a)] (see Fig . S1 and Supplemental Material for the calibration procedure). In the loose case [Fig. 2(b), upper panel], the pore–pressure shows a sudden positive peak after impact. The measured peak pressure ( kPa) is larger than the effective weight of the suspension above the sensor, Pa (, cm, and kg m-3), indicating a fluidization of the medium. At longer times sedimentation proceeds and the pressure slowly relaxes. By contrast, in the dense case [Fig. 2(b) lower panel], the peak pressure is negative and its magnitude ( kPa) is much higher than the confining pressure due to gravity, indicating that particles are strongly pressed against each other, effectively leading to a solidification of the medium. Interestingly, the perturbation triggered by the impact remains localized near the impact point as shown by the pressure profile along the -direction within the medium (inset of lower panel of Fig. 2b). The decay length scale is 1 cm and much smaller than the container size, ensuring that the results reported are independent of wall effects. The transition between a positive and negative peak pressure occurs for a critical packing fraction , which is independent of the projectile diameter and impact speed [Fig. 2(c)]. This value is consistent with previous rheological measurements of the jamming packing fraction using frictional spherical particles Boyer_PRL2011 .
In order to model the impact dynamics, the coupling between the grain matrix deformation and the interstitial fluid should necessarily be taken into account. For an assembly of rigid particles, the simplest dilatancy law relating the evolution of the volume fraction and the packing deformation at the onset of plastic flow is given by Roux_Radjai_1998 ; Andreotti_Forterre_Pouliquen_2013
| (1) |
where is the absolute shear rate of the granular medium and is the Reynolds dilatancy angle Reynolds_1885 , assumed proportional to , and a constant of order unity. This deformation of the granular matrix induces in turn an interstitial fluid flow, which, for the low Reynolds numbers considered here, is described by the Darcy law Darcy1856 ; Jackson_Book2000
| (2) |
where the vector fields and denote the particle and liquid velocity, respectively, is the liquid pore–pressure, the fluid viscosity and the permeability of the granular pile. Assuming that the liquid and the particles are incompressible: and , and taking the divergence of the Darcy law (2) gives , in which spatial variations of have been neglected. Using the Reynolds dilatancy equation (1), we finally obtain a Poisson-like equation for the pore–pressure
| (3) |
in which the sign of the source term is imposed only by . Therefore, the pore–pressure generated by the impact scales as
| (4) |
where , is the velocity scale for the particle velocity field, the typical extent up to which deformation is experienced by the granular bed, and a constant of order unity. This relation predicts that the pore pressure is positive (fluid-like response) or negative (solid-like response) depending only on the sign of , while its magnitude is controlled by both the grain diameter and fluid viscosity, in agreement with observations (Fig. 2c and movie 3 in the Supplementary Material).
The Darcy-Reynolds model (4) can also be used to quantitatively infer the penetration dynamics in the dense case (). Assuming a frictional rheology for the granular suspension Andreotti_Forterre_Pouliquen_2013 and neglecting the confining pressure due to gravity in front of the pore–pressure, the contact stress on the impactor is , where is an effective friction coefficient Schofield_1968 ; Seguin_2013 and is the pore–pressure (4), in which , where is the penetration depth, and the typical radius of the contact area of the projectile (consistent with our measurements of the pressure profile, see inset of lower panel of Fig. 2b). Using Newton’s second law for the impactor , where is the density of the projectile, and assuming small penetration (), the penetration then evolves according to the non-dimensional equation (after integration with initial conditions and ): , where is the dimensionless penetration and a dimensionless time given by
| (5) |
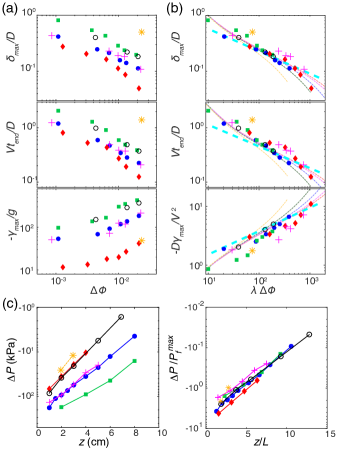
This dynamics is compared with experiments at various initial packing fraction for a given projectile and impact velocity in Fig. S2 (see Supplemental Material). As approaches , the indentation depth increases and the maximal deceleration decreases, while the stopping time increases. A collapse of all trajectories is obtained when the variables are rescaled according to the model prediction (see Fig. S2 in Supplemental Material). Quantitative agreement is achieved by taking . Such a value is consistent with experimental measurements of and for glass beads Pailha_JFM2009 ; Seguin_2013 , for which and . Furthermore, the Darcy-Reynolds model captures the impact dynamics for a wide range of physical parameters: using different suspension mixtures and different impact parameters, the data for the maximal indentation depth , stopping time and maximal deceleration collapse on the prediction when plotted as function of [Fig. 3(a,b)]. Finally, we systematically measure the pore–pressure profile below the impact point for different impactor parameters and suspensions [Fig. 3(c)]. An universal exponential decay is obtained when the pore–pressure is scaled by the maximal pore–pressure given by the Darcy-Reynolds scaling (4) and the depth is scaled by , thereby conclusively supporting the model.
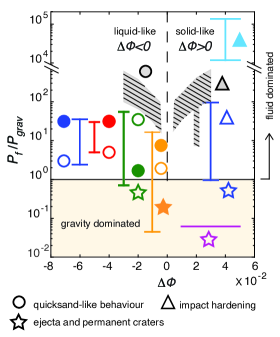
These results can be easily extended to suspensions for which the interstitial fluid is not a liquid but a gas, like dry powders at different operating air pressure. As long as the diffusion timescale for gas expulsion , where is the gas compressibility, is small compared to the impact timescale , the fluid can be assumed incompressible and the Darcy-Reynolds scaling (4) of the pore–pressure still holds (see Supplemental Material). Otherwise, the fluid has no time to escape from the pores during impact. The pore–pressure is then given by a gas state equation , where and is the gas pressure. In Fig. 4, we compare the predicted pore–pressure with the typical confining pressure due to gravity for our study and previous impact studies covering a wide range of particulate media and impact conditions, for both incompressible and compressible interstitial fluids. When , the pore–pressure built-up during impact dominates the dynamics, yielding quicksand-like or solid-like response depending on the sign of , in agreement with observations Royer_Nature2005 ; Caballero_PRL2007 ; Royer_EPL2011 . By contrast when the interstitial fluid contributes negligibly to forces between grains and so, one recovers the classical dry granular case phenomenology Walsh_PRL2003 ; Yamamoto_2006 .
Our study thus provides an unifying picture to explain the main regimes observed during the impact of a solid object onto a mixture of grains and fluid, at least when surface tension effects can be neglected (saturated suspension). It also provides a mechanism to explain the impact–activated solidification observed in more complex shear–thickening media like cornstarch Waitukaitis_2012 . In these systems, the critical packing fraction is expected to be a decreasing function of the impact velocity Fernandez_2013 ; Seto_2013 ; Wyart_2014 , and not a material constant like in the present study. Thus, at high enough impact velocities, the suspension should become dilatant and solidify due to the pore–pressure feedback mechanism. Since the cornstarch particles are about 10 m and the suspension permeability scale as , the Darcy-Reynolds scaling (4) predicts a 100-fold increases of the pore–pressure compared to that of the Newtonian suspension with glass beads ( m). This is about MPa for typical impact conditions, which is in good agreement with impact stress estimations in cornstarch Waitukaitis_2012 [Fig. 4]. We confirm this viewpoint by performing qualitative measurements of pore–pressure in cornstarch suspensions. When an object is impulsively-moved in a concentrated suspension of cornstarch in water, pore–pressure takes indeed a huge drop (see Fig. S3 in Supplemental Material). Therefore, it is remarkable that the conjunction of two distinguished mechanisms in granular media, the Darcy law and the Reynolds dilatancy, could explain this long-standing puzzle: why we can run on cornstarch.
References
- (1) J. C. Ruiz-Suàrez, Rep. Prog. Phys. 76, 066601 (2013).
- (2) M. Omidvar, M. Iskander and S. Bless, Int. J. Impact. Eng. 66, 60 (2014).
- (3) H. J. Melosh, Impact Cratering: A Geologic Process (Oxford University Press, Oxford, 1989).
- (4) N. J. Wagner and J. F. Brady, Physics Today 62, 27 (2009).
- (5) A. H. Clark, A. J. Petersen, L. Kondic and R. P. Behringer, Phys. Rev. Lett. 114, 144502 (2015).
- (6) A. M. Walsh, K. E. Holloway, P. Habdas and J. R. de Bruyn, Phys. Rev. Lett. 91, 104301 (2003).
- (7) J. S. Uehara, M. A. Ambroso, R. P. Ojha and D. J. Durian, Phys. Rev. Lett. 90 194301 (2003).
- (8) S. Yamamoto, K. Wada, N. Okabe and T. Matsui, Icarus 183, 215 (2006).
- (9) S. Deboeuf, P. Gondret and M. Rabaud, Phys. Rev. E 79, 041306 (2009).
- (10) J. O. Marston, E. Q. Li and S. T. Thoroddsen, J. Fluid. Mech. 704, 5 (2012).
- (11) R. Zhao, Q. Zhang, H. Tjugito and X. Cheng, Proc. Natl Acad. Sci. USA 112, 342 (2015).
- (12) S. T. Thoroddsen and A. Q. Shen, Phys. Fluids 13, 4 (2001).
- (13) D. Lohse, R. Rauhé, R. Bergmann and D. Van Der Meer, Nature 432, 689 (2004).
- (14) J. R. Royer et al. Nature Physics 1, 164 (2005).
- (15) G. Caballero, R. Bergmann, D. van der Meer, A. Prosperetti and D. Lohse, Phys. Rev. Lett. 99, 018001 (2007).
- (16) J. R. Royer et al. Phys. Rev. E 78, 011305 (2008).
- (17) J. R. Royer, B. Conyers, E. I. Corwin, P. J. Eng and H. M. Jaeger, Europhys. Lett. 93, 28008 (2011).
- (18) S. R. Waitukaitis, H. M. Jaeger, Nature 487, 205 (2012).
- (19) M. Roché, E. Myftiu, M. C. Johnston, P. Kim and H. A. Stone, Phys. Rev. Lett. 110, 148304 (2013).
- (20) R. M. Iverson, Reviews of Geophysics. 35, 245 (1997).
- (21) M. Pailha and O. Pouliquen, J. Fluid Mech. 633, 115 (2009).
- (22) B. Andreotti, Y. Forterre and O. Pouliquen, Granular Media: Between Fluid And Solid (Cambridge University Press, Cambridge, 2013).
- (23) N. Fernandez et al. Phys. Rev. Lett. 111, 108301 (2013).
- (24) R. Seto, R. Mari, J. F. Morris and M. D. Morton, Phys. Rev. Lett. 111, 218301 (2013).
- (25) M. Wyart and M. E. Cates, Phys. Rev. Lett. 112, 098302 (2014).
- (26) E. Brown and H. M. Jaeger, Rep. Prog. Phys. 77, 046602 (2014).
- (27) A. Fall et al. Phys. Rev. Lett. 114, 098301 (2015).
- (28) F. Boyer, E. Guazzelli and O. Pouliquen, Phys. Rev. Lett. 107, 188301 (2011).
- (29) A. M. Worthington, A Study Of Splashes (Longmans Green and Co., 1908).
- (30) O. Reynolds, Phil. Mag. Series 20, 469 (1885).
- (31) S. Roux and F. Radjai, in Physics Of Dry Granular Media (Springer, 229–236, 1998).
- (32) H. Darcy, Les fontaines publiques de la ville de Dijon (Victor Dalmont, Paris, 1856).
- (33) R. Jackson, The Dynamics Of Fluidized Particles (Cambridge University Press, Cambridge, 2000).
- (34) A. Schofield and P. Wroth, Critical State Soil Mechanics (Cambridge University Press, Cambridge, 1968).
- (35) A. Seguin, Y. Bertho, F. Martinez, J. Crassous and P. Gondret, Phys. Rev. E 87, 012201 (2013).
Acknowledgment The authors thank Mathieu Leger and Sady Noël for the design of the experimental set–up. We also thank Emil Dohlen and students from Polytech’Marseille for preliminary results. This work was supported by the French National Research Agency (ANR) through the program No. ANR-11-JS09-005-01 and by the Labex MEC (ANR-10-LABX-0092) and the A*MIDEX project (ANR-11-IDEX-0001-02) funded by the “Investissements d’Avenir” French Government program.
Author Information The authors declare no competing financial interests. Correspondence and requests for materials should be addressed to Y.F. (yoel.forterre@univ-amu.fr).
SUPPLEMENTAL MATERIAL
Material characterization. The suspensions are prepared by mixing mono-dispersed glass beads of density g cm-3 with a Newtonian liquid of density and viscosity . Most of the experiments are conducted with a suspension of beads of diameter m (with a standard deviation of 20 m) in water ( g cm-3, Pa s). In addition, suspension of larger glass beads of diameter m (with a standard deviation m) immersed in water or in a mixture of UCON lubricant fluid (Dow, 75-H-90,000) and water ( g cm-3, Pa.s) are used to explore the influence of bead diameter and fluid viscosity. Care was taken to use two batches of grains with similar internal friction coefficient (tested by comparing the angle of repose), in order to get similar value of the parameter . The value of the critical volume fraction obtained by the pressure measurements (change of sign of the peak pore-pressure after impact) in the case of m is and is thus different from the other suspension (for which ), probably due to differences in grain size distribution.
An important parameter of the model is the Darcy permeability of the granular suspension, which relates the flow rate across the porous medium to the gradient of fluid pressure Jackson_Book2000 . The permeability of each suspension were obtained by imposing a downward gravity-driven flow through the grains and by measuring the corresponding flow rate, giving m2 for the 170 m diameter beads and m2 for the 500 m diameter beads. The variation of the permeability with the initial volume fraction of the pile is less than 15 in the range studied and neglected in the model.
Suspension preparation.
The particles are mixed with the working liquid and placed in a large container (side length: 18 cm, depth: 27 cm). At the beginning of each experiment, the granular bed is fluidized by injecting the liquid through a porous plate placed at the bottom of the container. When the tank is almost filled with the liquid, the liquid supply is stopped and the particles are allowed to sediment. The tank wall is then gently tapped to compact the bed. The tapping on the side of the container is performed by a pendulum, released from a constant height, to ensure repeatability of the compacting process. Before each impact, the granular bed height is measured at each side of the container with an accuracy of 0.5 mm for a range of 9 to 10 cm depending on the number of taps. The initial volume fraction is deduced from these measurements with an accuracy of . The excess liquid is later drained-off so that a thin liquid layer is kept on the surface of the pile ( mm). The exact amount of water left does not affect the experimental results presented in this study. Finally, a solid sphere made of glass (density g cm-3, diameter or mm) is let to freely–fall on the granular bed, impacting at a speed . A high-speed video camera records the dynamics (up to 150,000 frames per seconds).
Pore–pressure measurements.
To limit the perturbation induced by a sensor in the region of the suspension affected by impact, a low footprint pore–pressure sensor was designed. A thin, cm long, L–shaped stainless steel tube (internal diameter: mm, thickness: mm), ended by a fine metallic grid preventing the grains from entering into the tube is attached to a water-proof chamber. The tube and the chamber are filled with the working liquid. A hydrophone (Brüel & Kjær ) with a flat frequency response in the range 1 Hz-15 kHz is used to measure the high frequency pressure signal within the chamber. An additional low frequency differential pressure sensor (Honeywell) is used to determine the slow relaxation dynamics.
Because of the fine grid and of the complex geometry of the pore–pressure sensor, a careful calibration of this measuring device had to be conducted through a specific experiment described in Extended Data Fig. 1. The calibration chamber is divided into three compartments: compartment (I) contains the suspension to be impacted, compartment (II) contains a similar suspension but with a different height and finally compartment (III) is a water-filled chamber containing the pore–pressure sensor and a bare hydrophone separated from compartment (I) by a porous plate allowing transmission of the pressure signal. The purpose of compartment (II) is to ensure that the thin tubes are fastened just as the tubes in the experiment of the main text. After impact under conditions similar to the main experiment, the transfer function of the pore–pressure sensor was determined by measuring the signals from the bare hydrophone (BH) and the embedded hydrophone (EH) of the pore–pressure sensor at different grain sizes and fluid viscosities.
Refined impact model. The model presented in the main text can be slightly extended to offer a more accurate description of the dynamics when the indentation is not small and for larger values of . The proposed modifications lie in the following two arguments:
-
1.
In the main text model the radius of contact was approximated by , valid for small . When the indentation is not small the radius of contact is better described by the following form: with if and otherwise.
-
2.
In the main text model the parameter , relating the normal stress acting of the ball and the confining granular pressure , was assumed to be constant. However, this parameter changes with the internal friction angle of the pile , which itself depends on the initial volume fraction Andreotti_Forterre_Pouliquen_2013 . To account for this dependence of with , we model by the classical expression used in soil mechanics to describe the bearing capacity of a frictional soil (the so-called load-bearing capacity factor) Schofield_1968 , that is
(6) and we relate the internal friction angle with using the dilatancy angle Andreotti_Forterre_Pouliquen_2013 , so that , where is the internal friction angle at the critical state and as before.
With these two modifications, the equation for the dynamics of the sphere reads
| (7) |
where and and , with
| (8) |
This model yields results that depend both on and . The predictions from this model with and are shown in Fig. 3 of the main text.
Extension to compressible interstitial fluids. In the model presented in the text, the interstitial fluid is assumed incompressible. When fluid compressibility is taken into account, the linearized mass conservation equation for the fluid phase becomes: , where is the compressibility of the fluid. Using as before the mass conservation of the solid phase and taking the divergence of the Darcy law (2) gives:
| (9) |
When the diffusion time scale is short compared to the impact timescale , the compressible term is small compared to the Darcy term and one recovers the incompressible Darcy-Reynolds equation (1-4) for the pore–pressure. By contrast, when , the compressible term is dominant and the pore-pressure is given by: , that is . In Fig 4, the pore–pressure is computed as when the compressible number and as when .
![[Uncaptioned image]](/html/1603.07013/assets/x5.png)
FIG. S1: Calibration procedure for the pore–pressure measurement. (a) Calibration chamber ( cm, cm) and signal (resp. ) recorded by the bare hydrophone (resp. by the embedded hydrophone) during a typical impact condition with , m s-1, mm, m, Pa s. The embedded hydrophone (grid and tube) induces a strong distorsion in both in the amplitude and temporal characteristics of the input signal. The inverse transfer function of the sensor in the Fourier space, , is obtained from the signals and using the following formula: , where and is a filtering function used to enforce causality. The inverse transfer function is then averaged over 3 trials performed at the same impact condition and used for all calibrations made in the study. (b) Red: Input signal reconstructed from the signal of the embedded hydrophone (inset) using the inverse transfer function determined previously, for a different impact velocity ( m s-1). The reconstructed signal is obtained from the signal of the embedded hydrophone using the formula: . Black: input signal measured directly by the bare hydrophone for the same impact. The transfer function introduces spurious oscillations on long times in the reconstructed signal but correctly reproduces the peak pressure just after impact. (c) Comparison between the peak pressure measured with the bare hydrophone and the peak pressure of the reconstructed signal for different impact conditions (black crosses: m s-1; blue circles: m s-1; red squares: m s-1; green diamonds: m s-1, cm; purple star: m s-1, impact in a looser pile). In all cases, the reconstructed peak pressure is within 20 of the real peak pressure.
![[Uncaptioned image]](/html/1603.07013/assets/x6.png)
FIG. S2: Penetration dynamics in the dense regime. (a) Experimental position, speed and acceleration for , , , , , (glass beads m in water, mm, m s-1). (b) Same data rescaled using the characteristic time and length together with the model prediction (dashed line).
![[Uncaptioned image]](/html/1603.07013/assets/x7.png)
FIG. S3: Transient hardening is associated with negative pore–pressure in dense suspensions of cornstarch in water. (a) A cylinder is impulsively moved by hand and the pore–pressure is recorded simultaneously. The pressure sensor is connected to a tube filled with water and ended by a fine semi-permeable paper that prevents cornstarch particles to enter the tube. (b) Pore–pressure versus time (cornstarch 55 wt in distilled water, the suspension has been vigorously stirred before the experiment to avoid sedimentation effects). The cylinder is put in motion at .
![[Uncaptioned image]](/html/1603.07013/assets/x8.png)
TAB. S1: Impact parameters and granular/fluid properties used to plot the phase diagram in Fig. 4. For each material, the permeability is computed using Carman-Kozeni formula Jackson_Book2000 : . The air compressibility is given by , where is the air pressure and .
References
- (1) R. Jackson, The Dynamics Of Fluidized Particles (Cambridge University Press, Cambridge, 2000).
- (2) Andréotti B, Forterre Y, Pouliquen O (2013) Granular media: between fluid and solid Cambridge University Press.
- (3) A. Schofield and P. Wroth, Critical State Soil Mechanics (Cambridge University Press, Cambridge, 1968).