HST STIS observations of the mixing layer in the Cat’s Eye Nebula∗∗\ast∗∗\ast Based on observations made with the NASA/ESA Hubble Space Telescope, obtained at the Space Telescope Science Institute, which is operated by the Association of Universities for Research in Astronomy, Inc., under NASA contract NAS 5-26555. The observations are associated with program #12509.
Abstract
Planetary nebulae (PNe) are expected to have a 105 K interface layer between the 106 K inner hot bubble and the 104 K optical nebular shell. The PN structure and evolution, and the X-ray emission depend critically on the efficiency of mixing of material at this interface layer. However, neither its location nor its spatial extent has ever been determined so far. Using high-spatial resolution HST STIS spectroscopic observations of the N v 1239,1243 lines in the Cat’s Eye Nebula (NGC 6543), we have detected this interface layer and determined its location, extent, and physical properties for the first time in a PN. We confirm that this interface layer, as revealed by the spatial distribution of the N v 1239 line emission, is located between the hot bubble and the optical nebular shell. We estimate a thickness of 1.5 cm and an electron density of 200 cm-3 for the mixing layer. With a thermal pressure of 210-8 dyn cm-2, the mixing layer is in pressure equilibrium with the hot bubble and ionized nebular rim of NGC 6543.
Subject headings:
stars: winds, outflows — X-rays: ISM — planetary nebulae: general — planetary nebulae: individual (NGC 6543)1. Introduction
Planetary nebulae (PNe) are formed in the final evolutionary stages of stars with initial masses 8–10 . As these stars evolve along the asymptotic giant branch (AGB), they experience successive episodes of heavy mass loss through a slow ( 10 km s-1) wind. Once the stellar envelope is stripped off, the hot stellar core is exposed, leading to a 1000–4000 km s-1 fast stellar wind (Cerruti-Sola & Perinotto, 1985; Guerrero & de Marco, 2013). This fast wind sweeps up the slow AGB wind, which is further photoionized by the central star (CSPN), to form a PN (Kwok, 1983; Frank et al., 1990).
In this interacting stellar winds (ISW) model, an adiabatically-shocked hot bubble with temperatures as high as 107–108 K forms in the inner region of the PN, but this hot gas is too tenuous (10-3 cm-3) to be detected. Nevertheless, extended X-ray emission has now been detected inside the inner cavities of nearly 30 PNe with plasma temperatures of 1–3106 K and electron densities of 1–10 cm-3 (e.g., Kastner et al., 2000, 2012; Chu et al., 2001; Guerrero et al., 2000, 2002, 2005; Freeman et al., 2014). The detection of X-ray-emitting hot gas in PN interiors strongly supports the ISW model, but the discrepancy between the observed and predicted physical conditions and X-ray luminosities has led to the suggestion that some mechanism is reducing the temperature of the hot bubble and raising its density. Thermal conduction (Steffen et al., 2008; Soker, 1994, and references therein) and/or hydrodynamical instabilities (e.g., Toalá & Arthur, 2014) in the wind-wind interaction zone can inject material into the hot bubble, creating a mixing layer of gas with intermediate temperatures (105 K) between the hot bubble and the optical nebular shell.
As thermal conduction governs the amount of material injected into the hot bubble, turning it on or off in the models causes differences in the spatial extent and physical properties of the mixing layer. By gaining insights into the mixing layers in PNe, the effects of thermal conduction and turbulent mixing on the interior hot gas can be quantitatively assessed. This in turn helps us to refine the models to produce more realistic predictions, which can then be compared with the available sample of PNe with diffuse X-ray emission detected (Freeman et al., 2014). There is, however, very little observational information about the mixing layers.
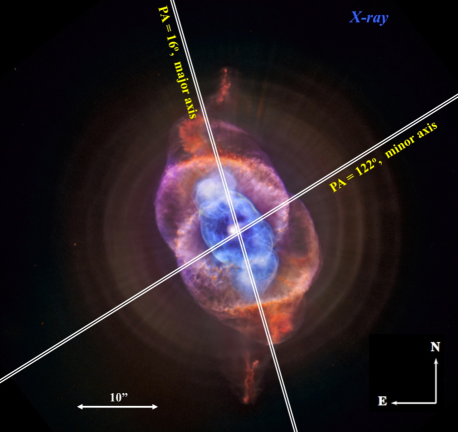
X-ray observations of NGC 6543 (a.k.a. the Cat’s Eye Nebula) reveal a physical structure qualitatively consistent with the ISW models (Chu et al., 2001). The Chandra image of NGC 6543 (Figure 1) shows simple limb-brightened diffuse X-ray emission confined within the bright inner shell and two blisters at the tips of its major axis, in sharp contrast to its complex optical morphology (Balick, 2004), implying density enhancement near the inner nebular rim and evaporation of nebular material into hot interior. Indeed, the observed X-ray temperature (1.7106 K; Chu et al., 2001) is much lower than that expected for a stellar wind of 1400 km s-1 (Prinja et al., 2007). Therefore, NGC 6543 provides a case study of mixing layers in PNe.
UV lines of highly ionized species produced by thermal collisions in the mixing layer can be used as probes. The most common species are C iv, N v, and O vi, whose fractional abundances peak at 1105, 2105 and 3105 K, respectively (Shull & van Steenberg, 1982). FUSE detections of the O vi 1032,1038 doublet from the mixing layers have been reported in several PNe (Iping et al., 2002; Ruiz et al., 2013), including NGC 6543 (Gruendl et al., 2004), but no spatial information could be drawn due to the limited angular resolution of FUSE. This can only be achieved by the unique capabilities of the Hubble Space Telescope (HST).
| Slit Position | Date | Instrumental Configuration | |||||
| Detector | Grating | Spectral Range | Dispersion | ||||
| (Å) | (Å) | (Å pixel-1) | (s) | ||||
| NGC 6543-MINOR | 2012 Jul. 3 | STIS/FUV-MAMA | G140M | 1222 | 1190–1253 | 0.053 | 4570 |
| STIS/FUV-MAMA | G140M | 1550 | 1518–1581 | 0.053 | 1723 | ||
| STIS/CCD | G430L | 4300 | 2652–5950 | 2.746 | 2127 | ||
| STIS/CCD | G750M | 6581 | 6248–6913 | 0.554 | 2275 | ||
| NGC 6543-MAJOR | 2012 Oct. 21 | STIS/FUV-MAMA | G140M | 1425 | 1190–1253 | 0.053 | 4570 |
| STIS/FUV-MAMA | G140M | 1550 | 1518–1581 | 0.053 | 1723 | ||
| STIS/CCD | G430L | 4300 | 2652–5950 | 2.746 | 2127 | ||
| STIS/CCD | G750M | 6581 | 6248–6913 | 0.554 | 2275 | ||
In this paper, we present HST STIS UV and optical spectroscopy of NGC 6543. In conjunction with the Chandra X-ray images, these new spectra are used to successfully determine the location and spatial extent of mixing layer in a PN for the first time. We describe the observations in Section 2, and present results and discussion in Section 3. The main conclusions are summarized in Section 4.
2. Observations and Data Analysis
HST STIS UV and optical spectroscopic observations of NGC 6543 (PI: M.A. Guerrero, GO prop. ID 12509, Cycle 19) were carried out on 2012 July 3 and 2012 October 21. The observations aimed at detecting and tracing the spatial extent of the interface layer and comparing it with those of the nebular shell and hot bubble. The 52″02 long slit was placed at a position angle (PA) of 16 and 122 along the major and minor axes of the inner nebular shell (Figure 1), respectively. The G140M grating and STIS/FUV-MAMA detector were used to acquire spectra of the N v 1239,1243 and C iv 1548,1551 emission lines. The observations were performed in ACCUM mode. Meanwhile, the G430L and G750M gratings and STIS/CCD detector were used to obtain information of the [O iii], H, and [N ii] lines from the optical nebular shell. The STIS/CCD observations were split into 2 exposures to allow cosmic-ray removal. A summary of the STIS configurations and exposures is given in Table 1. The spectra were reduced and calibrated with the HST STIS pipeline.
In order to avoid the bright stellar light, the center of the long slit was offset 06 from the CSPN at each slit PA. Despite this offset, noticeable scattered stellar continuum spilt into the innermost regions of the nebular shell, reducing the detection sensitivity for the faint nebular emission within a region of radius 15 around the CSPN.
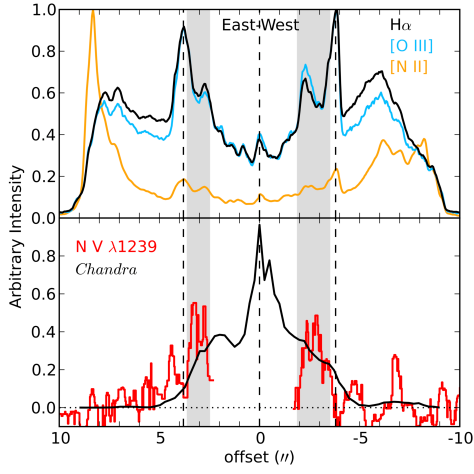
The 2D STIS spectra were used to extract spatial profiles of emission along the minor axis of the photoionized innermost nebular shell for the H, [O iii] 5007, and [N ii] 6583 lines (Figure 2, top) and the collisionally-excited N v 1239 UV line (Figure 2, bottom). The stellar light and nebular continuum were subtracted by carefully selecting spectral regions blue- and red-wards of the target emission lines. Despite this effort, the steep stellar P-Cygni profile of the N v line made it impossible to obtain a clean spatial profile of nebular emission in the innermost 3″ region around the CSPN. This inner section of spatial profile is discarded in our analysis. The spatial profile of X-ray emission, as derived from the Chandra observations, is added into the bottom panel of Figure 2. The spatial profiles along the major axis of the inner nebular shell of NGC 6543 (not shown here) reveal similar structures, although are complicated by projection effects of emission from the blister features.

We extracted 1D spectra from the 2D STIS UV data along the minor axis. The apertures for spectral extraction were targeted at the location of the interface layer marked by the grey shaded regions in the bottom panel of Figure 2 that have been selected according to the spatial emission profile of the N v line. The spectra extracted at the east and west positions of the interface layer were then combined and corrected for the underlying scattered stellar continuum. The profiles of the N v 1239, C iii 1247, and C iv 1551 emission lines are presented in Figure 3-top. Wavelengths have been corrected for the instrumental and orbital shifts. We then converted wavelengths to velocities by correcting for the local-standard-of-rest (LSR) velocity of the solar system ( = 16 km s-1) towards the direction of NGC 6543 (=965, =300).
Archival HST STIS echelle spectra of the CSPN of NGC 6543 (PI: R.E. Williams, GO prop. ID 9736, Cycle 12) were used to complement our data analysis. The stellar spectra were obtained with the E140H grating, which provided a resolution of 114,000111The STIS Instrument Handbook, URL http://www.stsci.edu/hst/stis/documents/handbooks (3 km s-1). Three separate settings of STIS/FUV-MAMA were used to cover a wavelength region 1140–1690 Å. The 02009 slit was placed on the CSPN. Detailed description of observations is given in Williams et al. (2008).
3. Results and Discussion
3.1. Emission Line Profiles
Figure 3-top shows the N v, C iii and C iv emission lines detected in our STIS G140M spectrum of NGC 6543. The N v 1239 and C iii 1247 lines peak at the radial velocity of NGC 6543 (47.5 km s-1; Miranda & Solf, 1992) and both have a full-width at half-maximum (FWHM) 0.33 Å. This line width is expected for an extended source filling the STIS slit width (02) and actually matches that of the geocoronal Ly emission line. This spectral resolution is insufficient to resolve the thermal width of N v 1239 produced by the 2105 K gas in the interface layer, which is estimated to have a FWHM 0.11 Å. Meanwhile, both lines of the C iv 1548,1551 doublet have a FWHM0.31 Å, slightly narrower than N v and C iii (Figure 3, top). Moreover, its observed line center is redshifted by 0.078 Å (15 km s-1), compared to the N v and C iii lines.
Inspection of our 2D STIS spectrum reveals a narrow absorption bluewards of the C iv emission. A close look at the archival HST STIS E140H spectrum of NGC 6543’s central star helps to clarify this issue. The spectra of the Si ii 1527, Si iii 1206, and C iv 1551 lines have absorption features at 3, 40 and 69 km s-1 (Figure 3, bottom). The component at 3 km s-1 is saturated in Si ii and Si iii but weak in C iv, whereas the much weaker absorption at 40 km s-1 is only present in Si ii and Si iii. These two absorption features are generally consistent in radial velocity and relative strength with the H i 21 cm emission towards the direction of NGC 6543 detected in the Leiden/Argentine/Bonn Galactic H i Survey and Effelsberg-Bonn H i Survey (Kalberla et al., 2005; Winkel et al., 2016). Given the similar ionization potentials of H0 and Si+, these two absorption components can be attributed to neutral or low-excitation ionized interstellar gas along the direction of NGC 6543. On the other hand, the absorption at 69 km s-1 is most likely produced by the approaching side of the PN shell, as this velocity generally agrees with NGC 6543’s systemic velocity ( = 47.5 km s-1) plus its expansion velocity (16 km s-1 at the inner shell and 28 km s-1 at the outer shell; Miranda & Solf 1992). Furthermore, this component is weak and unsaturated in Si ii, saturated in Si iii, and heavily saturated in C iv, implying a higher excitation than that of the interstellar gas probed by the H i 21 cm surveys. Our identification of these absorption features generally agrees with the interpretation of IUE observations (Pwa et al., 1984).
The blueward absorption reduces the widths of the C iv emission lines and shifts their line centers towards the red. This explains the different emission line profiles of C iv with respect to those of N v and C iii seen in Figure 3-top.
3.2. Spatial Distribution of Line Emission
The spatial profiles along the minor axis of NGC 6543 (Figure 2) reveal the location of mixing-layer gas originating from very different processes. The brightest emission peaks in H and [O iii] at 39 from the CSPN mark the location of the 104 K swept-up inner nebular shell. The spatial profiles of the C iii and C iv lines are generally consistent with those of the H and [O iii] lines associated with the inner shell. On the other hand, the profile of the X-ray emission from the 106 K hot gas shows an eastern peak at 20 and a shoulder of declining emission towards the west. This irregular profile is due to the low count rate, but suggests that the X-ray-emitting gas is confined within a region with radius 3″. These new profiles confirm the interpretation of Chu et al. (2001) that the X-ray-emitting gas is confined within the cool nebular shell.
Interestingly, the useful section of the spatial profile of the N v emission peaks at intermediate positions (grey shades in Figure 2), 3″, between the optical lines from the optical nebular shell and the X-ray emission from the hot bubble. The N v ion cannot be produced by photoionization because the effective temperature of the CSPN of NGC 6543 is only 50,000 K; thus it must be produced by thermal collisions at temperatures of 105 K, as expected in the mixing layer.
The observed spatial profile of the N v 1239 emission line can be used to estimate the radius and thickness of mixing layer. Assuming a constant-emissivity cylindrical shell with radius and thickness , we derived an outer radius of 37 and a thickness 27% this radius (i.e., 10). At a distance of 1.00.3 kpc (Reed et al., 1999), this implies a thickness of 1.51016 cm. The H profile can be fit similarly to derive an outer radius of 46 and a thickness of 09, making its inner edge coincident with the outer edge of the mixing layer.
The estimated thickness of the mixing layer in NGC 6543 can be compared with our numerical results (Toalá & Arthur, 2014). Our post-AGB model with 0.633 predicts a mixing layer with a thickness of 1.8 cm by the time the hot bubble reaches a similar average radius as that of NGC 6543 ( pc). This is very similar to the measured thickness. However, this thickness only covers 10 cells in our current models, and thus the mixing layer is not sufficiently sampled. New high-resolution simulations are needed to make accurate predictions on the evolution and physical properties (spatial extent, density, and temperature) of the mixing layers in PNe.
3.3. Mixing Layer Electron Density and Pressure
We estimated the density of the mixing layer by assuming a simple geometry of the N v 1239-emitting region: a cylindrical shell with an outer radius of 37 and an inner radius of 27. The intensity of the N v 1239 line of the interface layer, as measured from the extracted spectrum, is 6.310-14 erg cm-2 s-1. This line intensity can be expressed as:
| (1) |
Here and are number densities of the electron and the N4+ ion, respectively; is the photon energy (in ergs) of the N v 1239 line; (1,2; ) is the Maxwellian-averaged collision strength of the N4+ 2s 2S1/2 – 2p 2P transition, which is derived using the collision strength of N4+ 2s 2S – 2p 2Po calculated by Cochrane & McWhirter (1983) and Equation (3.21) in Osterbrock & Ferland (2006); is the statistical weight of the lower level (for N4+, = 2); is the excitation energy of the upper level (in the case of N v 1239, = 10.008 eV, which corresponds to 1.60310-11 ergs); is the distance to NGC 6543; is the emitting volume in cm3.
Here can be derived from the STIS slit width (02, corresponding to 3.01015 cm) and the cylindrical shell of the UV-emitting mixing layer (as assumed at the beginning of this section) using the equation
| (2) |
where and are the outer and inner radius of the cylindrical shell, respectively (5.51016 cm and 4.01016 cm at 1 kpc), and is the thickness covered by the STIS long slit (3.01015 cm); is the lower limit of the integration, which corresponds to 3.71016 cm from the CSPN according to the region selected for spectral extraction. The likely inhomogeneity of the 2105 K, N v 1239-emitting gas due to hydrodynamical instabilities can be accounted for by adding a filling factor, , to Equation 1.
In the interface layer, the N4+/H+ ionic abundance ratio was assumed to be close to the nebular nitrogen abundance (N/H), which is 2.3010-4 (Bernard-Salas et al., 2003). This nebular abundance is consistent with the stellar wind abundance (2.290.5310-4; Georgiev et al., 2008). Combining Equations 1 and 2 and by introducing a filling factor , we deduced an expression of the electron density as a function of temperature, = 6.1 (5.808104/). This function shows that when the temperature varies in the range 1105–3105 K, the electron density is always close to 180 cm-3 for the interface layer.
This density and the adopted temperature of 2105 K imply a thermal pressure of 210-8 dyn cm-2 in the mixing layer, which agrees with the pressure of the hot bubble and the ionized swept-up shell (Gruendl et al., 2004), probably implying the filling factor 1.
4. Conclusions
We present high-spatial resolution HST STIS UV and optical spectroscopy of the Cat’s Eye Nebula (NGC 6543). Our STIS observations enabled the first view of the spatial distribution of the mixing-layer gas. This mixing layer, probed by the collisionally-ionized N v UV emission line, is located exactly between the optical nebular rim and the X-ray-emitting hot bubble as previously detected by Chandra.
We estimate a thickness of 1.5 cm for the mixing layer, which is consistent with predictions of our 2D radiation-hydrodynamic simulations of the hot bubbles in PNe (Toalá & Arthur, 2014). The estimated electron density and thermal pressure of this layer are found to be 180 cm-3 and 210-8 dyn cm-2, respectively, assuming a cylindrical shell of the 2 K, UV-emitting gas. This thermal pressure agrees with that in the hot bubble and ionized nebular rim of NGC 6543, suggesting hydrodynamical equilibrium. New higher-resolution radiation-hydrodynamic numerical simulations will be carried out to investigate the evolution and properties of the mixing layer in young PNe (Toalá & Arthur, in preparation).
It is worth mentioning that the physical configuration of the mixing layer in PNe is also expected to occur within wind-blown bubbles that exhibit diffuse, soft X-ray emission such as the Orion Nebula, Wolf-Rayet bubbles, and superbubbles (e.g., Güdel et al., 2008; Jaskot et al., 2011; Ruiz et al., 2013; Toalá et al., 2012). Future UV observations towards other PNe and wind-blown bubbles, such as the Wolf-Rayet bubble NGC 6888, will help us understand and unveil the physics of the mixing layer and its relation to the existence of the diffuse X-ray-emitting gas in hot bubbles.
Facilities: HST (STIS).
References
- Balick (2004) Balick, B. 2004, AJ, 127, 2262
- Bernard-Salas et al. (2003) Bernard-Salas, J., Pottasch, S. R., Wesselius, P. R., & Feibelman, W. A. 2003, A&A, 406, 165
- Cerruti-Sola & Perinotto (1985) Cerruti-Sola, M., & Perinotto, M. 1985, ApJ, 291, 237
- Chu et al. (2001) Chu, Y.-H., Guerrero, M. A., Gruendl, R. A., et al. 2001, ApJ, 553, L69
- Cochrane & McWhirter (1983) Cochrane, D. M., & McWhirter, R. W. P. 1983, Phys. Scr., 28, 25
- Frank et al. (1990) Frank, A., Balick, B., & Riley, J. 1990, AJ, 100, 1903
- Freeman et al. (2014) Freeman, M., Montez Jr., R., Kastner, J. H., et al. 2014, ApJ, 794, 99
- Georgiev et al. (2008) Georgiev, L. N., Peimbert, M., Hillier, D. J., Richer, M. G., Arrieta, A., & Peimbert, A. 2008, ApJ, 681, 333
- Gruendl et al. (2004) Gruendl, R. A., Chu, Y.-H., & Guerrero, M. A. 2004, ApJ, 617, L127
- Güdel et al. (2008) Güdel, M., Briggs, K. R., Montmerle, T., et al. 2008, Science, 319, 309
- Guerrero et al. (2000) Guerrero, M. A., Chu, Y.-H., & Gruendl, R. A. 2000, ApJS, 129, 295
- Guerrero et al. (2005) Guerrero, M. A., Chu, Y.-H., Gruendl, R. A., & Meixner, M. 2005, A&A, 430, L69
- Guerrero & de Marco (2013) Guerrero, M. A., & de Marco, O. 2013, A&A, 553, A126
- Guerrero et al. (2002) Guerrero, M. A., Gruendl, R. A., & Chu, Y.-H. 2002, A&A, 387, L1
- Iping et al. (2002) Iping, R. C., Sonneborn, G., & Chu, Y.-H. 2002, BAAS, 34, 1254
- Jaskot et al. (2011) Jaskot, A. E., Strickland, D. K., Oey, M. S., Chu, Y.-H., & García-Segura, G. 2011, ApJ, 729, 28
- Kalberla et al. (2005) Kalberla, P. M. W., Burton, W. B., Hartmann, Dap, et al. 2005, A&A, 440, 775
- Kastner et al. (2008) Kastner, J. H., Montez Jr, R., Balick, B., & De Marco, O. 2008, ApJ, 672, 957
- Kastner et al. (2012) Kastner, J. H., Montez Jr, R., Balick, B., et al. 2012, AJ, 144, 58
- Kastner et al. (2000) Kastner, J. H., Soker, N., Vrtilek, S. D., & Dgani, R. 2000, ApJ, 545, L157
- Kastner et al. (2001) Kastner, J. H, Vrtilek, S. D., & Soker, N. 2001, ApJ, 550, 189
- Kwok (1983) Kwok, S. 1983, in IAU Symp. 103, Planetary Nebulae, ed. D. R. Flower, p. 293
- Miranda & Solf (1992) Miranda, L. F., & Solf, J. 1992, A&A, 260, 397
- Osterbrock & Ferland (2006) Osterbrock, D. E., & Ferland, G. J. 2006, Astrophysics of Gaseous Nebulae and Active Galactic Nuclei (Sausalito, CA: Univ. Science Books)
- Prinja et al. (2007) Prinja, R. K., Hodges, S. E., Massa, D. L., Fullerton, A. W., & Burnley, A. W. 2007, MNRAS, 382, 299
- Pwa et al. (1984) Pwa, T. H., Mo, J. E., & Pottasch, S. R. 1984, A&A, 139, L1
- Reed et al. (1999) Reed, D. S., Balick, B., Hajian, A. R., et al. 1999, AJ, 118, 2430
- Ruiz et al. (2013) Ruiz, N., Chu, Y.-H., Gruendl, R. A., Guerrero, M. A., Jacob, R., Schönberner, D., & Steffen, M. 2013, ApJ, 767, 35
- Shull & van Steenberg (1982) Shull, J. M., & van Steenberg, M. 1982, ApJS, 48, 95
- Soker (1994) Soker, N. 1994, AJ, 107, 276
- Steffen et al. (2008) Steffen, M., Schönberner, D., & Warmuth, A. 2008, A&A, 489, 173
- Toalá & Arthur (2014) Toalá, J. A., & Arthur, S. J. 2014, MNRAS, 443, 3486
- Toalá et al. (2012) Toalá, J. A., Guerrero, M. A., Chu, Y.-H., et al. 2012, ApJ, 755, 77
- Williams et al. (2008) Williams, R., Jenkins, E. B., Baldwin, J. A., et al. 2008, ApJ, 677, 1100
- Winkel et al. (2016) Winkel, B., Kerp, J., Flöer, L., Kalberla, P. M. W., Ben Bekhti, N., Keller, R., & Lenz, D. 2016, A&A, 585, A41