Critical Test Of Gamma-ray Burst Theories
Abstract
Very long and precise follow-up measurements of the X-ray afterglow of very intense gamma-ray bursts (GRBs) allow a critical test of GRB theories. Here we show that the single power-law decay with time of the X-ray afterglow of GRB 130427A, the record-long and most accurately measured X-ray afterglow of an intense GRB by the Swift, Chandra and XMM Newton space observatories, and of all other known intense GRBs, is that predicted by the cannonball (CB) model of GRBs from their measured spectral index, while it disagrees with that predicted by the widely accepted fireball (FB) models of GRBs.
pacs:
98.70.Rz, 98.38.FsI Introduction
Gamma-ray bursts are brief flashes of gamma rays lasting between few milliseconds and several hours [1] from extremely energetic cosmic explosions [2]. They are usually followed by a longer-lived ”afterglow” emitted mainly at longer wavelengths [3] (X-ray, ultraviolet, optical, infrared, microwave and radio). Roughly they fall into two classes, long duration ones (GRBs) that last more than 2 seconds, and short hard bursts (SHBs) that typically last less than 2 seconds [4]. The GRBs seem to be the beamed radiation emitted by highly relativistic jets [5] ejected in broad line supernova explosions of type Ic [6], following collapse of rapidly rotating stripped envelope high mass stars to a neutron star, quark star, or black hole. The origin of SHBs is not known yet, but it is widely believed to be highly relativistic jets presumably emitted in a phase transition in/of a compact star (white dwarf, neutron star or quark star) to a more compact state following cooling and loss of angular momentum, or in merger of compact stars in close binaries due to gravitational wave emission [7].
In the past two decades, two theoretical models of GRBs and their afterglows, the fireball (FB) model [8] and the cannonball (CB) model [9], have been used extensively to interpret the mounting observational data on GRBs and their afterglows. Both models were claimed to describe successfully the observational data. But, despite their similar names, the two models were and still are quite different in their basic assumptions and predictions (compare, e.g., [10] and [11]). Hence, at most, only one of them can provide a correct physical theory of GRBs and their afterglows.
In the CB model [9], bipolar jets that are made of a succession of highly relativistic plasmoids (cannonballs) are assumed to be launched in accretion episodes of fall-back matter onto the newly formed compact object in broad-line SNeIc akin to SN1998bw. The gamma-ray pulses in a GRB are produced by inverse Compton scattering of glory light -the light halo formed around the progenitor star by scattered light from pre-supernova ejections- by the electrons enclosed in the CBs. The afterglow is mainly synchrotron radiation emitted from the electrons of the external medium which are swept into the CBs and are accelerated there to very high energies by turbulent magnetic fields.
The FB models of GRBs evolved a long way from the original spherical FB models [8] to the current conical models [11] which assume that GRBs are produced by bipolar jets of highly relativistic thin conical shells ejected in broad line SNeIc explosions. In these models, the prompt emission pulses are synchrotron radiation emitted in the collisions between overtaking shells, while the continuous collision of the merged shells with the circumburst medium drives a forward shock into the medium and a reverse shock in the merged shells, which produce the synchrotron radiation afterglow.
The claimed success of both models to describe well the mounting observational data on GRBs and their afterglows, despite their complexity and diversity, may reflect the fact that their predictions depend on several choices and a variety of free parameters, which, for each GRB, are adjusted to fit the observational data. As a result, when successful fits to observational data were obtained, it was not clear whether they were due to the validity of the theory or due to the multiple choices and free adjustable parameters. Scientific theories, however, must be falsifiable [12]. Hence, only confrontations between accurate observational data and the key predictions of the GRB models, which do not depend on free adjustable parameters, can serve as critical tests of the validity of such models.
Critical tests of the origin of the prompt gamma-rays are provided, e.g., by their measured polarization, correlations between various prompt emission properties, and the GRB prompt emission energy relative to that of its afterglow. While the observations have confirmed the predictions of the CB model they have challenged those of the standard FB models [13].
Critical tests of the GRB theories are also provided by the observed GRB afterglow. In the FB model the origin of the afterglow is a forward shock in the circumburst medium driven by the ultra-relativistic jet, while in the CB model the afterglow is produced by the Fermi accelerated electrons which are swept into the jet. That, together with the different jet geometries, result in different falsifiable predictions for the afterglow light-curves. In particular, conical FB models predict a broken power-law decline of the light curve of the afterglow [14] where the pre-break temporal decline index increases by for an ISM like density distribution, or by for a wind-like density distribution, independent of of the afterglow frequency [11]. The observed breaks in GRB afterglows, however, often are chromatic breaks with a break-time and that depend on frequency and satisfy neither (see, e.g., FIG. 1) nor the FB closure relations [11]. E.g., an analysis of the Swift X-ray data on the 179 GRBs detected between January 2005 and and January 2007 and the optical AGs of 57 pre- and post-Swift GRBs did not find any burst satisfying all the criteria of a jet break [15]. Moreover, many GRBs have afterglows that do not show any break at all. Consequently, it has been suggested that, perhaps, these ’missing jet breaks’ take place at rather late-time, when the observations are not precise enough anymore or after they end [16].
Recently, however, the X-ray afterglow of GRB 130427A, the brightest gamma-ray burst detected by Swift [17] in the last 30 years, was followed with high precision by the sensitive X-ray observatories Chandra and XMM Newton for a record-breaking baseline longer than 80 million seconds [18], which allows a critical test of both the standard FB models and the CB model. Detailed comparison between the observed late-time X-ray afterglow of GRB 130427A, and that predicted by the standard fireball models has already been carried in [18]. It was concluded there that the forward shock mechanism of the standard FB models with plausible values for the physical parameters involved cannot explain the data, in both cases of constant density and stellar-wind circumburst media.
In contrast, in this paper we show that the observed X-ray afterglow of the very intense GRB 130427A that decays with time like a single power-law with no visible jet break until the end of the measurements, is that expected from the CB model for very intense GRBs, and its temporal decay index is precisely that expected in the CB model from its measured spectral index. Moreover, we show that, within errors, this is also the case for the late-time X-ray afterglows of all the 28 most intense GRBs with known redshift , whose late-time afterglow was well measured.
II The X-ray Afterglow In The CB Model
The circumburst medium in front of a CB moving with a highly relativistic bulk motion Lorentz factor is completely ionized by the CB’s radiation. In the CB’s rest frame, the ions of the medium that are swept in generate within the CB turbulent magnetic fields whose energy density is assumed to be in approximate equipartition with that of the impinging particles. The electrons that enter the CB with a Lorentz factor in the CB’s rest frame are Fermi accelerated there and cool by emission of synchrotron radiation (SR), which is isotropic in the CB’s rest frame and has a smoothly broken power-law. In the observer frame, the emitted photons are beamed into a narrow cone along the CB’s direction of motion by its highly relativistic motion, their arrival times are aberrated, and their energies are boosted by its Doppler factor and redshifted by the cosmic expansion during their travel time to the observer. For and a viewing angle relative to the CB direction of motion, the Doppler factor satisfies .
The observed spectral energy density (SED) of the unabsorbed synchrotron X-rays has the form (see, e.g., Eq. (28) in [10])
| (1) |
where is the baryon density of the external medium encountered by the CB at a time and is the spectral index of the emitted X-rays, .
The swept-in ionized material decelerates the CB motion. Energy-momentum conservation for such a plastic collision between a CB of a baryon number , a radius and an initial Lorentz factor , which propagates in a constant density ISM at a redshift , yields the deceleration law (Eq. (4) in [19])
| (2) |
where is the time in the observer frame since the beginning of the afterglow, and is the deceleration time-scale.
For a constant-density ISM, Eqs. (1) and (2) yield an afterglow whose shape depends only on three parameters: the product , the deceleration time scale , and the spectral index . As long as , and consequently also change rather slowly with and generate a plateau phase of , which lasts until . Well beyond , Eq. (2) yields and
| (3) |
where
| (4) |
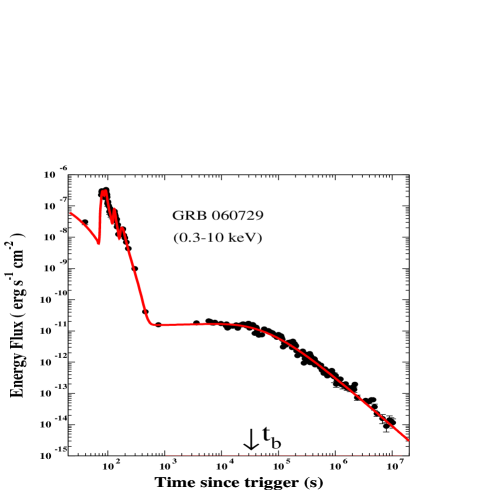
Such a canonical behavior of the X-ray afterglow of GRBs (which was predicted by the CB model [20] long before its empirical discovery with Swift [21]), is demonstrated in Figure 1, where the 0.3-10 keV X-ray light-curve of GRB 060729 that was measured with the Swift XRT [17] is plotted together with its best-fit CB model light-curve [10]. Its late-time afterglow between s shows a power-law decline with [17]. In the the CB model, Eq. (4) and the measured photon index [17] yields , in good agreement with its observed value. Figure 1 also demonstrates that: (1) the observed fast decline of the prompt X-ray emission is much steeper than that expected in the FB model from high latitude emission with [11] for an observed , (2) the observed during the plateau phase does not satisfy the FB model pre-break closure relations, (3) the increases of by beyond the break does not satisfy , and (4) the closure relation of the standard FB model [11] beyond the break is not satisfied.
III X-ray Afterglows With Missing Breaks
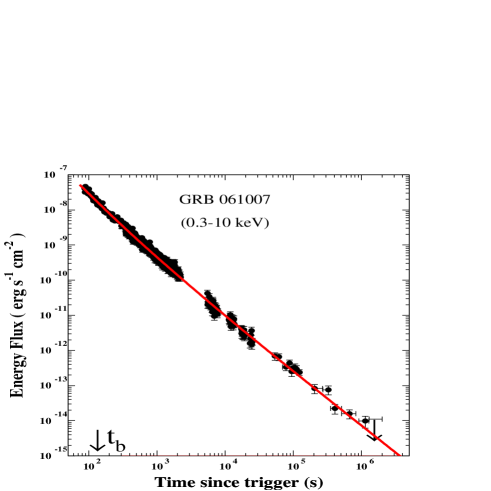
In the CB model, the break/bend time of the afterglow in the GRB rest frame satisfies [22] , where and are, respectively, the GRB equivalent isotropic gamma-ray energy and the observed peak photon energy. Hence, very intense GRBs with relatively large and values have a relatively small , which can be hidden under the prompt X-ray emission or its fast decline phase [10]. Consequently, only the post break temporal decline of the afterglow with a decay index is observed [10]. This is demonstrated in Figure 2 where the light-curve of the 0.3-10 keV X-ray afterglow of the very intense ( erg [23]) GRB 061007 that was measured with the Swift XRT [17] is plotted together with the best-fit single power-law temporal decay index . This temporal index is in good agreement with predicted by Eq. (4).
To test further whether relation (4) is satisfied universally by the X-ray afterglow of the most energetic GRBs, we have extended our test to the X-ray afterglows of all GRBs with known redshift and erg, which were followed up with an X-ray space based observatory for at least a few days, assuming a single power-law decline (corresponding to a constant ISM density along the CB trajectory). These GRBs are listed in Table 1 together with their measured redshift , , temporal decay index and spectral index .
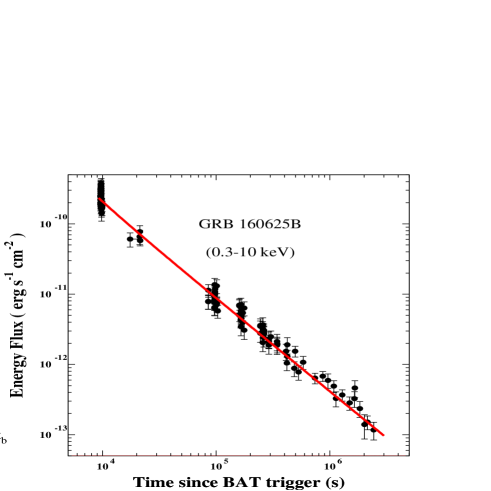
The most energetic GRB listed in Table 1 is GRB 160625B, at redshift z=1.406, with erg measured by KONUS-Wind. In Figure 3, the light curve of its X-ray afterglow that was measured with the Swift XRT [17] is compared to its best fit single power-law light curve. The best fit power-law has a temporal decay index in good agreement with the expected value from Eq. (4) and the measured spectral index [17].
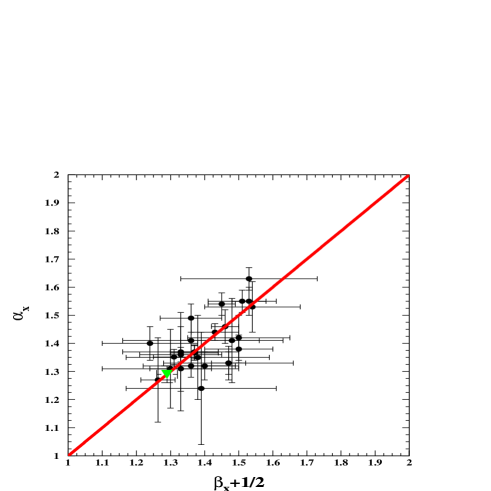
In Figure 4, the measured values of and for the 28 most intense GRBs with known redshift that are listed in Table 1 are compared to the CB model prediction (line) as given by Eq. (4). The best-fit line to the data yields a=1.007.
IV The X-ray Afterglow Of GRB 130427A
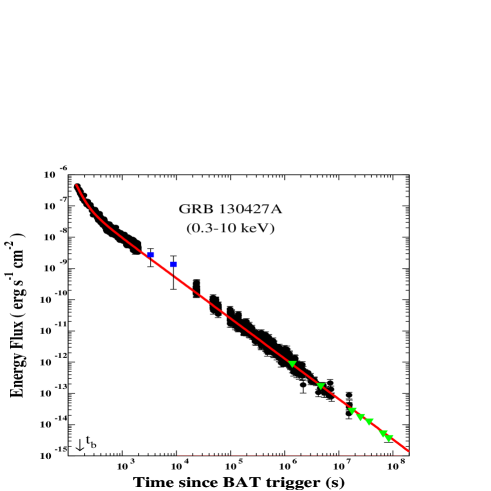
The most accurate test, however, of the CB model relation for a single GRB is provided by the follow-up measurements of the X-ray afterglow of GRB 130427A, the most intense GRB ever detected by Swift, with the Swift XRT and with the sensitive X-ray observatories XMM Newton and Chandra up to a record time of 83 Ms after burst [17]. The measured light-curve has a single power-law decline with in the time interval 47 ks - 83 Ms. The best single power-law fit to the combined measurements of the X-ray light-curve of GRB 130427A with the Swift-XRT [17], XMM Newton and Chandra [18], and Maxi [25] that is shown in Figure 5 yields . The CB model prediction as given by Eq. (4,) with the measured spectral index [18], is , in remarkable agreement with its best fit value.
No doubt, the assumptions of a constant density circumburst medium is an over simplification: Long duration GRBs are produced in supernova explosions of type Ic of short-lived massive stars, which take place mostly in superbubbles formed by star formation. Such superbubble environments may have a bumpy density, which deviates significantly from the assumed constant-density ISM. Probably it is responsible for the observed deviations from the predicted smooth light-curves and values slightly larger than 1. Moreover, in a constant-density ISM, the late-time distance of a CB from its launch point is given roughly by,
| (5) |
It may exceed the size of the superbubble and even the scale-height of the disk of the GRB host galaxy. In such cases, the transition of a CB from the superbubble into the Galactic ISM, or into the Galactic halo in face-on disk galaxies, will bend the late-time single power-law decline into a more rapid decline, depending on the density profile above the disk. Such a behavior may have been observed by the Swift XRT [17] in a few GRBs, such as 080319B and 110918A, at s and in GRB 060729 at s by Chandra [26].
V Discussion and conclusions
The 83-Ms long follow-up measurements with the Swift XRT and the sensitive Chandra and XMM Newton observatories [18] of the X-ray afterglow of GRB 130427A, the brightest gamma-ray burst detected in the last 30 years, , allowed the most accurate test so far of the main falsifiable predictions of the standard FB models for the X-ray afterglow of GRBs. These predictions are a broken power-law light-curve with a late-time achromatic break, a post break temporal decay index larger by than its pre-break value, and closure relations between the temporal decay index and the spectral index of the afterglow for both pre-break and post break times. The precise record-long measurements of the X-ray afterglow of GRB 130427A disagree with these predictions of the standard FB models where a conical jet drives a forward shock into the circumburst medium [18]. In particular, the closure relations predicted by the fireball model require far-fetched values for the physical parameters involved, in both cases of constant density and a wind-like circumburst medium [18].
In contrast, the observed temporal decline like a single unbroken power-law of the light-curve of the 0.3-10 keV X-ray afterglow of GRB 130427A is that predicted by the CB model for the measured spectral index of its afterglow. In the CB model, the X-ray afterglow has a deceleration break that takes place at a time after the beginning of the afterglow (not necessarily the beginning of the GRB), and satisfies the correlation [23]. Consequently, in very intense GRBs, the break is often hidden under the prompt emission or its fast decline phase. For GRB 130425A at z=0.34, with Eiso erg and keV [27], the above correlation [20] yields a deceleration break at s, which, probably, was hidden under the fast declining phase of the prompt emission (see Figure 5).
Moreover, most of the X-ray afterglows of the 28 most intense GRBs among the GRBs with known redshift that were followed long enough with one or more of the space based X-ray telescopes Beppo-SAX, Swift, Chandra and XMM-Newton, have light-curves with temporal and spectral indices that satisfy within errors the relation predicted by the CB model for a constant density circumburst medium.
Furthermore, in the FB models, the predicted achromatic break in the light curve of the X-ray afterglow of GRBs is a direct consequence of the assumed conical geometry of the the highly relativistic jet - a conical shell with a half opening angle , where is the initial bulk motion Lorentz factor of the jet. The failure of the conical fireball models to predict correctly the observed break properties in GRB afterglows, and the absence of a jet break in the X-ray afterglow of very intense GRBs such as 130427A, probably, is due to the assumed conical geometry. This is supported by the fact that, unlike the cannonball model, the conical fireball models have failed to predict other major properties of GRBs which strongly depend on the assumed conical jet geometry. That includes the failure to predict/reproduce the observed canonical shape of the lightcurve of the X-ray afterglow of GRBs [21] and the main properties of its various phases: The rapid spectral softening during the fast decline phase of the prompt emission, which was interpreted in the framework of the conical FB models as high latitude emission [28], was not expected/predicted. The plateau phase that follows was not reproduced and was interpreted aposteriory by postulating continuous energy injection into the blast wave by hypothetical central GRB engines, such as magnetars [29]. Furthermore, unlike the cannonball model, where X-ray flashes (XRFs) and low-luminosity GRBs were successfully explained as GRBs produced by SNeIc akin to SN1998bw and viewed far off axis [30], the collimated fireball models could not explain why GRBs such as 130427A and 980425, which were produced by the very similar broad line stripped envelope SN2013c and SN1998bw, respectively [31], have isotropic equivalent energies which differ by six orders of magnitude. Moreover, the GRB/SN association and the short lifetime of of the massive stars which produce SNeIc imply that the rates of GRBs and star formation are related. But, while the cannonball model predicted correctly the redshift distribution of the joint population of GRBs and XRFs from the observed dependence of the star formation rate on redshift (32), the conical fireball model did not (33).
| GRB | z | Eiso | |||
|---|---|---|---|---|---|
| 990123 | 1.6 | 2.78 | |||
| 010222 | 1.477 | 1.14 | |||
| 061007 | 1.26 | 1.0 | |||
| 070328 | 2.0627 | 0.64 | |||
| 080607 | 3.036 | 1.87 | |||
| 080721 | 2.591 | 1.21 | |||
| 080810 | 3.35 | 0.5 | |||
| 080916C | 4.35 | 0.88 | |||
| 090323 | 3.57 | 3.98 | |||
| 090423 | 8.26 | 0.89 | |||
| 090812 | 2.452 | 0.44 | |||
| 090902B | 1.822 | 3.6 | |||
| 090926A | 2.1062 | 2.0 | |||
| 110205A | 2.22 | 1.36 | |||
| 110422A | 1.77 | 0.72 | |||
| 110731A | 2.83 | 0.46 | |||
| 110918A | 0.984 | 2.11 | |||
| 130427A | 0.3399 | 0.85 | |||
| 130505A | 2.27 | 3.8 | |||
| 131108A | 2.4 | 0.58 | |||
| 140419A | 3.956 | 1.9 | |||
| 140206A | 2.73 | 2.4 | |||
| 150206A | 2.087 | 0.6 | |||
| 150314A | 1.758 | 0.69 | |||
| 150403A | 3.139 | 0.6 | |||
| 151021A | 2.330 | 1.0 | |||
| 160131A | 0.972 | 0.83 | |||
| 160625B | 1.406 | 5.0 |
Acknowledgment: We thank an anonymous referee for useful comments and suggestions.
References
- (1) R. W. Klebesadel, I. B. Strong and R. A. Olson, Astrophys. J. 182, L85 (1973).
- (2) C. A. Meegan et al. Nature, 355, 143 (1992); G. J. Fishman and C. A. Meegan, Ann. Rev. Astr. Astrophys. 33 415 (1995).
- (3) E. Costa et al. Nature, 38, 783 (1997) [arXiv:astro-ph/9706065]; J. van Paradijs et al., Nature, 386, 686 (1997); H. E. Bond, IAU circ. 6665 (1997); D. A. Frail et al., Nature, 389, 261 (1997).
- (4) J. P. Norris et al. Nature, 308, 434 (1984); C. Kouveliotou et al. Astrophys. J. 413, L101 (1993).
- (5) N. Shaviv and A. Dar, Astrophys. J. 447, 863 (1995) [arXiv:astro-ph/9407039]; A. Dar, Astrophys. J. 500, L93 (1998) [arXiv:astro-ph/9709231].
- (6) T. J. Galama et al. Nature, 395, 670 (1998) [arXiv:astro-ph/9806175].
- (7) See, e.g., S. Dado, A. Dar, and A. De Rújula, Astrophys. J. 693, 311 (2009) [arXiv:0807.1962] and references therein.
- (8) B. Paczynski, 1986, ApJ, 308, L43 (1986); J. Goodman,, ApJ, 308, L47 (1986); P. Meszaros and M. J. Rees, ApJ, 418, L59 (1993) [arXiv:astro-ph/9309011]. For an early review see, e.g., T. Piran, Phys. Rep. 314, 575 (1999) [arXiv:astro-ph/9810256] and references therein.
- (9) See, e.g., [5]; S. Dado, A. Dar, and A. De Rújula, Astr. & Astrophys. 388, 1079 (2002) [arXiv:astro-ph/0107367]; A. Dar and A. De Rújula, Phys. Rep. 405, 203 (2004) [arXiv:astro-ph/0308248], and references therein.
- (10) S. Dado, A. Dar, and A. De Rújula, Astrophys. J. 696, 964 (2009) [arXiv:0809.4776], and references therein.
- (11) See, e.g., P. Kumar and B. Zhang, Phys. Rep. 561, 1 (2015) [arXiv:1410.0679] and references therein.
- (12) K. M. Popper, The Logic of Scientific Discovery, Routledge Classics 1959.
- (13) For confrontations of predictions of both the FB model and the CB model with observations, see, e.g., A. Dar, Chin. J. Astron. Astrophys. 6, 301 (2006) [arXiv:astro-ph/0511622] (major properties), C. Wigger et al. ApJ, 675, 553, (2008) [arXiv:0710.2858] (prompt gamma-ray emission), S. Dado, A. Dar and A. De Rujula ApJ, 681, 1408, (2008) [arXiv:0709.4307] (the fast decline phase of the prompt emission), S. Dado and A. Dar, ApJ, 775, 16 (2013) [arXiv:1203.5886] (correlations between and among the prompt gamma-ray and the X-ray afterglow emissions), ApJ, 785, 70 (2014) [arXiv:1307.5556] (consitency with star formation history), S. Covino and D. Gotz, arXiv:1605.03588 (the large linear polarization of the prompt -rays in all GRBs where the polarization was claimed to be measured: 930131, 960924, 021206, 041291A, 061122, 100826A, 110301A, 110721A, 140206A.
- (14) R. Sari, T. Piran, and J. P. Halpern, Astrophys. J. 519, L17 (1999) [arXiv:astro-ph/9903339]; J. E. Rhoads, Astrophys. J. 525, 737 (1999) [arXiv:astro-ph/9903400]; F. van Eerten, and A. MacFadyen, Astrophys. J. 767, 141 (2013) [arXiv:1209.1985].
- (15) E.g., E. W. Liang et al. Astrophys. J. 675, L528 (2008) [arXiv:0708.2942]; D. N. Burrows and J. Racusin, Il Nuovo Cimento B 121, 1273 (2007) [astro-ph/0702633]; P. A. Curran, A. J. Van Der Horst and R. A. M. J. Wijers, Mon. Not. Roy. Astr. Soc. 386, 859 (2008) [arXiv:0710.5285]; and Ref. [16].
- (16) J. L. Racusin et al. AIP Conf. Proc. 1000, 196 (2008) [arXiv:0801.4749]; J. L. Racusin et al. Astrophys. J. 698, 43 (2009) [arXiv:0812.4780];
- (17) P. A. Evans et al., (Swift-XRT GRB light-curve repository http://www.swift.ac.uk/xrt-curves/) Mon. Not. Roy. Astr. Soc. 397, 1177 (2009) [arXiv:0812.3662].
- (18) M. De Pasquale et al. arXiv:1602.04158.
- (19) S. Dado and A. Dar, Astrophys. J. 761, 148 (2012) [arXiv:1203.1228].
- (20) S. Dado, A. Dar, and A. De Rújula, Astr. & Astrophys. 388, 1079 (2002) [arXiv:astro-ph/0107367, Figures 26-33].
- (21) J. A. Nousek et al., Astrophys. J. 642, 389, (2006) [arXiv:astro-ph/0508332]; G. Chincarini et al., Astrophys. J. 671, 1903 (2007) [arXiv:astro-ph/0508332].
- (22) S. Dado and A. Dar, Astr. & Astrophys. 558, 115 (2013) [arXiv:1303.2872].
- (23) S. Golenetskii et al. GCN Circ. 5722 (2006).
- (24) C. G. Mundell et al., Astrophys. J. 660, 489 (2007) [arXiv:astro-ph/0610660].
- (25) A. Maselli et al. Science, 343, 48 (2014) [arXiv:1311.5254]
- (26) D. Grupe et al. Astrophys. J. 711, 1008 (2010) [arXiv:0903.1258].
- (27) S. Golenetskii et al. GCN Circ. 14487 (2013).
- (28) E. E. Fenimore et al., ApJ 473, 998 (1996)[arXiv:astro-ph/9607163]; P. Kumar and A. Panaitescu, ApJ, 541, L51 (2000) [arXiv:astro-ph/0006317]; C. D. Dermer, ApJ 614, 284 (2004) [arXiv:astro-ph/0403508].
- (29) Usov, V. V. 1992, Nature, 357, 472; T. A. Thompson, et al. ApJ, 611, 380 (2004) [arXiv:astro-ph/0401555].
- (30) S. Dado, A. Dar and A. De Rujula A&A, 422, 381 (2004) [arXiv:astro-ph/0309294].
- (31) A. Melandri, et al. A&A, 567, A29 (2014) [arXiv:1404.6654].
- (32) S. Dado and A. Dar, ApJ, 785, 70 (2014) [arXiv:1307.5556].
- (33) B. E. Robertson and R. S. Ellis ApJ, 744, 95 (2012) [arXiv:1109.0990]; J. Wei, et al. MNRAS, 439, 3329 (2014), [arXiv:1306.4415].