Splash Detail Due to Grain Incident on Granular Bed
Abstract
Using the discrete element method (DEM), we study the splash processes induced by the impact of a grain on two types of granular beds, namely, randomly packed and FCC-structured beds. Good correspondence is obtained between our numerical results and the findings of previous experiments, and it is demonstrated that the packing structure of the granular bed strongly affects the splash process. The mean ejection angle for the randomly packed bed is consistent with previous experimental results. The FCC-structured bed yields a larger mean ejection angle; however, the latter result has not been confirmed experimentally. Furthermore, the ejection angle distributions and the vertical ejection speeds for individual grains vary depending on the relative timing at which the grains are ejected after the initial impact. Obvious differences are observed between the distributions of grains ejected during the earlier and later splash periods: the form of the vertical ejection speed distribution varies from a power-law form to a lognormal form with time, and more than 80% of the kinetic energy of all ejected grains is used for earlier ejected grains.
pacs:
Valid PACS appear hereI Introduction
Massive sediment transport phenomena, such as dust storms and drifting snow, pose a considerable threat to human life. Further, the formation of geomorphological patterns on sand-desert and snowfield surfaces as a result of sediment transport, such as dunes and ripples, is of considerable research interest. To elucidate the granular transport that occurs near the surfaces of sand deserts and snow fields, it is necessary to focus on the collisions between wind-blown grains and these surfaces along with the resultant ejection of grains from the surfaces. This approach is merited because, in the case of wind-blown grain transport, the major component of the grain entrainment into the air is caused by both the collision and ejection¥citeBagnold,Sus. This mechanism is called the “splash process.”
Splash processes have been widely studied using various techniques. For example, Werner et al. have simulated grain-bed collision processes in a two-dimensional systemWerner , while Nishida et al. have performed numerical simulations of granular splash behavior in a three-dimensional (3D) system and analyzed the relation between the impact and ejection angles ( and , respectively) projected onto the surface of a granular bedNishida1 . Further, Xing and He have performed 3D collision simulations with mixed binary grainsMao , and Wada et al. have numerically modeled the impact cratering process on a granular targetWada . In a physical experiment, Katsuragi et al. created small-scale craters in a laboratory systemKatsuragi , whereas Sugiura et al. estimated the splash function of snow grains via wind-tunnel experimentsSugiura1 ; Sugiura2 . In addition, Ammi et al. performed a 3D splash experiment and recorded the results using two high-speed cameras, demonstrating that the mean ejection angle of a series of splashed grains is independent of both and the velocity of the incident grains , and it is close to Ammi . In their experiment, a randomly packed (RP) bed was considered, and the final result suggests that the behavior at the first instance of impact during a splash process involving a granular bed has no influence on the later behavior.
In the present study, we perform numerical simulations in order to investigate the splash processes in more detail. Assuming that the packing structure of a granular bed affects the splash behavior, we consider not only an RP bed (an RP bed corresponds to the scenario examined in the experiment of Ammi et al.Ammi , except for differences in the dimensions of the simulation space and the grain features), but also an FCC-structured bed (hereafter, “FCC bed”). Thus, we analyze the dependence of the splash process on the bed structure. In addition, we investigate the details of the ejection grains for each splash paying attention to their ejection timing.
II Model
II.1 Basic Setup
In this study, the splash processes are examined using the discrete element method (DEM). The translational movement of the grains obeys Newton’s law of motion, and grain rotation is neglected. Thus, the equation of motion is
| (1) |
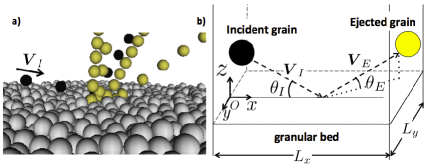
where and are the position and the mass of the i-th grain, respectively; and and are the gravity constant and the vertical unit vector in the upward direction, respectively. and represent the repulsive and dissipative forces acting between the i-th and j-th grains, respectively, as explained in Sect. 2.2. Our “simulation box” consists of a fixed bottom and walls, which make up a roofless 3D cubic container (Fig.1). The walls and the bottom floor are made of the same material as the grains. Two types of initial granular bed structures are prepared (RP and FCC), as explained in greater detail in Sect. 2.3.
A grain is fired at the bed at a certain incident angle and incident speed (Fig. 1(b)). As a result of the collision between the projectile grain and the granular bed, a number of grains are expelled from the bed. Here, we define the initially projected grain as the “incident grain” and the expelled grains that reach a certain threshold height (see Sect. 2.4) as the “ejected grains” (Fig. 1(a)). We exclude the rebounding incident grain from consideration as an ejected grain. In this study, we consider monodispersed grains only; therefore, all of the grains comprising the granular bed and the incident grain have the same mass and radius. The parameters used in the simulation are summarized in Table 1.
| Parameter | Value |
|---|---|
System size (bottom area) |
|
Gravity |
|
Young’s modulus |
|
Grain radius |
0.5 cm |
Grain mass |
0.1 g |
II.2 Grain Interaction
We treat grains as viscoelastic spheres. For the elastic force, we adopt the Hertzian force Hertz , with
| (2) |
where , and are the Young’s modulus, the radius of the i-th grain, and the displacement from the natural contact position , respectively. Further,
| (3) |
where is the unit vector in the normal direction.
To represent the energy dissipation, we adopt the friction force , with
| (4) |
where , , and , are the relative normal velocity, damping coefficient, and the reduced mass, respectively. Note that is relative to the restitution coefficient Tuji . In our simulation, the value of is fixed at 0.9.
II.3 Packing Structure
We construct the initial RP and FCC beds as follows. The RP bed is created through the free falling of 32,768 grains. At first, all grains are placed at random positions in the simulation box, with no overlap. Then, they fall to the bottom as a result of the effects of , losing kinetic energy through the dissipative repulsive force of Eqs. (2)–(5). The packing process is completed after a sufficient relaxation time has elapsed.
On the other hand, the initial positions of the grains in the FCC bed are approximately determined, except for the fine tuning of their positions according to and the nonlinear interactions of Eqs. (2)–(5). Similar to the previous RP procedure, the packing of the FCC structure is completed after a sufficient relaxation time has elapsed. The volume fractions of the RP and FCC beds are approximately 0.63 and 0.74, respectively. In previous experiments with monodispersed spherical beads, the volume fraction of the grains was approximately 0.6 in RP bedsWada ; Ammi ; Rioul . It has been reported for a two-dimensional system that a bed thickness of more than 24 layers is needed to exclude the shockwave effects. The average height of the RP bed surface is approximately 22 grains. To construct the FCC bed, 36,639 grains and a 24-layer pile are used.
II.4 Definition of Injection and Ejection
The pair of and characterize the injection of the incident grain (Fig. 1). For a given and , the incident velocity is determined from . In this study, is set to 10.0, 25.0, or 40.0 m/s while is varied among , and . To obtain sufficient data for statistically meaningful results, 100 splash simulations are conducted for each set of , with different initial positions.
The horizontal coordinate of the “collision point” between the incident grain and the granular bed surface is given randomly within a central horizontal circle on the bed surface, which we call the “incident circle.” The radius of this circle is three times the grain diameter. The center of the incident circle is , where and are the lengths of the and sides of the simulation box, respectively (Fig. 1(b)), and is the highest coordinate of the grain surface (the upper edge of the highest grain) within the above-mentioned incident circle. The initial position of the incident grain (grain center) is , where is the radius of the incident grain, and is the time required for collision with the surface, calculated from the given . We define grains with centers that reach as “ejected grains” and record their ejection velocity , where is above the average bed surface height around the contact point. Furthermore, we define the rebound of the incident grain (“rebound grain”) and its velocity with same definition as the ejected grains. This ejected-grain criterion roughly corresponds to those of previous 3D splash experimentsAmmi ; Rioul . In this paper, we also define as
| (6) |
where , and are the components of (Fig. 1(b)).
III Results
III.1 Incident Energy
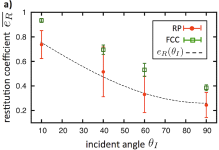
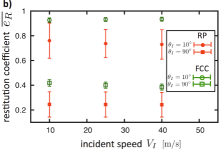
The mean incident energy , which means the energy transferred from the incident grain to the granular beds, is important to consider for the ejected grains. Since is equal to the energy lost by the incident grain, we obtain the following relation: , where , , and is the mean speed of the incident grain at after impact. Therefore, we focus on to characterize the incident energy transferred to the bed. Figure 2 shows that only depends on the incident angle and does not depend on the incident speed; these results reproduce those in previous experimentsWerner ; Ammi . Our result obtained for the RP bed corresponds well with the fitting function
| (7) |
which was proposed in a previous studyAmmi (Fig. 2(a)). In our simulation, and for ; these values are close to those from previous collision experiments. The value of obtained for the FCC bed is larger than that for the RP bed for same pair of and . Because of the lower roughness of the FCC bed surface, the error bars are very small. From aforementioned results, the fraction of incident energy increases with and is independent of , and for the FCC bed is smaller than that for the RP bed.
III.2 Ejection Number
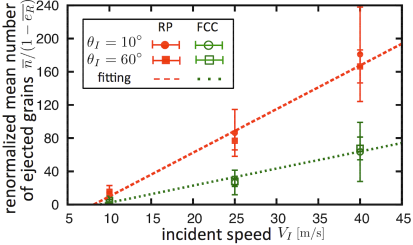
The number of ejected grains after each splash process is related to the amount of kinetic energy transferred from the incident grain to the granular bed. Kinetic energy propagates into the granular bed, in which the energy is dissipated via the interactions between the grains. Because increases in and produce a high value of , the ensemble averages of the mean number of ejected grains for each splash increase with and . In the previous study by Ammi et al., the relation between and was obtained from
| (8) |
where and are the fitting parameters. Our numerical results fit well with Eq. (8), where the values of the parameter pair are (43, 26) for the RP bed and for the FCC bed (Fig. 3). The value of for the case of the RP bed is more than twice that for the FCC bed. This reflects the facts that the grains in the FCC bed experience a stronger geometrical constraint from the neighboring grains than those in the RP bed because of the higher volume fraction of the former, and for the FCC bed is less than that for the RP bed in all pairs of and (Fig 2).
III.3 Ejection Angle
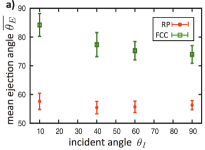
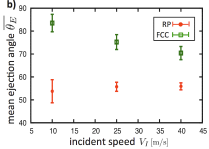
Figure 4 shows the ensemble averages of the mean ejection angle for each splash for various values of (Fig. 4(a)) and (Fig. 4(b)). According to the previously reported RP bed experimentAmmi , remains constant as and are varied. Figure 4(a) shows the dependence of for m/s. In this figure, our for the RP bed remains almost constant and independent of , which is consistent with the previous experimentAmmi . On the other hand, the for the FCC bed clearly varies with , especially at low (Fig. 4(a)). For the FCC bed, become small at low (Fig. 2). This means that the FCC bed obtains insufficient energy to break the geometric constraint caused by the presence of the neighboring grains; hence, the ejection directions are strongly limited to high angles. However, the result for the FCC bed has not been confirmed experimentally. Figure 4(b) shows the dependence of for fixed . For the RP bed, only a weak dependence is observed at low , although this has not been confirmed experimentally Ammi . On the other hand, exhibits an obvious dependence on for the FCC bed. That is, decreases as increases. This is attributed to the magnitude of , as discussed above.
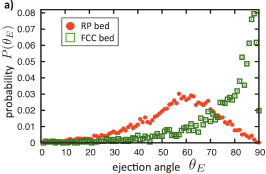
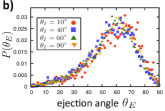
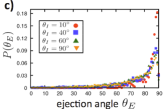
The ejection angle distributions are shown in Fig. 5. for the RP bed obviously differs from that obtained for the FCC bed. The majority of grains ejected from the FCC bed have greater than those ejected from the RP bed (Fig. 5(a)). On the other hand, for the RP bed is independent of , and the shapes and locations of the peaks around exhibit good agreement with the findings of a previous numerical experiment using binary grainsMao (Fig. 5(b)).
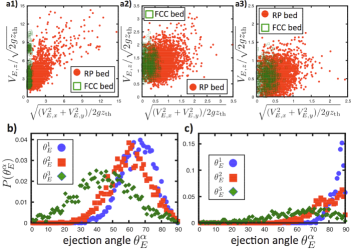
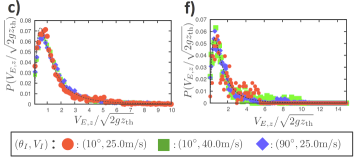
To investigate each splash process in greater detail, we classify the ejected grains into three groups on the basis of their ejection timing. The first group consists of grains that were ejected in the period between the moment of impact and the first third of the total ejection period of each splash process. The ejection angles of the particles in this group are labeled . Similarly, the ejection angles of the grains in groups and , which were ejected within the intermediate period and the last third of each splash process, respectively, are labeled and , respectively. Figure 6 shows scatter plots for grains belonging to the , and groups on the plane, where indicates the projection of onto the bed surface. The ejection angle is defined as the angle between the horizontal axis and the line connecting the origin and each point in Fig. 6(a), which indicates that the magnitude of varies depending on the ejection timing. The distributions of , and (, , and , respectively) for and are also shown for both bed types (Fig. 6(b) and (c)).
Since the peaks of and obtained for the RP bed and those for the FCC bed are at greater angles, these grains seem to be affected by their neighboring grains. This is particularly true in the FCC case (Fig. 6(c)), where the grain movements are obviously restricted to the higher angles: both and have peaks around , but the peak of is higher than that of . The profiles of for both bed types are different than those of and ; the peaks are clearly located within a lower range of angles compared to those of and . As supported by the discussion of the results in the next section, these results for the FCC bed suggest that the grain ejection direction is more strongly restricted by geometrical constraints compared to the RP bed.
III.4 Ejection Velocity
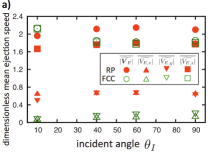
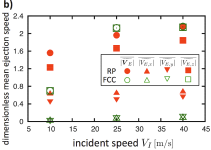
Figure 7 shows the ensamble averages of the mean ejection speed for each splash and its components for various values of (Fig. 7(a)) and (Fig. 7(b)), where . For all pairs of and , the greater part of is . Figure 7(a) shows the dependence of and for m/s. Although there is a slight fluctuation within the low-incident-angle region, remains almost constant as is varied for both bed structures. In the RP bed, there is a small gap between and for . In contrast, and are the almost same for . Figure 7(b) shows the dependency of and for . In this figure, the mean ejection speed increases as increases. These and dependencies are consistent with a previous studyMao .
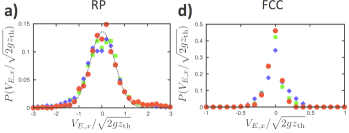
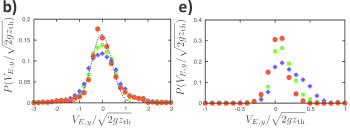
We next investigate the distributions of each component of , , and , for the different bed structures in Fig. 8. For the RP bed, both and have Gaussian distributions (Fig. 8 (a) and (b)), whereas has a log-normal appearance (Fig. 8 (c)). These results are consistent with the findings of previous experimental studiesAmmi ; Rioul . Note that these forms are independent of both and (Fig. 8(a), (b) and (c)). For the FCC bed, appears to be similar to that obtained for the RP bed (Fig. 8 (f)), but both and are more concentrated around 0 m/s than those for the RP bed (Fig. 8 (d) and (e)). Regarding the difference between the for the RP and FCC beds, the latter has a bump within the large range (see also Fig. 6(a1)).
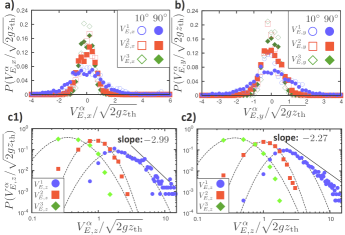
We also define the timing-dependent ejection velocities in conformity to the groups , , and , as , , and , respectively. Figure 9 shows the vertical ejection speed distributions , , and obtained for and for m/s in the RP bed. For all , and have Gaussian-like form, but their forms are different and depend on the ejection timing; and have large variances, and the others have small variances (Fig. 9(a) and (b)). and fit well with the log-normal distributions, but the higher-ejection-speed region of seems to have a power-law form (Fig. 9(c)). That is, the distributions change from a power-law form to a log-normal form as the ejection speed is decreases (or with increasing elapsed time since impact). As this power-law region is only a small fraction of the total vertical ejection speed distribution, the overall distribution throughout each splash process is fit well with a log-normal distribution. This distribution deformation becomes clear with increasing incident angle. Further, these types of distribution transformations have been reported in various fields. For example, fragment experiments have confirmed that the fragment size distribution of glass qualitatively changes from a log-normal distribution to power-law form in accordance with the incident energyMatsushita ; Katsuragi2 . Specifically, log-normal and power-law distributions are exhibited at lower and higher energies, respectively. Therefore, our results may be related to these findings.
III.5 Ejection Energy
We show the energy balances in Fig. 10. The energy balance between the incident energy and the total kinetic energy of the ejected grains is shown in Fig. 10(a). As noted from previous experimentsAmmi , the relation between and is , where is a constant parameter ( in our result). Because the rotational motion of a grain is not considered in this study, that is, the obtained kinetic energy reflects only translational motion, in our study may be greater than in the experiment of Ammi et al ()Ammi . Previously, it was found that depends on the restitution coefficient in a binary collisionCrassous .
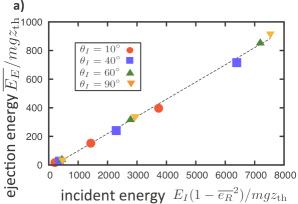
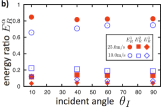
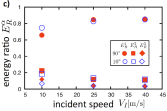
Figure 10(b) and (c) show the energy ratio for the RP bed, where is the total kinetic energy of ejected grains belonging to , and is mean number of ejected grains per impact for . Figure 10(b) shows the dependence of for m/s and m/s, and Fig. 10(c) shows the dependence of for and . In these figures, is almost independent of ; in particular, for larger values of , the values of for and are mostly coincident, and more than 80% of the total ejection energy is used for grains.
IV Summary
We performed 3D splash process simulations using the DEM for two kinds of granular bed structures: a randomly structured bed and an FCC-structured bed. It was found that the mean number of ejected grains for each collision was related to the injection energy. After renormalization by the energy transferred from the incident grain to the granular bed, a good linear fit was obtained between the mean number of ejected grains and the incident speed, with the RP bed ejecting twice as many grains as the FCC bed. Moreover, the ejection angle distributions obtained from the RP and FCC beds were shown to be clearly different. The peak of the ejection angle distribution for the RP bed was approximately ; on the other hand, the distribution obtained for the FCC bed distinctively shifted to greater ejection angles, with a peak of over . This difference is assumed to originate from the geometrical constraints. In other words, the grain movement direction is strongly affected by the surrounding grains in the FCC bed. Furthermore, the ejection velocity distributions for the RP bed exhibited qualitatively good agreement with the results of previous experimentsAmmi . On the other hand, coupled with the ejection angle results, the distributions obtained for the FCC bed indicate that the vertical movement of the ejected grains is dominant and that movement in the horizontal direction is significantly smaller than that for the RP bed.
In addition, the ejected-grain characteristics, i.e., the ejection angle and speed, evidently depend on the ejection timing after the initial grain impact. For the ejection angle, the difference between the ejected grain angles at the beginning and end of each splash is apparent. Regarding the vertical ejection speed, the ejection timing determines the distribution, and this distribution changes from a power-law form to a log-normal form according to the ejection timing. Furthermore, the splashed grains at the beginning of each splash gain retains around 80% of the total kinetic energy of the ejected grains. These results are assumed to be related to the propagation of the impact energy, both along and beneath the surface of the granular bed.
Acknowledgements.
The authors thank A. Awazu and H. Niiya for useful discussions. This research is partially supported by the Platform Project for Supporting in Drug Discovery and Life Science Research (Platform for Dynamic Approaches to Living System) from Japan Agency for Medical Research and Development (AMED)References
- (1) R. A. Bagnold, The Physics of Blown Sand and Desert Dunes, Methuen, London, (1941).
- (2) R. S. Anderson and P. K. Haff, Science, 241, 820-823, (1988).
- (3) B. T. Werner and P. K. Haff, Sedimentology, 35, 189-196, (1988).
- (4) M. Nishida, J. Nagamatsu and K. Tanaka, Journal of Solid Mechanics and Materials Engineering, 5, 164-178, (2011).
- (5) M. Xing and C. He, Geomorphology, 187, 94-100, (2013).
- (6) K. Wada, S. Senshu and T. Matsui, ICARUS, 180, 528-545, (2006).
- (7) H. Katsuragi and D. J. Durian, Nature Physics, 3, 420-423, (2007).
- (8) K. Sugiura and N. Maeno, Boundary-Layer Meteorology, 95, 123-143, (2000).
- (9) J. N. McElwaine, N. Maeno and K. Sugiura, Annals of Glaciology, 38, 71-78, (2004).
- (10) M. Ammi, L. Oger, D. Beladjine and A. Valance, Phys. Rev. E, 79, 021305, (2009).
- (11) H. J. Hertz, Reine Angrew. Math, 92, 156-171, (1881).
- (12) Y. Tsuji, T. Kawaguchi and T. Tanaka, Powder Technology, 77, 79-87, (1993).
- (13) D. Beladjine, M. Ammi, L. Oger and A. Valance, Phys. Rev. E, 75, 061305, (2007).
- (14) F. Rioual, A. Valance and D. Bideau, Phys. Rev. E, 62, 2450, (2000).
- (15) T. Ishii and M. Matsushita, J. Phys. Soc. Jap., 61, 3474-3477, (1992).
- (16) H. Katsuragi, D. Sugino and H. Honjo, Phys. Rev. E, 70, 065103, (2004).
- (17) J. Crassous, D. Beladjine, and A. Valance, Phys. Rev.Lett., 99, 248001, (2007).