The decoupling of the glass transitions in the two-component -spin spherical model
Abstract
Binary mixtures of large and small particles with disparate size ratio exhibit a rich phenomenology at their glass transition points. In order to gain insights on such systems, we introduce and study a two-component version of the -spin spherical spin glass model. We employ the replica method to calculate the free energy and the phase diagram. We show that when the strengths of the interactions of each component are not widely separated, the model has only one glass phase characterized by the conventional one-step replica symmetry breaking. However when the strengths of the interactions are well separated, the model has three glass phases depending on temperature and component ratio. One is the “single” glass phase in which only the spins of one component are frozen while the spins of the other component remain mobile. This phase is characterized by the one-step replica symmetry breaking. The second is the “double” glass phase obtained by cooling further the single glass phase, in which the spins of the remaining mobile component are also frozen. This phase is characterized by the two-step replica symmetry breaking. The third is also the “double” glass phase, which however is formed by the simultaneous freezing of the spins of both components at the same temperatures and is characterized by the one-step replica symmetry breaking. We discuss the implications of these results for the glass transitions of binary mixtures.
1 Introduction
The -spin spherical model (PSM) has been playing important roles in the study of the glass transition of liquids, because it shares many common properties in dynamics and thermodynamics with glass forming liquids [1, 2, 3, 4]. The PSM is the infinite range spin glass model in which soft spins interact through -body interactions with random quenched couplings [5]. The dynamics of the PSM can be solved semi-analytically [1, 5, 6]. Particularly at , the time correlation function is known to obey the dynamical equation mathematically equivalent with the mode-coupling theory (MCT) equation of the glass transition [1, 7]. The system is ergodic at high temperature, however as temperature is decreased, the time correlation function exhibits the two step relaxation behavior and the relaxation becomes slower and slower. Eventually the relaxation time diverges and the spins get frozen, which is called the dynamical transition. Also the thermodynamics of the PSM can be solved semi-analytically by the replica method with the one-step replica symmetry breaking (1RSB) ansatz [5, 8]. As temperature is lowered from above, the phase space of the system in the paramagnetic state splits into many metastable glassy states exactly at the dynamical transition temperature. As the system is cooled further, the logarithm of the number of these states or the complexity, which corresponds to the configurational entropy in glass forming liquids, decreases and eventually becomes zero where the thermodynamic glass transition takes place. In the glass phase, the free energy of the model is dominated by the lower energy states. The similarity between the PSM and glass forming liquids has many to believe that they are in the same class of random glassy systems, at least in the mean-field limit [3, 4].
However, real glass formers often exhibit richer and more anomalous dynamical behaviors, all of which can not be captured by the PSM. In this work, we particularly focus on the “decoupling” phenomenon often observed in multi-component glass formers. This is the phenomenon in which the slowing down of the dynamics of each component occurs separately at different regions of the densities and the temperatures, hence some components are frozen into a glass state while the others remain mobile. There is a wide variety of materials showing the decoupling phenomenon, such as ionic glasses and metallic glasses [9]. The simplest example among them is presumably a binary mixture of large and small particles with disparate size ratio [10, 11, 12, 13, 14, 15, 16, 17, 18, 19, 20, 21, 22, 23]. When the size ratio is sufficiently large, it is observed in experiments [10, 11] and simulations [18, 19, 20] that there are two distinct glass phases in this model: the “single” glass where only large particles are arrested while small particles are left mobile, and the “double” glass where both small and large particles are arrested. Despite of simplicity of the model, this decoupling phenomenon of binary mixtures is not fully understood theoretically. It is encouraging that the MCT can predict this behavior qualitatively [21, 22, 23]. However the MCT is derived using numerous uncontrorable approximations, which are not guaranteed to be valid for binary mixtures with disparate size ratio. Even for monodisperse systems, there is an argument whether or not the MCT is a true “mean-field theory” to describe the dynamics of the glass transition [24, 25, 26, 27]. Moreover the transition predicted by the MCT only exists in the mean-field limit and is washed away in finite dimensions [3, 4].
Can any of spin glass models qualitatively capture these rich behaviors of the glass transitions of binary mixtures? If so, analysis of such models should facilitate the study of binary mixtures because spin models can be analyzed rigorously at least in the mean-field limit. Related to this point, Crisanti and Leuzzi generalized the PSM to include two distinct energy scales of the interactions [28, 29, 30, 31]. They considered the -spin spherical model, where all spins interact through both -body and -body interactions. This model is potentially related to the glass forming liquids in which molecules are subject to two different types of interactions. They found that there is a variety of glass phases characterized by the series of replica symmetry breaking [30] and that the model exhibits rich dynamical behaviors such as three-step relaxation of the time correlation function [31]. However to the best of our knowledge, there exists no study on the spin glass model which exhibits the single and double glass transitions and the decoupling of dynamics of one of the components from the other, as observed for binary mixtures.
In this work, we extend the PSM so as to mimic binary mixtures of particles with disparate size ratio. Our model is a two component version of the PSM, which is composed of weakly interacting spins (weak spins) and strongly interacting spins (strong spins). We employ the replica theory to study the thermodynamics of the model. We found that the model has the glass phases characterized by either conventional 1RSB and the two-step replica symmetry breaking (2RSB). We show that the interplay between the 1RSB and the 2RSB solutions results in the decoupling of the glass transitions of weak spins from that of strong spins. We also show that our two component PSM is directly related to the randomly pinned PSM, which has been studied recently [32]. Finally based on the results, we discuss the validity of the predictions of the MCT for the multiple glass phases of binary mixtures.
The organization of the paper is as follows. In Section II, we introduce the model. In Section III, we use the replica theory to express the free energy in terms of the spin glass order parameters. In Section IV, by numerical minimization of the free energy, we obtain the temperature evolutions of the order parameters, the phase diagrams, and the thermodynamic quantities of the model. In Sections V and VI, we discuss the results and conclude the work.
2 Model
We consider a two component version of the PSM with . The model is composed of spins of the component 1 and spins of the component 2, with . The spin variables for each component are denoted as and , respectively. They obey the spherical constraints and . The Hamiltonian of the model is
| (1) |
where the greek indices are used to indicate components, the roman indices are for spins, and is the coupling constant among the three spins, which is the Gaussian random variables with zero mean. In order to render the analysis tractable, we consider the case where is characterized by only the two values, i.e.
| (2) |
Here and are the typical energy scales of the interactions of the component 1 and 2, respectively. We set , hence the component 1 is “strong” spins and 2 is “weak” spins. The control parameters of the model are the ratio of the strengths of the interactions , the fraction of strong spins , and the temperature . We use , and for the units of the energy, temperature, and the entropy, respectively, where is the Boltzmann constant. All the results are obtained in the thermodynamic limit.
3 Free energy calculation
We calculate the free energy of the model using the standard replica method. In the method, the free energy of the original model is obtained by taking the limit of the free energy of replicas. The procedure of this calculation for the one-component PSM is well documented in Ref. [5, 8]. Following the same procedure, we write down the free energy of the two-component PSM as
| (3) |
with
| (4) |
where and denote the overlap matrices for the component 1 and 2, each component of which is defined by and . means that the function is maximized with respect to the matrices and .
3.1 1RSB ansatz
In the case of the one-component PSM, it is known that the 1RSB ansatz gives the correct solution. The 1RSB ansatz assumes that the overlap matrices have a one-step hierarchical structure. In our model, this ansatz reads explicitly
| (5a) | |||
| (5b) | |||
where is the Kronecker delta and
| (5f) |
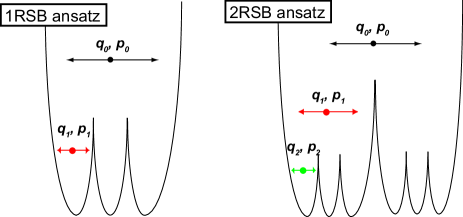
Here, and are called the self overlaps, which are the overlaps within the same glassy states, and and are the overlaps between different glassy states (Figure 1 left). We can assume that is valid for the PSM without external fields. Substituting equations (5a) and (5b) into equation (4), and taking the limit in equation (3), we obtain
| (5g) |
with
| (5h) |
where , , , and . The breaking parameter should be limited to in the limit . When , this 1RSB free energy reduces to that of the paramagnetic state. When is extremized with respect to , , and , the 1RSB solution of the model is obtained. The 1RSB dynamical transition is defined as the transition where the overlaps and change discontinuously, and the 1RSB thermodynamic transition is defined as the transition where the 1RSB solution with becomes stable.
3.2 2RSB ansatz
Our model is the two component PSM with the two distinct energy scales and , which make the thermodynamic phase diagram more complex. Especially there is no guarantee that the 1RSB ansatz gives the stable solution. Therefore, we have to allow the two-step hierarchical structure of the overlap matrices:
| (5ia) | |||
| (5ib) | |||
which are called the 2RSB ansatz. This ansatz corresponds to the two-step hierarchical structure of the free energy landscape as depicted schematically in Figure 1 right. Here, and are the self overlaps, and are the overlaps between the different glassy states in the same group in the intermediate level of the hierarchy, and and are the overlaps between the different glassy states in the different groups. Substituting equations (5ia) and (5ib) into equation (4) and taking the limit in equation (3), we obtain
| (5ij) |
with
| (5ik) |
The breaking parameters and should be limited to . When , the 2RSB free energy , equation (5ik), reduces to the 1RSB free energy , equation (5h). By minimizing in equation (5ik) with respect to the order parameters , , , , and , the free energy and the order parameters of the original system is obtained within the 2RSB ansatz. The 2RSB dynamical transition is defined as the transition where the overlaps and change discontinuously, and the 2RSB thermodynamic transition is defined as the transition where the 2RSB solution with becomes stable 111 We did not explore the possibilities of RSB of the higher order than 2RSB. Note that the 2RSB is guaranteed to be sufficient at least in the limit because this limit corresponds to the randomly pinned PSM where the solution corresponding to the 2RSB is verified to be stable [32]..
3.3 Numerical minimization of
We focus on the minimization of . We do not need to analyze separately, because is included in as discussed above. We employ the following numerical method to minimize . For a given , we first focus on a low enough temperature (in practice, we set ) and minimize by the steepest descent method. We take a special care in this procedure because the calculation easily gets stuck in locally stable solutions. In order to avoid this unwanted effect, we first slice the space to 50 grid points and minimize with respect to , , and at each grid point. We seek for the set of which minimizes . Using this as an initial guess, we perform the full steepest descent optimization of all the order parameters. After obtaining the optimized solution at the lowest temperature, we gradually increase the temperature and employ the steepest descent method to minimize at each temperature, using the optimal values of the order parameters at the lower temperature as an initial guess.
4 Phase diagrams and thermodynamic quantities
In this section, we show the phase diagrams and the thermodynamic quantities of the two-component PSM obtained by the minimization of . We find that the model has a variety of glass phases including the “single” and the “double” glasses when is very different from 1.
4.1 Order parameters and phase diagrams
4.1.1 .
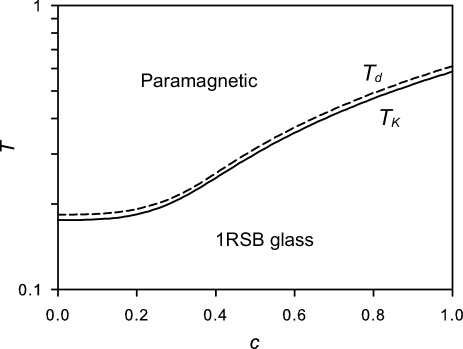
We start with , which is not very different from 1. We show the phase diagram in Figure 2. There are only the paramagnetic phase and the 1RSB glass phase. The two phases are separated by the 1RSB thermodynamic transition line . The 1RSB dynamical transition line is located at slightly higher temperatures. Note that and for match with the results of the one-component PSM of the strong spins. They are and . and for are identical to those for aside from the obvious factor of , which defines the unit of the energy, i.e., and . The transition lines smoothly connect these two limiting cases.
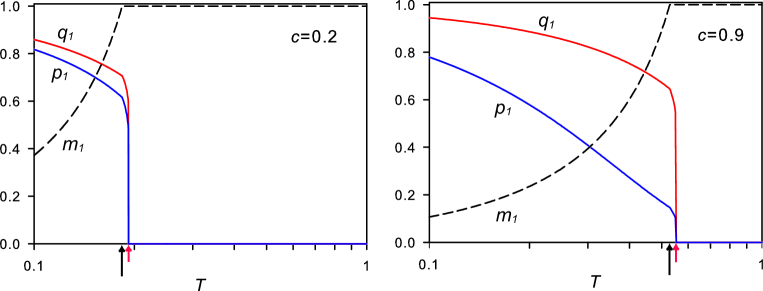
In order to gain more insights, in Figure 3, we plot the temperature dependence of the optimized overlaps and and the breaking parameter at two representative values of and 0.9. At (Figure 3 left), as temperature is decreased, the overlaps and jump from zero while the breaking parameter remains constant at the 1RSB dynamical transition temperature . suddenly starts decreasing from 1 at the 1RSB thermodynamic transition temperature . The 1RSB dynamical and thermodynamic transition temperatures ( and ) are close to those of the one-component PSM of weak spins ( and ), indicating that the 1RSB transition at is driven mainly by the freezing of the weak spins. Note that both the values of and just below the transition temperatures are larger than 0.5 and are close to each other, which can be interpreted that both the strong and weak spins are frozen equally strongly at this transition.
Behaviors at (Figure 3 right) are qualitatively similar to those at . The only differences are that (i) the 1RSB dynamical and thermodynamic transition temperatures ( and ) are close to those of the one-component PSM of the strong spins ( and ) and that (ii) the value of is larger than 0.5 while the value of is much smaller just below the transition temperatures. These results can be interpreted that the 1RSB transition at is driven mainly by the freezing of the strong spins, and the weak spins are not strongly frozen at this transition. However we emphasize that this difference is only quantitative and the overlaps of the weak and strong spins vary continuously as changes. Namely there is no clear signature of the decoupling of the glass transitions of the weak and strong spins.
4.1.2 .
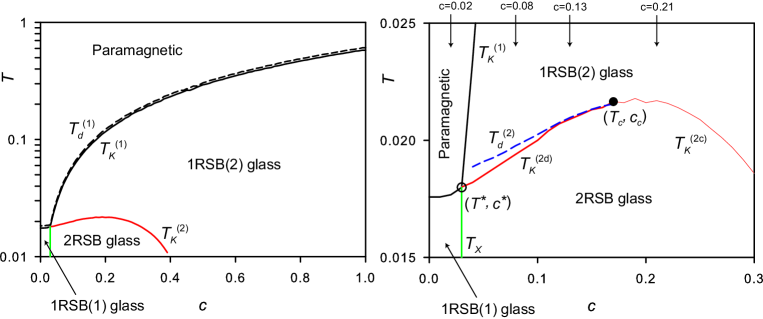
Next we focus on , which is much smaller than 1. In Figure 4 left, we show the phase diagram, which is qualitatively different from that at . One finds that there are three glass phases. We refer to them as the 1RSB(1), the 1RSB(2), and the 2RSB glass phases. The paramagnetic phase is separated from the 1RSB(1) and the 1RSB(2) glass phases by the 1RSB thermodynamic transition line . The associated 1RSB dynamical transition line is located at slightly above . The 2RSB glass phase is located below the 1RSB(2) glass phase. The 1RSB(2) and the 2RSB glass phases are separated by the 2RSB thermodynamic transition line . To present the details of the 2RSB glass phase region, we show the zoom in Figure 4 right. The 2RSB thermodynamic transition line is composed of two parts: at lower fraction of strong spins and at higher fraction of strong spins, depending on the discontinuous and continuous nature of the transition across this temperature. The 2RSB dynamical transition line is located at slightly above and it terminates at the critical point , at which the three transition lines , and meet. The thermodynamic transition line which separates the 1RSB(1) glass from the 2RSB glass is denoted as . The three thermodynamic transition lines, , and , meet at the point , which is the meeting point of all the four phases. As increases, the 1RSB thermodynamic transition line sharply bends upward at this point and the transition into the 1RSB(1) glass becomes the transition into the 1RSB(2) glass.
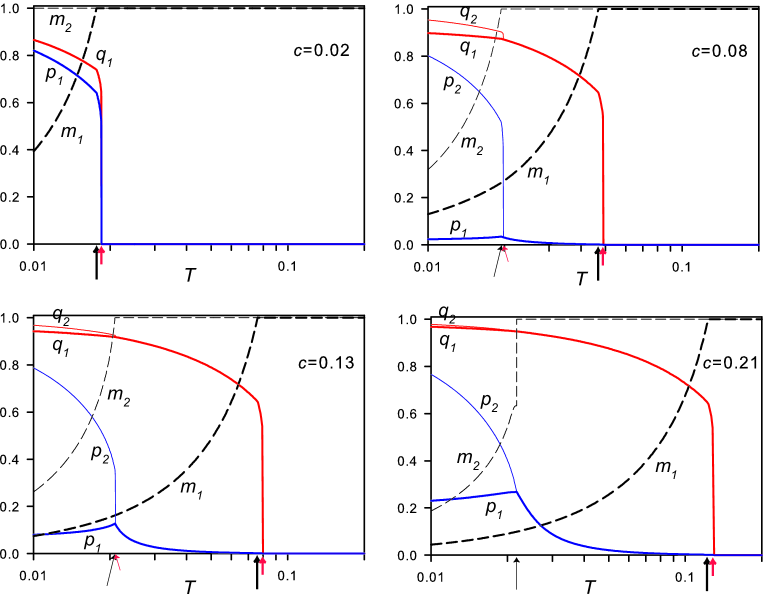
In order to understand the nature of these phases, we plot the temperature dependence of the overlaps and the breaking parameters at four representative values of , 0.08, 0.13, and 0.21, in Figure 5. These values of are indicated as arrows in the phase diagram, see Figure 4 right. We first focus on (Figure 5 upper left). When the temperature is decreased from above, and change discontinuously from zero at the 1RSB dynamical transition temperature . While remains to be unity, suddenly starts decreasing from 1 at , where the 1RSB thermodynamic transition from the paramagnetic phase to the 1RSB(1) glass phase takes place. Note that the 1RSB dynamical and thermodynamic transition temperatures ( and ) are close to those of the one-component PSM of the weak spins ( and ), which indicates that the transition into the 1RSB(1) glass phase is driven mainly by the freezing of the weak spins. Both the values of and are larger than 0.5 and are close to each other below , which can be interpreted that both the strong and weak spins are frozen equally strongly in the 1RSB(1) glass phase.
The upper right panel of Figure 5 shows the results at , where there are the 1RSB transition from the paramagnetic to the 1RSB(2) glass phase, and the 2RSB transition from the 1RSB(2) to the 2RSB glass phase. The 1RSB dynamical and thermodynamic transitions at and are qualitatively the same as those for . The only difference is that the value of is larger than 0.5 while is very close to zero. This result can be interpreted that the strong spins are frozen while the weak spins are not frozen in the 1RSB(2) glass phase. As we decrease temperature further, the 2RSB transition takes place. First at , the overlaps and change discontinuously while the breaking parameter remains constant . At , suddenly starts decreasing from 1, where the 2RSB thermodynamic transition takes place. Note that is larger than 0.5 just below , which can be interpreted that the weak spins are also frozen in the 2RSB glass phase.
Behaviors at (Figure 5 lower left) are qualitatively similar to those at . The only difference is that the discontinuities of and at the 2RSB dynamical transition are smaller than those for . As increases, the discontinuities at the 2RSB dynamical transition become smaller, and eventually the jump of and disappear at . The lower right panel of Figure 5 shows the results at . The overlaps and change from and continuously at , where the continuous 2RSB thermodynamic transition takes place. Interestingly, the change of the breaking parameter at is not continuous as in the case at but discontinuous.
In summary, the 1RSB(2) glass corresponds to the “single” glass where only the strong spins are frozen, and the 1RSB(1) and the 2RSB glasses correspond to the “double” glass where both the weak and strong spins are frozen simultaneously. We emphasize that there is a clear difference between these two “double” glasses, the 1RSB(1) and the 2RSB. The transition into the 1RSB(1) glass phase is the simultaneous arrest of the weak and the strong spins. This transition is mainly driven by the freezing of the weak spins. On the other hand, the transition into the 2RSB glass phase is the arrest of the weak spins in the presence of the frozen strong spins which already undergoes the glass transition at much higher temperature. The difference becomes clearer when one considers the free energy landscape of these phases. In the 1RSB(1) glass phase, the landscape can be characterized by the one-step hierarchical structure (Figure 1 left). Only the self overlap and have large values, and and are zero. This means that the different glassy states have completely different configurations of spins. On the other hand in the 2RSB glass phase, the landscape has the two-step hierarchical structure (Figure 1 right). Not only the self overlaps and , but also the overlap have large values. This means that several glassy states in the same group of the intermediate level of the hierarchy share almost the same configuration of the strong spins. In other words, the phase space is divided into a multi-valley structure corresponding to configurations of the strong spins and each of the valley is divided into a subgroups of multi-valley structure corresponding to configurations of the weak spins. Note that the 1RSB(1) and the 2RSB glasses are separated by the glass-glass transition as shown in Figure 4. As one crosses , the overlaps discontinuously change (not shown).
Finally we obtain a semi-analytical expression for the continuous 2RSB transition temperature . This is possible because and are small just below and thus the 2RSB solution can be expressed by the perturbation around the 1RSB solution (see Appendix for details). In Figure 9, we compare calculated by the perturbation theory with those calculated by the minimization of . The two results are almost identical, confirming that our numerical minimization of is reliable.
4.1.3 The decoupling of the glass transitions of the weak and the strong spins.
We showed that there is only one glass phase at , whereas at the decoupling of the glass transitions of the weak and the strong spins takes place and, as a result, the three glass phases appear. In this subsection, we estimate the value of at which this decoupling sets in.
First we evaluate the phase diagram at various in the range of by the minimization of . We find that the three glass phases exist at while only one glass phase exists at . This means . However we can not estimate more accurately by this procedure. Our numerical minimization becomes unstable at because the free energy differences between and become small.
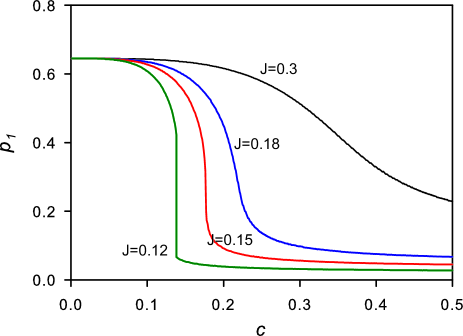
In the course of the evaluations of the phase diagrams described above, we find that whenever there exist the three glass phases, there also exists the glass-glass transition point (, ) from the 1RSB(1) to the 1RSB(2) glass phase on the line , see Figure 4. Here, we estimate assuming that is identical to the value of just below which the glass-glass transition point appears on the line . We evaluate the overlaps along the line , and seek for the discontinuous jump of the overlaps as a function of , which is the sign of the glass-glass transition. This analysis is numerically easier than the full evaluation of the phase diagram because it requires the numerical minimization only of . In Figure 6, we show the dependence of the overlap of weak spins on the line , at several values of . At , decreases smoothly with and there is no glass-glass transition point. The decrease of becomes sharper with decreasing , and becomes discontinuous just below . From this calculation, we estimate .
4.2 Thermodynamic quantities
In this subsection, we discuss the nature of the various glass phases of the model in terms of the thermodynamic quantities.
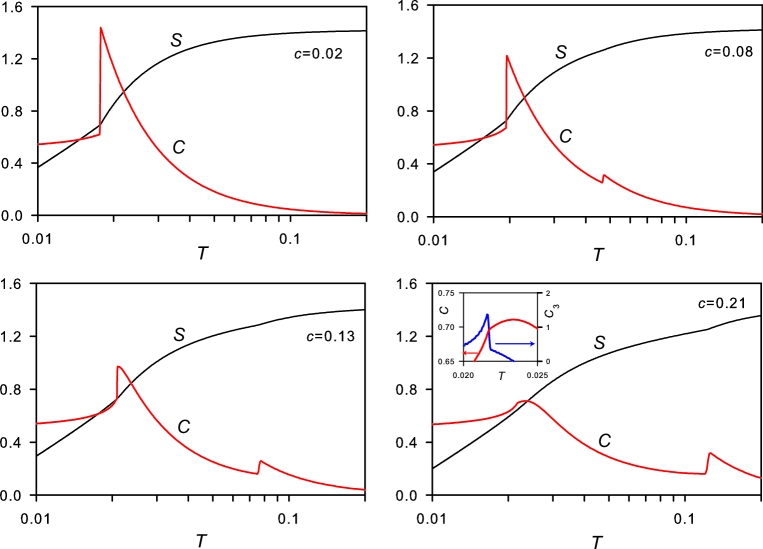
Figure 7 shows the temperature dependence of the entropy and the heat capacity at at the same values of in Figure 5. These quantities are evaluated by numerical differentiation of the free energy obtained by the minimization of . At (Figure 7 upper left), the entropy curve bends and the heat capacity jumps discontinuously at the 1RSB thermodynamic transition temperature . This is the typical behavior of the 1RSB glass transition. On the other hand at (Figure 7 upper right), the entropy curve bends and the heat capacity jumps twice at the 1RSB and the 2RSB thermodynamic transition temperatures, and . As can be seen from the results at (Figure 7 lower left) and 0.21 (Figure 7 lower right), the heat capacity jump at becomes weaker with increasing and eventually disappears when the 2RSB transition becomes continuous. In order to characterize the thermodynamics of the continuous 2RSB thermodynamic transition, we plot the third order derivative of the free energy in the inset of Figure 7 lower right. One finds that this quantity shows the discontinuous jump at the continuous 2RSB transition temperature . Thus the continuous 2RSB transition is the third-order thermodynamic transition in nature. Note that the similar behavior has been observed for the continuous 1RSB transition [8].
5 Discussion
We found that the two-component PSM has three glass phases at : the 1RSB(1) glass where both the strong and weak spins are frozen, the 1RSB(2) glass where only the strong spins are frozen, and the 2RSB glass where both the strong and weak spins are frozen and the free energy landscape has the two-step hierarchical structure. In this section, we discuss possible connections and implications of these results to other systems.
5.1 Connection to the randamly pinned PSM
In the randomly pinned PSM, a fraction of spins are pinned and the dynamics and thermodynamics of remaining mobile spins are considered. This model has recently attracted attention partly, because it enables us to probe the true thermodynamic glass transition without waiting for the system to equilibrate, which otherwise takes astronomically long time [32, 33, 34]. Interestingly, the 2RSB dynamical and thermodynamic transition lines (see Figure 4 right) are analogous to the glass transition lines of the randomly pinned glass [32]. In both cases, the overlap discontinuously jumps at the dynamical transition lines when the density of the pinned spins (for the randomly pinned PSM) or the strong spins (for the two-component PSM) is small. But as the densities increase the discontinuities are weakened and eventually the transitions become continuous at which the dynamical transition lines terminate. The similarity between these two models is natural because, in the two-component PSM, the strong spins frozen at higher temperature behaves as the “randomly pinned spins” in the sea of the mobile weak spins at lower temperature. Indeed we can establish the precise relation between these two models. To this end, we focus on the behaviors of weak spins in the limit of while keeping constant. In this limit, the overlaps of strong spins become , and the breaking parameter . Plugging these limiting values into , equation (5ik), the relevant part for the weak spins becomes
| (5il) |
This free energy is essentially equivalent to the one of the randomly pinned PSM 222 Equation (5il) becomes equivalent to equation (16) in Ref. [32], after dividing equation (16) by , taking carefully limit and replacing , and with , and , respectively.. Thus the phase diagram of the two-component PSM converges to that of the randomly pinned PSM in this limit.
5.2 Connection to the MCT of binary mixtures
We next discuss the implications of the two-component PSM for binary mixtures of large and small particles with disparate size ratio. The MCT was recently used to analyze the decoupling of the glass transitions of large and small particles in this model and predicted the existence of four distinct glass phases [22]: (i) The “partially frozen cageing” glass in which only the large particles are arrested due to the cageing effect amongst the large particles. In this phase, the small particles are left mobile and do not qualitatively affect the dynamics of large particles. (ii) The “partially frozen depletion-driven” glass in which only the large particles are arrested by a short-ranged but strong attractive interaction induced by the depletion effect caused by small particles [35, 36]. In both the phases (i) and (ii), only the large particles undergo the glass transition and the small particles play a role as the background solvent. The phase (i) is often called the repulsive glass and (ii) is the attractive glass [37, 38, 39, 40]. (iii) The “fully frozen” glass in which both the large and small particles are arrested simultaneously. Both the large and small particles equally contribute to the formation of the frozen states. (iv) The “torronchino” glass which is a subset of the “fully frozen” glass. In this phase, however, the number of the small particles is much larger than that of the large particles and the freezing is driven mainly by the small particles. By comparing the glass phases in our model with those of the MCT, one finds that the “partially frozen cageing” glass corresponds to the 1RSB(2) glass, the “fully frozen” to the 2RSB, and the “torronchino” to the 1RSB(1). Because there is no depletion effect in the present model, there is no phase corresponding to the “partially frozen depletion-driven” glass. At this stage however, one should realize a subtle but important difference between the descriptions of the MCT and the replica theory for these phases. Specifically, we revealed that the two-step replica symmetry breaking is needed to describe the 2RSB glass or the “fully frozen” glass. However the MCT is believed to be a theory of the 1RSB dynamical transition [3, 4], therefore it cannot intrinsically describe this phase.
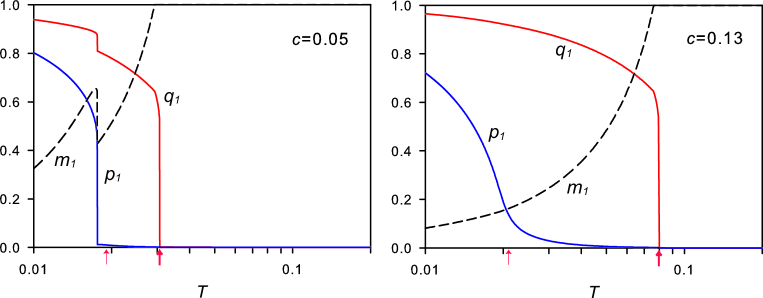
In order to consider the validity of the prediction of the MCT for the 2RSB glass phase, it is useful to see how the 1RSB solution behaves in the 2RSB glass phase 333 More precisely, the MCT solution corresponds to the 1RSB solution optimized with leaving . We also performed this calculation and verified that the results discussed below are qualitatively unchanged.. In Figure 8, we plot the temperature dependence of the overlaps of the 1RSB solution at . At (Figure 8 left), and jump not only at the 1RSB dynamical transition temperature but also at around the 2RSB dynamical transition temperature . This means that though the 1RSB solution is incorrect in the 2RSB glass region, it captures a signature of the transition into the 2RSB glass phase to a certain extent. At , however, we do not find any signature of the 2RSB dynamical transition in the 1RSB solution. Indeed at (Figure 8 right), and increase only smoothly with decreasing temperature in the glass phase, while the 2RSB solution predicts the discontinuous 2RSB dynamical transition at (Figure 5 lower left). In summary, the 1RSB solution can not correctly describe the 2RSB glass phase although it can capture a trace of the 2RSB transition for a certain range of parameters. This suggests that the applicability of the MCT to describe the decoupling of the glass transitions in binary mixtures with disparate size ratio may be questioned.
6 Conclusions
In this work, we have introduced and studied a two-component version of the -spin spherical model. The model is composed of strongly interacting spins (strong spins) and weakly interacting spins (weak spins), which mimic the glass forming binary mixtures of large and small particles with disparate size ratio. We have found that when the strengths of the interactions of the weak and strong spins are not widely separated, the model has only one glass phase. This glass phase is the frozen state of both the strong and weak spins and is described by the conventional 1RSB solution. On the other hand when the strengths of the interactions are well separated, the model exhibits the decoupling of the glass transitions of the weak and strong spins and, as a result, there appear the three distinct glass phases. We referred to them as the 1RSB(1), the 1RSB(2), and the 2RSB glass phases. The 1RSB(1) glass phase appears in the region where the number fraction of the strong spins is very small. This glass phase is the frozen state of both the strong and weak spins, although the transition into this phase is driven mainly by the freezing of the weak spins. The 1RSB(2) glass phase appears in the region where the number fraction of the strong spins is large. In this glass phase, only the strong spins are frozen while the weak spins are left mobile. By cooling the 1RSB(2) glass further, the 2RSB glass phase is obtained, in which the weak spins are also frozen. The 2RSB glass phase is characterized by the two-step hierarchical structure of the free energy landscape. The 2RSB glass transition becomes ether discontinuous or continuous depending on the number fraction of the strong spins. The discontinuous 2RSB thermodynamic transition is accompanied with the jump of the second order derivative of the free energy, namely the heat capacity. On the other hand, for the continuous 2RSB thermodynamic transition, the heat capacity changes continuously while the third order derivative of the free energy jumps discontinuously. Based on the results, we have discussed the connection of the present model to the randomly pinned PSM. The phase diagram of the present model appears to be similar to that of the randomly pinned PSM. We have analytically showed that the free energy of the two-component PSM becomes exactly identical to that of the randomly pinned PSM in the small limit of the ratio between the strengths of the interactions of the weak and strong spins. We have also discussed the implications of the present results for the MCT for binary mixtures of large and small particles with disparate size ratio. We have found that the 1RSB solution can not correctly describe the 2RSB glass phase although it can capture a trace of the 2RSB transitions for a certain range of parameters, which may leave questionable the applicability of the MCT to describe the decoupling of the glass transitions in binary mixtures with disparate size ratio. Regarding this point, it is interesting to extend the replicated liquid state theory [41, 42] to allow the 2RSB ansatz [43] to describe the decoupling of the glass transitions in binary mixtures with disparate size ratio. Study along this direction is under way [44].
Appendix A Perturbation analysis of the continuous transition
In this appendix, we construct the perturbative theory around the 1RSB ansatz which allows us to calculate the continuous 2RSB thermodynamic transition temperature, . Here, we expand the saddle point equations about the differences between the 1RSB and 2RSB order parameters, and , and derive the convenient equations to evaluate . To this end, the most convenient staring point is
| (5im) |
After the some manipulations, equations (5im) can be rewritten as
| (5in) |
where and . The kernels, and , are defined as
| (5io) |
Substituting and into equations (5im) and expanding , one obtains the perturbative series for . Below, we show that the first order term of decides the transition temperature and the second order provides the value of at the transition temperature.
For the first order of the perturbative expansion of equation (5in) about , we obtain
| (5ip) |
where we have defined the auxiliary matrix as
| (5iq) |
The necessary condition that the equation (5ip) has the non-zero solution is
| (5ir) |
This is the closed equation for , and the temperature . Substituting the 1RSB result for and , we can solve equation (5ir) for and obtain . As shown in Figure 5, at , the changes discontinuously from to some positive value smaller than . This value of can be obtained by the second order term of :
| (5is) |
where we have defined
| (5it) |
Note that equation (5is) depends on , the value of which is undecided at present. To remove the terms which contains from equation (5is), inspired by the perturbative analysis of the MCT[7], we introduce the left eigen vector, , which satisfies
| (5iu) |
Using this, can be expressed as
| (5iv) |
where is a constant. Also, we introduce the right eigen vector by
| (5iw) |
Multiplying from the left of equation (5is) and using equation (5iv), we finally reach the compact formula for :
| (5ix) |
From this expression, it is clear that the value of is independent from the normalization constants of the eigen vectors, equation (5iu) and equation (5iw). The right hand side of equation (5ix) is the function of , , and . Substituting the 1RSB results into and and calculated by equation (5ir) into , we obtain the value of .
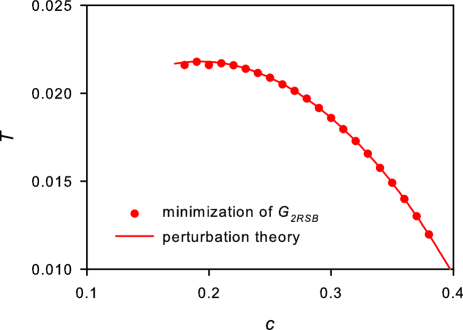
An advantage of the formalism constructed above is that one can evaluate and the value of at the transition point with only the information about the 1RSB result. This enables a more precise investigation of the phase behavior than that of the full numerical minimization of . In Figure 9, we compare calculated by equation (5ir) with that calculated by the minimization of (as in Figure. 4). They are almost identical.
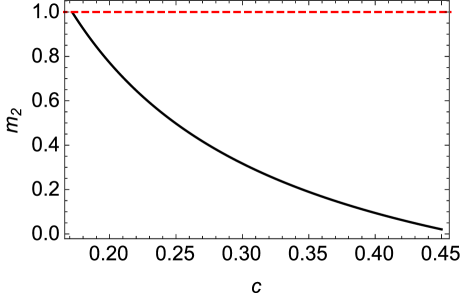
To determine the critical point at which the continuous transition ceases to exist and the transition becomes discontinuous, one should observe the value of . In Figure 10, we show the dependence of calculated by equation (5ix) on . The value of increases with decreasing and reaches at the critical point = 0.17174, where . Note that is a signal of the discontinuous transition, therefore it is natural to guess that at , the continuous 2RSB thermodynamic transition line, , is connected to the discontinuous 2RSB thermodynamic and dynamical transition lines, and . This assumption is indeed correct, see Figure 4.
References
References
- [1] Kirkpatrick T R and Thirumalai D 1987 Phys. Rev. Lett.58 2091
- [2] Kirkpatrick T R and Thirumalai D 1987 Phys. Rev.B 36 5388
- [3] Berthier L and Biroli G 2011 Rev. Mod. Phys.83 587
- [4] Cavagna A 2009 Phys. Rep. 476 51
- [5] Castellani T and Cavagna A 2005 \JSTAT2005 P05012
- [6] Crisanti A, Horner H and Sommers H J 1993 Z. Phys.B Condensed Matter 92 257
- [7] Götze W 2008 Complex Dynamics of Glass-Forming Liquids: A Mode-Coupling Theory (Oxford: Oxford University Press)
- [8] Crisanti A and Sommers H J 1992 Z. Phys.B Condensed Matter 87 341
- [9] Angell C A, Ngai K L, McKenna G B, McMillan P F and Martin S W 2000 J. Appl. Phys. 88 3113
- [10] Imhof A and Dhont J K G 1995 Phys. Rev. Lett.75 1662
- [11] Imhof A and Dhont J K G 1995 Phys. Rev.E 52 6344
- [12] Pham K N, Puertas A M, Bergenholtz J, Egelhaaf S U, Moussaid A, Pusey P N, Schofield A B, Cates M E, Fuchs M and Poon W C K 2002 Science 296 104
- [13] Eckert T and Bartsch E 2002 Phys. Rev. Lett.Phys. Rev. Lett. 89 125701
- [14] Pham K N, Petekidis G, Vlassopoulos D, Egelhaaf S U, Pusey P N and Poon W C K 2006 \EPL75 624
- [15] Sentjabrskaja T, Babaliari E, Hendricks J, Laurati M, Petekidis G and Egelhaaf S U 2013 Soft Matter 9 4524
- [16] Sentjabrskaja T, Hermes M, Poon W C K, Estrada C D, Castaneda-Priego R, Egelhaaf S U and Laurati M 2014 Soft Matter 10 6546
- [17] Hendricks J, Capellmann R, Schofield A B, Egelhaaf S U and Laurati M 2015 Phys. Rev.E 91 032308
- [18] Moreno A J and Colmenero J 2006 Phys. Rev.E 74 021409
- [19] Moreno A J and Colmenero J 2006 J. Chem. Phys. 125 164507
- [20] Voigtmann Th and Horbach J 2009 Phys. Rev. Lett.103 205901
- [21] Bosse J and Kaneko Y 1995 Phys. Rev. Lett.74 4023
- [22] Voigtmann Th 2011 \EPL96 36006
- [23] Nya T, Ayadim A, Germain Ph and Amokrane S 2012 J. Phys.: Condens. Matter24 325106
- [24] Schmid B and Schilling R 2010 Phys. Rev.E 81 041502
- [25] Ikeda A and Miyazaki K 2010 Phys. Rev. Lett.104 255704
- [26] Jacquin H and van Wijland F 2011 Phys. Rev. Lett.106 210602
- [27] Maimbourg T, Kurchan J and Zamponi F 2016 Phys. Rev. Lett.116 015902
- [28] Crisanti A and Leuzzi L 2004 Phys. Rev. Lett.93 217203
- [29] Crisanti A and Leuzzi L 2006 Phys. Rev.B 73 014412
- [30] Crisanti A and Leuzzi L 2007 Phys. Rev.B 76 184417
- [31] Crisanti A, Leuzzi L and Paoluzzi M 2011 Euro. Phys. J. E 34 98
- [32] Cammarota C and Biroli G 2013 J. Chem. Phys. 138 12A547
- [33] Kob W and Berthier L 2013 Phys. Rev. Lett. 110 245702
- [34] Ozawa M, Kob W. Ikeda A and Miyazaki K 2015 Proc. Nat. Acad. Sci. 112 6914
- [35] Asakura S and Oosawa F 1954 J. Chem. Phys. 22 1255
- [36] Dijkstra M, van Roij R and Evans R 1999 Phys. Rev.E 59 5744
- [37] Bergenholtz J and Fuchs M 1999 Phys. Rev.E 59 5706
- [38] Dawson K, Foffi G, Fuchs M, Götze W, Sciortino F, Sperl M, Tartaglia P, Voigtmann T and Zaccarelli E 2000 Phys. Rev.E 63 011401
- [39] Dawson K A, Foffi G, Sciortino F, Tartaglia P and Zaccarelli E 2001 J. Phys.: Condens. Matter13 9113
- [40] Foffi G, Sciortino F, Zaccarelli E and Tartaglia P 2004 J. Phys.: Condens. Matter16 S3791
- [41] Mezard M and Parisi G 1999 J. Chem. Phys. 111 1076
- [42] Parisi G and Zamponi F 2010 Rev. Mod. Phys.82 789
- [43] Charbonneau P, Kurchan J, Parisi G, Urbani P and Zamponi F 2014 \JSTAT2014 P10009
- [44] Ikeda H, Miyazaki K, Yoshino H and Ikeda A in preparation.