Stochastic evolutionary dynamics of minimum-effort coordination games
Abstract
The minimum-effort coordination game, having potentially important implications in both evolutionary biology and sociology, draws recently more attention for the fact that human behavior in this social dilemma is often inconsistent with the predictions of classic game theory. In the framework of classic game theory, any common effort level is a strict and trembling hand perfect Nash equilibrium, so that no desideratum is provided for selecting among them. Behavior experiments, however, show that the effort levels employed by subjects are inversely related to the effort costs. Here, we combine coalescence theory and evolutionary game theory to investigate this game in finite populations. Both analytic results and individual-based simulations show that effort costs play a key role in the evolution of contribution levels, which is in good agreement with those observed experimentally. Besides well-mixed populations, set structured populations, where the population structure itself is a consequence of the evolutionary process, have also been taken into consideration. Therein we find that large number of sets and moderate migration rate greatly promote effort levels, especially for high effort costs. Our results may provide theoretical explanations for coordination behaviors observed in real life from an evolutionary perspective.
pacs:
89.75.Fb, 87.23.Ge, 87.23.Kg, 02.50.LeI Introduction
In game theory, coordination games are a class of games with multiple Pareto-ranked equilibria in which players choose the same or corresponding strategies VANHUYCK1990AER ; COOPER1992QJOE ; Monderer1996GAEB ; Jackson2002GAEB ; Szolnoki2009PRE . For those macroeconomists who believe that an economy may become mired in a low-output equilibrium, the coordination game is a particularly important paradigm BRYANT1983QJOE ; COOPER1988QJOE . It is also worth noting that coordination game has a potentially important application to evolutionary biology BRYANT1983QJOE ; Iyer2014PRE ; Iyer2014aPO . In addition, the coordination model helps to explain the puzzle why cooperative behavior can emerge when only the fittest survive: for example, punishment, an important mechanism that restricts selfish behavior, in fact transforms social dilemmas (such as prisoner’s dilemma game or public goods game) into coordination games Chen2014NJP ; Perc12NJP ; Szolnoki11PRE1 ; Li2015PRE .
In the minimum-effort coordination game (MECG), which captures key features of the kinds of coordination problems faced by firms, the common part of the payoff is determined by the minimum decision VANHUYCK1990AER ; Goeree1999PNAS ; Goeree2001AER ; Anderson2001GAEB ; Weber2006AER ; Devetag2005EL . Two players choose “effort levels” from an available strategy set and both have to perform a costly task to raise the joint production level. Each player’s payoff is the minimum of the two efforts minus the cost of its own effort. When a player with an effort level encounters an opponent with , the former gains the payoff , where is a cost parameter. Apparently, any common effort constitutes a Nash equilibrium, and without further refinement the Nash equilibrium concept provides little predictive power VANHUYCK1990AER ; Anderson2001GAEB ; Bornstein2002GAEB ; Chen2011AER . The lowest effort level corresponds to the least efficient or risk-dominant equilibrium and the highest effort level corresponds to the Pareto-optimal or payoff-dominant equilibrium VANHUYCK1990AER ; Goeree1999PNAS ; Goeree2001AER . In the classic game theory, the set of Nash equilibria is obviously unaffected by changes in the effort cost or the number of players VANHUYCK1990AER ; Goeree1999PNAS ; Anderson2001GAEB .
However, in the MECG experiments, the observed behaviors deviate from the results predicted by game theory Camerer1997JOEP . In general, the cost parameter plays a decisive role in the effort level: Behavior is concentrated close to the highest effort level when is low, whereas high values of lead to a dramatic declining of the mean contribution level. In some behavior experiments, although coordination can be improved by introducing other interaction mechanisms Brandts2006EE ; Chaudhuri2010EE ; Romero2015JEBO ; Hamman2007EE , large cost continuously obstructs the stabilization of high level efforts. It is noteworthy that standard deterministic evolutionary game theory Hofbauer98book , as well as classic game theory, can not present explanations for this paradoxical results either, since any common effort level is a strict Nash equilibrium and hence a stable equilibrium point for the replicator equations MaynardSmith82book ; Szabo07review . To explain the behavior found empirically in the MECG, a variety of theoretical approaches have been proposed. Stochastic learning models were investigated to explain the anomalous behavior observed in the MECG Goeree2001AER ; Goeree1999PNAS . Anderson Anderson2001GAEB extended Rosenthal’s analysis Rosenthal89IJTG ; MCKELVEY1995GAEB to a MECG with a continuum of actions and used the logit probabilistic choice framework to determine a unique “logit equilibrium”. Recently, Iyer and Killingback studied the evolutionary dynamics of these games through individual-based simulations on complex networks, showing that the evolutionary behaviors are in good agreement with those observed experimentally Iyer2014PRE .
In this work, we study the MECG with mixed strategies Tarnita2009JTB ; Zhang2013SR ; Szolnoki12EPL from the perspective of the evolutionary balance between selection and mutation. Drawing lessons from coalescence theory Antal_PNAS09 ; Tarnita_PNAS09 , we can well resolve the problem which effort levels are more abundant than others under any mutation rates. In the well-mixed situation, analytic results show that high effort levels can be favored when the effort cost is small, and the opposite is true when the cost is large, which is in accordance with behavior experiments and does not require extra notion of cognition or rationality. More importantly, human society is organized in forms of various sets Tarnita_PNAS09 ; Fu2012SRE , and the outcome of an evolutionary process in a structured populations (such as games on variety of networks Nowak92Nature ; Szolnoki2012SRE ; Perc13review ; Li2014SR , sets Tarnita_PNAS09 ; Fu2012SRE or phenotype space Antal_PNAS09 ; Fudenberg12BMB ) can be very different from that in well-mixed populations. Therefore we utilize evolutionary set theory to investigate the extended model that individuals only interact with others who are in the same set. It seems that more sets always enhance effort levels with all other conditions equal. This is ascribed to the fact that group structure supports the evolution of “within-group helping” Uyenoyama80TPB ; Rogers90AN . Meanwhile, moderate extent of random migration between sets effectively boosts mean contribution level Tarnita_PNAS09 .
This paper is organized as follows. Section II describes our model and methods, Sec. III presents, analyses and discusses the results, and Sec. IV draws conclusions.
II Model and Method
II.1 Basic model of the MECG
Within this work, the basic model is a minimum-effort coordination game (MECG). Here we consider the two-person game with a strategy set . Without loss of generality, we set . We specify an individual ’s strategy as . Let be the payoff that strategy gets from strategy , . More specifically, is given by the function:
| (1) |
where is the cost parameter.
II.2 MECG in well-mixed populations
At first we consider the simple but general situation of well-mixed population without any structure. In the population that consist of individuals, each one plays the MECG with every other one and they all get payoffs according to the function above. We express the fitness of player as an exponential function of the total payoff, i.e., , where is the intensity of selection and is ’s total payoff accrued through pairwise interactions with all others once. In this frequency-dependent Moran process Nowak04Science , at each time step an individual is selected for reproduction proportional to its . Reproduction is subject to mutation: The offspring inherits the strategy of the parent with probability and with probability it adopts a strategy selected uniformly at random. A strategy is favored overall in the mutation-selection equilibrium if its abundance exceeds the mean.
In well-mixed population, we only concentrate on the situation that strategies are continuous. We use the result in Ref. Tarnita2009JTB to derive that, for weak selection () and large population size , strategy is favored by selection if , where
| (2) | |||||
| (3) |
Here is defined in Eq. (1) and , , stand for strategy values. and are both functions of the unique variable . Meanwhile, to determine which strategy is most favored by selection, one simply has to maximize . Substituting Eq. (1) into Eqs. (2) and (3), we find the condition for strategy in MECG to be favored by selection to be
| (4) |
We can obtain the most common strategy by maximizing in inequality (4).
II.3 MECG in set structured populations
In this extended model, a population of finite size is distributed over sets and each individual belongs to one set. The sets could be geographical islands but they could also be phenotypic traits or tags Tarnita11PNAS . Two individuals interact only if they are in the same set (have the same tag). Successful sets attract more individuals. In addition, in the mutation-selection analysis, besides strategy mutation , a set mutation rate is introduced to represent individuals’ random migration between sets. The update rule is similar to that in well-mixed population. It is useful to consider the rescaled mutation rates, and , in the theoretical analysis.
When available strategies in the evolutionary process are discrete and the total number is , for simplicity, we utilize the payoff matrix () to describe payoffs between any two discrete strategies. Here, , where is defined in Eq. (1). Drawing lessons from Ref. Tarnita11PNAS , we acquire that a strategy () is favored by selection if
| (5) |
where , , , and . In addition, drawing supports from coalescence theory, up to the same positive constant factor,
| (6) | |||||
| (7) | |||||
| (8) | |||||
| (9) | |||||
| (10) |
When strategies are continuous, using the result in Ref. Fu2012SRE derived by Fu et al., we get that strategy is more abundant than the mean frequency if
| (11) |
Here the terms are the same as for the discrete strategies, and , , , and follow the same definition as in Eq. (2) and (3).
II.4 Individual-based simulations
Individual-based simulations are used for the support of this weak selection analytical calculations. Meanwhile, with this tool, we can investigate how the average effort evolves across a wide range of selection strengths. In our simulations, individuals interact in a population of constant size . Each individual’s strategy is initialized randomly at the beginning of the simulation, and the strategies of all individuals are recorded over generations.
III Results and Analysis
III.1 MECG in well-mixed populations
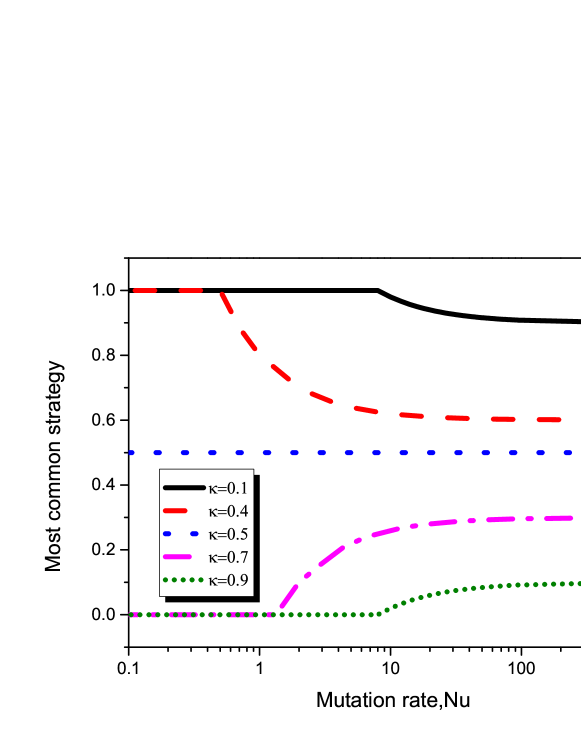
In the weak selection limit where all individuals have roughly the same reproductive success, it is possible to analytically derive which strategy is most frequent. In the well-mixed populations without any structure, by maximizing in condition (4), we find that the most common strategy follows:
| (12) |
As is shown in Fig. 1, the effort cost plays the decisive role in determining : For small (), natural selection most favors individuals who are willing to contribute a higher level () ; Whereas large () leads to the prevalence of low (). monotonically increases with the decreasing of effort cost, according with economic intuition and patterns in laboratory data VANHUYCK1990AER ; COOPER1992QJOE . For low mutation rates, at most two strategies are involved in the population. When the fully contribution strategy behaves better than any another strategy, thereby remaining the most abundant; When , the risk-dominant strategy prevails. Conversely, for high mutation rates, all strategies have almost equal frequencies throughout evolution, and the strategy contributing occupy a position of prominence in this strategy-coexistence state. Intrudingly, despite the strategy mutation rates, sustains at the level of 0.5 for the critical cost value , resembling a “ neutral state”.
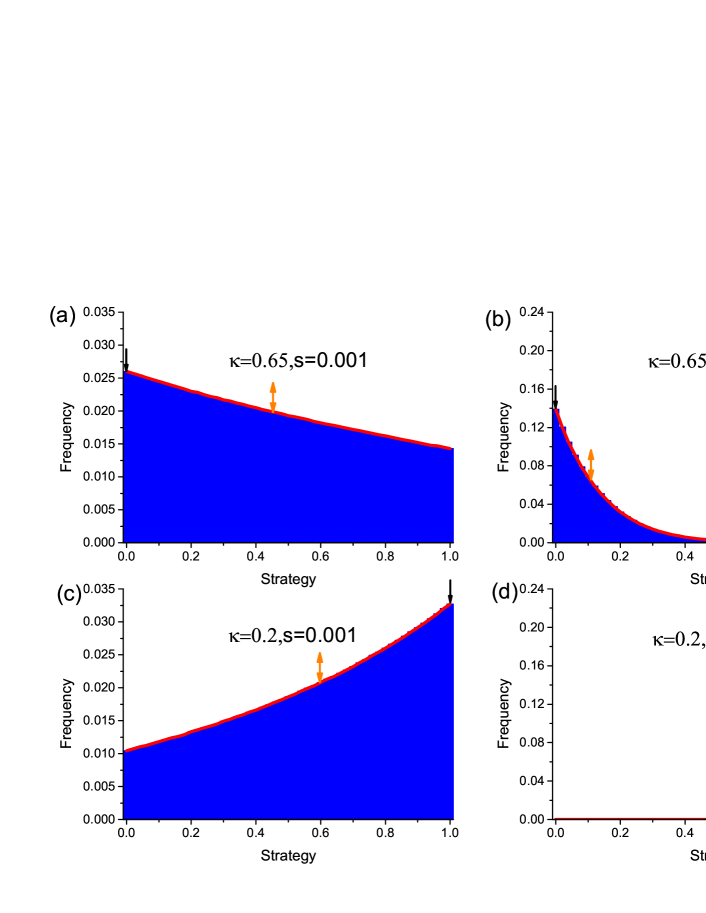
We next evaluate the impact of selection intensity on the strategy distributions in the low mutation case. Sufficiently small assures that a single mutant vanishes or fixes in a population before the next mutant appears, therefore the population is homogeneous most of the time Fudenberg2006JOET . Thus besides individual-based simulations, embedded Markov chain Hauert07Science ; Sigmund10Nature can be utilized here to describe the evolutionary dynamics. Simulation results, in good agreement with the analytical results, show that strengthening does not alter the most common strategy , but enhances the advantage of . When the average contribution level of the whole population decreases with the increment of (see Fig.2 (a), (b)), and the opposite is true for (see Fig.2 (c), (d)). If the imitation strength is considered to be a measure of how precise people’s information is in learning Manapat12JTB ; Rand13PNAS , it seems that information transparency drives the majority of individuals to make a choice between the “worst” Nash outcome and the “best” equilibrium , critically, relying on whether the effort cost is large.
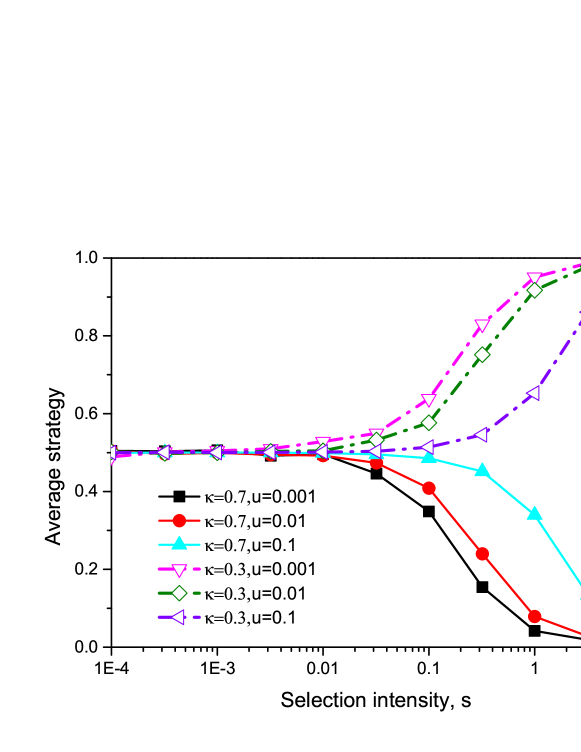
Drawing support from individual-based simulations, we have further studied how the average effort evolves across a wide range of selection strengths and mutation rates. Some view points above have been strengthened in this more general case. As shown in Fig. 3, for small , all the average strategies are close to 0.5, their neutral values. As increases, the average efforts are determined primarily by cost parameter . leads to the fact that the mean contributions are always more than a half and ascends as rises. On the contrary, causes a detrimental effect to whole populations’ efforts with increasing . Strategy mutation, introducing randomness into selection, always inhibits the mean strategy from converging to the extreme states “fully cooperation”() or “complete defection” ().
III.2 MECG in set-structured populations
Furthermore, we are interested in how individuals behave in the MECG if they are located in different groups and they do not play with out-group members. Here, Successful sets attract members, and individuals may adopts a random set with probability , called migration rate, similar to strategy mutation . This extended model can be investigated using evolutionary set theory Tarnita_PNAS09 ; Fu2012SRE . Initially, we concentrate on the simple case of only two strategies and , where . In well-mixed populations, irrespective of any choosing intensity or mutation rate , determines that always performs worse than . However, “in-group favoritism” may greatly facilitate , if
| (13) |
which can be obtained by substituting Eq. (1) into condition (5) when the total number of available strategies is (Correspondingly the size of matrix is ). For small strategy mutation (), can be further simplified as
| (14) |
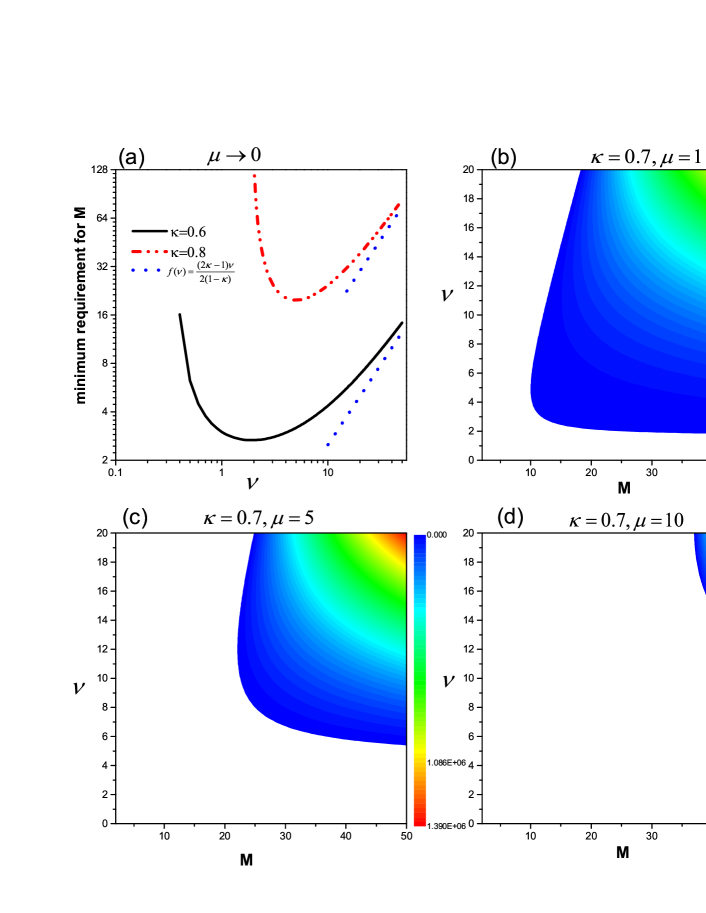
As shown in Fig. 4(a), for large effort cost and high migration rate , condition leads to
| (15) |
showing the minimum requirement for to ensure that prevails over . As increases, more sets are required for sustaining at a higher level than (see Fig. 4 (b)-(d)). In this sense, for large cost parameter either elevating or (when is large ) undermine the evolution of contribution level, but increasing always boosts effort. This can be attributed to the fact that more sets enhance the opportunity of the clustering of higher level strategy () to resist against the invasion from the lower level strategy (), even under unfavorable conditions ().
Moreover, in the weak selection limit, we investigated the MECG with continuous strategy set . A global mutation model, in which an offspring mutant adopts a strategy randomly and uniformly drawn from the unit interval , is utilized to arrive at the analytical results. Using inequality (9), We deduce that natural selection favors strategy if and only if
| (16) | |||||
| (17) |
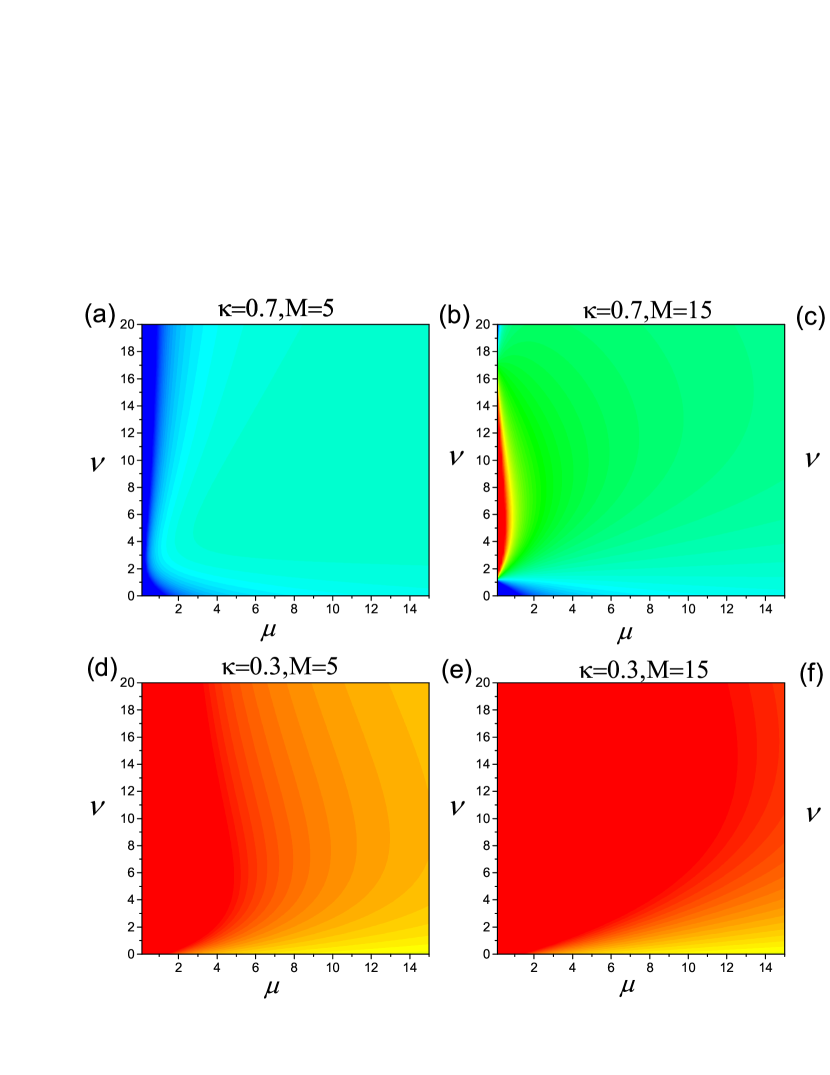
Similarly, the most abundant strategy can be obtained by maximizing . Interestingly, for small strategy mutation , the fully contribution behavior () is most favored if (inequality (12)) holds; Otherwise the majority choose to invest nothing (). The optimum level is presented in Fig. 5 across a wide range of , and . Obviously, also plays the key role in determining (compare Fig. 5(a)-(c) with (d)-(f)). The evolution of is prominently promoted by increasing , especially for large , as shown in Fig. 5(a)-(c). However, low values of set mutation rate , which can be treated as failure in distinguishing sets, keeps individuals from adopting high effort levels (note the lower parts of Fig. 5(a)-(c)). In addition, moderate , equipped with small , is capable of maximizing even when (see the left parts of Fig. 5(b)(c)). We are also interested in whether the average strategy frequency of the whole population can exceed the neutral level for large . Drawing supports from Ref. Fu2012SRE , we can conclude that the condition which ensures is
| (18) |
which also leads to (inequality (11)), coinciding with the two strategies case. The feasible regions of combinations of and , where the whole population incline to contribute a higher level on average, are also presented in Fig. 4.
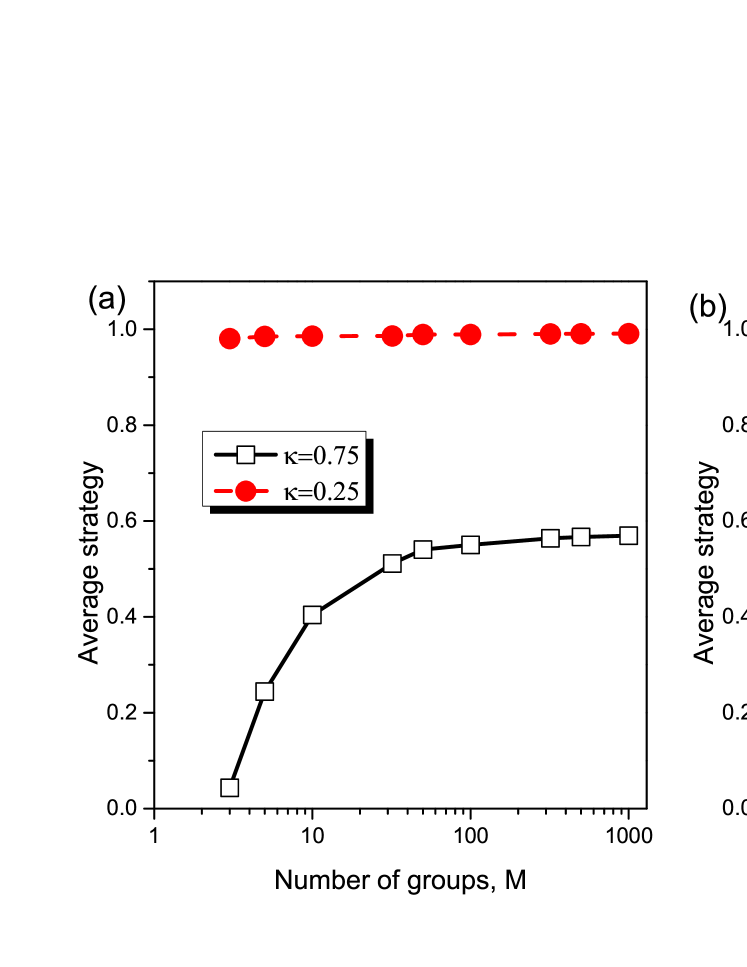
Last, under moderate selection intensity, by computer simulations we show the impacts of and migration rate on average effort respectively. Low facilitates effort, in accordance with above analysis. For , the average effort ascends sharply with when , then stabilizes at a level slightly above . As shown in Fig. 6(b), there is an optimal level of promoting the effort level. As mentioned in Ref. Fu2012SRE , without flexibility in group identity () individuals reside in the same sets forever. On the other hand, excessively high values of make the association between strategy and group membership breaks down.
IV Conclusions
In the minimum-effort coordination game, any common effort constitutes a Nash equilibrium. Without further refinement, the Nash equilibrium concept provides little predictive power. However, experimental data show that efforts are much lower when effort is more costly, or when there are more players VANHUYCK1990AER ; COOPER1992QJOE ; Monderer1996GAEB . To explain the inconsistency, we bring together ideas from coalescence theory and evolutionary game dynamics, to investigate how effort levels evolve in a mutation-selection process.
In the well-mixed situation, analytical results show that effort cost is the primary factor in determining contribution levels, which is in accordance with experimental data. Meanwhile, changing imitation intensity can not alter the most common strategy here, different from the case in the TDG Manapat12JTB . When selection is weak, the dynamics depends greatly on the strategy mutation rate . The most common strategy adopted by players converges from the highest contribution level (when ) or the lowest contribution level (when ) to as increases.
Furthermore, populations are structured by geography or other factors Tarnita_PNAS09 . Individuals usually can only interact with those in the same set or group. Therefore evolutionary set theory is utilized to study evolutionary dynamics of MECG in structured populations. It seems that more sets and moderate migration rate can effectively promote effort levels, especially when the costs are large. Since higher effort levels in MECG may be considered to represent more cooperative strategies Iyer2014PRE , our finding strengthens the viewpoint that the structure of the population allows “cooperative” strategies to “cluster” in certain sets to resist the invasion of the “defective” ones. This also helps to explain why optimal coordination level is sometimes achieved even if the cost is very large in human society.
The MECG is of considerable practical importance since many interesting and significant real-world situations can be modeled by such games BRYANT1983QJOE ; Iyer2014PRE . We hope our observations could help to explain how coordination behaviors evolve in a variety of real life situations.
Acknowledgements.
The authors are supported by NSFC (Grants 61375120 and 61533001).References
- (1) J. B. Vanhuyck, R. C. Battalio and R. O. Belt, Am. Econ. Rev. 80, 234 (1990).
- (2) R. Cooper, D. V. Dejong, R. Forsythe and T. W. Ross, Q. J. Econ. 107, 739 (1992).
- (3) D. Monderer, L. S. Shapley, Games Econ. Behav. 14, 124 (1996).
- (4) M. O. Jackson, A. Watts, Games Econ. Behav. 41, 265 (2002).
- (5) A. Szolnoki, J. Vukov and G. Szabó, Phys. Rev. E 80, 056112 (2009).
- (6) J. A. Bryant, Q. J. Econ. 98, 525 (1983).
- (7) R. Cooper, A. John, Q. J. Econ. 103, 441 (1988).
- (8) S. Iyer, T. Killingback, Phys. Rev. E 90, 042134 (2014).
- (9) S. Iyer, T. Killingback, PLoS ONE 9, e93988 (2014).
- (10) X. J. Chen, A. Szolnoki and M. Perc, New J. Phys. 16, 083016 (2014).
- (11) M. Perc, A. Szolnoki, New J. Phys. 14, 043013 (2012).
- (12) A. Szolnoki, G. Szabó, and M. Perc, Phys. Rev. E 83, 036101 (2011).
- (13) K. Li, R. Cong, T. Wu and L. Wang, Phys. Rev. E 91, 042810 (2015).
- (14) J. K. Goeree, C. A. Holt, Proc. Natl. Acad. Sci. USA 96, 10564 (1999).
- (15) J. K. Goeree, C. A. Holt, Am. Econ. Rev. 91, 1402 (2001).
- (16) S. P. Anderson, J. K. Goeree and C. A. Holt, Games Econ. Behav. 34, 177 (2001).
- (17) R. A. Weber, Am. Econ. Rev. 96, 114 (2006).
- (18) G. Devetag, Econ. Lett. 89, 227 (2005).
- (19) G. Bornstein, U. Gneezy and R. Nagel, Games Econ. Behav. 41, 1 (2002).
- (20) R. Chen, Y. Chen, Am. Econ. Rev. 101, 2562 (2011).
- (21) C. F. Camerer, J. Econ. Perspec. 11, 167 (1997).
- (22) J. Brandts, D. J. Cooper, Exp. Econ. 9, 407 (2006).
- (23) A. Chaudhuri, T. Paichayontvijit, Exp. Econ. 13, 346 (2010)
- (24) J. Romero, J. Econ. Behav. Organ. 111, 88 (2015).
- (25) J. Hamman, S. Rick and R. A. Weber, Exp. Econ. 10, 285 (2007).
- (26) J. Hofbauer, K. Sigmund, Evolutionary Games and Population Dynamics (Cambridge Univ. Press, Cambridge, UK, 1998).
- (27) J. Maynard Smith, Evolution and the Theory of Games (Cambridge Univ. Press, Cambridge, UK, 1982).
- (28) G. Szabó, G. Fáth Phys. Rep. 446, 97 (2007).
- (29) R. W. Rosenthal, Int. J. Game Theory Int. J. Game Theory 18, 273 (1989).
- (30) R. D. Mckelvey, T. R. Palfrey, Games Econ. Behav. 10, 6 (1995).
- (31) C. E. Tarnita, T. Anatal and M. A. Nowak, J. Theor. Biol. 261, 50 (2009).
- (32) Y. L. Zhang, F. Fu, T. Wu, G. M. Xie and L. Wang, Sci. Rep. 3, 2021 (2013).
- (33) A. Szolnoki, M. Perc and G. Szabó, EPL 100, 28005 (2012).
- (34) T. Antal, H. Ohtsuki, J. Wakeley, P. D. Taylor and M. A. Nowak, Proc. Natl. Acad. Sci. U.S.A. 106, 8597 (2009).
- (35) C. E. Tarnita, T. Antal, H. Ohtsuki and M. A. Nowak, Proc. Natl. Acad. Sci. U.S.A. 106, 8601 (2009).
- (36) F. Fu, C. E. Tarnita, N. A. Christakis, L. Wang, D. G. Rand and M. A. Nowak, Sci. Rep. 2, 460 (2012).
- (37) M. A. Nowak, R. M. May, Nature 359, 826 (1992).
- (38) A. Szolnoki, Z. Wang and M. Perc, Sci. Rep. 2, 576 (2012).
- (39) M. Perc, J. Gómez-Gardeñes, A. Szolnoki, L. M. Floría and Y. Moreno, J. R. Soc. Interface 10, 20120997 (2013).
- (40) K. Li, R. Cong, T. Wu and L. Wang, Sci. Rep. 4, 5491 (2014).
- (41) D. Fudenberg, L. A. Imhof, Bull. Math. Biol. 74, 399 (2012).
- (42) M. Uyenoyama, M. W. Feldman, Theor. Pop. Biol. 17, 380 (1980).
- (43) A. R. Rogers, Am. Nat. 135, 398 (1990).
- (44) M. A. Nowak, K. Sigmund, Science 303, 793 (2004).
- (45) C. E. Tarnita, N. Wage and M. A. Nowak, Proc. Natl. Acad. Sci. U.S.A. 108, 2334 (2011).
- (46) D. Fudenberg, L. A. Fudenberg, J. Econ. Theory 131, 251 (2006).
- (47) C. Hauert, A. Traulsen, H. Brandt, M. A. Nowak and K. Sigmund, Science 316, 1905 (2007).
- (48) K. Sigmund, H. D. Silva, A. Traulsen and C. Hauert, Nature 466, 861 (2010).
- (49) M. L. Manapat, D. G. Rand, C. Pawlowitsch and M. A. Nowak, J. Theor. Biol. 303, 119 (2012).
- (50) D. G. Rand, C. E. Tarnita, H. Ohtsuki and M. A. Nowak, Proc. Natl. Acad. Sci. USA 110, 2581 (2013).