The VIMOS Ultra Deep Survey: Ly Emission and Stellar Populations of Star-Forming Galaxies at 2 6
Abstract
The extensive ground-based spectroscopy campaign from the VIMOS Ultra-Deep Survey (VUDS), and the deep multi-wavelength photometry in three very well observed extragalactic fields (ECDFS, COSMOS, VVDS), allow us to investigate physical properties of a large sample (4000 galaxies) of spectroscopically confirmed faint ( 25 mag) SFGs, with and without Ly in emission, at 2–6. The fraction of Ly emitters (LAEs; equivalent width (EW) 20Å) increases from 10% at 2 to 40% at 5–6, which is consistent with previous studies that employ higher Ly EW cut. This increase in the LAE fraction could be, in part, due to a decrease in the dust content of galaxies as redshift increases. When we compare best-fit SED estimated stellar parameters for LAEs and non-LAEs, we find that Es(B-V) is smaller for LAEs at all redshifts and the difference in the median Es(B-V) between LAEs and non-LAEs increases as redshift increases, from 0.05 at 2 to 0.1 at 3.5 to 0.2 at 5. For the luminosities probed here (L∗), we find that star formation rates (SFRs) and stellar masses of galaxies, with and without Ly in emission, show small differences such that, LAEs have lower SFRs and stellar masses compared to non-LAEs. This result could be a direct consequence of the sample selection. Our sample of LAEs are selected based on their continuum magnitudes and they probe higher continuum luminosities compared to narrow-band/emission line selected LAEs. Based on our results, it is important to note that all LAEs are not universally similar and their properties are strongly dependent on the sample selection, and/or continuum luminosities.
keywords:
galaxies: high-redshift, galaxies: formation, galaxies: evolution, galaxies: fundamental parameters1 Introduction
In recent years, the unprecedented increase in the sensitivity of the space-based as well as the ground-based observations has revolutionized our understanding of high redshift ( 2) galaxies (e.g., Finkelstein et al., 2015; Bouwens et al., 2015; Ellis et al., 2013; Hathi et al., 2010). This large reservoir of star-forming galaxies (SFGs) has tremendous implications on our understanding of the process of galaxy formation and evolution. Lyman alpha (Ly) is typically the strongest UV emission line in SFGs and a crucial spectroscopic signature to confirm high redshift galaxies selected based on their colors. The first studies of Ly emitters (LAEs) predicted that they could represent the first galaxies in formation (e.g., Partridge & Peebles, 1967). Although originally predicted to be extremely young, recent studies have shown that LAEs have a variety of ages, from 1 Myr to 1 Gyr (e.g., Gawiser et al., 2006; Finkelstein et al., 2007; Lai et al., 2008; Kornei et al., 2010), range in dust extinction (e.g., Pirzkal et al., 2007; Finkelstein et al., 2009), and a wide range in stellar masses (e.g., Shapley et al., 2003; Erb et al., 2006; Pentericci et al., 2007; Hathi et al., 2015). Such a large diversity in physical properties of LAEs implies that these are not galaxies undergoing their first burst of star formation. It is also puzzling that some LAEs show high dust content as Ly photons cannot easily escape from dusty galaxies because they are resonantly scattered by neutral hydrogen. These results, which are based on both narrow-band (NB) as well as broad-band selection, show a wide range of stellar properties for LAEs which contradicts early predictions of LAEs as young, first galaxies. In the era of large surveys, it is now possible to study statistically significant sample of these galaxies at all redshifts and get better insight into the physical nature of LAEs, which has important implications on our understanding of evolutionary properties of galaxies and the state of intergalactic medium (IGM) in the early universe.
2 Observations and Sample Properties
The VUDS observations were done using the low-resolution multi-slit mode of VIMOS on the VLT. A total of 15 VIMOS pointings (224 arcmin2 each, 1 deg2 total) were observed covering the full wavelength range from 3650Å to 9350Å in three deep survey fields (ECDFS, VVDS-02h, COSMOS), which has extensive multi-wavelength data. The primary selection criterion for galaxies in the VUDS program was photometric redshifts. Therefore, the targets for the VUDS program include a representative sample of all SFGs at a particular redshift within a given magnitude limit ( 25 mag, with some galaxies as faint as 27 mag). A detailed discussion about these observations, data reduction process, target selection, reliability of the redshift measurements and corresponding quality flags is presented in Le Fèvre et al. (2015).
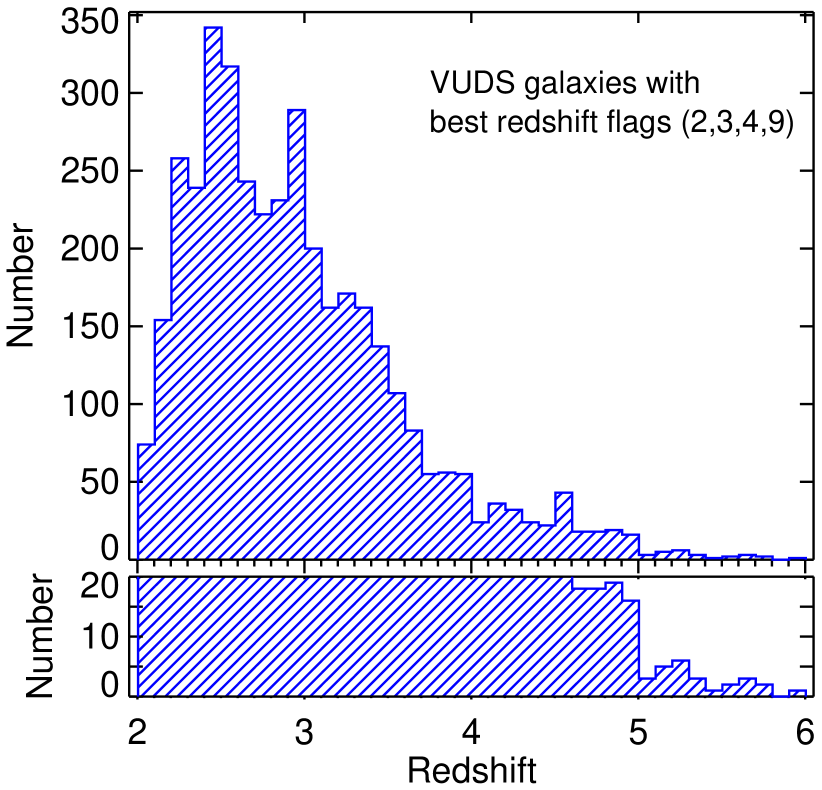
We select all VUDS objects between = 2 and = 6, keeping only the best reliability flags (2,3,4,9) — which gives very high probability (75-85%, 95-100%, 100%, 80%, respectively; see Le Fèvre et al. 2015 for details) for these redshifts to be correct. The redshift distribution of the sample is shown in the left panel of Figure 1. Our sample of SFGs has only little contamination from AGN identified based on their X-ray emission and IRAC colors (2–3%).
The Le PHARE software package (Ilbert et al., 2006) was used to fit the broad-band observed spectral energy distributions (SEDs) with synthetic stellar population models. A detailed discussion about the SED fitting process is presented in Hathi et al. (2015). From the best-fit model, we estimate stellar mass, dust extinction Es(B-V), star-formation rate (SFR), and stellar age for each galaxy.
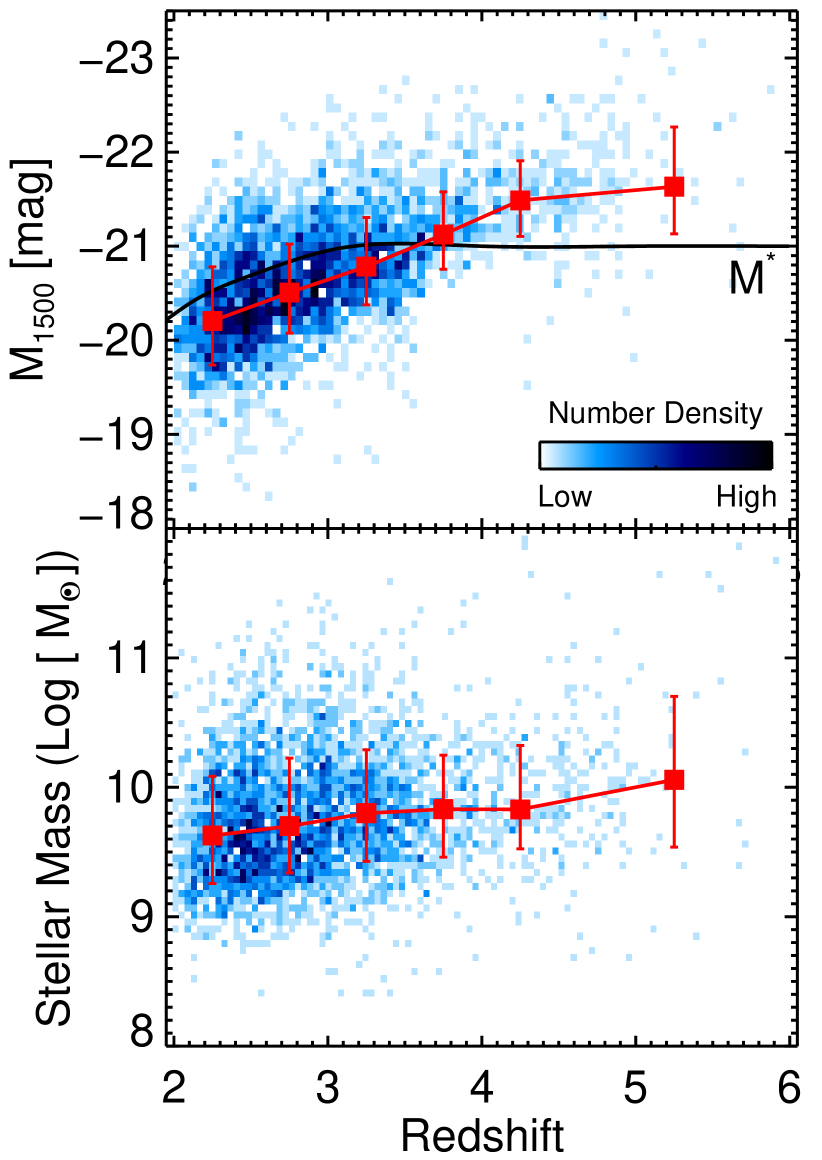
The middle panel of Figure 1 shows UV (1500Å) absolute magnitudes (M1500) and stellar masses as a function of redshift for the VUDS SFG sample. We are probing UV continuum luminosities around L∗ (or brighter) at these redshifts, and similar median stellar masses (within error bars) at all redshifts.
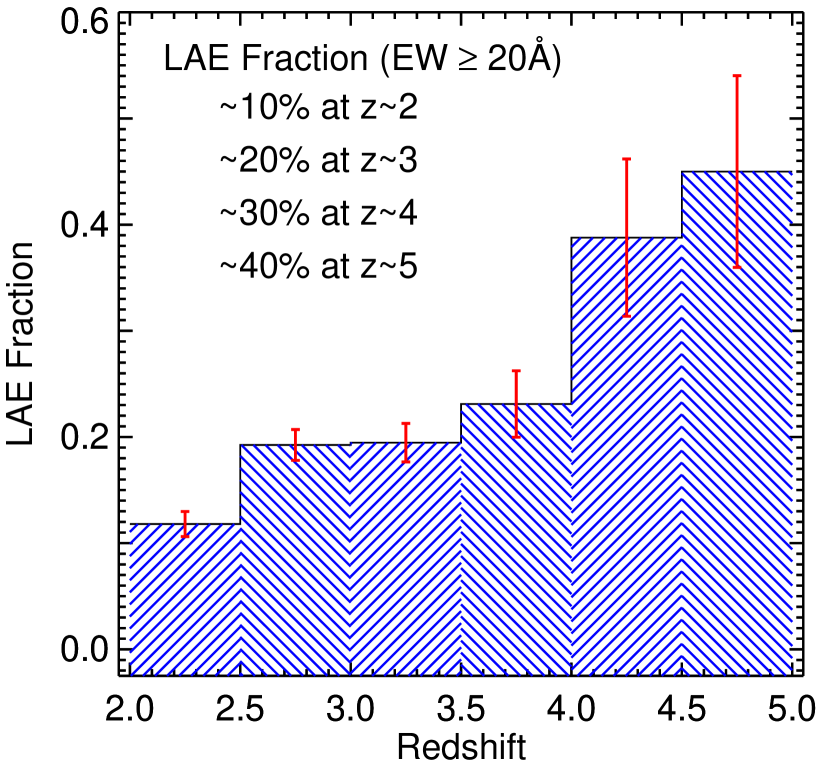
The Ly equivalent widths (EWs) for VUDS SFGs were measured as described in Cassata et al. (2015) and Hathi et al. (2015). We divide the SFG population into three sub-groups based on their Ly EW. The galaxies that show no Ly in emission (EW 0Å) are defined as SFGN, while the galaxies with Ly in emission, irrespective of its strength (EW 0Å), are defined as SFGL. The third group is for strong Ly emitters (EW 20Å) called LAEs. The fraction of LAEs in SFGs increases from 10% at 2 to 40% at 5–6 as shown in the right panel of Figure 1. This result is in agreement with the general scenario that the fraction of LAEs in SFGs increases as redshift increases reaching 30-40% at 6 (e.g., Stark et al., 2010; Cassata et al., 2015).
3 Results
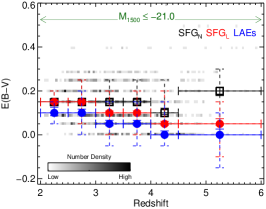
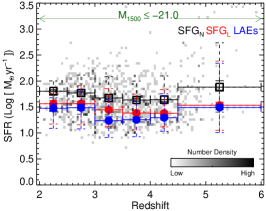
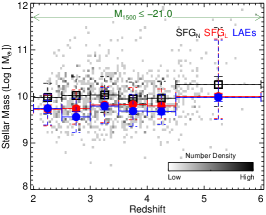
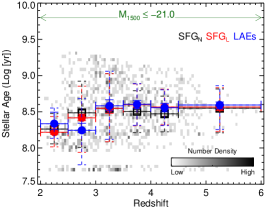
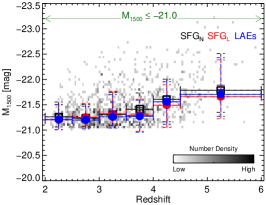
We use a large (4000) spectroscopic sample of SFGs at 2–6 from VUDS to investigate their spectral and photometric properties. Figure 2 shows a comparison between SED-based stellar parameters of the LAEs, SFGL, and SFGN samples. Here, we have applied a UV absolute magnitude cut (M1500 –21.0), which is around M∗ for galaxies at 3–6 (Finkelstein et al., 2015), to investigate any evolutionary trend as a function of redshift. The SED-based dust indicator, Es(B-V), shows smaller values for LAEs compared to SFGN galaxies. The difference between median Es(B-V) values for LAEs and non-LAEs seems to increase as redshift increases (0.05 at 2 to 0.1 at 3.5 to 0.2 at 5). This could be one of the reasons why we observe an increase in the LAE fraction as a function of redshift (Figure 1). The SED-based SFRs depend on the amount of dust in galaxies and hence, show small decrease in their median values for LAEs compared to non-LAEs. This difference, on average, is 0.3 dex. The SED-based stellar masses (0.2 dex), stellar ages (0.1 dex), and M1500 (0.1 mag) show, on average, smaller difference between LAEs and non-LAEs, as shown in Figure 2. These trends in SED parameters, between LAEs and non-LAEs, remains the same irrespective of the M1500 cut.
The small but significant differences that we observe in the SED-based parameters of LAEs and non-LAEs could be a direct consequence of our sample selection. Our sample of LAEs (and non-LAEs) is selected based on their continuum magnitudes compared to NB/emission line selection of LAEs. The NB/emission line selected LAEs are physically different as they probe lower continuum luminosities and typically extend to higher EW ( 200Å) LAEs. From various studies on this topic, including this one, it is imperative to note that LAEs have a wide range of stellar properties depending on their selection criteria, luminosities, and stellar masses. A small difference in SED-based stellar parameters, between LAEs and non-LAEs, points to the fact that the escape of Ly emission from galaxies is a complex process, and could be affected by intrinsic properties of these galaxies which includes, the dust content/geometry, morphology, kinematics and interstellar medium geometry, and/or change in the Lyman continuum escape fraction. Our future studies will continue to explore various aspects affecting Ly emission from galaxies to better understand the difference in physical properties of LAEs and non-LAEs.
References
- Bouwens et al. (2015) Bouwens, R., Illingworth, G. D., Oesch, P. A., et al. 2015, ApJ, 803, 34
- Cassata et al. (2015) Cassata, P., Tasca, L., Le Fèvre, O., et al. 2015, A&A, 573, A24
- Erb et al. (2006) Erb, D. K., Shapley, A. E., Pettini, M., et al. 2006, ApJ, 644, 813
- Ellis et al. (2013) Ellis, R. S., McLure, R. J., Dunlop, J. S., et al. 2013, ApJ, 763, L7
- Finkelstein et al. (2007) Finkelstein, S., Rhoads, J., Malhotra, S., et al. 2007, ApJ, 660, 1023
- Finkelstein et al. (2009) Finkelstein, S., Rhoads, J., Malhotra, S., et al. 2009, ApJ, 691, 465
- Finkelstein et al. (2015) Finkelstein, S. L., Ryan, R. E., Papovich, C., et al. 2015, ApJ, 810, 71
- Gawiser et al. (2006) Gawiser, E., van Dokkum, P., Gronwall, C., et al. 2006, ApJ, 642, L13
- Hathi et al. (2010) Hathi, N. P., Ryan, R. E., Cohen, S. H., et al. 2010, ApJ, 720, 1708
- Hathi et al. (2015) Hathi, N. P., Le Fèvre, O., Ilbert, O., et al. 2015, A&A, submitted (arXiv:1503.01753)
- Ilbert et al. (2006) Ilbert, O., Arnouts, S., McCracken, H. J., et al. 2006, A&A, 457, 841
- Kornei et al. (2010) Kornei, K., Shapley, A., Erb, D., et al. 2010, ApJ, 711, 693
- Lai et al. (2008) Lai, K., Huang, J.-S., Fazio, G., et al. 2008, ApJ, 674, 70
- Le Fèvre et al. (2015) Le Fèvre, O., Tasca, L., Cassata, P., et al. 2015, A&A, 576, A79
- Partridge & Peebles (1967) Partridge & Peebles 1967, ApJ, 147, 868
- Pentericci et al. (2007) Pentericci, L., Grazian, A., Fontana, A., et al. 2007, A&A, 471, 433
- Pirzkal et al. (2007) Pirzkal, N., Malhotra, S., Rhoads, J., et al. 2007, ApJ, 667, 49
- Shapley et al. (2003) Shapley, A., Steidel, C., Pettini, M., et al. 2003, ApJ, 588, 65
- Stark et al. (2010) Stark, D. P., Ellis, R. S., Chiu, K., et al. 2010, MNRAS, 408, 1628