Bimodality of low-redshift circumgalactic O VI in non-equilibrium EAGLE zoom simulations
Abstract
We introduce a series of 20 cosmological hydrodynamical simulations of () and group-sized () haloes run with the model used for the EAGLE project, which additionally includes a non-equilibrium ionization and cooling module that follows 136 ions. The simulations reproduce the observed correlation, revealed by COS-Halos at , between O vi column density at impact parameters kpc and the specific star formation rate (sSFRSFR) of the central galaxy at . We find that the column density of circumgalactic O vi is maximal in the haloes associated with galaxies, because their virial temperatures are close to the temperature at which the ionization fraction of O vi peaks ( K). The higher virial temperature of group haloes ( K) promotes oxygen to higher ionization states, suppressing the O vi column density. The observed -sSFR correlation therefore does not imply a causal link, but reflects the changing characteristic ionization state of oxygen as halo mass is increased. In spite of the mass-dependence of the oxygen ionization state, the most abundant circumgalactic oxygen ion in both and group haloes is O vii; O vi accounts for only 0.1% of the oxygen in group haloes and 0.9-1.3% with haloes. Nonetheless, the metals traced by O vi absorbers represent a fossil record of the feedback history of galaxies over a Hubble time; their characteristic epoch of ejection corresponds to and much of the ejected metal mass resides beyond the virial radius of galaxies. For both and group galaxies, more of the oxygen produced and released by stars resides in the circumgalactic medium (within twice the virial radius) than in the stars and ISM of the galaxy.
keywords:
galaxies: formation; intergalactic medium; cosmology: theory; quasars; absorption lines1 Introduction
A self-consistent model of galaxy formation requires an understanding of the relationship between the galactic components, stars and the interstellar medium (ISM), and the surrounding gaseous reservoir that extends to the virial radius and beyond, defined roughly as the circumgalactic medium (CGM). At redshift , the galactic component is well characterised through observational inference of stellar masses, star formation rates (SFRs), and morphologies. The corresponding CGM remains much more challenging to characterise, because its diffuse nature generally requires absorption line spectroscopy toward background UV-bright sources. This significant reservoir of halo gas clearly plays a central role in the cycling of baryons into and out of a galaxy, regulating its growth; however the details of the galaxy-CGM relationship remain elusive.
Until recently, UV absorption line spectroscopy could not target low-redshift galactic haloes, because only a small number of quasars were bright enough. The study of the metal enrichment of the low- intergalactic medium (IGM) relied on surveys of metal lines in serendipitous sight lines providing a cross section-weighted sampling (e.g. Thom & Chen, 2008; , 2008, 2009; Tilton et al., 2012; Danforth et al., 2014). These observations could be confronted with cosmological hydrodynamical simulations that included metal enrichment from galactic superwinds to learn how the nucleosynthetic products of star formation enrich the diffuse CGM and IGM (e.g. , 2001, 2003, 2003b, 2006, 2009; Tornatore et al., 2010; Wiersma et al., 2010; Cen & Chisari, 2011; , 2011; Tepper-Garcia et al., 2011; Tescari et al., 2011; Oppenheimer et al., 2012; Crain et al., 2013; Rahmati et al., 2015b).
The installation of the Cosmic Origins Spectrograph (COS) greatly increased the throughput of UV spectroscopy on the Hubble Space Telescope (HST) platform (e.g. Savage et al., 2010), enabling the use of fainter quasar targets illuminating foreground galactic haloes. Several HST programs have exploited this new capability to investigate the gaseous environments of a sample of low- haloes, including COS-Halos (Tumlinson et al., 2013), COS-Dwarfs (Bordoloi et al., 2014), and COS-GASS (Borthakur et al., 2015). Other recent studies have also characterised the CGM relative to samples of galaxies, including Chen et al. (2010); Bordoloi et al. (2011); Kacprzak et al. (2011); Borthakur et al. (2013); Churchill et al. (2013); Nielsen et al. (2013); Stocke et al. (2013); Liang & Chen (2014); Kacprzak et al. (2015) at low- and Turner et al. (2014) at high-.
One of the first COS-Halos results demonstrated statistically that the properties of O vi absorption, out to impact parameter kpc, correlate with the properties of the host galaxies (Tumlinson et al, 2011, hereafter T11). The strongest correlation was found between the O vi column density () and the specific star formation rate (sSFRSFR) of the galaxy, such that the bimodality in sSFR between the COS-Halos star-forming sample and the passive sample is clearly reflected in their O vi columns. Of the 12 COS-Halos passive galaxies, defined as having sSFR less than yr-1, at least half have , while 90% of the 30 COS-Halos star-forming galaxies have and the median is at kpc.
T11 identified O vi haloes as a major reservoir of the metals synthesized by star-forming galaxies, estimating a typical O vi mass of when summing the median O vi column of over a 150 kpc radius aperture. The total mass of oxygen traced by COS-Halos is at least when assuming a maximum O vi ionization fraction, . Peeples et al. (2014) explored the O vi haloes in the context of the total metal budget estimated to be synthesized by galaxies, concluding that there exists nearly as much metal mass traced by circumgalactic O vi as in the ISM of galaxies with for .
The discovery of such a large reservoir of O vi-traced metals extending far beyond the stellar disk of the galaxy leads to several questions about the dynamical link between galaxies and their associated CGM. Is there a direct relation between the O vi in haloes and star formation as suggested by the O vi-sSFR correlation? Such a link would imply that typical galaxies are spewing enriched gas in galactic winds out to 150 kpc and beyond in the low- Universe. A number of large-volume simulations (e.g. Ford et al., 2013, 2015; Suresh et al., 2015a, b) and zooms with cosmological initial conditions (e.g. Stinson et al., 2012; Hummels et al., 2013; Shen et al., 2014; Gutcke et al., 2016) have found an intimate link between galaxies and their metal-enriched CGM. Simulations that specifically compared with the COS-Halos survey find lower O vi column densities than observed around star-forming galaxies (Ford et al., 2015; Suresh et al., 2015b). The Ford et al. (2015) simulations do not include Active Galactic Nucleus (AGN) feedback and do not reproduce the O vi bimodality, while Suresh et al. (2015b) argue that AGN feedback clears out the CGM around passive galaxies thus reducing O vi column densities around passive galaxies.
Another possibility is that CGM O vi is not directly attributable to recent star formation or AGN activity, and that instead the O vi bimodality arises from a more fundamental relationship. To assess this possibility, we need to ask what is the physical nature of O vi? If O vi is predominantly photo-ionized gas at K (e.g. , 2009), then such absorbers could be a signature of cold flows (e.g. , 2005, 2009; van de Voort et al., 2012) feeding star formation, which may subside around passive galaxies. Enhanced photo-ionization from young stars could also ionize O vi around star-forming galaxies (Oppenheimer & Schaye, 2013b; Vasiliev et al., 2015; Suresh et al., 2015b). Oppenheimer et al. (2012) demonstrated that increasing the ionization background strength at the O vi ionization potential can result in photo-ionized O vi tracing higher densities, even in circumgalactic halo gas. Alternatively, if O vi is primarily collisionally ionized at its K peak (e.g. , 2002; Cen & Chisari, 2011; , 2011; Tepper-Garcia et al., 2011; Faerman et al., 2016), then it signals a hot halo component apparently associated with star-forming galaxies. Is this warm-hot component related to recent outflows or does it trace the temperature of a virialized, quasi-static halo? If the latter, do passive galaxies lack O vi haloes, because their virial temperatures are much hotter than K?
Knowledge of the physical cause of the ionization is required to constrain , from which the total mass of oxygen and metals in the CGM is inferred. Because the O vi-traced CGM mass scales inversely with , far more CGM oxygen would be present if is much lower than the maximal value implied by ionization analyses. Hence, it is uncertain how much underlying CGM oxygen the COS-Halos O vi observation indicate.
To understand the origin and nature of O vi in a set of haloes hosting galaxies corresponding to those probed by COS-Halos, we need cosmological simulations that can simultaneously model the stellar build-up of galaxies, the feedback processes that eject gas from galaxies, and the detailed atomic processes that govern the abundances of the ions observed in the CGM. Here, we run a series of zoom simulations targeting a range of galactic haloes similar to those probed by the COS-Halos survey using the same model as the EAGLE simulations (Schaye et al., 2015, hereafter S15; Crain et al. 2015). The parameters of the subgrid physics routines employed by the EAGLE simulations were calibrated to reproduce the observed galactic stellar mass function, the super-massive black hole (SMBH) mass- relation, and the sizes of galaxy discs using a combination of star formation (SF)-driven thermal winds and SMBH thermal winds. Observations of the CGM were not used to calibrate the EAGLE simulations, therefore the outcomes here are genuine predictions of the model.
Here we integrate the non-equilibrium (NEQ) ionization and dynamical cooling module introduced by Oppenheimer & Schaye (2013a, hereafter OS13) into the EAGLE simulation code to trace the evolution of 136 ions of 11 elements on the fly, which we activate at late times for evolved haloes. The module includes photo-ionization from a slowly evolving meta-galactic background, in this case the (2001) quasar+galaxy background. We also note that this work is the first we know of to integrate ion-by-ion cooling rates including for the metals (, 2012; Oppenheimer & Schaye, 2013a) into a cosmological simulation. NEQ ionization of oxygen was explored in simulations by (2006) and Yoshikawa & Sasaki (2006), but they did not perform dynamical cooling. We discuss the NEQ effects in Appendix A, but note that these do not significantly affect the O vi columns when using a uniform meta-galactic background, nor do they alter the integrated properties of galaxies (, SFR, colour).
Our investigation focuses on the O vi column density observations from COS-Halos. We stress that the EAGLE feedback model has not been calibrated to reproduce the properties of the CGM. Nevertheless, EAGLE shows agreement with cosmic H i statistics tracing the IGM over a Hubble time (Rahmati et al., 2015a). Furthermore, because EAGLE reproduces key stellar and cold ISM properties of galaxies (e.g. S15; Furlong et al., 2015, 2016; Lagos et al., 2015a, b; Trayford et al., 2015; Bahé et al., 2016; Segers et al., 2015), while explicitly following the hydrodynamics, it is an ideal testbed for this study and will indicate whether additional physical processes are necessary to reproduce CGM measurements. This enables us to consider the total metal budget inside and beyond galaxies as done by (2007); Zahid et al. (2012); Peeples et al. (2014). We also compare our results to the related work of Rahmati et al. (2015b), who explored IGM metal-line statistics, including O vi, in the EAGLE cosmological boxes. Throughout we use the EAGLE-Recal prescription for all zooms as discussed in S2; however it should be noted that the main EAGLE cosmological boxes use two different prescriptions (Ref and Recal) at two different resolutions, which we we discuss in Appendix B and show that there is not a significant difference for our main results.
The layout of the paper is as follows. We describe our zoom simulations and implementation of our non-equilibrium module in §2. We present the physical nature and origin of the oxygen-traced CGM in §3, and then confront the COS-Halos observations in §4. The global content of oxygen produced and distributed by galaxies is considered in §5. We discuss the implications of our results in §6 and summarize in §7. Non-equilibrium effects and resolution convergence are explored in the Appendix.
2 Simulations
In this Section, we give a brief overview of the EAGLE simulation code, followed by how our non-equilibrium module is integrated with it. We then describe our zoom simulations with attention paid to how the adopted physical model used here differs from the standard EAGLE implementation.
2.1 The EAGLE simulation code
The EAGLE simulation code is an extensively modified version of the N-body+Smoothed Particle Hydrodynamic (SPH) code Gadget-3 last described by (2005), which is described in detail by S15. The main modifications to the entropy-conserving SPH implementation of the Gadget-3 code (, 2003a) comprise i) the pressure-entropy SPH formulation described by Hopkins (2013), ii) the artificial viscosity switch of Cullen & Dehnen (2010), iii) the artificial conduction switch of Price (2008), iv) the timestep limiter from Durier & Dalla Vecchia (2012) to improve energy conservation during sudden changes of internal energy, and v) a C2 Wendland (1995) 58-neighbour kernel to suppress particle-pairing instabilities (Dehnen & Aly, 2012). Collectively, these updates are referred to as “Anarchy” (Dalla Vecchia, in prep.; see also Appendix A of S15) and the impact of their inclusion on the galaxy population was explored by (2015).
A number of subgrid physics modules are included in the EAGLE code. Equilibrium radiative cooling and photo-heating rates are computed for 11 elements exposed to the (2001) extra-galactic ionization background plus the Cosmic Background Radiation as described by (2009a). These rates are computed using CLOUDY (version 07.02 Ferland et al., 1998), and are replaced here with the NEQ rates of OS13 described in §2.2 when run in NEQ mode.
Star formation is modelled using the Schaye & Dalla Vecchia (2008) pressure-based law. A pressure floor, is additionally imposed, corresponding to a polytropic equation of state, normalised to K at , because we do not resolve the Jeans scales of the cold ISM. The (1998) SF surface density relationship is reproduced by construction for gas particles above the Schaye (2004) metallicity-dependent SF density threshold. The stellar evolution and enrichment module introduced by (2009b) includes element-by-element and mass metal loss from AGB stars, stellar winds from massive stars, and SNe (core collapse and Type Ia), which is distributed across the SPH kernel of each stellar particle. A (2003) initial mass function (IMF) is adopted.
Following Dalla Vecchia & Schaye (2012), feedback associated with star formation and the SMBH growth is implemented by stochastically heating gas particles neighbouring newly-formed star particles and accreting SMBH. The energy budgets available associated with stellar feedback and black hole growth govern the probability of heating each SPH particle. Briefly, stellar feedback heats particles by K in a single episode 30 Myr after a star particle forms. The fraction of the available energy injected into the ISM depends on the local gas metallicity () to account for more efficient cooling at higher , and the local gas density to compensate for artificial radiative losses that occur at high density (see S15; Crain et al., 2015, for further motivation). SMBH growth and AGN feedback are implemented using a single thermal mode following Booth & Schaye (2009) with the addition of the suppression of high angular momentum gas accretion following Rosas-Guevara et al. (2013). We use the high-resolution EAGLE-Recal prescription, which applies a heating temperature of K.
2.2 Non-equilibrium network integrated into EAGLE
The NEQ module, introduced by OS13, explicitly follows the reaction network of 136 ionization states of all 11 elements that contribute significantly to the cooling (H, He, C, N, O, Ne, Si, Mg, S, Ca, & Fe) plus the electron density of the plasma. These are the same elements as are present in the equilibrium cooling module of (2009a), enabling a self-consistent switching between using equilibrium lookup tables and the NEQ method. Our reaction network, described fully by OS13, includes radiative and di-electric recombination, collisional ionization, photo-ionization, Auger ionization, and charge transfer. Cooling is performed ion-by-ion (, 2012, OS13) summing over all 136 ions. OS13 verified that this method reproduces published results obtained with other codes. We use particle-based (instead of kernel-smoothed) ion and metal abundances for NEQ ionization and cooling as explained in §2.3.3.
Our NEQ module applies the Sundials CVODE111https://computation.llnl.gov/casc/sundials/main.html solver to integrate the ionization and cooling over a hydrodynamic timestep using the backward difference formula and Newton iteration. Although an extended version of the network is also capable of modelling ISM chemistry including molecular formation, cooling, and dissociation (see Richings et al., 2014), we focus on the CGM and do not use the NEQ network for gas densities above the metallicity-dependent SF threshold. For ISM gas, defined as having non-zero SFR, we use equilibrium lookup tables tabulated as functions of density assuming K, although we note that this matters little as the ion abundances will rapidly evolve when the SPH particle is heated by feedback, and the NEQ network followed. Upon enrichment, SPH particles receive the new metals in their ground-state ions. The vast majority of enrichment occurs in the ISM gas, where the network is not used. However, enrichment of gas followed using the NEQ network occurs when stars outside of galaxies enrich via delayed feedback (e.g. Type Ia SNe & AGB winds). Our exploration here focuses on CGM gas traced by oxygen absorption, most of which is far from galaxies; hence the details of the ion abundances in ISM gas and from recent enrichment is essentially inconsequential. We set the CVODE absolute tolerance to and the relative tolerances to . We do not use a self-shielding prescription for dense gas in either equilibrium or NEQ.
2.3 Zoom simulations
2.3.1 Initial conditions
We assume the same Planck Collaboration (2014) cosmological parameters adopted by the EAGLE simulations: , , , , , and . To generate the zoomed initial conditions, we use initial conditions generated using the second-order Lagrangian perturbation theory method of Jenkins (2010) and the public Gaussian white noise field Panphasia (Jenkins & Booth, 2013). Targets for resimulation are identified at , and the particles comprising a spherical region that encloses the target object to a radius of (where encloses an overdensity of the critical overdensity) are traced back to their coordinates in the unperturbed initial particle distribution. A contiguous surface enclosing the particles is identified out to the virial radius, and the volume it encloses is resampled with a high-resolution particle load realised by tiling a cubic periodic glass distribution (White, 1994). This high-resolution particle load is divided into SPH and high-resolution dark matter (DM1) particles, using and respectively. The remaining volume within the simulation domain is resampled with an undivided load of collisionless particles whose resolution decreases as a function of distance from the surface ensuring the faithful reproduction of large-scale gravitational forces throughout the high-resolution region. A glass-like particle distribution guarantees that the initial particle load is essentially free of unwanted power above shot noise frequency. The high-frequency components of the Gaussian random field perturbations can then faithfully be imposed on the zoom region. The initial conditions are generated at .
2.3.2 Selected haloes
We simulate two sets of haloes, a sample of ten haloes selected from the EAGLE Recal-L025N0752 simulation, and a sample of ten “group-sized”, super- haloes from the Ref-L100N1504 simulation. The galaxy haloes are referred to as Gal001-Gal010 and the group haloes are referred to as Grp000-Grp009 in Table 1. We run at three resolutions, which we will refer using the nomenclature M[log()], where is the initial mass of SPH particles.
| Namea | Resolutionb | log () | () | () | (pc) | log () | SFRc () | ||
|---|---|---|---|---|---|---|---|---|---|
| Gal001 | M5.3 | 12.07 | 2.22e+05 | 1.19e+06 | 350 | 10.27 | 1.426 | 0.503 | 0.0 |
| Gal002 | M5.3 | 12.25 | 2.28e+05 | 1.22e+06 | 350 | 10.26 | 1.275 | 0.503 | 0.0 |
| Gal003 | M5.3 | 12.11 | 2.32e+05 | 1.24e+06 | 350 | 10.25 | 1.717 | 0.503 | 0.0 |
| Gal004 | M5.3 | 11.99 | 2.26e+05 | 1.21e+06 | 350 | 10.08 | 0.881 | 0.503 | 0.0 |
| Gal005 | M5.3 | 12.17 | 2.20e+05 | 1.18e+06 | 350 | 10.40 | 2.919 | 0.503 | 0.0 |
| Gal006 | M5.3 | 11.91 | 2.22e+05 | 1.19e+06 | 350 | 10.08 | 1.021 | 0.503 | 0.0 |
| Gal007 | M5.3 | 11.82 | 2.17e+05 | 1.16e+06 | 350 | 9.93 | 1.695 | 0.503 | 0.0 |
| Gal008 | M5.3 | 11.85 | 2.27e+05 | 1.22e+06 | 350 | 9.95 | 1.030 | 0.503 | 0.0 |
| Gal009 | M5.3 | 11.85 | 2.27e+05 | 1.22e+06 | 350 | 9.94 | 1.117 | 0.503 | 0.0 |
| Gal010 | M5.3 | 12.67 | 2.21e+05 | 1.19e+06 | 350 | 10.67 | 0.183 | 0.503 | 0.0 |
| Grp000 | M5.3 | 12.74 | 2.27e+05 | 1.22e+06 | 350 | 10.70 | 0.130 | 0.282 | 0.0 |
| Grp001 | M5.3 | 12.75 | 2.01e+05 | 1.08e+06 | 350 | 10.65 | 3.036 | 0.282 | 0.205 |
| Grp002 | M5.3 | 12.77 | 2.41e+05 | 1.29e+06 | 350 | 10.79 | 2.065 | 0.282 | 0.0 |
| Grp003 | M5.3 | 12.73 | 2.38e+05 | 1.28e+06 | 350 | 10.76 | 2.113 | 0.282 | 0.0 |
| Grp004 | M5.3 | 12.89 | 2.38e+05 | 1.28e+06 | 350 | 10.74 | 0.373 | 0.282 | 0.0 |
| Grp005 | M5.3 | 12.98 | 2.34e+05 | 1.25e+06 | 350 | 10.75 | 0.021 | 0.282 | 0.149 |
| Grp006 | M5.3 | 13.01 | 2.22e+05 | 1.19e+06 | 350 | 10.57 | 0.017 | 0.282 | 0.0 |
| Grp007 | M5.3 | 12.88 | 2.38e+05 | 1.28e+06 | 350 | 10.60 | 5.574 | 0.503 | 0.0 |
| Grp008 | M5.3 | 13.19 | 2.31e+05 | 1.24e+06 | 350 | 10.95 | 0.063 | 0.282 | 0.205 |
| Grp009 | M5.3 | 13.19 | 2.31e+05 | 1.24e+06 | 350 | 10.90 | 1.188 | 0.282 | 0.0 |
a “Gal” indicates haloes, “Grp” indicates group-sized haloes.
b M[log10()]
c At
d SPH and DM1 particle masses vary slightly between different zoom initial conditions.
e is the redshift when the NEQ ionization and cooling are turned on.
f is the redshift to which the NEQ simulations are run.
M5.3 Zooms: We simulate all haloes at our fiducial resolution, corresponding to an SPH particle mass resolution of , and a dark matter (DM) particle mass of . The Plummer-equivalent softening length is 350 proper pc below , and 1.33 comoving kpc above , which corresponds to 1/25th of the mean interparticle separation. This is the same resolution as achieved by the L025N0752 simulation. We can cross-reference the zoom M5.3 galaxies with the same galaxies in the L025N0752 galaxies, which we do in Appendix B to ensure that the zooms do not differ substantially from their parent cosmological volume. We also cross-reference the group zooms, although note that these zooms have () higher mass (spatial) resolution than the L100N1504 simulation. All M5.3 haloes have NEQ runs between the redshift and as explained in §2.3.4, and each has also been run using equilibrium cooling to .
M4.4 Zooms: We simulate the L025N0752 haloes at higher resolution, corresponding to (), and a softening length of 175 proper pc below , and 655 comoving pc at earlier times. All of these are run in equilibrium, and a selection in non-equilibrium. We only use these zooms to test resolution convergence in Appendix B and they are listed there in Table 2. These zooms confirm the main CGM results reported throughout; however their stellar masses are significantly lower, which is why we only use them for resolution convergence tests.
M6.2 Zooms: We simulate a selection of haloes at the resolution of the L100N1504 box, and , and also compare directly to the same galaxies in the 100 Mpc box, which allows us to link our results to the global IGM results of Rahmati et al. (2015b), who use this box as their fiducial simulation.
Each zoom is focused on one halo, but surrounding simulated regions often contain additional haloes that are either partially or fully sampled by SPH and high-resolution DM1 particles. We find a set of “bonus” haloes that we verified to be completely resolved with SPH and DM1 particles out to three times the virial radius (), and add these to our sample. Bonus haloes at our main redshift () include three sub- galaxies () found at a distance greater than of the targeted haloes, two low-mass haloes () and two haloes () found beyond of targeted group haloes, and three bonus haloes () in the Gal010 zoom, which itself is by far the most massive “Galaxy” zoom, and tracks the formation of a halo.
2.3.3 Running in equilibrium
We evolve all zooms using the equilibrium cooling rates from (2009a) to using the standard EAGLE code with the only difference being that we do not use kernel-smoothed metallicities to compute cooling rates. As explained by (2009b), smoothed metallicities are consistent with the smoothed particle hydrodynamic formalism; however, their use when adopting NEQ cooling requires that both particle and smoothed ion abundances are tracked, which for 136 species is a prohibitive memory requirement. Furthermore, smoothing complicates the interpretation of NEQ ionization effects when ion species are averaged over the SPH kernel. Therefore, to enable a consistent comparison of methods, we use particle metallicities in both equilibrium and NEQ runs.
As a consistency test, we run a set of five M5.3 zoom runs with smoothed metallicities, finding that they have dex higher stellar masses than their non-smoothed M5.3 zoom counterparts. It appears that smoothed metallicities increase the SF efficiencies by distributing metals over more particles, increasing the overall cooling rate of the galaxy, and leading to more star formation. (2009b) also showed that in the OWLS simulations, smoothed metallicities increased the SF efficiency. We show in Appendix B that O vi column densities are unaffected by metal smoothing.
2.3.4 Running in non-equilibrium
When examining NEQ simulations, we activate the NEQ module at relatively low redshift in order to minimize the computational cost of following 136 ionic species. The magnitude of non-equilibrium effects can be significant in shocks and rapidly cooling gas, and this behaviour is only captured with use of the NEQ module. This module is important to use, in order to recover the correct ion species in all circumstances. It should be noted that we will show that the NEQ effects are generally not important for gas dynamics in a separate study, as predicted by OS13 and also demonstrated by Richings & Schaye (2015). Furthermore, NEQ effects on CGM ion diagnostics (i.e. observables) persist for short times compared to the Hubble timescale, enabling us to begin modelling them only at late times. We discuss the NEQ effects in Appendix A, which are typically small, dex for oxygen ions.
The haloes all switch to NEQ cooling at and the group haloes at . The later NEQ activation for group haloes was adopted to save computational cost. The NEQ runs begin from a snapshot output of the equilibrium run, where we iterate CVODE for a long timescale ([] yrs) for all species to guarantee ionization equilibrium. The EAGLE code then runs as normal with the (2009a) cooling replaced by the NEQ module iterating the ionization states and cooling rates via CVODE across the hydrodynamics timestep.
For one group zoom (Grp007) we perform two runs, and in order to establish that its properties are not significantly altered at , since this is the highest redshift we use to compare to COS-Halos results. We use up to six outputs () when confronting COS-Halos measurements to give a greater range of galaxy properties as discussed further in §4. Every halo is run past , with every M5.3 halo run to and 7 out of 10 M5.3 group haloes run to .
2.3.5 Basic galaxy properties
We plot stellar mass and SFR properties of central galaxies in our haloes in Figure 1 using M5.3 zooms. We run the SUBFIND algorithm (Springel et al., 2001; Dolag et al., 2009) on our zoom outputs, and quantify halo mass, , as the mass within a sphere with mean enclosed density the critical overdensity centred on the galaxy’s potential minimum. Galaxy stellar masses () and star formation rates (SFRs) are calculated by summing the appropriate quantities within a 30 physical kpc sphere around the centre of the central subhalo, which almost always hosts the most massive galaxy. The top left panel of Fig. 1 plots the abundance matching relation, where , for central galaxies from the six redshifts we examine. While our M5.3 haloes follow the shape of the relationship recovered by Behroozi et al. (2013) and Moster et al. (2013) at , they are dex lower for . As discussed earlier, our use of particle metallicities reduces stellar masses by 0.1 dex compared with the smoothed metallicity simulations used to calibrate the feedback efficiencies. Moreover, S15 also find stellar masses 0.2-0.3 dex lower than the abundance matching constraints (Behroozi et al., 2013; Moster et al., 2013) at at (Recal-L025N0752 shown as a thick yellow line with shading for 1- dispersion).
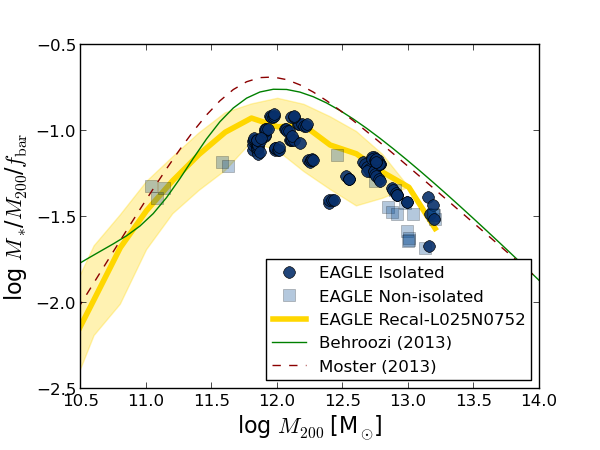
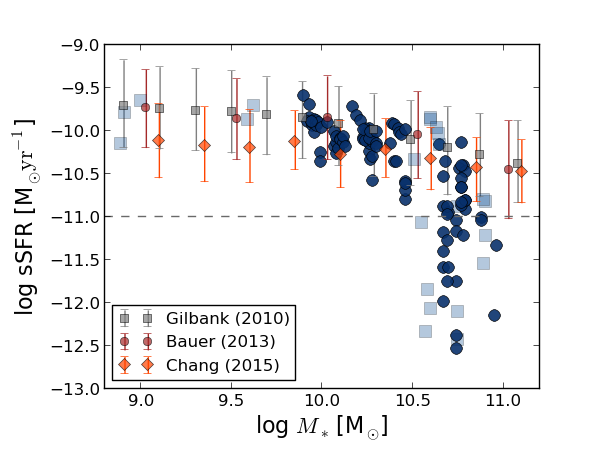
For each central galaxy at a given redshift, we test whether it would be classified as isolated using criteria similar to those applied by Tumlinson et al. (2013), who select COS-Halos galaxies as being the most luminous galaxy within kpc of the QSO sightline at its redshift. They also note that there are usually no photo- candidates within 1 Mpc. We use the criterion that there should not be any galaxies with within an impact parameter kpc, firstly to ensure that our galaxy is the most massive system inside this impact parameter, and secondly because we usually do not simulate surrounding galaxies beyond . Often there are surrounding haloes that are not resolved completely by the high-resolution particle load; however we still use their stellar masses in our isolation criteria to be conservative, although there are only a few cases for which this happens. Dark circles in Fig. 1 indicate haloes that appear isolated in at least one of the three projections we use to cast our sight lines and can be used for comparison with the COS-Halos dataset (see §4). Transparent squares are for non-isolated haloes in all three projections, as well as for bonus haloes with , where we only plot their outputs at . We include these low-mass haloes for our discussion of halo mass trends in §3.1, but not for comparisons to the COS-Halos dataset in §4.
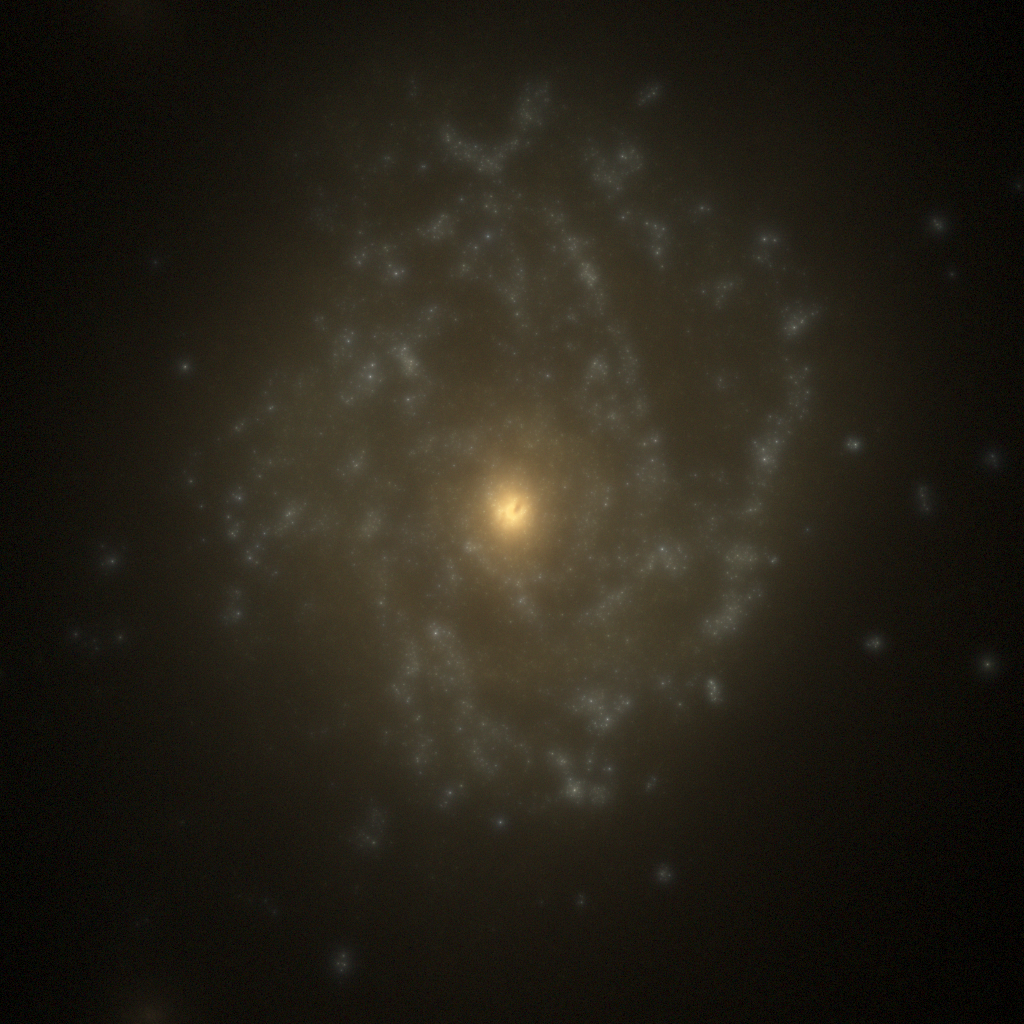
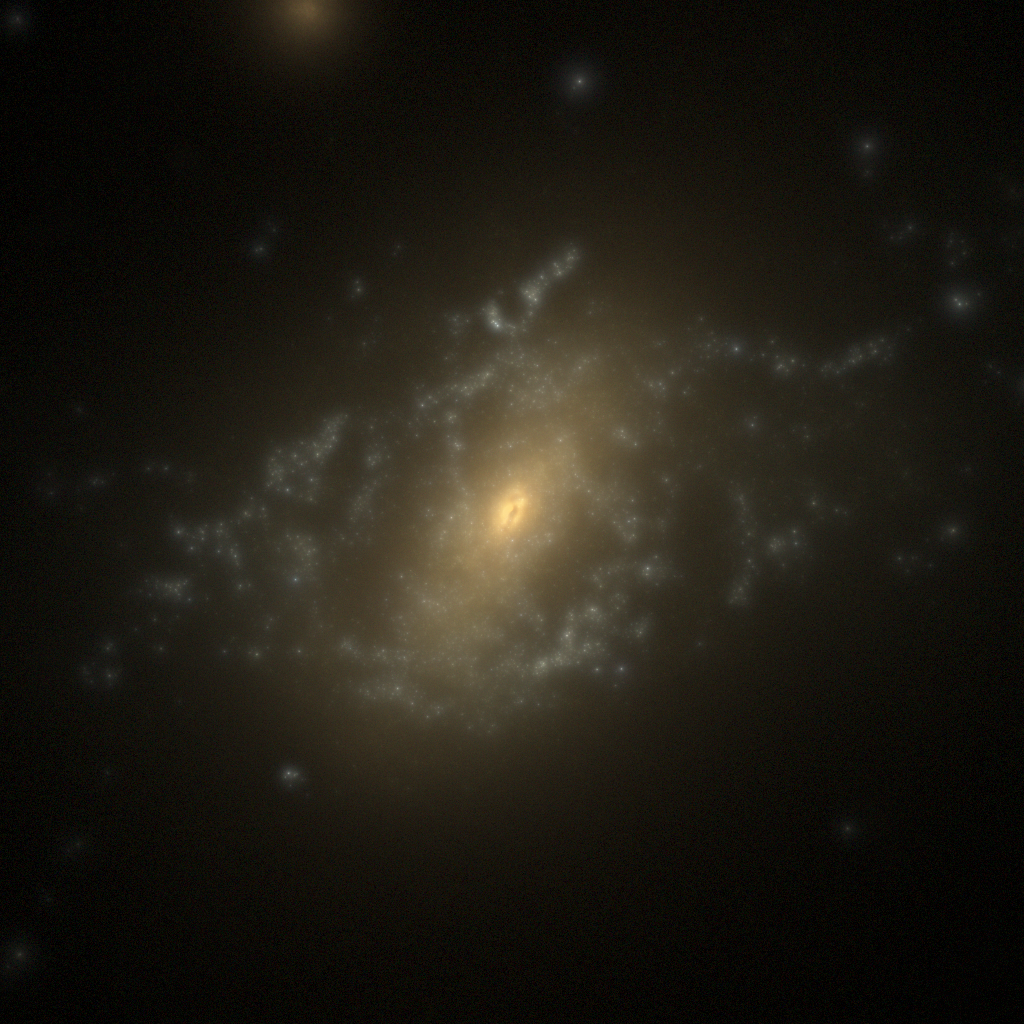
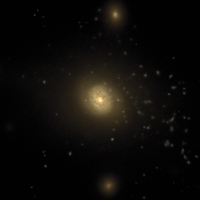
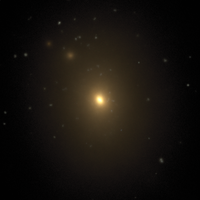
We plot the galaxies on the -sSFR plot in the top right panel of Fig. 1 to show that our galaxies follow the general trend of the star-forming sequence observed at low- by Gilbank et al. (2010), Bauer et al. (2013), and Chang et al. (2015), and a set of massive galaxies in group haloes with low sSFR. Our galaxies do not have a passive clump at sSFR yr-1 that is as prominent as for the COS-Halos survey, but the EAGLE boxes do reproduce the passive fraction as a function of (S15). Additionally, when we mock COS-Halos surveys in §4, the galaxies we select to match the COS-Halos galaxies better reproduce this passive clump. The bottom row of Fig. 1 shows 50 kpc, SDSS , , and -band composite maps of two star-forming galaxies (left), and two group centrals, including an active merger and a passive galaxy (right). These maps are generated using the SKIRT radiative transfer code (Baes et al., 2011; Camps & Baes, 2015) as described in detail by Trayford et al. (in prep.).
3 Physical properties of the oxygen-enriched circumgalactic medium
This section begins by exploring CGM properties across two decades in halo mass, from sub- haloes () through haloes () to group-sized, super- haloes (). We further explore the physical trends that establish the ionization structure of the oxygen enriched CGM. Lastly, we focus on the nature and origin of the O vi that is observed by the COS-Halos survey. Throughout we use M5.3 zooms.
3.1 Trends with halo mass
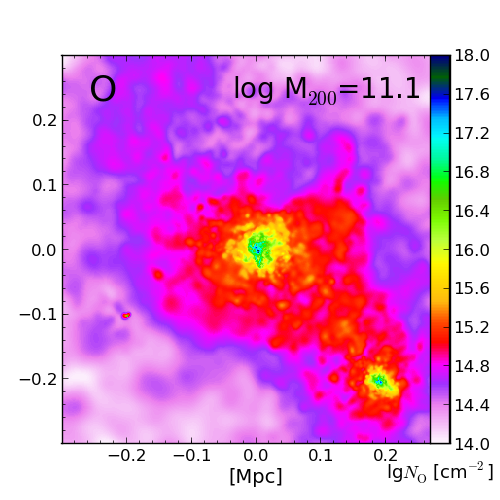
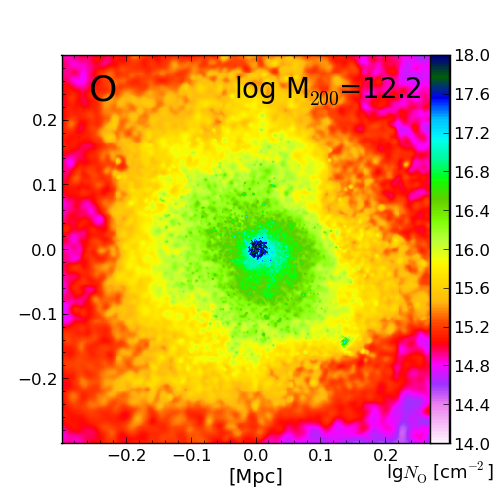
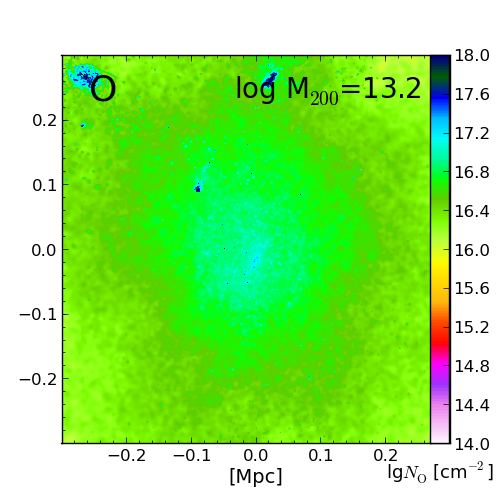
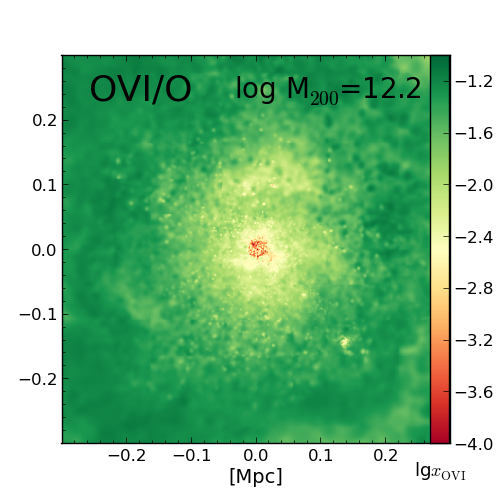
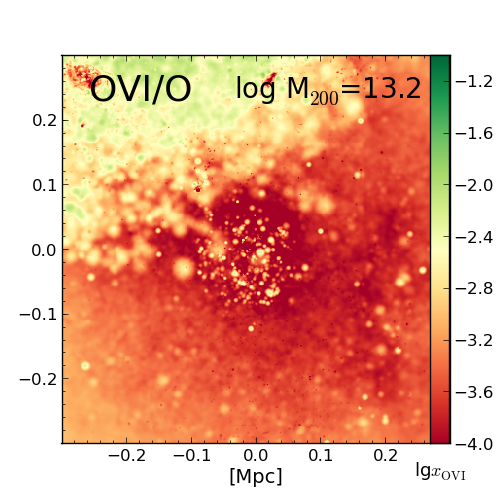
We begin our discussion by showing three haloes with masses , , and in Figure 2 at the median redshift of the COS-Halos, . All images are 600 physical kpc across. The central galaxies have , , and , and typical SFRs for their masses.
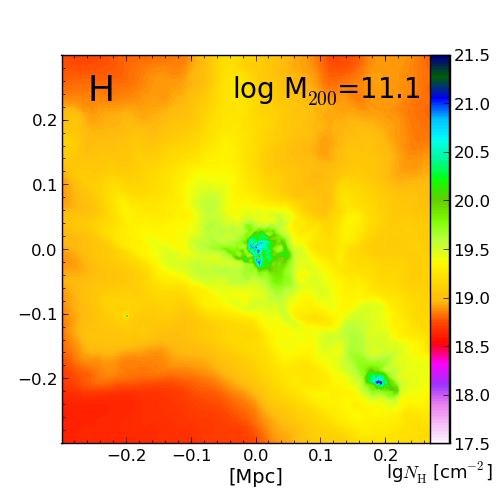
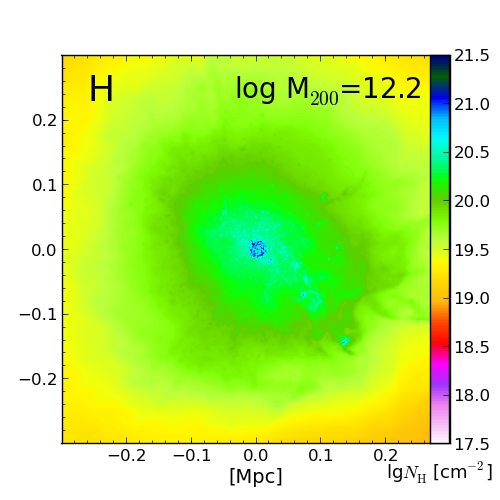
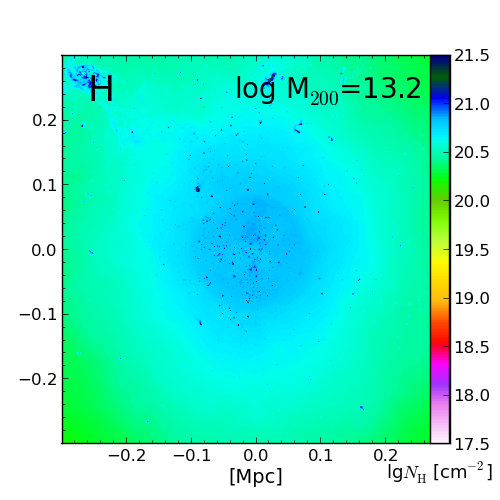
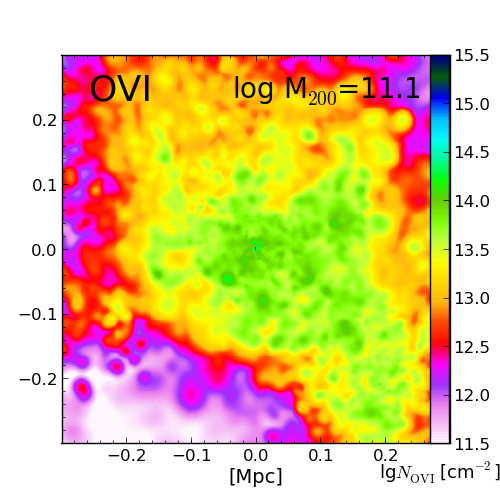
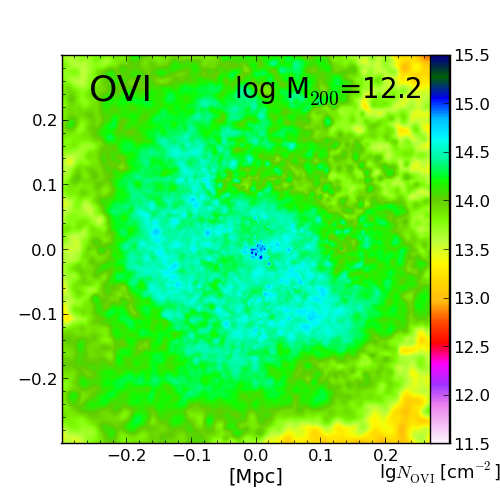
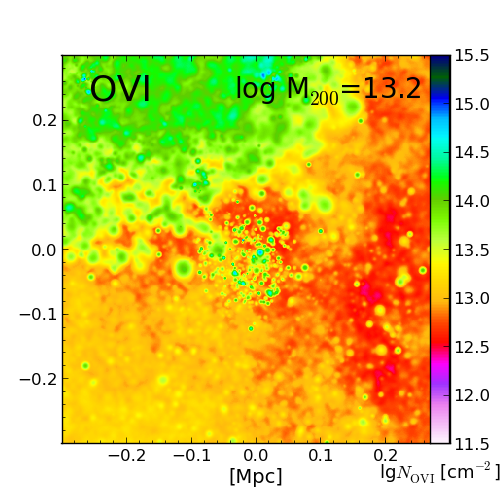
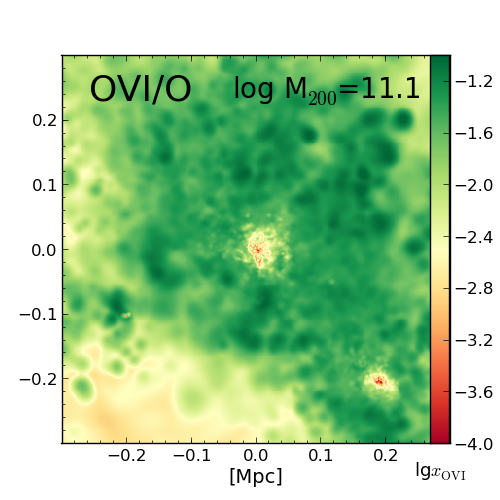
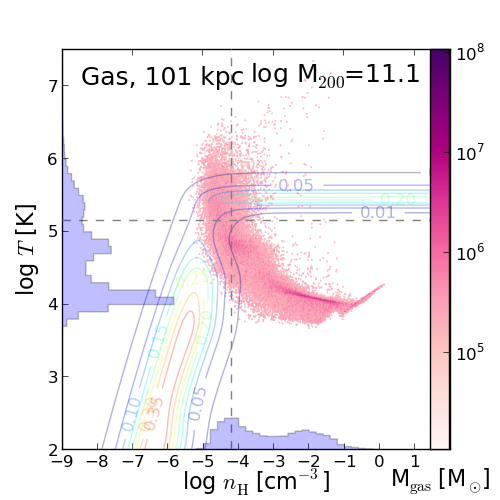
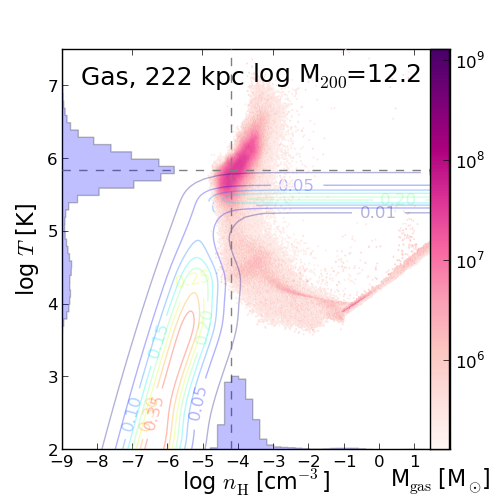
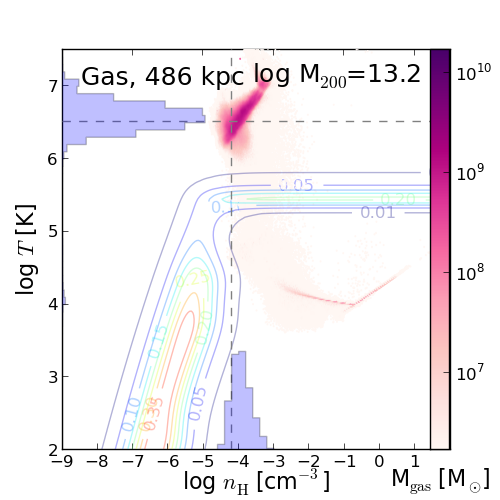
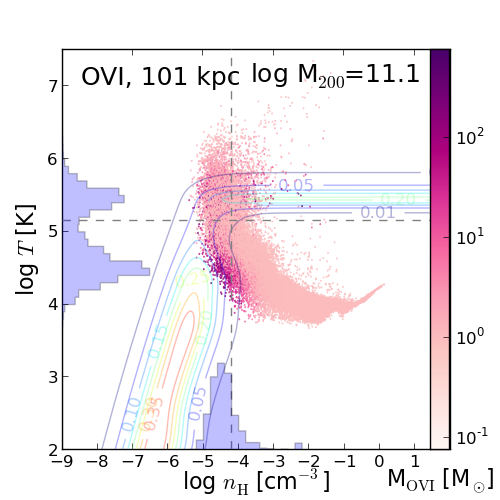
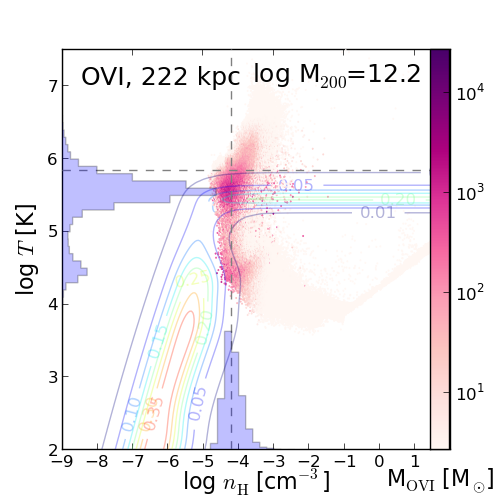
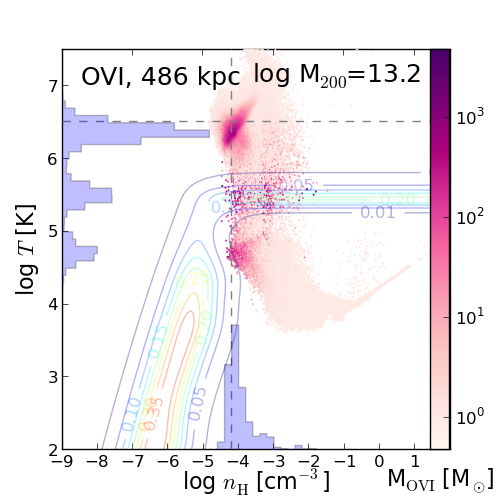
We show hydrogen column densities in the top row with halo mass increasing from left-to-right. We plot the diagnostic diagrams of all gas inside of in Figure 3 (top row), and see that the temperature histograms peak at , , and K. We argue in §5 that the typical temperature of halo gas roughly follows that given by an isothermal, single-phase virialized halo,
| (1) |
using the virial theorem. Using Equ. 1, we recover , , and K (indicated by dashed grey horizontal lines in Fig. 3). For the sub- halo, the owes to efficient cooling through the peak of the cooling curve to thermal equilibrium at K, although there does exist a tertiary peak near . The more massive haloes have peak temperatures more similar to .
The virial radius across these haloes increases by nearly a factor of five from 101 to 486 kpc, meaning that the adoption of a constant radius for the CGM, often assumed to be 300 kpc (e.g. Rudie et al., 2012; Ford et al., 2013), samples only the inner region of a group halo, but includes the diffuse IGM for a sub- halo. It is important to remember that the ratio of the impact parameter to the virial radius varies significantly across a survey such as COS-Halos (Shull, 2014).
The second row of Fig. 2 shows that oxygen columns increase with halo mass, and our overall sample indicates that there is an increase of with at all impact parameters, except at kpc where galaxies have higher oxygen columns than groups. The mass of gaseous oxygen within a 300 kpc sphere increases by a factor of 40 as increases by a factor of 100, with the greatest increase occurring from sub- to (), while galaxies have the highest metallicities within 300 kpc (, , ; excluding star-forming gas does little to change these values).
The third row of Fig. 2 shows the column densities of O vi. It is striking that the galaxies have by far the greatest O vi column density even though they do not have the highest gas and oxygen masses. The mass of O vi within a 300 kpc sphere increases by a factor of 9 from sub- to , but declines by a factor of 90 from the to the group halo.
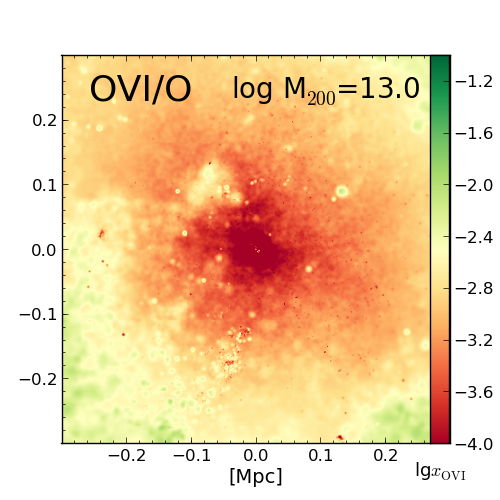
The bottom row divides the O vi map by the oxygen map to show the “ionization fraction,” which severely declines for the group halo. The global O vi fraction within a 300 kpc sphere falls from to from sub- to , and to for the group halo. O vi is merely the tip of the iceberg of the oxygen content in the CGM of star-forming galaxies. Meanwhile, the oxygen in group-sized haloes essentially disappears in the “O vi filter”. The higher O vi fractions on the top left of the group halo (bottom right panel) owes to a lower mass, foreground halo with higher CGM O vi.
The diagrams of gas inside in Fig. 3 clearly highlight the cause of this effect: groups exhibit virtually no gas below K (upper right panel). Regions with gas overlapped by O vi ionization fraction contours indicate where O vi can exist in significant quantities, and the O vi-traced gas is shown in the bottom panels. The triple-peak temperature histogram of the O vi distribution in the group (y-axis histogram, bottom right panel) is common among our group haloes: metals at K and K are abundant due to longer cooling times but have , while a small number of particles are rapidly cooling through the coronal regime ( K) and briefly achieve . In contrast, halo virial temperatures, K, overlap with the collisionally ionized O vi band at K (bottom centre panel).
The sub- CGM with gas between K overlaps the photo-ionized O vi contours, which appear in gas K at lower densities (e.g. Shull et al., 2012). O vi peaks at a lower density () in the photo-ionized regions of the sub- halo than in the collisionally ionized regions of the halo (). (2009) showed that most O vi absorbers are photo-ionized using other SPH simulations, because the (2001) background is strong enough to photo-ionize IGM oxygen, which dominates the O vi absorbers found along intervening sight lines. The higher densities combined with hotter gas means that collisionally ionized O vi traces CGM gas.
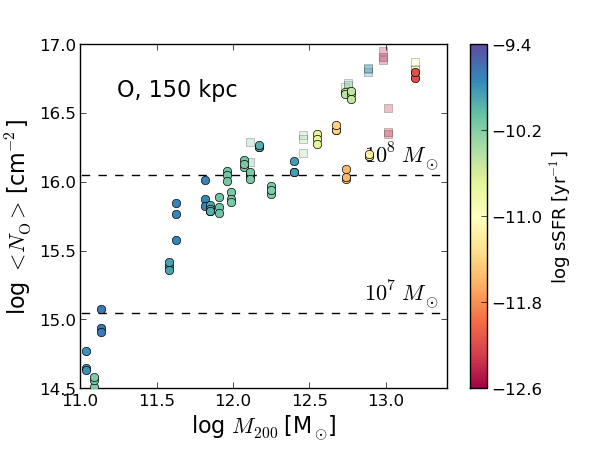
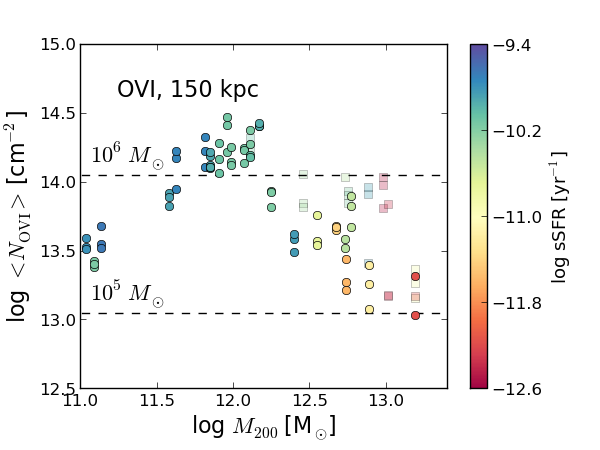
haloes also have higher (Fig. 2). To demonstrate that this is a broad trend across all of our haloes, we plot 150 kpc “aperture” columns for oxygen (left) and O vi (right) in Figure 4 for all galaxies, where we calculate the aperture column within a cylinder of radius kpc by summing up pixel column densities, , as plotted in Fig. 2 according to
| (2) |
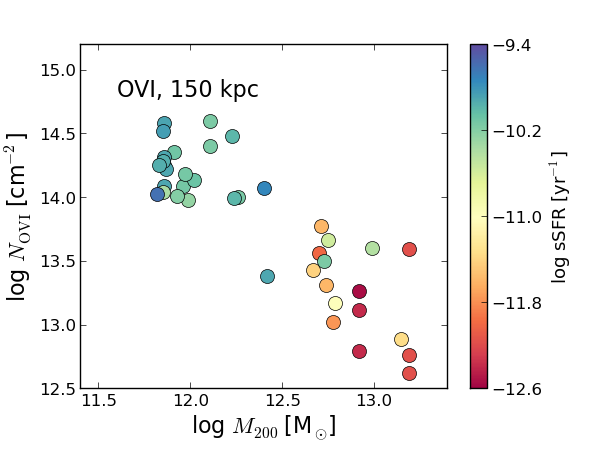
where is the pixel size such that . We take aperture columns for each halo in three projections (along the , , & axis), and show isolated haloes as solid circles and non-isolated counterparts as transparent squares. increases monotonically across our halo mass range, while peaks for galaxies and then declines sharply for . The average for the range () is corresponding to an integrated O vi mass of within a cylinder of radius 150 kpc. The corresponding values for groups () are and , or five times lower. We use only isolated galaxies in these calculations, but by including non-isolated projections, the in group-sized haloes rises to , while that of haloes does not change. equals for haloes and for group haloes using isolated samples.
3.2 Circumgalactic radial profiles
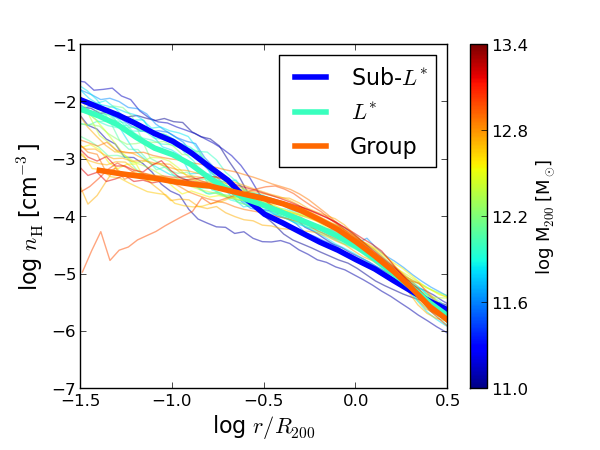
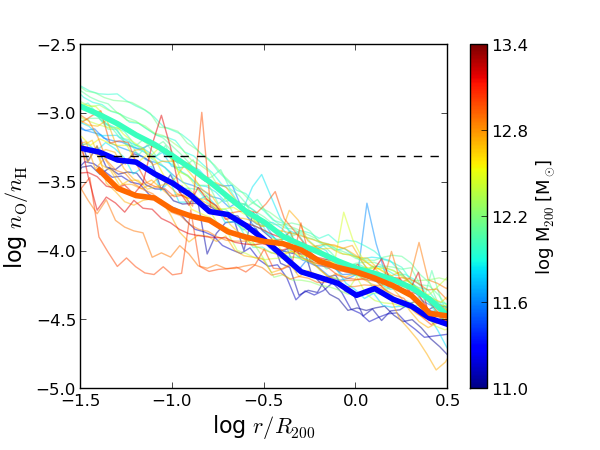
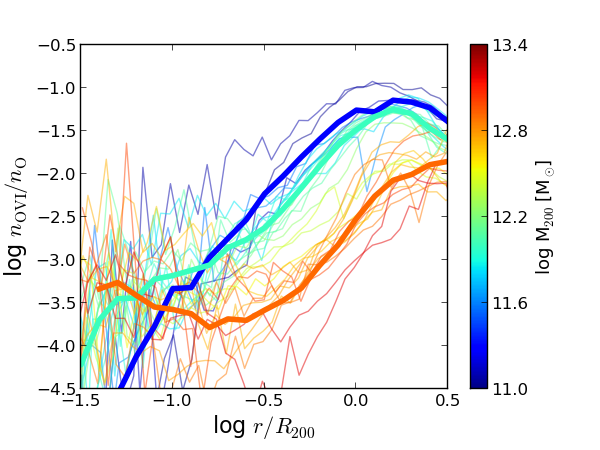
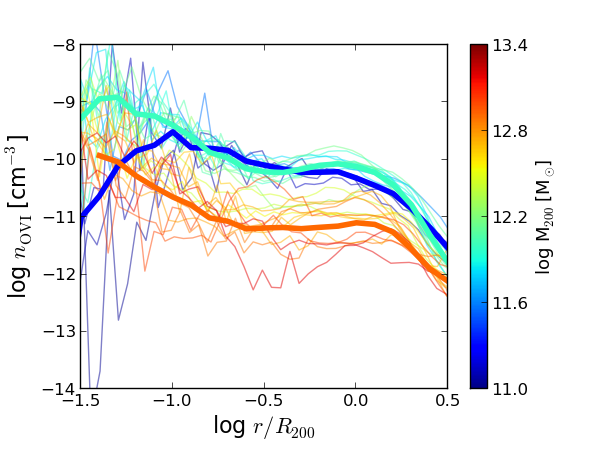
To better understand the halo trends of the CGM distributions with mass, we show in Figure 5 physical gas properties as a function of fractional virial radius at . The top left panel shows including all gas (CGM+ISM) as a function of . We use thick lines to indicate the mean profiles for sub- (, blue), (, aquamarine), and group-sized (, orange) haloes. Sub- galaxies achieve the highest inner densities and the lowest outer densities, while for groups the inner radial profiles () are nearly flat. ISM gas, defined as gas having SFR, is not included in these plots, so there is more dense CGM gas around the lower mass galaxies that have higher sSFR. However, the density of extended “coronal” gas () is higher for group haloes, owing to inefficient cooling at K enabling them to retain higher pressure gas. All haloes are centred on the minimum of the gravitational potential, although one halo is undergoing a major merger, causing the density to dive inside and neither galaxy coincides precisely with the potential minimum.
The gas metallicities in the top right panel are highest for haloes in the centre, lower for sub- throughout the entire halo, and lower for group haloes in the inner regions. The curves for individual haloes are noisier in this plot compared to the density plot, because satellite galaxies influence radial metallicities more than radial densities; groups have the greatest number of satellites and thus more peaks overall. The bottom left panel showing the radial O vi fraction () shows as strong of a trend of any of the panels in Fig. 5. The peak in moves to larger fractional radius and declines with increasing halo mass. The sub- galaxies achieve as high as 10% at , because the lower pressures allow oxygen at photo-ionized O vi temperatures, and therefore greater O vi fractions (, 2009). The haloes have little scatter in , only reach at , and peak just beyond . This is almost all collisionally ionized O vi, and the maximal radial is , with only a fraction of oxygen residing around K. At , essentially nosedives, owing to hotter temperatures. Collisionally ionized O vi does exist at K in group haloes, but the higher pressures mean higher densities, leading to faster cooling times through this temperature regime.
The product of the first three panels, , is plotted in the bottom right panel of Fig. 5. The highest O vi densities are associated with galaxies, with peaking just inside . The O vi mass as a function of radius peaks outside , since although the density is lower, the volume increases as .
3.3 Nature and origin of circumgalactic oxygen
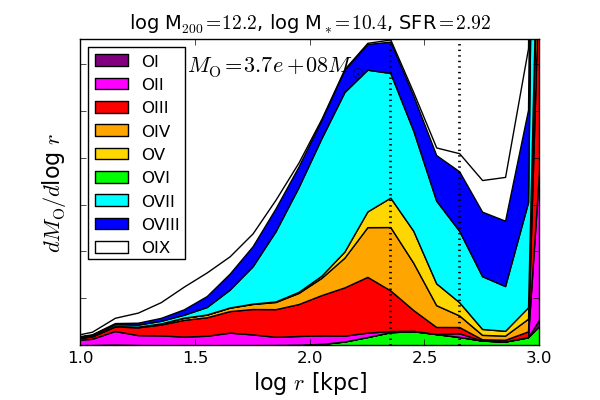
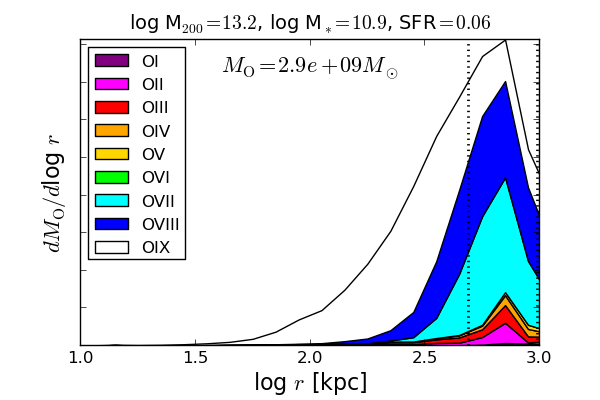
Thus far we have focused on the trends of oxygen and O vi with halo mass, and we now shift our focus to the distribution and origin of oxygen-enriched gas in the circumgalactic medium. We plot the oxygen content as a function of radius for our standard haloes in the top left panel of Figure 6. Green shading on the bottom shows the O vi fraction of the oxygen budget peaking between one and two , which are represented by vertical dotted lines. It is notable that there are five oxygen ions with greater contributions than O vi, and that O vi is one of the most spatially extended ions. This is the general result for haloes, O vi resides primarily beyond or at kpc. This suggests that a significant fraction of the O vi detected by COS-Halos at kpc likely arises at physical radii larger than .
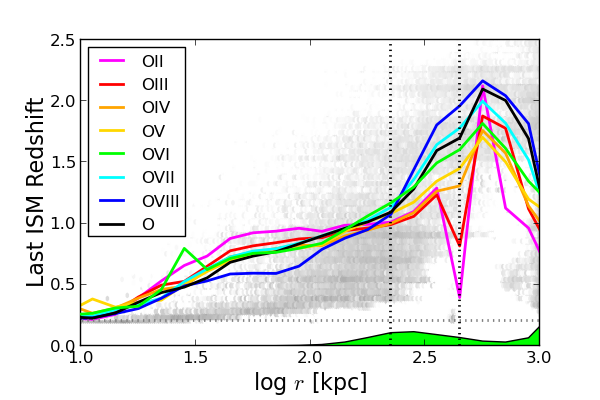
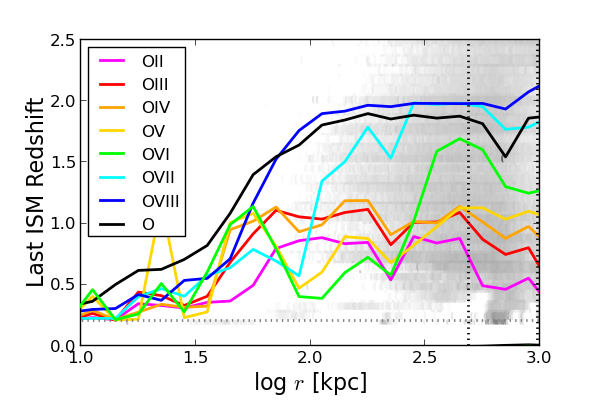
In the bottom left panel of Figure 6, we show the “age” of the CGM, by plotting the last time a CGM particle was in the ISM of a galaxy, which is defined as the last time the gas particle was star-forming (either in the central galaxy or a satellite). The vast majority of metals in the CGM were previously in the ISM and launched by superwind feedback into the CGM as found in other SPH simulations (Crain et al., 2013; Ford et al., 2014). The grey shading shows the oxygen-weighted age distribution as a function of radii, showing an age-radius anti-correlation, where larger radii and lower overdensities are enriched by higher redshift progenitors when halo potentials are lower and comoving distances are physically smaller (, 2007; Wiersma et al., 2010; Oppenheimer et al., 2012; Crain et al., 2013; Ford et al., 2014). O vi has a mean enrichment redshift of at 300 kpc. Our simulations suggest that the average age of O vi is Gyr, and it is thus not associated with the on-going SF traced by observational indicators, which probe galactic star formation on a much more recent timescale, i.e. Myr.
In the right panels of Fig. 6, we plot the relative oxygen content and age distribution around our largest group. The O vi is hardly visible on this linear plot, peaking at nearly . This group halo is dominated by ions that are only observable in the X-ray, with O ix dominating within . By plotting the oxygen distributions on a physical rather than fractional virial scale, we emphasize the stark contrast between the linear distributions of oxygen between and group haloes within 1 Mpc. The progenitors of this central passive galaxy have injected most of their metals at where they now reside at larger radii relative to the haloes, both in terms of physical distance and fractional virial distance.
4 Comparison to COS-Halos data
We confront the COS-Halos observational survey using our new python module called Simulation Mocker Of Hubble Absorption-Line Observational Surveys (SMOHALOS). We use SMOHALOS to create mock COS-Halos surveys using observed impact parameters for galaxies with similar properties as observed by COS-Halos, which in this case are defined by and sSFR. This enables us to take the latest dataset from COS-Halos with updated spectroscopic galaxy observations (e.g. Werk et al., 2012), and make a mock survey with matched properties.
We do not constrain our mock galaxies to have the same redshifts as COS-Halos (). Instead, we select the M5.3 simulated galaxy with the most similar and sSFR that are closest to the observed values from as many as 6 output redshifts () for which we have run our NEQ zooms for a sufficient time ( Myr). Our galaxies evolve little over this redshift, except for the cases where there are mergers. We find that the O vi does not evolve significantly over this redshift range either, which we discuss later. The main rationale for this choice is to obtain more passive galaxies that satisfy the isolation criteria, because neighbours are either beyond 300 kpc at earlier snapshots, or, more often, merge into a single galaxy to satisfy the isolation criteria at later snapshots. Also, we did not output snapshots between . Figure 1 shows galaxies that are isolated in one of three projections as solid circles. We have in total 123 and group galaxies across six redshifts and 20 zoom simulations, 87 of which are isolated in all 3 projections, and 108 of which are isolated in at least one projection. One group halo is not isolated in any projection (Grp005).
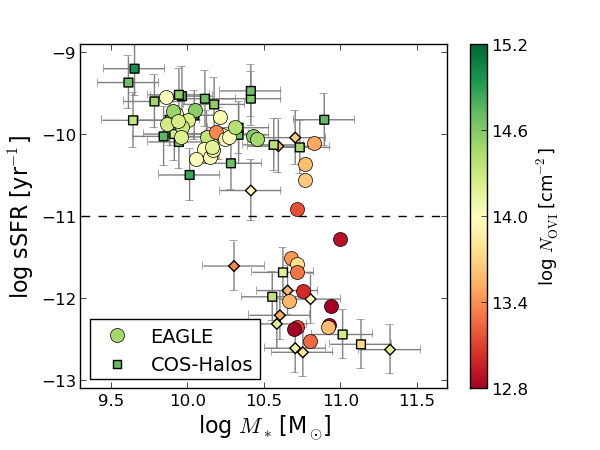
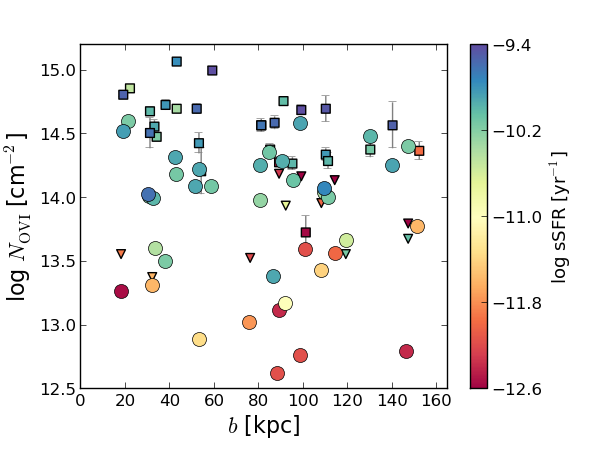
We use the T11 list of COS-Halos galaxies, omitting the two least massive galaxies along each of the J0042-1037, J0820+2334, and J0943+0531 sight lines (), since we do not explicitly simulate such masses, which leaves 39 galaxies in the COS-Halos sample. Stellar masses assume a (2003) IMF, which decreases the stellar masses reported by Werk et al. (2012) by 0.2 dex, who assumed a (1955) IMF.
We take one-sigma errors on and sSFR, where we assume dex and use the Balmer-derived SFR and error from Werk et al. (2012) to calculate the total error on the sSFR, which are added in quadrature to the error on resulting in sSFR dex. SMOHALOS applies a Gaussian dispersion seeded by a random number to the values of the simulated galaxies for the given impact parameter. We choose the simulated galaxy closest on the -sSFR plane to the observed galaxy given the errors. We run 100 such realizations of SMOHALOS to construct 100 simulated COS-Halos galaxy samples using different random number seeds.
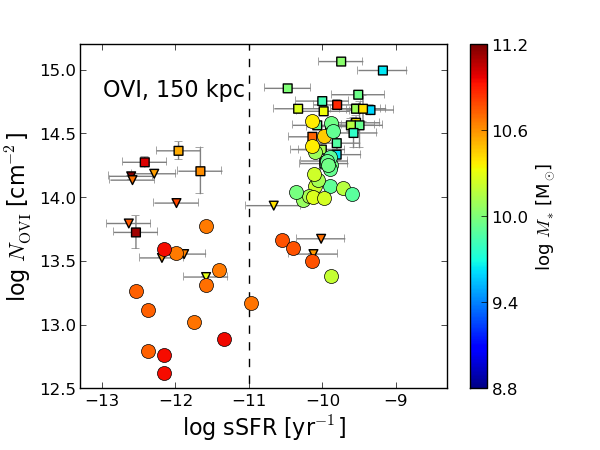
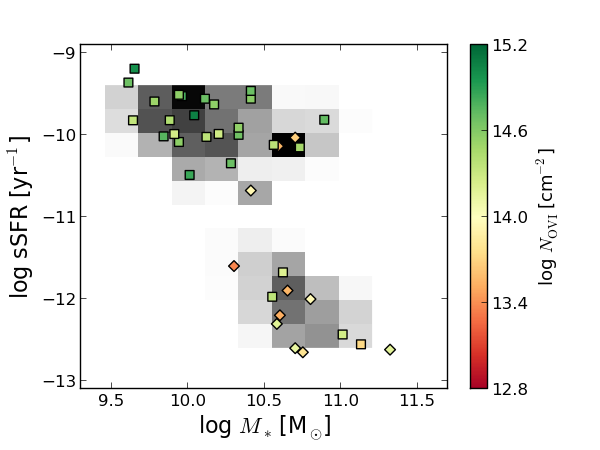
Figure 7, top left, shows a typical SMOHALOS mock sample, plotted as circles, on the -sSFR plane, with the COS-Halos galaxies plotted as squares for galaxies with O vi detections and diamonds for galaxies with O vi upper limits. Error bars indicate uncertainties on observations. The galaxies are colour-coded by their O vi columns in both cases. It is immediately apparent that while our galaxies generally reproduce the star-forming and passive distributions seen by COS-Halos, we do not always obtain the same range of properties. For example, we do not create galaxies with , whereas three of these exist in COS-Halos.
The top right panel shows O vi column density as a function of sSFR, coloured by , and the bottom left panel shows O vi columns as a function of impact parameter, coloured by sSFR (COS-Halos detections are squares and triangles pointing down are upper limits). The COS-Halos trend of O vi columns increasing with sSFR is reproduced. However, our mock O vi columns are too low compared to those inferred from COS-Halos, both as a function of sSFR and impact parameter.
We plot the SMOHALOS O vi columns against halo mass in the bottom right panel of Fig. 7 to show that O vi correlates strongly with , even more so than with the central galaxy sSFR (top right panel). This plot nearly mirrors the trend of the 150 kpc aperture columns in Fig. 4, in part because there is not much dependence of on impact parameter. However, there is greater scatter when choosing pencil beams corresponding to individual sight lines rather than taking an averaged aperture column. The colour-coding of symbols in both plots indicates that the scatter in group sSFR primarily contributes to the reduced correlation in the sSFR relation relative to that in the relation. We suggest that the trend of with sSFR found by COS-Halos is driven by halo mass rather than star formation activity.
We plot the probability distributions of the 100 SMOHALOS runs in the top two panels of Figure 8 as grey shading and superimpose the results of the COS-Halos survey, again as coloured squares and upper limit triangles. The top panel shows that we consistently identify a bimodal set of galaxies in the -sSFR plane. The middle panel shows that the SMOHALOS mock catalogues consistently reproduce the O vi-sSFR correlation, although the column densities are lower than for COS-Halos.
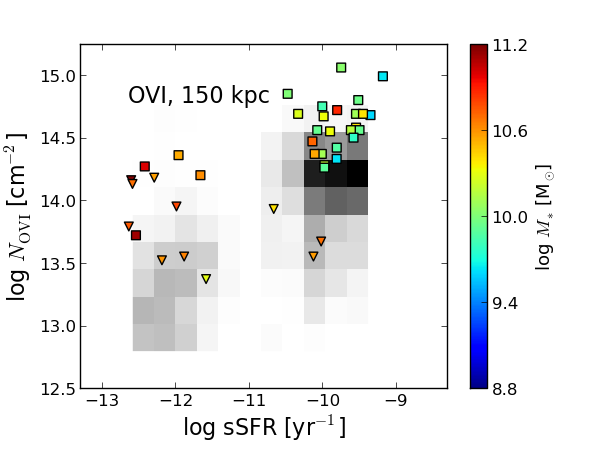
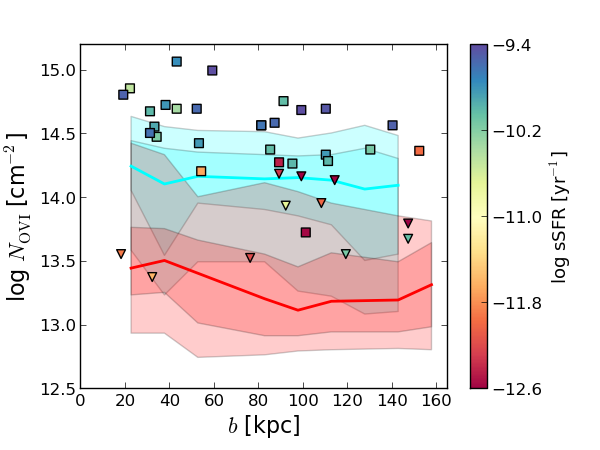
Sub-dividing galaxies into star-forming and passive samples using an sSFR cut of yr-1, SMOHALOS recovers a median log[] for the “blue” sample (27 galaxies) and for the passive “red” sample (12 galaxies). The corresponding COS-Halos numbers are and , respectively, the latter being an upper limit, owing to most passive COS-Halos columns being non-detections. The typical column density of our blue sample is thus a factor of too low, and even if we take the SMOHALOS sample with the strongest median O vi column of the 100 realizations, log[], the column density is too low.
In the bottom panel of Fig. 8, we plot the average SMOHALOS radial O vi column density profiles of the star-forming (cyan) and passive (red) galaxies with shading indicating 1 and 2- dispersions using the 100 SMOHALOS realizations. We rarely reproduce columns in excess of and never over of which there are two detections in COS-Halos. Also apparent is the surprisingly flat dependence of O vi column on impact parameter for both star-forming and passive samples. When we subdivide the blue sample into two impact parameter bins, we find a larger difference in the interior CGM, such that median log[] for COS-Halos and SMOHALOS are 14.70 and 14.14 at 0-75 kpc, and 14.38 and 14.12 at 75-150 kpc, respectively. Our median mass calculation of O vi within 150 kpc is , which is about lower than calculated by T11. We discuss this shortfall of O vi around star-forming galaxies in EAGLE in §6.1.
The interpretation of the comparison to the passive sample of 12 galaxies is more ambiguous owing to the COS-Halos non-detections. The median O vi column density may be consistent between COS-Halos and the SMOHALOS catalogues; however, we never produce O vi columns around passive galaxies in the range of , as high as the three strongest COS-Halos passive detections. We suspect that our SMOHALOS sample may be cleaner of neighbours than COS-Halos sample, because observations can miss surrounding galaxies owing to surface brightness limits. This was for example the case for the J2257+1340 sight line where two smaller star-forming galaxies were subsequently observed closer to a passive galaxy at 114 kpc (Tumlinson et al., 2013). Group galaxies with neighbours have higher aperture column densities, , than for isolated ones, .
5 The oxygen content of galactic haloes
We now consider the total amount of oxygen formed in galaxies, and the phases this metal occupies at . Following Peeples et al. (2014, hereafter P14), we normalize the total mass of oxygen nucleosynthesized and ejected by stars to unity for each of our galaxies, and plot the fraction of oxygen found in stars (red), the ISM (blue), and the CGM (green) in Figure 9. Where P14 plotted a continuous distribution as a function of stellar mass based on observed metal abundances scaled to expected nucleosynthetic yields, we plot bars for our individual galactic haloes and order them by increasing , listed in white at the bottom of each bar. Our mass distribution is not continuous, and the group-sized haloes are selected to have a large scatter in the baryon fractions within .
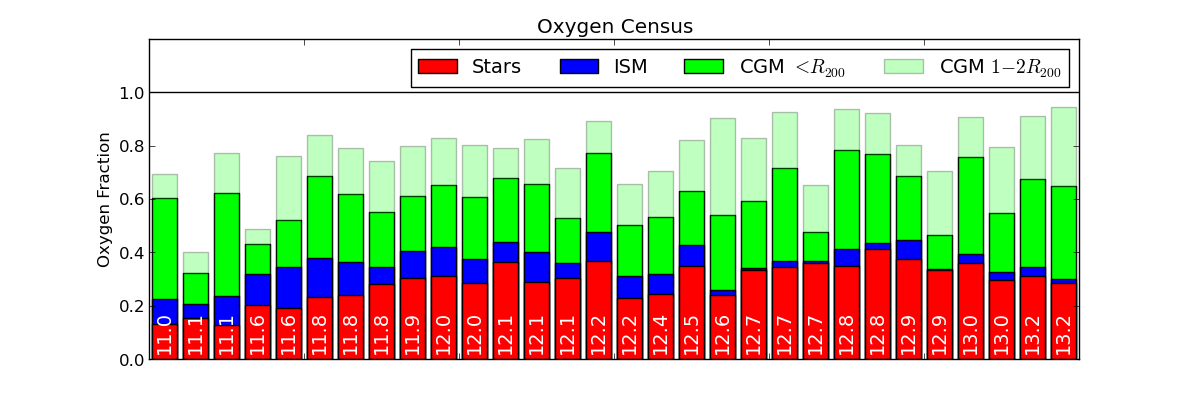
We measure that EAGLE oxygen yields are on average 2.7% of at . Even though EAGLE employs metallicity-dependent yields, this makes negligible difference for the summed oxygen yield. This value is nearly the same as found by P14 who adopted an oxygen yield of 1.5% for the zero-age main sequence and calculated an average multiple of 1.8 to account for the fact that of the stellar mass survives to , based on Leitner (2012) star-formation histories (i.e. ). It is not surprising that these two calculations agree, because we are using similar yields tabulated by (2009b) as P14, and because we are self-consistently following the star-formation histories accounting for stellar evolution222Oxygen that was first released and then trapped in the remnants of another generation is included.
One difference with respect to P14 is that we plot the total oxygen generated by all galaxies residing in the galactic halo, instead of just the central galaxy. This makes a marginal difference for and sub- galaxies, but the difference is quite noticeable for group-sized haloes since the stellar mass becomes less dominated by the group central; less than half the stellar mass resides in the central for haloes of . The ISM oxygen content in the 4 largest haloes is contributed almost entirely by satellites.
The stellar oxygen content (red bars) follows the P14 trend with and group haloes having similar oxygen fractions in stars (their Figure 12), but our sub- galaxies () have marginally higher stellar oxygen content, which is consistent with the EAGLE-Recal simulation (S15) exhibiting slightly higher stellar metallicities content than inferred observationally by Gallazzi et al. (2005). The ISM oxygen content increases at lower mass, owing to higher gas fractions; the stellar mass-ISM metallicity relationship (i.e. the MZR) in the EAGLE-Recal prescription reproduces the observed decline with mass (, 2004; Zahid et al., 2014). Thus far, the agreement is good between our zooms and the observations, because the EAGLE-Recal prescription broadly reproduces the observed metal content of galaxies.
We now report the oxygen contents of the CGM within and additionally between 1 and , which are not nearly as well-constrained by observations (P14). Our main results are two-fold: 1) there exists more oxygen in the CGM within 2 than in the stellar and ISM content of the galaxy, and 2) a significant fraction, sometimes more than half of the oxygen, is ejected beyond for galaxies.
The first result, that more oxygen exists outside galaxies was also inferred by P14. Here, we are omniscient about the location of our simulated metals, and find that there is almost always more circumgalactic oxygen within than in the galaxy (stars+ISM). We plot this CGM oxygen within in Figure 10 categorised by ion. The eight ions plotted (O i through O viii) plus O ix (not plotted due to its unobservable nature) sum to unity. Ions lower than O vi dominate the CGM associated with sub- and many galaxies, while ions above O vi always dominate the CGM of group haloes, often at the 80-95% level indicating the need for a wide-area space-borne telescope sensitive to soft X-rays to account for the diffuse oxygen around groups.
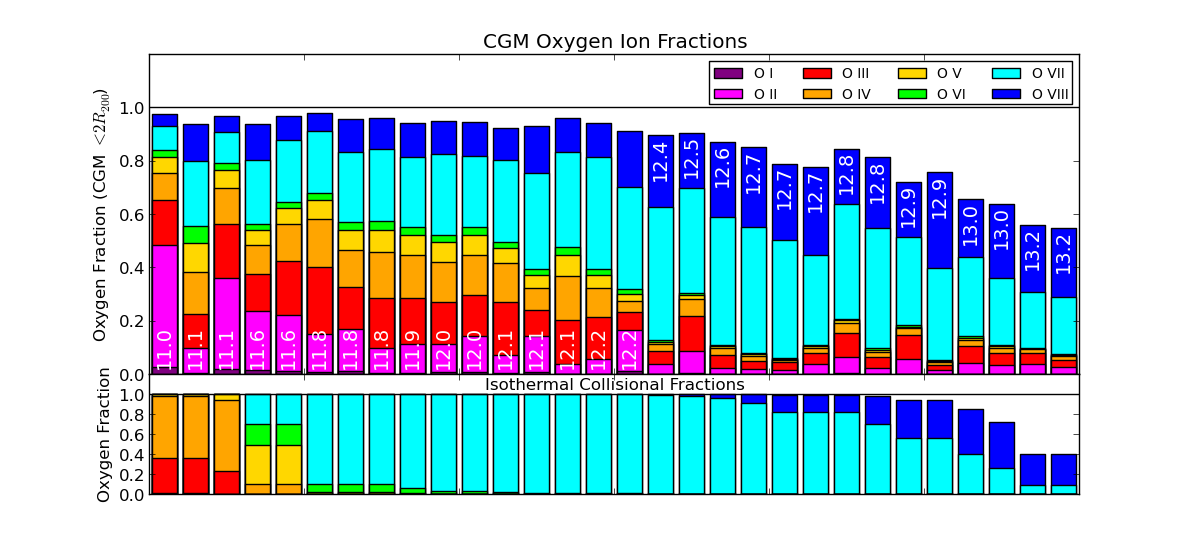
Even for haloes, for which O vi is the strongest, O vi contributes only a small fraction of the oxygen content of the CGM, which reflects this ion’s maximal radial ion fraction (§3.1). We plot the CGM within , because O vi barely shows up on a plot with the limit of . The most common ion is O vii, which makes up of the circumgalactic oxygen at between . It is almost as if nature conspires to hide diffuse oxygen (and most oxygen generated by stars) from our telescopes, since O vi is the most “easily” observable CGM ion. Nonetheless, O vi represents a powerful probe that we argue arises so strongly around galaxies owing to its temperature tracing the virial temperature of haloes.
In the bottom panel of Fig. 10 we plot the oxygen fractions assuming collisional ionization equilibrium at the virial temperature according to Equ. 1. Our simulated haloes are of course not isothermal out to , and show a far greater diversity of oxygen ionization states, which in part owes to the neglect of photo-ionization in this simplistic assumption, but most importantly owes to the complex temperature and density structure of the CGM. Nonetheless, our simulated O vi fractions decline at a similar halo mass, , as this simple model predicts, which clearly supports our conclusion that O vi traces the virial temperatures of haloes, and not those of group-sized haloes. Going to sub- haloes, , the simulated haloes do not show a decline in O vi as predicted by the isothermal model, because photo-ionization begins to dominate at these masses.
Hence, our second main result from Figure 9 is that up to half of the oxygen generated by an galaxy resides outside of in the low- Universe. The implications for galaxy formation models are profound. Not only is the closed-box model of galaxy growth inaccurate due to continuous accretion onto galaxies, the idea that galaxies return products of star formation to extended CGM reservoirs from which they can later re-accrete (e.g. , 2006, 2010; Guo et al., 2011; Henriques et al., 2015) may also be incorrect. The median oxygen content inside for group-sized haloes () is 69%, which is somewhat higher than that of haloes () at 62%. The increase of metals retained in higher mass haloes should be expected as larger haloes have deeper potential wells and physically larger virial radii. However, the reverse trend may apply because group-sized haloes have more star formation at early times when the Universe is physically smaller and halo potentials are shallower, which allow winds to travel to greater comoving distances. Additionally, group-sized haloes contain multiple large galaxies with large satellites more likely to lose their metals from a group halo, because they currently reside further from the halo centre and additionally may have fallen in at late times. Therefore, the moderate increase in metals retained inside from to haloes may represent several competing trends. Finally, the space between the top of the faded green bars and the black horizontal line in Fig. 9 is oxygen ejected beyond , which usually resides in the low-density IGM.
We further investigate the multi-phase structure of the CGM by considering gas pressures at different temperatures. We plot pressure as a function of halo mass at 0.3 and 1.0 in Figure 11. To calculate a pressure at a given radius and temperature, we take the median CGM gas density with a 0.1 dex spread in radius and temperature, and compute , where is the Boltzmann constant, is the mass fraction of hydrogen, and is the mean molecular weight. For each of our haloes, we colour the circles by temperature and scale their areas in proportion to log(), where is the mass within the temperature/radius bin.
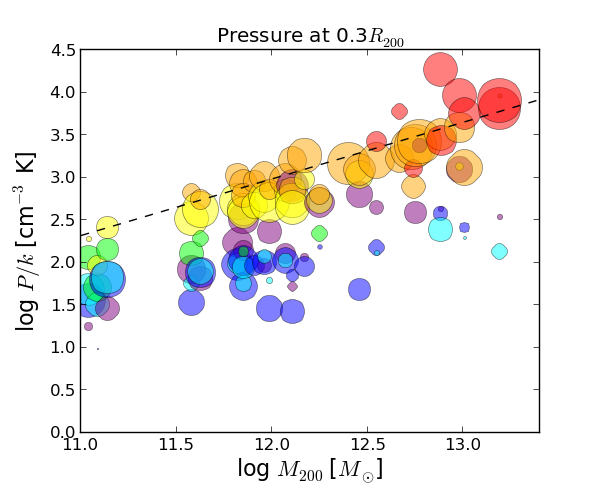
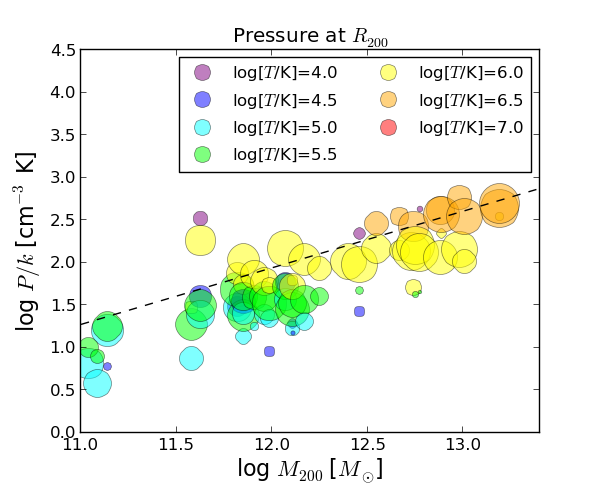
The first point to note is that the CGM is multi-phase, especially inside . In the range, there are copious amounts of gas at K (purple & blue circles) and K (yellow, orange, & red circles). Very little mass exists at and K (cyan & green circles), because gas cools rapidly through this temperature regime. When the cooling times become longer at K, gas is at a significantly lower pressure, which indicates this gas is not cooling isobarically. By the time the gas reaches K where cooling times are long, it becomes closer to achieving pressure equilibrium with gas with 100 more thermal energy. Thus, the interiors of haloes inhibit long-lived collisionally ionized, K, O vi owing to rapid cooling through the coronal regime, as well as cool, K, O vi owing to high pressures forcing cold gas to densities that are too high to be photo-ionized by the (2001) background. In contrast, at where the densities are lower and the cooling times are longer, the dominant phase is K (green circles), where O vi is a more effective tracer of the gas.
Group haloes have pressures that are far too high to allow long-lived O vi at any radii , although a multi-phase CGM exists where a small amount of cold K gas achieves similar pressures as much hotter K gas in some haloes. As for haloes, the gas at is less multi-phase, and the dominant phase is near the O vi collisional peak temperature.
We overplot the pressures assuming the single-phase isothermal model profile where and from Equ. 1 with dashed lines in Fig. 11. The pressures of the K phase generally follow the approximate magnitude and the slope () of the model, although haloes and below have lower pressures interior to , which was also shown by Crain et al. (2010). Even though the single-phase isothermal model is clearly an incomplete description of the CGM, it provides useful insight into the trends for O vi. The high pressures of groups prevent a significant O vi-traced gas phase. While haloes have the correct temperature for maximizing the fraction of collisionally ionized O vi, O vi still only traces a significant amount of mass in the exteriors where the coronal cooling times are long. Sub- haloes have pressures low enough to allow photo-ionized O vi.
6 Discussion
Our findings suggest that the O vi-sSFR correlation discovered by COS-Halos is an indirect correlation, and that the fundamental trend is O vi tracing virialized enriched gas at temperatures close to K, where the O vi fraction peaks. Passive central galaxies with mass reside in higher mass haloes than active galaxies with a similar mass. The higher virial temperatures of the haloes hosting the passive galaxies lead to significantly lower O vi fractions. While the CGM metal content increases with halo mass, O vi is not an effective tracer of haloes with mass . The CGM oxygen budget cannot be directly linked to recent star formation, which we demonstrated by showing that the typical age of O vi is greater than 5 Gyr and represents the cumulative ejection of metals by galactic superwinds over a Hubble time.
If the O vi were to trace metals originating from the star formation determined through observational indicators, then the time to travel to 150 kpc would imply a very high outflow speed. A 1500 wind is necessary to travel this distance in 100 Myr, which is the timescale for the observed SF indicators to be linked to recent SF. Such high-velocity winds are rarely if at all present in our simulated haloes at low-, which is also supported by recent observations of outflows around star-forming galaxies in the evolved Universe. A number of campaigns have observed blue-shifted, low-ion absorption wings extending to at most a few hundred from the galaxy, almost always at velocities unable to escape the gravitational potential of the halo (e.g. Bouché et al., 2012; Martin et al., 2012; Rubin et al., 2014; Chisholm et al., 2015; Nielsen et al., 2015).
We predict the amount of metals residing in low-redshift CGM reservoirs to be larger than the amount of metals in galaxies including stars and the ISM. Despite the high O vi column densities around galaxies, the summed O vi ionization fractions are only in CGM gas within and increase to when including CGM oxygen within . This is still higher than the global IGM O vi correction of reported by Rahmati et al. (2015b) for the EAGLE 100 Mpc box at low-. Assuming thus severely under-estimates the CGM oxygen content. This is not surprising since collisionally ionized O vi has a very small temperature range around K where it approaches its maximal of .
We emphasize the dramatic decline O vi takes as one transitions from to group haloes, and note the strength of the correlation. The average O vi absorption within 150 kpc for every halo in the range of is higher than for every group halo in the range , where each subsample contains more than ten haloes. The O vi column densities within 150 kpc decline by a factor of 5 when considering isolated galaxies, and by a factor of 3.5 when considering all galaxies, when transitioning from to group haloes. In contrast, the oxygen columns within 150 kpc increase by nearly a factor of 3 for the isolated sample and by more than a factor of 4.5 for all galaxies moving to higher mass. Hence, the average O vi ionization fraction for the CGM inside is almost a factor of 20 lower for group-sized haloes, such that .
6.1 Shortfall of halo O vi around galaxies
The inability of our simulated ions to reproduce the higher O vi column densities observed by COS-Halos around blue galaxies is worth discussing in greater depth. As noted in §4, we find about too little O vi within 150 kpc using the M5.3 zooms, with the greatest deviation being within 75 kpc (). We now discuss several possibilities of why there may be such a shortfall.
We note that our stellar masses are too low by a factor of in these zooms compared with abundance matching constraints. In Appendix B, we explore the higher resolution M4.4 zooms, finding that O vi is slightly stronger ( dex) around galaxies, but the stellar masses decline by 0.18 dex making a discrepancy with abundance matching. Recalibrating the EAGLE model is necessary at higher resolution, and it may be that through the generation of more stars, more oxygen is produced and ejected into the CGM, which creates even higher O vi column densities than in the M4.4 zooms. Indeed, Rahmati et al. (2015b) found that across different EAGLE models, the integrated metal ion column density distributions scaled nearly linearly with the integrated stellar mass. It may also be possible that there exists enough freedom in superwind feedback implementations to change O vi columns by a factor of two, while still successfully reproducing the large array of galaxy observables at many redshifts as the EAGLE prescription does.
Another possibility is that the low stellar masses in our M5.3 zooms could lead to a mismatched selection of over-massive haloes, where we have shown O vi to be weaker. To test this hypothesis, we run SMOHALOS where we artificially increase the M5.3 stellar masses by 0.3 dex in accordance with abundance matching constraints, and find essentially no difference in the median O vi column densities. Hence, this cannot explain the O vi shortfall.
A third possibility is that the original COS-Halos galaxy-selected sample exhibits Malmquist bias, which we cannot replicate using SMOHALOS applied to a limited set of zoom haloes. The COS-Halos galaxies were selected photometrically, which can lead to a biased sample of higher star-forming and/or more massive galaxies from a Schechter function. While SMOHALOS attempts to match galaxies based on and sSFR, we do not have a large enough sample to reproduce the high SFRs observed in COS-Halos (Werk et al., 2012). For example, 3% of SMOHALOS galaxies have SFR compared to 18% of COS-Halos, and we have no galaxies with SFR compared to 8% of the COS-Halos. Whereas COS-Halos selects star-forming galaxies from a large cosmic volume, our zooms are selected from a 25 Mpc box. Hence, we may not produce the O vi absorption columns observed in COS-Halos, because we are not simulating the same galaxies.
Finally, we assume a slowly evolving extra-galactic background (, 2001) without any local sources of ionizing radiation. Ionizing radiation from nearby star formation can increase O vi columns as demonstrated by Vasiliev et al. (2015) who found that can reach and reproduce COS-Halos O vi observations, albeit under specifically chosen conditions conducive to the photo-ionization of O vi. This model could invalidate our conclusion that O vi traces the virial temperature of haloes and not that of group haloes, because photo-ionization requires K gas, although it could be argued that both cold gas and ionizing photons from star formation decline in group haloes. Suresh et al. (2015b) show that O vi can be significantly enhanced by local sources of ionizing radiation, but only within 50 kpc using a 100% escape fraction for soft X-rays from a SFR=10 galaxy, which are unrealistic assumptions for COS-Halos.
However, we suggest the possibility that photo-ionization of O vi could be part of the solution, owing to fluctuating AGN “flash” ionizing their CGM. Oppenheimer & Schaye (2013b) introduced the concept of AGN proximity zone fossils, where “cool” K gas is ionized by a halo’s central AGN that subsequently turns off leaving the surrounding CGM over-ionized for a time similar to the recombination timescale of diffuse gas, which can equal or exceed the typical time between AGN episodes. They showed that Seyfert-level AGN that are on for 10% of the time can enhance O vi levels by dex after the AGN turns off. The effect may be particularly relevant for cool metals at where CGM metals exist in our simulations, and the relevant recombination timescales for O vi range from Myrs. Thus a short Seyfert “burst” lasting Myr within the past Myr can enhance O vi at the expense of lower oxygen ions, which normally trace this gas in equilibrium with the (2001) field. The COS-Halos galaxies do not show AGN activity (Werk et al., 2012) and are thus in the off-phase. The O vi nearer to the AGN should be more enhanced by the proximity zone fossil effect, which would agree with COS-Halos data showing O vi increasing at small impact parameter more steeply than our SMOHALOS realizations. This hypothesis requires a significant fraction of COS-Halos blue galaxies to be recent AGN.
6.2 Effect of AGN Feedback
To test the impact of AGN thermal feedback (i.e. not the proximity fossil effect discussed above) on CGM O vi, we run a single group halo (Grp004), which has at , turning off SMBH growth and AGN feedback. This halo is the most frequently selected SMOHALOS passive galaxy. Figure 12 compares 600 kpc snapshots of the standard run on the left versus the “NoAGN” model on the right in the same sequence as Fig. 2. While stellar feedback still operates in the NoAGN run, the galaxy is more massive. There exists more hydrogen and more oxygen in the CGM inside in the NoAGN model (cf. top two sets of panels). The values of are and with and without AGN respectively, reflecting the nearly factor of 3 increase in CGM oxygen in NoAGN group haloes.
Considering the O vi column densities in the third set of panels, there exists more O vi within , but there is substantially less () O vi within a radial distance of 100 kpc in the NoAGN model. The values of happen to be very similar, and with and without AGN, respectively, which are both typical O vi columns for our simulated groups. Combined with the oxygen aperture columns, we show is much lower in the NoAGN model (bottom panels), especially at small impact parameters. Our findings for this halo agree with the global IGM statistics of Rahmati et al. (2015b) showing only small differences between the Ref and NoAGN models, which we further discuss in Appendix B.
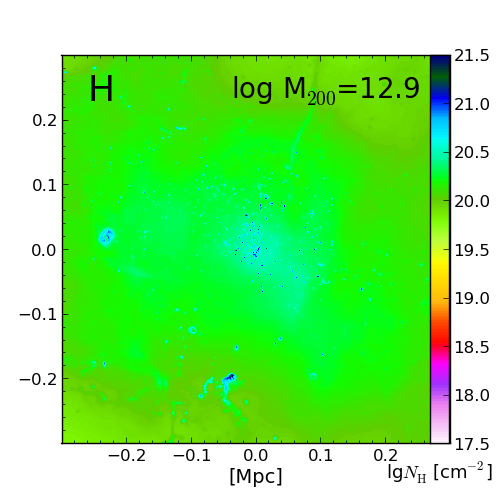
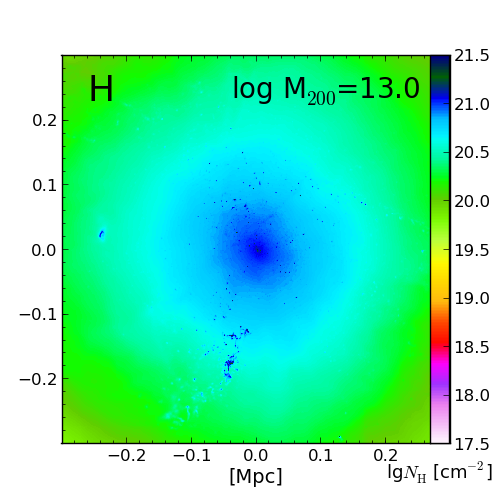
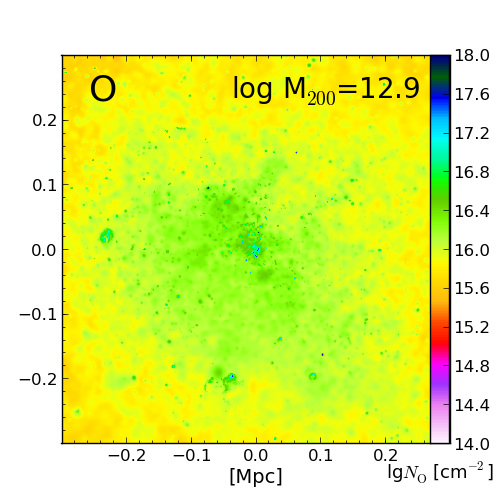
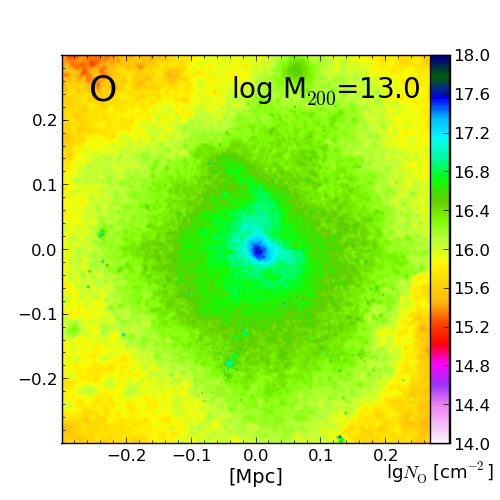
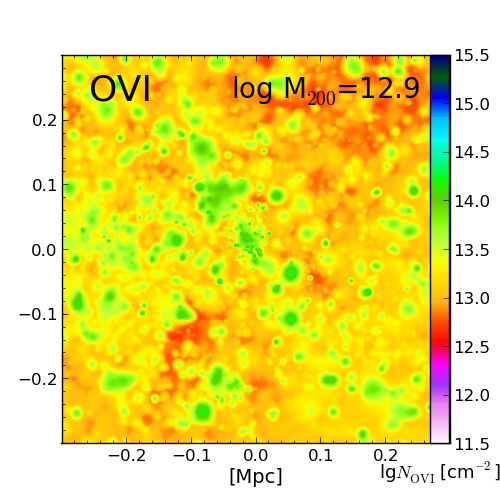
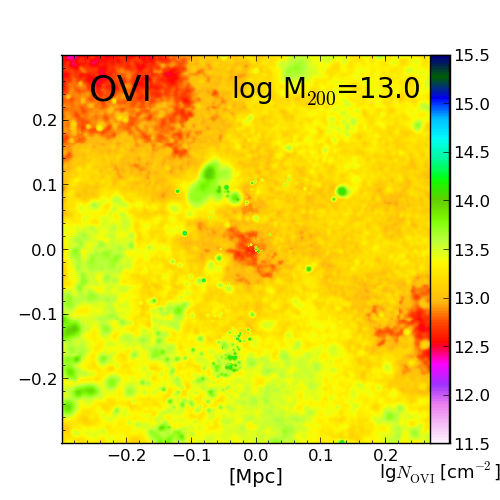
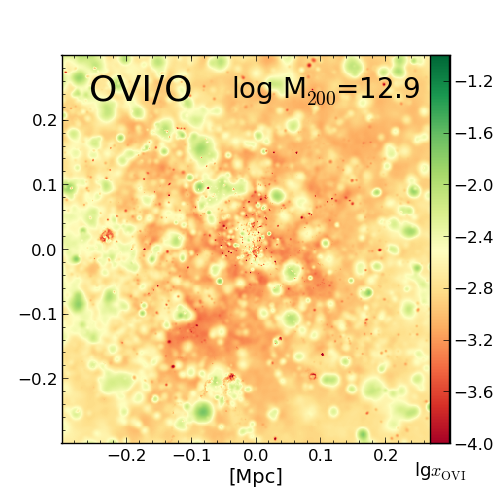
In contrast to Suresh et al. (2015b), who argue that the decline of O vi around passive versus star-forming galaxies of the same stellar mass owes primarily to AGN feedback removing mass from the haloes of passive galaxies, our exploration indicates that it is primarily an ionization effect that reduces O vi columns. Passive COS-Halos galaxies reside in higher mass haloes than their active counterparts, which have virial temperatures that are too high for O vi. Our NoAGN halo has almost as many stars in the central galaxy and CGM metals within as the standard run, but, almost coincidentally, a similar amount of O vi owing to the lower as a result of having less K gas in the inner halo. Another big difference is that the NoAGN run has a SFR, which creates a type of isolated galaxy rarely observed in the Universe.
7 Summary
We have run a set of EAGLE zoom simulations to confront the O vi observations within 150 kpc of star-forming and passive galaxies from the Tumlinson et al (2011) COS-Halos observational campaign. Our main simulations use the same model and resolution as the EAGLE Recal-L025N0752 run, but include the non-equilibrium ionization and cooling module introduced by Oppenheimer & Schaye (2013a) and Richings et al. (2014), which we activate at low redshifts. Twenty zoom simulations, focusing on haloes () hosting star-forming galaxies, and group-sized haloes () mostly hosting passive galaxies, are simulated to with the NEQ module activated at and for the and group haloes, respectively. Our main results are as follows:
- •
-
•
The bimodality of the O vi column density, with higher column densities around star-forming galaxies than around passive galaxies, owes to the temperature of the virialized halo gas. The virial temperature of haloes overlaps with the temperature at which collisionally ionized O vi peaks ( K), while virial temperatures of group-sized haloes are too high to be traced by O vi (e.g. Figs. 4, 6).
-
•
There is no direct link between star formation in the central galaxy and the O vi out to 150 kpc. The median age of the oxygen traced by O vi in the CGM is Gyrs, and represents the accumulation of circumgalactic metals over the entire star formation history of the galaxy.
-
•
The global O vi fractions of our haloes range between , which means that far more oxygen exists in other ionization states, both lower and higher than O vi. Most O vi observed around galaxies observed at impact parameters kpc is at physical separations of kpc () from the galaxy. The global rises to when considering oxygen out to , owing to optimal ionization O vi conditions at (Figs. 6, 10).
-
•
Group haloes hosting passive galaxies often have global inside , and the majority of circumgalactic oxygen is completely ionized (O ix). Group haloes have average column densities of for kpc, which mostly arises from gas beyond . This column density is lower than for haloes (). Applying isolation criteria similar to COS-Halos galaxies, the mean O vi column density around group centrals falls to , which is lower than for isolated haloes. Despite the low O vi column densities in groups, there exists more oxygen within a 150 kpc aperture than for haloes.
-
•
Our simulated haloes have O vi column densities that are too low compared to COS-Halos observations at kpc and at kpc. This could be related to an underproduction of total oxygen as our stellar masses are too low relative to abundance matching constraints. Increased photo-ionization, possibly from proximity zone fossils due to fluctuating AGN (Oppenheimer & Schaye, 2013b), are an unconsidered source that could increase the O vi ion fraction.
-
•
The majority of the oxygen produced and released by stars is ejected by superwind feedback beyond the optical extent of the galaxy, such that more oxygen exists in the CGM within than in the galactic component (stars+ISM). The progenitors of galaxies can eject more than half of their oxygen beyond by , although the fraction of oxygen remaining within (stars+ISM+CGM) averages 62% and 69% for and group haloes respectively. Enrichment at large radii primarily occurs at high , especially for group haloes, when gravitational potentials were shallower and fixed comoving distances were physically smaller (Figs. 6, 9).
-
•
O vii is the most abundant oxygen ion in the CGM for haloes between , with between 23 and 50% of the circumgalactic oxygen inside ionized to O vii. This is a factor of () higher than O vi in (group) haloes (Fig. 10).
-
•
We explore the role of AGN by running a group halo without AGN feedback, finding that it produces similar O vi column densities at kpc () as our standard group haloes with AGN feedback. Hence, the bimodality of circumgalactic O vi column densities with sSFR does not owe to the removal of mass and metals from the haloes of galaxies with more active black holes, but is clearly an ionization effect of reduced in hot haloes (Fig. 12).
In our simulations, the higher O vi column densities around star-forming galaxies compared with passive galaxies are due to their virial temperatures being more favorable for a high O vi fraction rather than to higher total oxygen column densities. A key test of this explanation would be to observe our prediction of the greater total oxygen content in the CGM of higher mass haloes, where O vi is no longer an effective tracer of CGM oxygen. Observing the soft X-ray ions O vii and O viii out to the virial radius is beyond the scope of current facilities, although we will make predictions for upcoming facilities in future work. Unfortunately, absorption lines capable of tracing K metals are at extreme UV energies, which shifts them out of the COS wavelength coverage at low redshift.
Our model contrasts with that of Suresh et al. (2015b), who predict that AGN blow more baryons out of haloes around passive than star-forming galaxies, and therefore will not predict more metals at kpc around passive galaxies. Alternatively, photo-ionization by galactic sources (e.g. Oppenheimer & Schaye, 2013b; Vasiliev et al., 2015) instead predicts that the O vi bearing material would exist in K gas around galaxies.
Our results indicate that O vi acts as a sensitive thermometer of halo gas, such that the O vi column density around star-forming and passive galaxies informs more about temperature than about the oxygen mass.
acknowledgments
The authors would like to thank John Stocke, Mike Shull, Molly Peeples, Romeel Davé, Todd Tripp, Kristian Finlator, Brent Groves, Andreas Pawlik for useful discussions contributing to this manuscript. We acknowledge Adrian Jenkins for providing the software for the generation of initial conditions. We also wish to thank the anonymous referee for improving the quality of the manuscript. Support for Oppenheimer was provided by NASA through grants HST-AR-12841 from the Space Telescope Science Institute, which is operated by the Association of Universities for Research in Astronomy, Incorporated, under NASA contract NAS5-26555, and the Astrophysics Theory Grant, 14-ATP14-0142. We acknowledge PRACE for awarding us access to resource Supermuc based in Germany at LRZ Garching (proposal number 2013091919). This work also utilized the Janus supercomputer, which is supported by the National Science Foundation (award number CNS-0821794), the University of Colorado Boulder, the University of Colorado Denver, and the National Center for Atmospheric Research. The Janus supercomputer is operated by the University of Colorado Boulder. This work additionally used the DiRAC Data Centric system at Durham University, operated by the Institute for Computational Cosmology on behalf of the STFC DiRAC HPC Facility (www.dirac.ac.uk). This equipment was funded by BIS National E-infrastructure capital grant ST/K00042X/1, STFC capital grants ST/H008519/1 and ST/K00087X/1, STFC DiRAC Operations grant ST/K003267/1 and Durham University. DiRAC is part of the National E-Infrastructure. The research was supported in part by the European Research Council under the European Union’s Seventh Framework Programme (FP7/2007-2013) ERC Grant agreement 278594-GasAroundGalaxies. Support was also provided by the Interuniversity Attraction Poles Programme initiated by the Belgian Science Policy Office ([AP P7/08 CHARM]), as well as the consolidated grant from the STFC (ST/L00075X/1). RAC is a Royal Society University Research Fellow. AJR is supported by the Lindheimer Fellowship at Northwestern University. A database with many of the galaxy properties in EAGLE is publicly available and described in McAlpine et al. (2016).
References
- (1) Aguirre, A., Hernquist, L., Schaye, J., Weinberg, D. H., Katz, N., & Gardner, J. 2001, ApJ, 560, 599
- Baes et al. (2011) Baes, M., Verstappen, J., De Looze, I., et al. 2011, ApJS, 196, 22
- Bahé et al. (2016) Bahé, Y. M., Crain, R. A., Kauffmann, G., et al. 2016, MNRAS, 456, 1115
- Bauer et al. (2013) Bauer, A. E., Hopkins, A. M., Gunawardhana, M., et al. 2013, MNRAS, 434, 209
- Behroozi et al. (2013) Behroozi, P. S., Wechsler, R. H., & Conroy, C. 2013, ApJ, 770, 57
- Booth & Schaye (2009) Booth, C. M., & Schaye, J. 2009, MNRAS, 398, 53
- Bordoloi et al. (2011) Bordoloi, R., Lilly, S. J., Knobel, C., et al. 2011, ApJ, 743, 10
- Bordoloi et al. (2014) Bordoloi, R., Tumlinson, J., Werk, J. K., et al. 2014, ApJ, 796, 136
- Borthakur et al. (2013) Borthakur, S., Heckman, T., Strickland, D., Wild, V., & Schiminovich, D. 2013, ApJ, 768, 18
- Borthakur et al. (2015) Borthakur, S., Heckman, T., Tumlinson, J., et al. 2015, ApJ, 813, 46
- (11) Bouché, N., Lehnert, M. D., Aguirre, A., Péroux, C., & Bergeron, J. 2007, MNRAS, 378, 525
- Bouché et al. (2012) Bouché, N., Hohensee, W., Vargas, R., et al. 2012, MNRAS, 426, 801
- (13) Bower, R. G., Benson, A. J., Malbon, R., Helly, J. C., Frenk, C. S., Baugh, C. M., Cole, S., & Lacey, C. G. 2006, MNRAS, 370, 645
- Camps & Baes (2015) Camps, P., & Baes, M. 2015, Astronomy and Computing, 9, 20
- (15) Cen, R. & Fang, T. 2006, ApJ, 650, 573
- Cen & Chisari (2011) Cen, R., & Chisari, N. E. 2011, ApJ, 731, 11
- (17) Chabrier G., 2003, PASP, 115, 763
- Chang et al. (2015) Chang, Y.-Y., van der Wel, A., da Cunha, E., & Rix, H.-W. 2015, ApJS, 219, 8
- Chen et al. (2010) Chen, H.-W., Helsby, J. E., Gauthier, J.-R., et al. 2010, ApJ, 714, 1521
- Chisholm et al. (2015) Chisholm, J., Tremonti, C. A., Leitherer, C., et al. 2015, ApJ, 811, 149
- Churchill et al. (2013) Churchill, C. W., Trujillo-Gomez, S., Nielsen, N. M., & Kacprzak, G. G. 2013, ApJ, 779, 87
- Crain et al. (2010) Crain, R. A., McCarthy, I. G., Frenk, C. S., Theuns, T., & Schaye, J. 2010, MNRAS, 407, 1403
- Crain et al. (2013) Crain, R. A., McCarthy, I. G., Schaye, J., Theuns, T., & Frenk, C. S. 2013, MNRAS, 432, 3005
- Crain et al. (2015) Crain, R. A., Schaye, J., Bower, R. G., et al. 2015, MNRAS, 450, 1937
- Creasey et al. (2011) Creasey, P., Theuns, T., Bower, R. G., & Lacey, C. G. 2011, MNRAS, 415, 3706
- Cullen & Dehnen (2010) Cullen, L., & Dehnen, W. 2010, MNRAS, 408, 669
- Dalla Vecchia & Schaye (2012) Dalla Vecchia, C., & Schaye, J. 2012, MNRAS, 426, 140
- Danforth et al. (2014) Danforth, C. W., Keeney, B. A., Tilton, E. M., et al. 2016, ApJ, 817, 111
- (29) Davé, R. & Oppenheimer, B. D. 2007, MNRAS, 374, 427
- Dehnen & Aly (2012) Dehnen, W., & Aly, H. 2012, MNRAS, 425, 1068
- (31) Dekel, A., et al. 2009, Nature, 457, 451
- Dolag et al. (2009) Dolag, K., Borgani, S., Murante, G., & Springel, V. 2009, MNRAS, 399, 497
- Durier & Dalla Vecchia (2012) Durier, F., & Dalla Vecchia, C. 2012, MNRAS, 419, 465
- Faerman et al. (2016) Faerman, Y., Sternberg, A., & McKee, C. F. 2016, arXiv:1602.00689
- Ferland et al. (1998) Ferland, G. J., Korista, K. T., Verner, D. A., Ferguson, J. W., Kingdon, J. B., & Verner, E. M. 1998, PASP, 110, 761
- Ford et al. (2013) Ford, A. B., Oppenheimer, B. D., Davé, R., et al. 2013, MNRAS, 432, 89
- Ford et al. (2014) Ford, A. B., Davé, R., Oppenheimer, B. D., et al. 2014, MNRAS, 444, 1260
- Ford et al. (2015) Ford, A. B., Werk, J. K., Dave, R., et al. 2015, arXiv:1503.02084
- (39) Fukigita, M. & Peebles, P. J. E. 2004, ApJ, 616, 643
- Furlong et al. (2015) Furlong, M., Bower, R. G., Theuns, T., et al. 2015, MNRAS, 450, 4486
- Furlong et al. (2016) Furlong, M., Bower, R. G., Crain, R. A., et al. 2015, arXiv:1510.05645
- Gallazzi et al. (2005) Gallazzi, A., Charlot, S., Brinchmann, J., White, S. D. M., & Tremonti, C. A. 2005, MNRAS, 362, 41
- Gilbank et al. (2010) Gilbank, D. G., Baldry, I. K., Balogh, M. L., Glazebrook, K., & Bower, R. G. 2010, MNRAS, 405, 2594
- (44) Gnat, O. & Ferland, G.. 2012, ApJS, 199, 20
- Guo et al. (2011) Guo, Q., White, S., Boylan-Kolchin, M., et al. 2011, MNRAS, 413, 101
- Gutcke et al. (2016) Gutcke, T. A., Stinson, G. S., Macciò, A. V., Wang, L., & Dutton, A. A. 2016, arXiv:1602.06956
- (47) Haardt, F. & Madau, P. 2001, in “Clusters of galaxies and the high redshift universe observed in X-rays, Recent results of XMM-Newton and Chandra”, XXXVIth Rencontres de Moriond , eds. D.M. Neumann & J.T.T. Van.
- (48) Heckman, T. M., Norman, C. A., Strickland, D. K., & Sembach, K. R. 2002, ApJ, 577, 691
- Henriques et al. (2015) Henriques, B. M. B., White, S. D. M., Thomas, P. A., et al. 2015, MNRAS, 451, 2663
- Hopkins (2013) Hopkins, P. F. 2013, MNRAS, 428, 2840
- Hummels et al. (2013) Hummels, C. B., Bryan, G. L., Smith, B. D., & Turk, M. J. 2013, MNRAS, 430, 1548
- Hutchings & Thomas (2000) Hutchings, R. M., & Thomas, P. A. 2000, MNRAS, 319, 721
- Jenkins (2010) Jenkins, A. 2010, MNRAS, 403, 1859
- Jenkins & Booth (2013) Jenkins, A., & Booth, S. 2013, arXiv:1306.5771
- Kacprzak et al. (2011) Kacprzak, G. G., Churchill, C. W., Evans, J. L., Murphy, M. T., & Steidel, C. C. 2011, MNRAS, 416, 3118
- Kacprzak et al. (2015) Kacprzak, G. G., Muzahid, S., Churchill, C. W., Nielsen, N. M., & Charlton, J. C. 2015, ApJ, accepted
- (57) Kennicutt, R. C. 1998, ApJ, 498, 541
- (58) Kereš, D., Katz, N., Weinberg, D. H., & Davé, R. 2005, MNRAS, 363, 2
- Lagos et al. (2015a) Lagos, C. d. P., Crain, R. A., Schaye, J., et al. 2015, MNRAS, 452, 3815
- Lagos et al. (2015b) Lagos, C. d. P., Theuns, T., Schaye, J., et al. 2015, arXiv:1510.08067
- Leitner (2012) Leitner, S. N. 2012, ApJ, 745, 149
- Liang & Chen (2014) Liang, C. J., & Chen, H.-W. 2014, MNRAS, 445, 2061
- Martin et al. (2012) Martin, C. L., Shapley, A. E., Coil, A. L., et al. 2012, ApJ, 760, 127
- McAlpine et al. (2016) McAlpine, S., Helly, J. C., Schaller, M., et al. 2016, Astronomy and Computing, 15, 72
- Moster et al. (2013) Moster, B. P., Naab, T., & White, S. D. M. 2013, MNRAS, 428, 3121
- Nielsen et al. (2013) Nielsen, N. M., Churchill, C. W., & Kacprzak, G. G. 2013, ApJ, 776, 115
- Nielsen et al. (2015) Nielsen, N. M., Churchill, C. W., Kacprzak, G. G., Murphy, M. T., & Evans, J. L. 2015, ApJ, 812, 83
- (68) Oppenheimer, B. D. & Davé, R. A. 2006, MNRAS, 373, 1265
- (69) Oppenheimer, B. D. & Davé, R. A. 2009, MNRAS, 395, 1875
- (70) Oppenheimer, B. D., Davé, R., Kereš, D., Fardal, M., Katz, N., Kollmeier, J., Weinberg, D. H. 2010, MNRAS, 406, 2325
- Oppenheimer et al. (2012) Oppenheimer, B. D., Davé, R., Katz, N., Kollmeier, J. A., & Weinberg, D. H. 2012, MNRAS, 420, 829
- Oppenheimer & Schaye (2013a) Oppenheimer, B. D., & Schaye, J. 2013, MNRAS, 434, 1043
- Oppenheimer & Schaye (2013b) Oppenheimer, B. D., & Schaye, J. 2013, MNRAS, 434, 1063
- Peeples et al. (2014) Peeples, M. S., Werk, J. K., Tumlinson, J., et al. 2014, ApJ, 786, 54 (P14)
- Planck Collaboration (2014) Planck Collaboration, 2014, A&A, 571, A1
- Price (2008) Price, D. J. 2008, Journal of Computational Physics, 227, 10040
- Rahmati et al. (2015a) Rahmati, A., Schaye, J., Bower, R. G., et al. 2015, MNRAS, 452, 2034
- Rahmati et al. (2015b) Rahmati, A., Schaye, J., Crain, R. A., et al. 2015, arXiv:1511.01094
- Richings et al. (2014) Richings, A. J., Schaye, J., & Oppenheimer, B. D. 2014, MNRAS, 440, 3349
- Richings & Schaye (2015) Richings, A. J., & Schaye, J. 2016, MNRAS,
- Rosas-Guevara et al. (2013) Rosas-Guevara, Y. M., Bower, R. G., Schaye, J., et al. 2013, arXiv:1312.0598
- Rubin et al. (2014) Rubin, K. H. R., Prochaska, J. X., Koo, D. C., et al. 2014, ApJ, 794, 156
- Rudie et al. (2012) Rudie, G. C., Steidel, C. C., Trainor, R. F., et al. 2012, ApJ, 750, 67
- (84) Salpeter E.E., 1955, ApJ, 121, 161
- Savage et al. (2010) Savage, B. D., Narayanan, A., Wakker, B. P., et al. 2010, ApJ, 719, 1526
- (86) Schaller, M., Dalla Vecchia, C., Schaye, J., et al. 2015, MNRAS, 454, 2277
- (87) Schaye, J., Aguirre, A., Kim, T.-S., Theuns, T., Rauch, M., & Sargent, W.L.W. 2003, ApJ, 596, 768
- Schaye (2004) Schaye, J. 2004, ApJ, 609, 667
- Schaye & Dalla Vecchia (2008) Schaye, J., & Dalla Vecchia, C. 2008, MNRAS, 383, 1210
- Schaye et al. (2015) Schaye, J., Crain, R. A., Bower, R. G., et al. 2015, MNRAS, 446, 521 (S15)
- Segers et al. (2015) Segers, M. C., Crain, R. A., Schaye, J., et al. 2016, MNRAS, 456, 1235
- Shen et al. (2013) Shen, S., Madau, P., Guedes, J., et al. 2013, ApJ, 765, 89
- Shen et al. (2014) Shen, S., Madau, P., Conroy, C., Governato, F., & Mayer, L. 2014, ApJ, 792, 99
- Stinson et al. (2012) Stinson, G. S., Brook, C., Prochaska, J. X., et al. 2012, MNRAS, 425, 1270
- Stocke et al. (2013) Stocke, J. T., Keeney, B. A., Danforth, C. W., et al. 2013, ApJ, 763, 148
- Shull et al. (2012) Shull, J. M., Smith, B. D., & Danforth, C. W. 2012, ApJ, 759, 23
- Shull (2014) Shull, J. M. 2014, ApJ, 784, 142
- (98) Smith, B. D., Hallman, E. J., Shull, J. M., & O’Shea, B. W. 2011, ApJ, 731, 6
- Springel et al. (2001) Springel, V., White, S. D. M., Tormen, G., & Kauffmann, G. 2001, MNRAS, 328, 726
- (100) Springel, V. & Hernquist, L. 2003, MNRAS, 339, 289
- (101) Springel, V. & Hernquist, L. 2003, MNRAS, 339, 312
- (102) Springel, V. 2005, MNRAS, 364, 1105
- Suresh et al. (2015a) Suresh, J., Bird, S., Vogelsberger, M., et al. 2015, MNRAS, 448, 895
- Suresh et al. (2015b) Suresh, J., Rubin, K. H. R., Kannan, R., et al. 2015, arXiv:1511.00687
- Tepper-Garcia et al. (2011) Tepper-Garcia, T., Richter, P., Schaye, J., Booth, C. M., Dalla Vecchia, C., Theuns, T., & Wiersma, R. P. C. 2011, MNRAS, accepted
- Tescari et al. (2011) Tescari, E., Viel, M., D’Odorico, V., Cristiani, S., Calura, F., Borgani, S., & Tornatore, L. 2011, MNRAS, 411, 826
- Thom & Chen (2008) Thom, C. & Chen, H.-W. 2008, ApJS, 179, 37
- Tilton et al. (2012) Tilton, E. M., Danforth, C. W., Shull, J. M., & Ross, T. L. 2012, ApJ, 759, 112
- Tornatore et al. (2010) Tornatore, L., Borgani, S., Viel, M., & Springel, V. 2010, MNRAS, 402, 1911
- Trayford et al. (2015) Trayford, J. W., Theuns, T., Bower, R. G., et al. 2015, MNRAS, 452, 2879
- (111) Tremonti, C. A., et al. 2004, ApJ, 613, 898
- (112) Tripp, T. M., Semback, K. R., Bowen, D. V., Savage, B. D., Jenkins, E. B., Lehner, N., & Richter, P. 2008, ApJS, 177, 39
- Tumlinson et al (2011) Tumlinson, J., Thom, C., Werk, J. K., et al. 2011, Science, 334, 948 (T11)
- Tumlinson et al. (2013) Tumlinson, J., Thom, C., Werk, J. K., et al. 2013, ApJ, 777, 59
- Turner et al. (2014) Turner, M. L., Schaye, J., Steidel, C. C., Rudie, G. C., & Strom, A. L. 2014, MNRAS, 445, 794
- van de Voort et al. (2012) van de Voort, F., Schaye, J., Altay, G., & Theuns, T. 2012, MNRAS, 421, 2809
- Vasiliev et al. (2015) Vasiliev, E. O., Ryabova, M. V., & Shchekinov, Y. A. 2015, MNRAS, 446, 3078
- (118) Wakker, B. P., & Savage, B. D. 2009, ApJS, 182, 378
- Wendland (1995) Wendland H., 1995, Advances Comput. Math., 4, 389
- Werk et al. (2012) Werk, J. K., Prochaska, J. X., Thom, C., et al. 2012, ApJS, 198, 3
- White (1994) White, S. D. M. 1994, arXiv:astro-ph/9410043
- (122) Wiersma, R. P. C., Schaye, J., & Smith, B. D. 2009, MNRAS, 393, 99
- (123) Wiersma, R. P. C., Schaye, J., Theuns, T., Dalla Vecchia, C., & Tornatore, L. 2009, 399, 574
- Wiersma et al. (2010) Wiersma, R. P. C., Schaye, J., Dalla Vecchia, C., Booth, C. M., Theuns, T., & Aguirre, A. 2010, MNRAS, 409, 132
- Yoshikawa & Sasaki (2006) Yoshikawa, K., & Sasaki, S. 2006, PASJ, 58, 641
- Zahid et al. (2012) Zahid, H. J., Dima, G. I., Kewley, L. J., Erb, D. K., & Davé, R. 2012, ApJ, 757, 54
- Zahid et al. (2014) Zahid, H. J., Dima, G. I., Kudritzki, R.-P., et al. 2014, ApJ, 791, 130
Appendix A Non-equilibrium effects
Non-equilibrium effects are generally small when considering circumgalactic O vi within 150 kpc exposed to a slowly evolving ionization background such as that specified by (2001). Figure 13 shows the O vi column density in the equilibrium runs (cyan) and the NEQ runs (grey) at . The bottom panel shows that the differences are small– equilibrium zooms have and dex greater columns than NEQ zooms for and group haloes respectively. Column densities of high oxygen ions (O vi and above) typically differ by less than 30% (0.1 dex) along individual lines of sight. The scatter is larger for group haloes with smaller O vi columns, where an episodic fluctuation can make a larger difference. Galaxy properties ( and sSFR) are indistinguishable between the two sets of simulations.
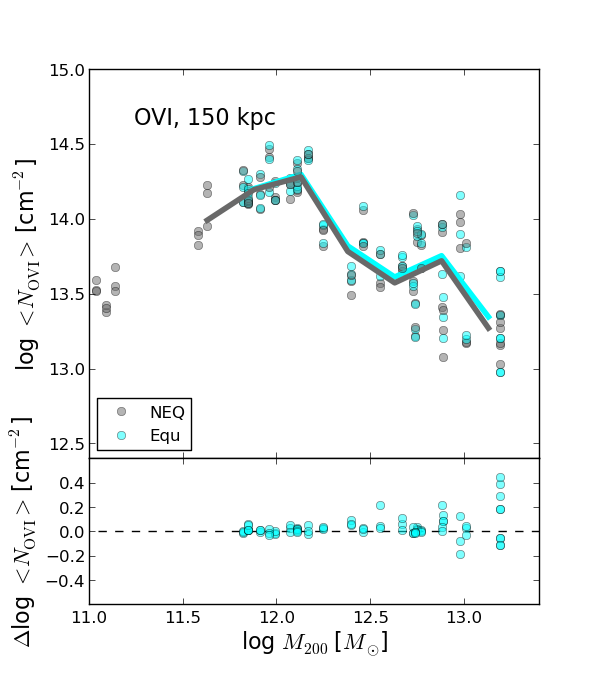
Our results appear to agree with (2006) and Yoshikawa & Sasaki (2006), who find that non-equilibrium effects matter for O vi mainly in the low-density, diffuse IGM where collisional ionization timescales become long compared to the timescales on which gas is shocked. One caveat is that we may underestimate the NEQ effects, because SPH smooths out shocks (Hutchings & Thomas, 2000; Creasey et al., 2011). Our simulations find that non-equilibrium ionization and cooling under a slowly evolving ionization background such as (2001) do not significantly alter the O vi CGM statistics, and will further explore non-equilibrium effects in such simulations in a future paper. However, a fluctuating local source of radiation, as expected for AGN, will introduce significant NEQ effects (Oppenheimer & Schaye, 2013b).
Appendix B Resolution tests and comparisons with large volumes
We compare our results to higher and lower resolution simulations, using both our zooms and other periodic EAGLE runs. We consider stellar masses relative to abundance matching constraints in Figure 14 and 150 kpc aperture O vi column densities in Figure 15.
B.1 Metal smoothing at the same resolution
We first compare matched haloes at the same resolution in the M5.3 zooms (grey) and in Recal-L025N0752 (yellow, the difference with the grey circles indicated in the bottom panel). This comparison tests the effect of SPH-smoothing of elemental abundances, which is done in Recal-L025N0752 but not in the zooms as discussed in §2.3.3. The other differences between these two runs are NEQ versus equilibrium, which was covered in the previous Appendix and is insignificant for and , as well as the zoom method. We find dex higher stellar masses for galaxies in Recal-L025N0752, which closely matches the dex higher stellar masses we find in five M5.3 smoothed-metallicity zooms. The O vi columns are essentially unchanged, being dex lower in Recal-L025N0752. Hence, metal smoothing slightly increases stellar masses but barely alters O vi CGM columns. This test also shows that our zooms do not statistically deviate from their parent simulations, so that our zoom results also hold for the EAGLE volumes. Therefore, we can compare our results directly to Rahmati et al. (2015b) for global IGM metal statistics when they use Recal-L025N0752.
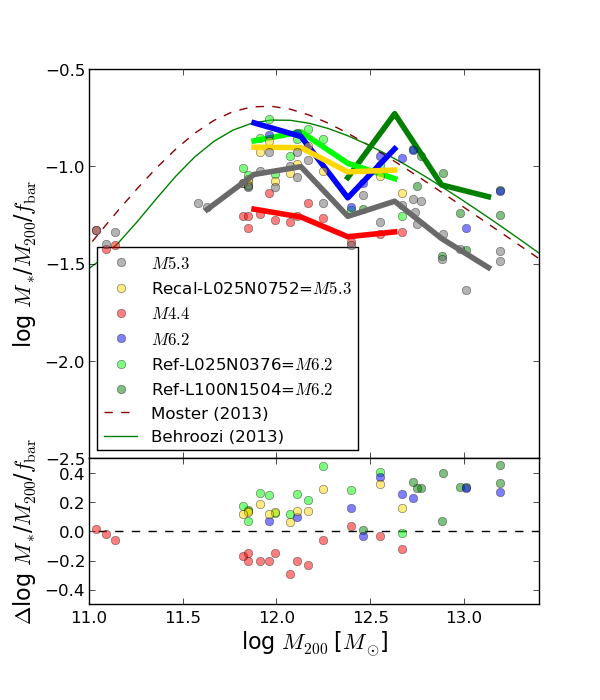
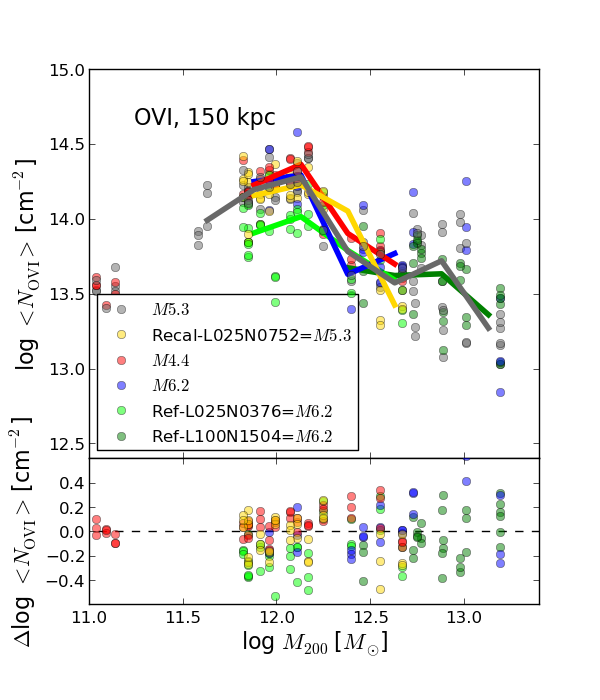
B.2 Resolution tests
We have run all M5.3 zooms from the Recal-L025N0752 box at M4.4 resolution using the same parameters (Recal prescription and particle-metallicities; red), which we show in both Figs. 14 and 15. These runs, listed in Table 2, constitute a strong convergence test (S15), and better agreement is potentially achievable with recalibrated parameters. Seven out of 10 M4.4 zooms are run in NEQ from to at least , but the NEQ results are nearly identical to the equilibrium one. The large Gal010 zoom was run in equilibrium only, and provides 3 individual haloes to test if the decline in O vi above persists at this higher resolution. We also ran a set of M6.2 zooms using Recal and particle-metallicities (blue) for nine galaxies in four zooms, also listed in Table 2.
| Name | Resolution | log () | () | () | (pc) | log () | SFR () | ||
|---|---|---|---|---|---|---|---|---|---|
| Gal001 | M4.4 | 12.07 | 2.77e+04 | 1.49e+05 | 175 | 9.98 | 1.166 | 0.503 | 0.0 |
| Gal002 | M4.4 | 12.27 | 2.85e+04 | 1.53e+05 | 175 | 10.20 | 1.538 | 0.503 | 0.0 |
| Gal003 | M4.4 | 12.11 | 2.80e+04 | 1.50e+05 | 175 | 10.05 | 1.311 | 0.503 | 0.0 |
| Gal004 | M4.4 | 12.01 | 2.83e+04 | 1.52e+05 | 175 | 9.93 | 1.077 | 0.503 | 0.0 |
| Gal005 | M4.4 | 12.16 | 2.84e+04 | 1.53e+05 | 175 | 10.17 | 1.323 | 0.503 | 0.099 |
| Gal006 | M4.4 | 11.93 | 2.77e+04 | 1.49e+05 | 175 | 9.88 | 0.620 | 0.503 | 0.0 |
| Gal007 | M4.4 | 11.82 | 2.83e+04 | 1.52e+05 | 175 | 9.76 | 0.953 | 0.503 | 0.0 |
| Gal008 | M4.4 | 11.87 | 2.83e+04 | 1.52+05 | 175 | 9.75 | 0.647 | 0.503 | 0.205 |
| Gal009 | M4.4 | 11.85 | 2.83e+04 | 1.52e+05 | 175 | 9.79 | 0.772 | 0.503 | 0.205 |
| Gal010a | M4.4 | 12.69 | 2.83e+04 | 1.52e+05 | 175 | 10.55 | 2.019 | – | – |
| Gal010a | M6.2 | 12.69 | 1.86e+06 | 9.98e+06 | 700 | 10.93 | 4.677 | – | – |
| Grp003a | M6.2 | 12.71 | 1.90e+06 | 1.02e+07 | 700 | 10.99 | 0.708 | – | – |
| Grp006a | M6.2 | 12.99 | 1.78e+06 | 9.52e+06 | 700 | 10.87 | 0.000 | – | – |
| Grp008a | M6.2 | 13.15 | 1.85e+06 | 9.92+06 | 700 | 11.22 | 0.000 | – | – |
a These haloes were not run in non-equilibrium.
For haloes, the M4.4 zooms have dex higher O vi columns despite having dex lower stellar masses as mentioned in §6.1. This means that a greater proportion of the oxygen formed in higher resolution simulations (since oxygen production ) appears as O vi within 150 kpc of the galaxy. The decline of O vi above however is robust with the three Gal010 haloes (, , and ) showing a considerable decline in O vi columns relative to masses. These three haloes have O vi columns averaging , which is lower than the M4.4 columns– , and the same decline as seen in the M5.3 zooms. Hence, the conclusion that O vi traces the virial temperature of haloes and therefore declines at higher masses is corroborated by these better mass resolution simulations. Nevertheless, the M4.4 zooms underpredict abundance matching constraints by a factor of , which implies that the stellar feedback indeed needs to be recalibrated at M4.4 resolution to inject less energy in order to create galaxies of the same stellar mass in the mass range. This is likely a consequence of improved numerical efficiency of our stochastic thermal feedback implemented at the higher resolution.
The M6.2 zooms are the only galaxies run at this resolution using the Recal prescription, because L100N1504 uses the Ref parameter values. In the range, galaxy stellar masses are on average 0.09 dex higher than M5.3 while the O vi columns are 0.06 dex lower. This continues the trend seen with the M4.4 zooms of a greater proportion of oxygen produced by stars showing up as O vi within 150 kpc at higher resolution. The decline in O vi above persists at M6.2 resolution. This trend is robust at all three resolutions, indicating a decline by a factor of in O vi columns from to group haloes. The resolution convergence is better for values than for across a factor of in mass resolution; however it should be noted that oxygen production is nearly linear with stellar mass, so that the over-riding trend is a greater fraction of oxygen produced at higher resolution becomes CGM O vi within 150 kpc.
B.3 Comparison to EAGLE volumes
In the previous section, we compared our results in the “strong convergence” regime, defined by S15 as not changing the subgrid models across different resolutions, using the Recal prescription. However, to compare to the main EAGLE simulations that use the “Ref” model at M6.2 resolution, we cross-reference the () haloes at M5.3 resolution to Ref-L025N0376 (green in Figs. 14 and 15) and the group () haloes to Ref-L100N1504 (dark green) to perform a test of “weak convergence” where the subgrid models are changed. This allows us to verify our higher resolution zoom results to the much larger sample from the EAGLE volumes, which are used throughout many EAGLE papers including Rahmati et al. (2015b).
Relative to our M5.3 zooms, the Ref model has (group) stellar masses that are 0.21 (0.31) dex higher, while O vi columns are 0.24 (0.06) dex lower. The Ref model better matches the abundance matching constraints (by design), while our zooms have the additional difference of using particle rather than smoothed-SPH metallicities on top of the weak convergence comparison of the standard Ref and Recal prescriptions. The decline from to group haloes for log is smaller ( to ) than in the matched M5.3 zooms ( to ), but still significant.
To generalize these statistics to all haloes in the EAGLE Ref volumes, we find the average log in (group) haloes using Ref-L025N0376 (Ref-L100N1504) of () , where each sample contains at least 50 haloes. While the decline is still apparent, it is smaller at the Ref resolution. We also used the intermediate-sized Ref-L050N0752 box to find () for 294 (52) (group) haloes. However, it must be noted that this sample includes all the haloes in 0.6 dex bins, which biases each bin to be dominated by haloes at the lower mass end of the bin (where there are more haloes) as opposed to the zooms chosen to more evenly sample the masses within these bins. Indeed, making the bins smaller (0.3 dex wide) in Ref-L050N0752, leads to a slightly greater decline from to .
The O vi columns are considerably smaller at Ref resolution, which is again apparent when we look at all haloes in Recal-L025N0752 finding , which is 0.26 dex higher than for Ref-L025N0376. This supports the findings of Rahmati et al. (2015b) where significantly more high O vi columns () occur in Recal-L025N0752 than in the Ref lower resolution simulations. While group halo O vi columns appear to not change much in the weak convergence limit, the O vi columns in haloes are significantly higher in the Recal simulations, which affects both COS-Halos type observations and global IGM observations (Rahmati et al., 2015b).
NoAGN Simulations: Finally, we consider the NoAGN-L050N0752 run (M6.2 resolution), and find log[] () for (group) haloes, which compares to () in Ref-L050N0752. Thus, the conclusion that AGN are not responsible for the reduction of O vi columns with mass as discussed in §6.2, holds also for this larger sample of group haloes, and the difference in O vi column density is actually stronger in the absence of AGN. Globally, there exists more O vi in the NoAGN models (Rahmati et al., 2015b), which likely owes to haloes hosting more O vi while group haloes harbour less O vi within 150 kpc despite forming twice as many stars.