Magnons in : possible evidence for Goldstone-Higgs interaction in a weakly ordered spin-1/2 chain antiferromagnet.
Abstract
We report on an electron spin resonance (ESR) study of a nearly one-dimensional (1D) spin chain system, , with extremely weak symmetry-breaking order. The ESR spectra at , in the disordered Luttinger-spin-liquid phase reveal ideal Heisenberg-chain behavior with only very small, field-independent linewidth, . In the ordered state, below , we identify antiferromagnetic resonance (AFMR) modes, which are well described by pseudo-Goldstone magnons in the model of a collinear biaxial antiferromagnet. Additionally, we observe a major resonant response of a special nature, which we attribute to magnon interaction with the Higgs amplitude (longitudinal) mode in a weakly ordered antiferromagnet.
pacs:
75.50.Ee, 76.60.-k, 75.10.Jm, 75.10.PqThe symmetry broken states and quasi-particle excitations in condensed matter explore much of the same physics as field theories of particles in the Universe, while presenting an advantage of being precisely tunable and accessible in a laboratory-scale experiments. While experimental studies of Higgs particles or quark confinement in hadrons require giant colliders, such as LHC, or RHIC, important insights into the underlying physics can be obtained by studying model material systems such as quantum magnets, topological insulators, and ferroelectric and disordered superconductor systems Merchant et al. (2014); Sato et al. (2011); Lin et al. (2014); Sherman et al. (2015). Transition metal compounds with weakly interacting Heisenberg spin-1/2 chains present particularly favorable opportunity for exploring these concepts.
The ground state of an isolated chain is disordered, with de-confined fractional spin-1/2 excitations (spinons) forming continuum of physically accessible spin-1(2,3,…) states Walters et al. (2009); Lake et al. (2010); Zaliznyak (2005). This state, known as Luttinger liquid (LL), is quantum-critical, so that even a tiny inter-chain coupling in a real material leads to a three-dimensional (3D) magnetic ordering at . Spontaneous symmetry breaking by magnetic order imposes linear attractive potential, which at low energy confines pairs of spin-1/2 spinons into spin-1 magnons, in accord with the Goldstone theorem which requires gap(mass)less excitations Goldstone et al. (1962). In the case of a collinear antiferromagnetic (AFM) order, these are well-known transverse spin waves Andreev (1978); Andreev and Marchenko (1980). The interaction of such Goldstone magnons with the Higgs Higgs (2014); Pekker and Varma (2015) amplitude mode of the order parameter is usually discarded while it grows in importance near the quantum critical point (QCP), where the symmetry-breaking is weak, and its amplitude fluctuations are significant. What is the energy scale where this interaction occurs, and what is the spectral weight involved – are coherent magnons detectable at all near the QCP, when the symmetry breaking is weak? What are the roles of the amplitude fluctuations of the order parameter (Higgs mode), and of the longitudinal magnon mode predicted by the chain-mean-field theory Schulz (1996); Essler et al. (1997), the evidence for whose existence obtained in neutron experiments is still controversial Lake et al. (2005a, b); Zheludev et al. (2002)?
Motivated by these questions, we carried out ESR experiments aimed at a comparative study of magnetic resonance in the ordered and LL phases of a chain cuprate, , at frequencies of the microwave field, , probing magnetic excitations with energies . Surprisingly, not only we have been able to identify Goldstone magnons, modes corresponding to the transverse oscillations of the magnetic order parameter and a hallmark of a spinon confinement, but we have also discovered an unusual excitation with strongly field-dependent energy gap (mass). This mode is not predicted by the low-energy hydrodynamic theory of spin dynamics, which instead predicts a field-independent pseudo Goldstone spin wave Andreev (1978); Andreev and Marchenko (1980). Therefore, the observed massive mode can only arise from the short-wavelength behavior, such as the interaction of the Goldstone magnon with the Higgs mode.
is a unique example of a nearly 1D chain antiferromagnet. It has a body-centered orthorhombic crystal structure (space group ) composed of chains of corner-sharing CuO4 square plaquettes in the -plane, running along the -axis of the crystal. The strong Cu-O hybridization results in an extremely strong Cu-O-Cu in-chain superexchange, K, Suzuura et al. (1996); Walters et al. (2009); Motoyama et al. (1996). Small orbital overlaps between the planar CuO4 plaquettes on neighbor chains yield a much smaller inter-chain coupling, , resulting in an almost ideal spin-chain structure. Hence, undergoes a phase transition into an antiferromagnetically ordered state only below the Néel temperature K , in a very close proximity of the 1D LL quantum-critical state. Strong quantum fluctuations result in an ordered moment of only , as was determined from neutron scattering and SR experiments Kojima et al. (1997). Consequently, presents an ideal model material for exploring effects of an extremely weak symmetry breaking in a system of coupled quantum-critical spin-1/2 chains with fractional spinon excitations, the emergence of Goldstone and Higgs modes resulting from spinon confinement, and the corresponding dimensional cross-over regimes.
The ESR experiments were carried out on a high-quality single crystal sample ( g), similar to the ones used in our previous studies Walters et al. (2009). The sample was oriented using the tabletop Laue Xray. The magnetic resonance spectra were examined using a set of home made transmission-type microwave spectrometers with cylindrical and rectangular cavities covering the frequency range GHz. A magnetic field up to 12 T was supplied by the superconducting magnet. The temperature of the experiment varied from 0.5 K (with the 3He cryostat insert) to 50 K. For the complementary elastic neutron scattering measurements, a larger piece of a similar crystal was placed in a 4He flow cryostat on SPINS spectrometer at NIST Center for Neutron Research; the fixed scattered neutron energy of 3.7 meV, BeO filter after sample, and beam collimations from sample to detector were used.
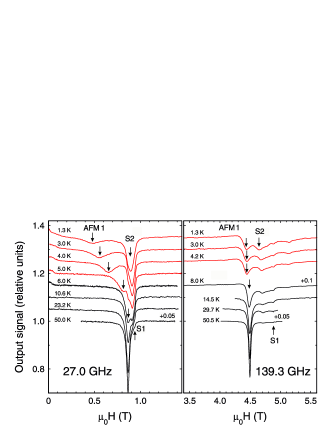
Typical resonance absorption spectra of recorded at low and high frequencies of the microwave field are presented in Fig. 1. At , the spectrum consists of an intense principal line and two weak satellites (marked S1 and S2). An excellent fit to the field profile of the ESR absorption signal for all measurement frequencies is obtained by using Lorentzian profile for the principal line and Gaussians for the satellites, resulting in three fitting parameters for each resonance line: the signal amplitude, , the resonance field, , and the half width at half maximum (HWHM) linewidth, . At all observed resonance modes have linear frequency-field dependence typical of a paramagnet, ( is the Planck constant, is the Bohr magneton), with the -factor values depending on the direction of the applied field. For the main line, the -tensor components in the principal crystal axes are, , , consistent with the -plane geometry of the Cu orbital in Walters et al. (2009). For the satellite peak S1, , , while the S2 mode has isotropic -factor, . As explained in detail in Sup , these resonance lines correspond to two types of paramagnetic defects whose relative concentrations can be evaluated from the corresponding integral signal intensities normalized to the main signal: , , thus, establishing the exceptional quality of our single crystal samples Kojima et al. (2004); Sirker et al. (2007); Sup . In the following, we therefore focus the attention at the properties of the main spin system.
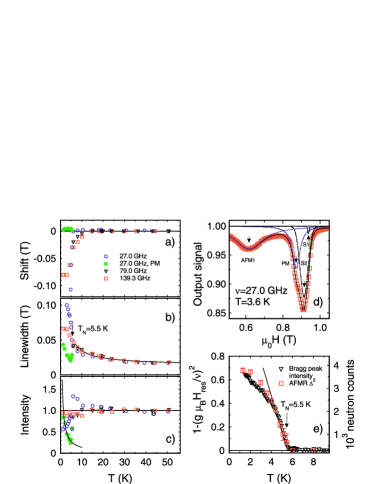
The temperature evolution of the principal resonance line is shown in Figure 2, (a–c). At , this mode narrows with the increasing temperature, concomitantly increasing in amplitude; its position does not change except in the vicinity of the ordering transition, at . The integral intensity remains practically constant, in agreement with the low- susceptibility of a chain Motoyama et al. (1996); Eggert et al. (1994); Starykh et al. (1997). Within the experimental accuracy, the linewidth appears to be independent of magnetic field (the excitation frequency), Fig. 2(b). Its temperature dependence is best described as (solid line). The contribution can be associated with a small anisotropy of the weak inter-chain coupling, Furuya and Sato (2015), where our estimate yields K, while the constant term accounts for other contributions Sup . According to Refs. Oshikawa and Affleck (1999, 2002); Maeda et al. (2005), the absence of a measurable contribution to the linewidth, as well as a very small observed dependent line shift, impose stringent upper limit on possible staggered fields, K, consistent with the ideal crystal structure of . The estimated linear contribution to the linewidth indicate an upper bound on the anisotropy of the intra-chain exchange, Oshikawa and Affleck (2002), which is further confirmed by the analysis of the AFMR spectra observed below Sup .
At temperatures below the transition into an ordered state, the resonance spectrum of markedly transforms. We observe a gradual shift of the principal resonance line at all measurement frequencies, , for , and in the low-frequency range for , which is consistent with the opening of gaps in the spin excitations spectrum (see upper curves in Fig. 1) foo . Assuming the relation for a field-dependent gapped mode in a two-sublattice antiferromagnet with weak anisotropy, , we obtain the temperature dependence of the gap, , which is directly related to the AFM order parameter, Prozorova and Borovik-Romanov (1969). The corresponding dependence for and GHz is shown in Fig. 2(e), along with the intensity of the magnetic Bragg peak measured by neutron diffraction, which also probes the square of the magnetic order parameter. The excellent agreement between the two measurements confirms unambiguously that we observe the AFMR, and that magnon modes develop at in a system of weakly ordered chains in in the frequency range probed in our experiments. The fit of the square of the order parameter in the vicinity of the ordering transition reveals linear temperature dependence consistent with the chain mean field (CMF) theory Schulz (1996), and yields the Néel temperature K in agreement with previous studies Kojima et al. (1997). The evolution of satellite modes S1, S2 below supports the conclusion that these signals originate from tiny amounts of defects and inclusions.
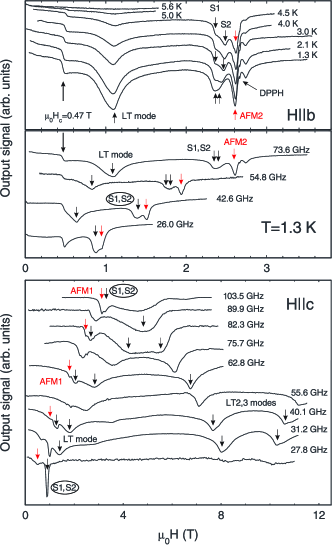
For , a step-like, non-resonant feature develops below , in addition to the resonance modes (Fig. 3, upper and middle panels). The magnetic field at which this feature arises, T, does not depend on temperature and frequency. This allows its identification with a spin-flop transition, where a jump in the real part of magnetic susceptibility leads to a step-like absorption feature (note that at zero field the ordered magnetic moments in are directed along the -axis Kojima et al. (1997)).
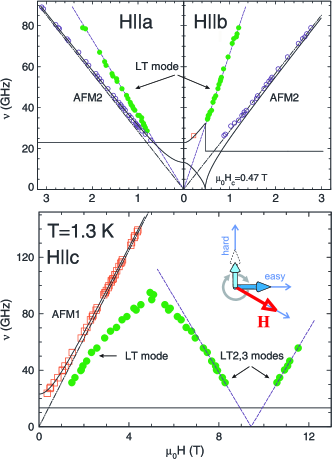
The behavior of the AFMR modes identified in our experiments for all directions of the applied magnetic field is equivalent to the spectrum of a collinear antiferromagnet with two inequivalent anisotropy axes (stipulated by the orthorhombic symmetry of ). The most general description of the low-energy spin dynamics of such a system is provided by the theory of spin hydrodynamics Andreev and Marchenko (1980). For a collinear antiferromagnet, such as at , this phenomenological theory predicts two pseudo Goldstone transverse spin wave branches, which correspond to our AFMR modes 1 and 2. Their resonance excitation energies for all three directions of magnetic field are accurately reproduced by the theory using only two parameters, GHz and GHz, for the gap values rendered by a small anisotropy to the two Goldstone magnons (lines 1 and 2, respectively). The critical field of the spin-flop transition, which is given by the relation, T ( is a -component of the -tensor), is in excellent agreement with the observed value.
Having thus unambiguously established the spinon confinement into the Goldstone magnons, giving rise to the AFMR in in the energy range covered in our measurements, , we now focus on another remarkable feature. For all directions of the magnetic field, we observe an intense line of resonance absorption, marked “LT mode” in Fig. 3. It has a roughly temperature-independent line width, several times larger than that of the AFMR modes. This line appears below and rapidly grows in intensity with no shift of the resonance field on further cooling. It reveals a novel magnetic excitation emerging in the ordered phase, which is both theoretically unanticipated and hitherto unobserved. For this type of signal consists of a single resonance line; for it only appears at (see middle panel of Fig. 3). Two additional signals are observable in the high-field range for , whose intensity drops precipitously at GHz (see data at 27.8 GHz and 31.2 GHz in Fig. 3).
The frequency-magnetic field diagram of Fig. 4 shows the experimental data for the field dependence of the novel LT mode (closed symbols) along with that of the conventional AFMR lines 1, 2. For , the LT mode follows linear dependence, , shown by dashed lines in the corresponding panels of Fig. 4. The fit yields a very large and anisotropic “effective factors”, and . The triple line observed for has a non-monotone field dependence, and appears to soften in high fields, possibly indicating a quantum phase transition. In the vicinity of the transition, T, the mode can be described by a critical-type linear dependence, , with a slope (dashed line in Fig. 4).
The nature of the spin system in suggests that the new mode could be related to the amplitude fluctuations of the order parameter (Higgs mode) in a weakly ordered system of spin-1/2 AFM chains. We note that no such mode was observed in CsNiCl3, a system of weakly coupled AFM spin-1 chains with a very similar K, nor in a spin-5/2 chain system CsMnBr3 ( K), where the ESR spectra are in full agreement with the spin hydrodynamics theory Zaliznyak et al. (1988, 1990). In the theory predicts an undetectable (for our field-scanning technique), field-independent AFMR modes (horizontal lines in Fig. 4), in addition to the observed field-dependent (pseudo Larmor) lines 1 or 2. An interaction of these Goldstone magnons with the amplitude (Higgs) mode provides a plausible mechanism by which they can acquire field dependent mass. At the origin of such coupling could be the spin anisotropy, which favors different amplitude of the ordered moment depending on its alignment with respect to the easy/hard axis. This is illustrated in the lower panel of Fig. 4, where the Larmor precession of the ordered magnetic moment around the applied field modulates its amplitude.
In summary, the observed ESR response in the weakly coupled spin-1/2 chain antiferromagnet shows nearly ideal 1D Heisenberg behavior in the Luttinger-liquid phase. In the weakly ordered AFM phase at , it reveals a novel, dominant excitation mode, which develops along with field-dependent gapped AFMR modes (transverse pseudo-Goldstone magnons) intrinsic to a collinear antiferromagnet with weak two-axial anisotropy. Recent analysis Tsvelik and Zaliznyak (2016) of the Heisenberg necklace model performed in the context of the present findings suggests that such a strongly field-dependent excitation cannot be explained by a coupling to the paramagnetic impurities, or the nuclear spins, and therefore must be a property of the bulk spins. This new mode is missed by the macroscopic theory of spin hydrodynamics, which describes pseudo Goldstone spin waves. It thus embodies a short-wavelength physics, and can be understood as a mixed mode of the longitudinal and transverse (LT) fluctuations of the order parameter, resulting from the interaction of the Goldstone magnon with the Higgs amplitude mode. Consistent with this mixed character is its substantial width, reflecting the universally damped Higgs mode, and a large width of the longitudinal mode indicated by other experiments Lake et al. (2005a, b); Zheludev et al. (2002). The observed softening of the novel LT mode at a critical field might then herald a symmetry breaking transition to the longitudinal spin density wave state, which is expected in a system of weakly coupled spin-1/2 chains in a field Grenier et al. (2015). While challenging the existing theories with disruptive novel results, our unexpected findings present exciting new opportunities for studying and understanding the interrelation of confinement, spontaneous symmetry breaking, and the Higgs physics.
Acknowledgements.
The authors thank A. I. Smirnov, L. E. Svistov, V. N. Glazkov, M. E. Zhitomirsky, A. Abanov and A. Tsvelik for useful discussions. The work at P. Kapitza Institute was supported by the Russian Fund for Basic Research, Grant 15-02-05918, and the Program of Russian Scientific Schools. The work at Brookhaven National Laboratory was supported by the Office of Basic Energy Sciences, U.S. Department of Energy, under Contract No. DE-SC00112704. We acknowledge the support of NIST, US Department of Commerce, in providing the neutron research facilities used in this work.References
- Merchant et al. (2014) P. Merchant, B. Normand, K. W. Kramer, M. Boehm, D. F. McMorrow, and C. Ruegg, Nat Phys 10, 373 (2014).
- Sato et al. (2011) T. Sato, K. Segawa, K. Kosaka, S. Souma, K. Nakayama, K. Eto, T. Minami, Y. Ando, and T. Takahashi, Nat Phys 7, 840 (2011).
- Lin et al. (2014) S.-Z. Lin, X. Wang, Y. Kamiya, G.-W. Chern, F. Fan, D. Fan, B. Casas, Y. Liu, V. Kiryukhin, W. H. Zurek, C. D. Batista, and S.-W. Cheong, Nat Phys 10, 970 (2014).
- Sherman et al. (2015) D. Sherman, U. S. Pracht, B. Gorshunov, S. Poran, J. Jesudasan, M. Chand, P. Raychaudhuri, M. Swanson, N. Trivedi, A. Auerbach, M. Scheffler, A. Frydman, and M. Dressel, Nat Phys 11, 188 (2015).
- Walters et al. (2009) A. C. Walters, T. G. Perring, J.-S. Caux, A. T. Savici, G. D. Gu, C.-C. Lee, W. Ku, and I. A. Zaliznyak, Nat Phys 5, 867 (2009).
- Lake et al. (2010) B. Lake, A. M. Tsvelik, S. Notbohm, D. Alan Tennant, T. G. Perring, M. Reehuis, C. Sekar, G. Krabbes, and B. Buchner, Nat Phys 6, 50 (2010).
- Zaliznyak (2005) I. A. Zaliznyak, Nat Mater 4, 273 (2005).
- Goldstone et al. (1962) J. Goldstone, A. Salam, and S. Weinberg, Phys. Rev. 127, 965 (1962).
- Andreev (1978) A. F. Andreev, Zh. Éksp. Teor. Fiz. 74 (1978); Soviet Journal of Experimental and Theoretical Physics 47, 411 (1978).
- Andreev and Marchenko (1980) A. F. Andreev and V. I. Marchenko, Usp. Fiz. Nauk 130, 39 (1980); Soviet Physics Uspekhi 23, 21 (1980).
- Higgs (2014) P. W. Higgs, Rev. Mod. Phys. 86, 851 (2014).
- Pekker and Varma (2015) D. Pekker and C. Varma, Annual Review of Condensed Matter Physics 6, 269 (2015).
- Schulz (1996) H. J. Schulz, Phys. Rev. Lett. 77, 2790 (1996).
- Essler et al. (1997) F. H. L. Essler, A. M. Tsvelik, and G. Delfino, Phys. Rev. B 56, 11001 (1997).
- Lake et al. (2005a) B. Lake, D. A. Tennant, C. D. Frost, and S. E. Nagler, Nat Mater 4, 329 (2005a).
- Lake et al. (2005b) B. Lake, D. A. Tennant, and S. E. Nagler, Phys. Rev. B 71, 134412 (2005b).
- Zheludev et al. (2002) A. Zheludev, K. Kakurai, T. Masuda, K. Uchinokura, and K. Nakajima, Phys. Rev. Lett. 89, 197205 (2002).
- Suzuura et al. (1996) H. Suzuura, H. Yasuhara, A. Furusaki, N. Nagaosa, and Y. Tokura, Phys. Rev. Lett. 76, 2579 (1996).
- Motoyama et al. (1996) N. Motoyama, H. Eisaki, and S. Uchida, Phys. Rev. Lett. 76, 3212 (1996).
- Kojima et al. (1997) K. M. Kojima, Y. Fudamoto, M. Larkin, G. M. Luke, J. Merrin, B. Nachumi, Y. J. Uemura, N. Motoyama, H. Eisaki, S. Uchida, K. Yamada, Y. Endoh, S. Hosoya, B. J. Sternlieb, and G. Shirane, Phys. Rev. Lett. 78, 1787 (1997).
- (21) See supplementary information for additional discussion .
- Kojima et al. (2004) K. M. Kojima, J. Yamanobe, H. Eisaki, S. Uchida, Y. Fudamoto, I. M. Gat, M. I. Larkin, A. Savici, Y. J. Uemura, P. P. Kyriakou, M. T. Rovers, and G. M. Luke, Phys. Rev. B 70, 094402 (2004).
- Sirker et al. (2007) J. Sirker, N. Laflorencie, S. Fujimoto, S. Eggert, and I. Affleck, Phys. Rev. Lett. 98, 137205 (2007).
- Eggert et al. (1994) S. Eggert, I. Affleck, and M. Takahashi, Phys. Rev. Lett. 73, 332 (1994).
- Starykh et al. (1997) O. A. Starykh, R. R. P. Singh, and A. W. Sandvik, Phys. Rev. Lett. 78, 539 (1997).
- Furuya and Sato (2015) S. C. Furuya and M. Sato, Journal of the Physical Society of Japan 84, 033704 (2015).
- Oshikawa and Affleck (1999) M. Oshikawa and I. Affleck, Phys. Rev. Lett. 82, 5136 (1999).
- Oshikawa and Affleck (2002) M. Oshikawa and I. Affleck, Phys. Rev. B 65, 134410 (2002).
- Maeda et al. (2005) Y. Maeda, K. Sakai, and M. Oshikawa, Phys. Rev. Lett. 95, 037602 (2005).
- (30) For , in addition to the gapped AFMR mode that develops below , a residual signal at the original paramagnetic position of the principal resonance line is observed at low frequencies. The decomposition of the typical resonance spectrum recorded at GHz and K into four components is shown in Fig. 2(d). On cooling below , the integral intensity of the “paramagnetic” component roughly follows the Curie law [closed symbols in Fig. 2(c)], which lets us associate this signal with a small amount of crystal structure defects, , e.g. in-chain/end-of-chain defects. Their contribution is not discernable at high frequency, GHz (Fig. 2), where we observe only a slight shift of the principal line to lower fields, consistent with the opening of the gap, . While the low-frequency resonance line exhibits pronounced anomaly at , the high-frequency mode is less sensitive to the transition into an ordered state (Fig. 2) .
- Prozorova and Borovik-Romanov (1969) L. A. Prozorova and A. S. Borovik-Romanov, Zh. Éksp. Teor. Fiz 55, 1727–1736 (1968); Soviet Journal of Experimental and Theoretical Physics 28, 910 (1969).
- Nagamiya et al. (1955) T. Nagamiya, K. Yosida, and R. Kubo, Advances in Physics 4, 1 (1955).
- Zaliznyak et al. (1988) I. A. Zaliznyak, V. I. Marchenko, S. V. Petrov, L. A. Prozorova, and A. V. Chubukov, Pis’ma Zh. Eksp. Teor. Fiz. 47 (1988); JETP Lett 47 (1988).
- Zaliznyak et al. (1990) I. Zaliznyak, L. Prozorova, and S. Petrov, Zh. Éksp. Teor. Fiz. 97 (1990); Soviet Physics - JETP 70, 203 (1990).
- Tsvelik and Zaliznyak (2016) A. M. Tsvelik and I. A. Zaliznyak, ArXiv e-prints (2016), arXiv:1605.09014 [cond-mat.str-el] .
- Grenier et al. (2015) B. Grenier, V. Simonet, B. Canals, P. Lejay, M. Klanjšek, M. Horvatić, and C. Berthier, Phys. Rev. B 92, 134416 (2015).