Early Science with the Large Millimeter Telescope: Observations of Extremely Luminous High-z Sources Identified by Planck
Abstract
We present 8.5″ resolution 1.1mm continuum imaging and CO spectroscopic redshift measurements of eight extremely bright submillimetre galaxies identified from the Planck and Herschel surveys, taken with the Large Millimeter Telescope’s AzTEC and Redshift Search Receiver instruments. We compiled a candidate list of high redshift galaxies by cross-correlating the Planck Surveyor mission’s highest frequency channel (857 GHz, FWHM = 4.5′) with the archival Herschel Spectral and Photometric Imaging Receiver (SPIRE) imaging data, and requiring the presence of a unique, single Herschel counterpart within the 150″ search radius of the Planck source positions with 350 µm flux density larger than 100 mJy, excluding known blazars and foreground galaxies. All eight candidate objects observed are detected in 1.1mm continuum by AzTEC bolometer camera, and at least one CO line is detected in all cases with a spectroscopic redshift between . Their infrared spectral energy distributions mapped using the Herschel and AzTEC photometry are consistent with cold dust emission with characteristic temperature between K and 84 K. With apparent infrared luminosity of up to , they are some of the most luminous galaxies ever found (with yet unknown gravitational magnification factor ). The analysis of their spectral energy distributions (SEDs) suggests that star formation is powering the bulk of their extremely large IR luminosities. Derived molecular gas masses of (for ) also make them some of the most gas-rich high redshift galaxies ever detected.
keywords:
galaxies: high-redshift – galaxies: starburst – submillimeter: galaxies – infrared: galaxies – galaxies:ISM – gravitational lensing: strong1 Introduction
Submillimetre bright galaxies (“SMGs” hereafter) have emerged as an important component in our understanding of the evolution of galaxy formation in dusty, high-mass, starburst systems (see the reviews by Blain et al., 2002; Casey et al., 2014). Studies of SMGs capture the dust enshrouded young stars and the supernovae remnants of massive early type OB stars within the cores of Giant Molecular Clouds (GMCs), revealing the nature of stellar assembly in the early universe through sub-mm through radio observations of thermal emission and molecular emission lines. SMG studies contribute to comprehensive multi-wavelength analyses of growth and evolution of some of the earliest forming galaxies emitting in the rest-frame IR (see Blain et al., 2002, and references therein). The epoch of massive galaxy formation and growth encompasses a rich period () of star formation, whereby parsec–to–kiloparsec scale GMCs are changing their distribution in the galaxy throughout various stages of merging, gas accretion and star formation. This epoch consists of active star formation rates that are particularly bright in the infrared to sub-millimeter ranges. The Planck mission’s all-sky survey (Planck Collaboration I, 2014) has proven to be useful in detecting highly luminous galaxies () over a wide range of redshift (Cañameras et al., 2015; Planck Collaboration XXVII, 2015; Planck Collaboration XXXIX, 2016). The Planck Collaboration predicted that Planck’s detectors would be sensitive to nearby galaxies as well as extremely high redshift galaxies, including SMGs that exhibit thermal dust emission reaching upwards to 100% in the far-infrared (FIR; see Efstathiou et al., 2000; Johnson et al., 2013). The high redshift SMGs have a local analog in the ultra-luminous infrared galaxies (ULIRGs). An intended cross-correlation between Herschel and Planck’s highest frequency channels has been acutely beneficial in discovering some of the most luminous IR galaxies, and recent Herschel observations using SPIRE instrument have revealed extremely luminous dusty star forming galaxies emitting in the IR (e.g., Casey et al., 2012, 2014; Heinis et al., 2013; Ivison et al., 2013). Covering the wavelengths up to 350 µm, the Planck survey is adept at detecting these highly luminous point sources across the entire sky; and, it is the first all-sky survey with the required sensitivity to systematically identify the most luminous sources in the Universe.
One of the key attributes that makes submillimetre surveys such as by Planck particularly powerful is the negative k-correction in the Rayleigh-Jeans (RJ) part of the thermal dust emission that uniquely allows a nearly distance-independent study of high redshift dusty IR sources as the relative flux density observed in the submillimetre wavelengths (200-1000 µm) is unaffected by redshift out to (Blain, 1998). This provides us with a remarkable ability to identify and investigate the frequency and the overall importance of these dusty starburst galaxies throughout the cosmic history of galaxy assembly. Within the past decade it has also become possible to detect the CO emission lines from these galaxies using ground-based telescopes and interferometers such as the Large Millimeter Telescope Alfonso Serrano (LMT), the Jansky Very Large Array (JVLA), and the Atacama Large Millimeter Array (ALMA). In addition to yielding secure spectroscopic redshifts for these optically faint population (e.g., Yun et al., 2012, 2015; Zavala et al., 2015), sensitive observations of CO emission in these galaxies can provide critical information on the total cold gas contents and their relation to the stellar and dark matter masses of the host galaxies and spatial distribution and dynamics of the ongoing star formation activities.
Given the large beam size () and the high confusion noise (100 mJy in the 857 GHz band), Planck-identified high redshift sources are likely exceptional objects, either strongly lensed (Cañameras et al., 2015; Geach et al., 2015) or highly clustered (Negrello et al., 2005; Fu et al., 2012; Clements et al., 2014). Observational data on strongly lensed objects usually require a detailed lensing model, requiring additional work to interpret the results. On the other hand, the magnifying property of a gravitational lens can reveal structural details of gas and star formation down to scales of 10 to 100 parsec, well beyond the reach of even ALMA or JVLA (e.g., Yun et al., 2007; Swinbank et al., 2011; Tamura et al., 2015). Lensing can also allow us to probe an intrinsically much fainter population (Knudsen et al., 2008, 2009; Dessauges-Zavadsky et al., 2015). One key motivation for this study is to identify strongly lensed SMGs from the Planck survey in order to exploit gravitational lensing and to probe physical details of star formation and gas properties that are not accessible through the conventional means.
Here, we present our identification of eight extremely luminous infrared galaxies successfully identified as intrinsically bright and likely lensed sources through a cross-correlation analysis between the archival Planck and Herschel database. This is a pilot study for a larger program to identify a large sample of extremely luminous high redshift SMGs identified by the Planck survey. In § 2 we discuss our selection methods for the gravitationally lensed SMG candidate sources. In § 3 we will discuss our observations of these Planck-Herschel sources using the LMT and it’s two instruments: Redshift Search Receiver (RSR) and AzTEC. In § 4 we present spectral energy distribution analysis of all of the target sources, and the detailed discussions of individual sources are summarized in § 5. Finally, the nature of these Planck-Herschel sources are discussed in the context of the gas and dust properties derived from the new LMT observations in § 6. We adopt a CDM cosmology with km s-1 Mpc-1 with , and throughout this paper.
2 Identification of Bright Planck-Herschel SMG Candidates
Our candidate Planck SMGs were selected primarily by cross-correlating the Planck Catalog of Compact Sources (PCCS), a dataset including roughly 24,000 point source objects (Planck Collaboration XXVIII, 2014), with the combined catalogs of three Herschel large area surveys: Herschel Multi-tiered Extragalactic Survey (HerMES, Oliver et al., 2012), Herschel Stripe 82 Survey (HerS-82, Viero et al., 2014), and Herschel DDT “Must-Do” Programmes. These Herschel source catalogs were generated using the public domain pipeline data products obtained from the Herschel Science Archive (HSA)111http://www.cosmos.esa.int/web/herschel/science-archive. We limited our searches only to the PCCS sources at Galactic latitude in order to minimize the Galactic source contamination.
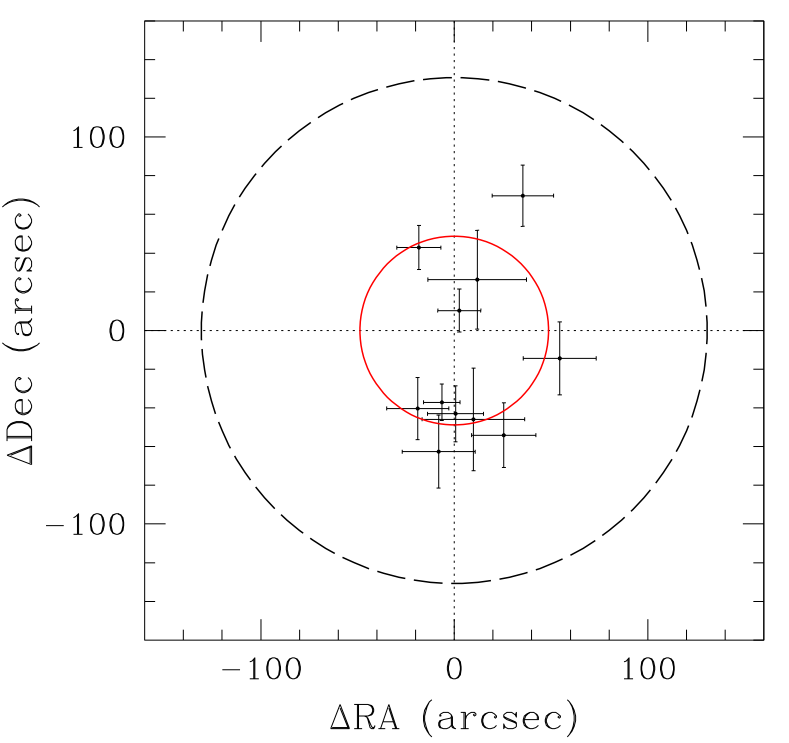
To begin, we identified all Herschel catalog sources located with a 150″ search radius (approximately the beam size of the Planck 857 GHz band) of every PCCS source catalog position. Low redshift galaxies can be eliminated using the SPIRE colour (see Wardlow et al., 2013). Negrello et al. (2010) and Wardlow et al. have reported a high efficiency (100% and 70%, respectively) of identifying lensed high redshift IR galaxy using mJy as a selection criteria. We adopt mJy as our selection method for the best candidate Herschel counterpart since our sample selection relies mostly on the Planck 857 GHz (350 µm) band detection. All counterparts identified with known blazars are also removed (see below). As seen in Figure 1, our final selected Herschel counterpart candidates lie within about 50″ () of the Planck source position. The presence of a point source with this flux density indicates a rare and truly luminous and dusty source given the thermal dust emission seen in typical spectral energy distribution models ( for a mJy source at ; e.g., Efstathiou et al., 2000; Casey et al., 2012). Through examining the models for the expected spectral energy distribution, sources peaking at 350 µm reveal a galaxy/galaxies at a high redshift (), whereby the UV-heated dust is redshifted from the infrared and strongly observed in the submillimetre to millimetre wavelengths. One good indicator of a high redshift luminous dusty galaxy is the characteristic flat spectral energy distribution in the submillimetre regime of the spectrum, with the dust peak occurring within the Herschel 250, 350, and 500 µm band. We note that the Planck 350 µm flux density is in some cases significantly larger than the Herschel 350 µm flux (see Table 3), partly because Planck confusion noise is high.
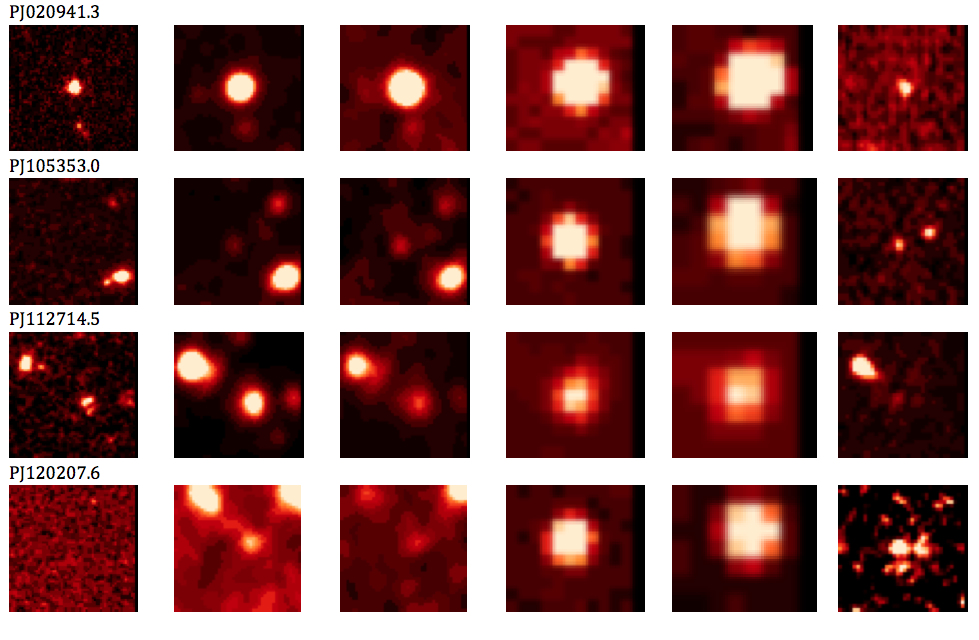
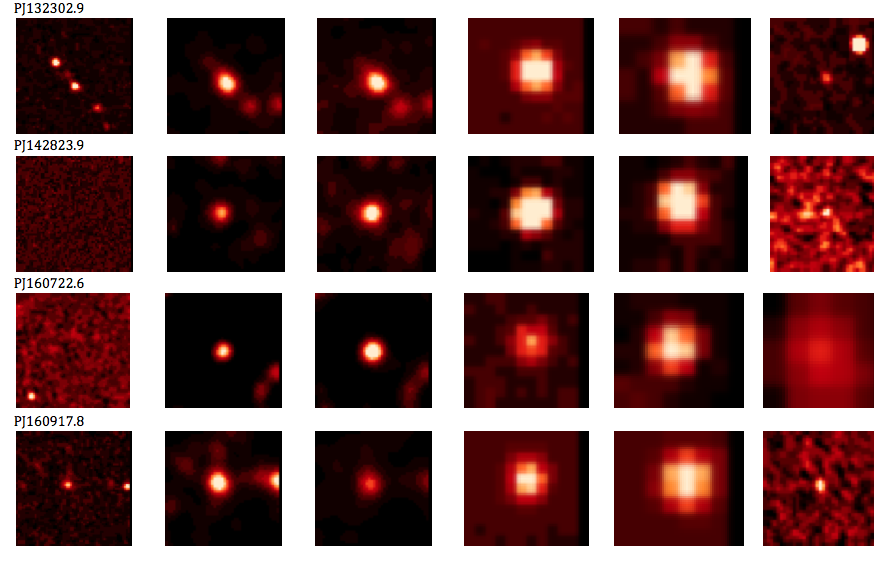
Given the large Planck beam size, we use the positions of the Herschel SPIRE 350 µm counterpart for identifying counterparts in other wavelengths. We exclude radio-loud AGNs and bright, late-type foreground galaxies () by first examining a 30″ search radius using NASA/IPAC Extragalactic Database (NED) and the all-sky point source catalog from the Wide Field Infrared Survey Explorer (WISE), the NRAO VLA Sky Survey (NVSS; Condon et al., 1998), and Faint Images of the Radio Sky at Twenty-Centimeters (FIRST; Becker et al., 1995; White et al., 1997). We obtained images of the majority of our sources using the Sloan Digital Sky Survey (SDSS) and the Second Palomar Observatory Sky Survey (POSS-II) database to look for any possible low redshift foreground galaxies missed by other methods, and extremely faint optical counterparts are also identified in some cases. We use WISE photometry to examine the apparent brightness of these sources in the 3.4, 4.6, 11, and 22 µm bands (see Table 5). If a source exhibits a strong detection in the 11 µm and 22 µm channels, a possibility of a power-law AGN is further explored.
2.1 PCCS 857 GHz and HerMES
The HerMES (Oliver et al., 2012) is one of the large Herschel cosmology surveys spanning a total of 94.8 deg2 in combined area. We constructed a master catalog of 139,270 sources from the SPIRE photometry taken from 9 independent fields. Overall there are 19 Planck point sources falling within these survey areas, and 250 matched Herschel sources are identified with them. For each of the 19 Planck sources there are on average 13 Herschel sources found within our 2.5′ search radius. We identified 15 of these Planck objects having at least one Herschel SPIRE detection with a 350 µm flux density at or greater than 100 mJy.
Using NED we found that 13 of the Planck candidate sources with a bright Herschel counterpart are associated with low redshift galaxies or galaxy pairs. The remaining two Planck candidates are likely to be luminous high redshift sources due to their exceedingly high flux, flat SED across the three SPIRE bands, and the absence of any bright optical counterparts in the SDSS or POSS-II plate images. One of which is found in the Akari Deep Field, with a flux density greater than 300 mJy in the SPIRE 350 µm band. Because of its declination being out of reach for the LMT, this source is excluded from our follow up investigation. The last remaining source has been identified as a rediscovery of MIPS J142824.0+352619 (), also identified by Wardlow et al. (2013) as a gravitationally lensed candidate. Further information on this source is found in § 5. We note that Clements et al. (2014) found proto-cluster candidates in the same fields by cross-correlating the PCCS with the Herschel catalogues.
2.2 PCCS 857 GHz and Herschel-Stripe 82 Survey
Viero et al. (2014) released Herschel band-merged catalog of 27,257 point sources in the HerS-82 survey. Covering 79 deg2, this is another major Herschel wide area survey. It had been predicted by Viero et al. that the HerS-82 survey has the ability to detect roughly 100 IR galaxies at high redshift (i.e. at ). There are 42 Herschel catalog matches to 16 Planck candidate sources found in this survey area, and on average there are 2 to 3 Herschel sources found within our 2.5′ search radius. Of these original 16 Planck sources we discover 7 objects with a Herschel counterpart with mJy. Of these 7 sources, Herschel data show that two are bright, low-z galaxies: CGCG 385-062 ( with mJy) and NGC 585 ( with mJy). One well-known flat spectrum radio quasar, LBQS 0106+0119 (), is also rediscovered with its red SPIRE colour. The four remaining sources are included in our list of high redshift SMG candidates. One of these sources has no NED match, and two are associated with a faint SDSS source, while the final source is associated with a 2MASS source. Because of scheduling restrictions, we were able to conduct follow-up observations for only one (PJ020941.3) of these sources using the LMT, and only this source is considered part of our Planck sample presented in this study.
2.3 PCCS 857 GHz and Herschel DDT “Must-Do” Survey
The Herschel DDT “Must-Do” Survey222http://herschel.esac.esa.int/MustDo_Programmes.shtml is a targeted imaging survey of 199 PCCS sources using the Herschel-SPIRE instrument, designed to investigate the nature of these Planck sources. We identify a total of 75 Herschel sources matched to 21 Planck sources meeting our selection criteria. On average there are 3 to 4 Herschel sources within the search area for each of the Planck sources, and we identified a total of 13 Herschel sources with mJy. We further excluded six well-known Quasi-Stellar Objects (QSOs) whose submillimetre emission is not associated with dust: PKS 2252-282, PKS 0402-362, ESO 362-G021, PKS 0537-441, 3C 279, and PKS 1335-127. One Planck source is the Herschel resolved bright, low-z galaxy, NGC 5777 ( with mJy). The remaining six Planck-Herschel counterparts are included in our selection of targets likely to be high redshift SMGs.
Unknown to us initially, the Planck instrument team has its own program to identify and study high redshift galaxies in their survey, and this Herschel DDT “Must-Do” Survey is apparently part of their effort to verify the candidate high redshift Planck sources using higher resolution images (Cañameras et al., 2015). Five sources (PJ105353.0, PJ112714.5, PJ1202007.6, PJ132302.9, PJ160917.8) are in common between Cañameras et al. sample and our sample. Detailed comparisons of individual objects are given in § 5.
| ID | RA | DEC | RSR | AzTEC | ||
|---|---|---|---|---|---|---|
| (J2000) | (J2000) | Dates | Int. Time (mins) | Dates | Int. Time (mins) | |
| PJ020941.3 | 02h09m41.3s | +00d15m59s | 1/19/14 | 60 | 1/24/14 | 10 |
| PJ105353.0 | 10h53m53.0s | +05d56m21s | 1/12/14 | 30 | 1/12/14 | 3.0 |
| PJ112714.5 | 11h27m14.5s | +42d28m25s | 1/31/14 | 60 | 5/17/14, 5/19/14 | 5.0, 10 |
| PJ120207.6 | 12h02m07.6s | +53d34m39s | 2/3/14 | 30 | 2/7/14 | 10 |
| PJ132302.9 | 13h23m02.9s | +55d36m01s | 3/21/14 | 20 | 5/10,14, 5/17/14, 5/19/14 | 10, 10, 10 |
| PJ142823.9 | 14h28m23.9s | +35d26m20s | 3/21/14 | 30 | 6/14/14 | 20 |
| PJ160722.6 | 16h07m22.6s | +73d47m03s | 3/21/14, 4/29/14 | 60 | 5/10/14, 5/19/14 | 10, 40 |
| PJ160917.8 | 16h09m17.8s | +60d45m20s | 3/21/14 | 20 | 3/22/14, 5/17/14 | 5.0, 10 |
3 LMT Observations
Here we present our observations of the bright Planck-Herschel sources using the LMT (Hughes et al., 2010) atop the 15,000 ft high Volcan Sierra Negra in Puebla, Mexico. During the Early Science (ES) campaign when our observations were taken, the LMT was operating with a primary reflector consisting of 3 rings of fully functioning active surface system, totaling 32.5-m in diameter. Two facility instruments were available: the Redshift Search Receiver (a broadband spectrometer system covering 72-111 GHz with a 38 GHz in total bandwidth, Erickson et al., 2007) and AzTEC (1.1mm imaging camera with 144 pixels, Wilson et al., 2008). All eight Planck-Herschel sources presented here are observed with both instruments.
| ID | Line | ||||||
|---|---|---|---|---|---|---|---|
| (GHz) | (km/s) | (Jy km/s) | ( K km/s pc2) | () | |||
| PJ020941.3 | 97.314 | CO (3–2) | |||||
| PJ105353.0 | 86.334 | CO (3–2) | |||||
| PJ112714.5 | 106.870 | CO (3–2) | |||||
| PJ120207.6 | 100.471 | CO (3–2) | |||||
| PJ132302.9 | 101.208 | CO (3–2) | |||||
| PJ142823.9 | 99.125 | CO (2–1) | |||||
| PJ160722.6 | 92.883 | CO (2–1) | |||||
| PJ160917.8 | 81.262 | CO (3–2) | |||||
| 108.326 | CO (4–3) |
(1) A conversion of 7 Jy/K is adopted to convert the measured antenna temperature in to flux density, using the calibration factor derived between December 2013 and January 2014.
(2) Unknown lensing amplification is reflected in the derived CO luminosity and mass as & .
3.1 Redshift Search Receiver Measurements
Our observations include redshift measurements taken with the Redshift Search Receiver operating in the frequency window of 73–111 GHz, with 4 detector pixels organized in a dual–beam, dual–polarization configuration. The RSR beam-switches at 1 kHz between the two beams separated by 78 in Azimuth direction on the sky, providing a stable baseline. The backend receiver consists of an auto-correlator system that covers a total of 38 GHz spectral bandwidth simultaneously with a spectral resolution of 31.25 MHz. Table 1 provides information of the integration time for each source. For the majority of the sources a CO line was evident within 15 minutes of integration, and only 3 of our sources needed a longer integration to yield a CO detection with a ratio .
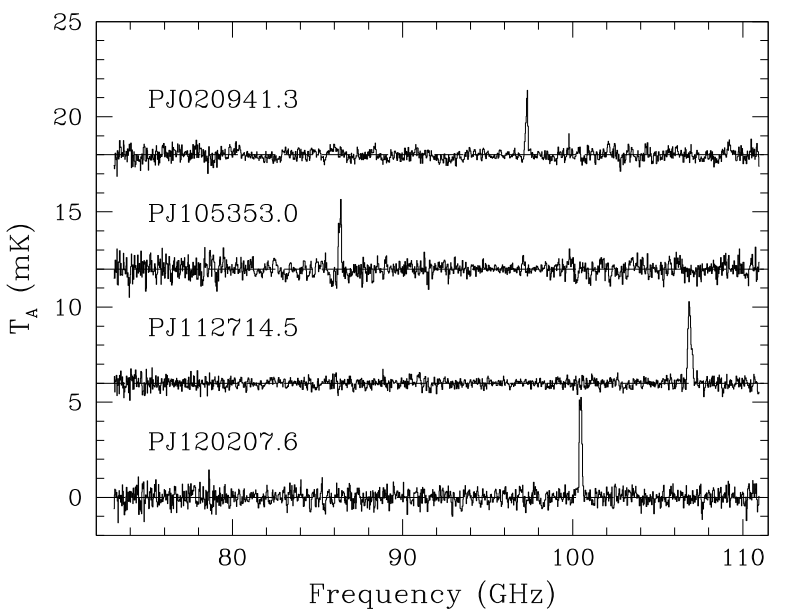
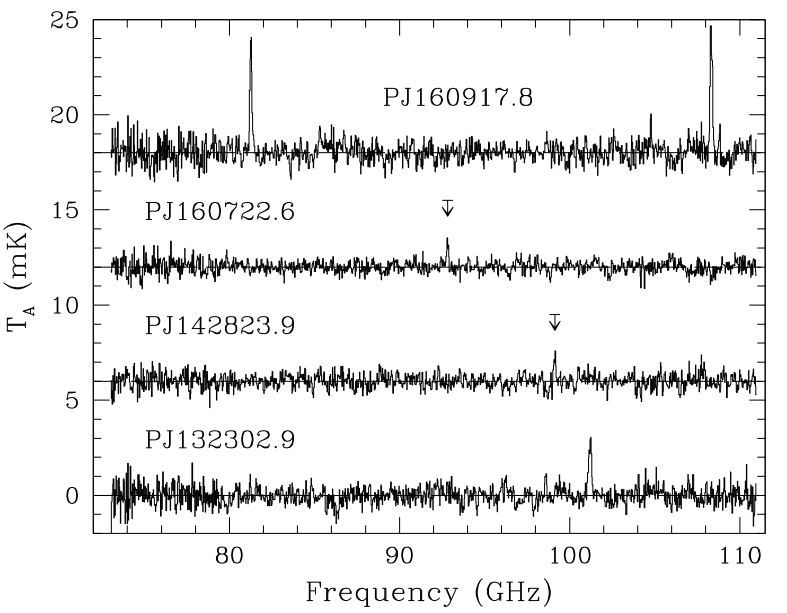
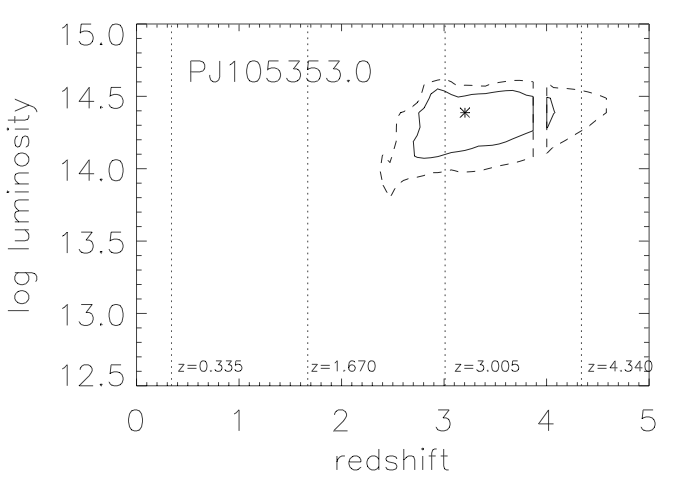
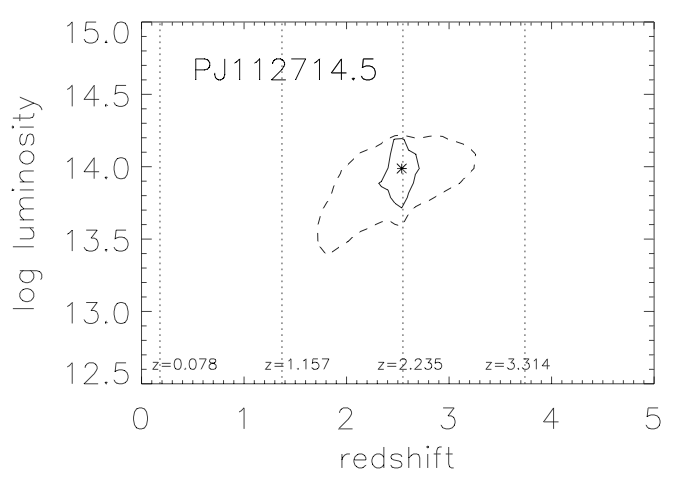
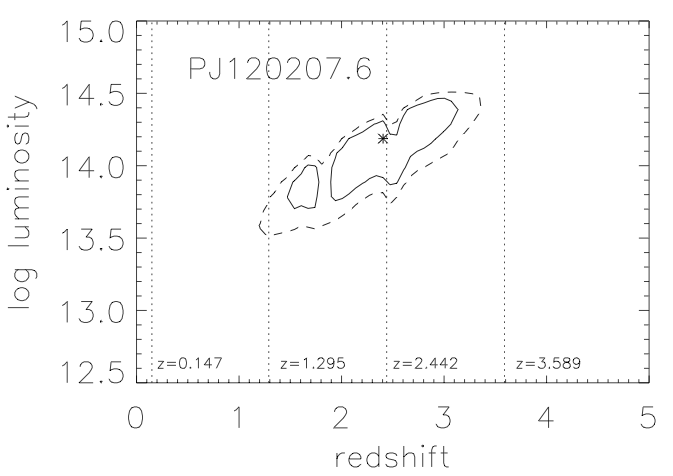
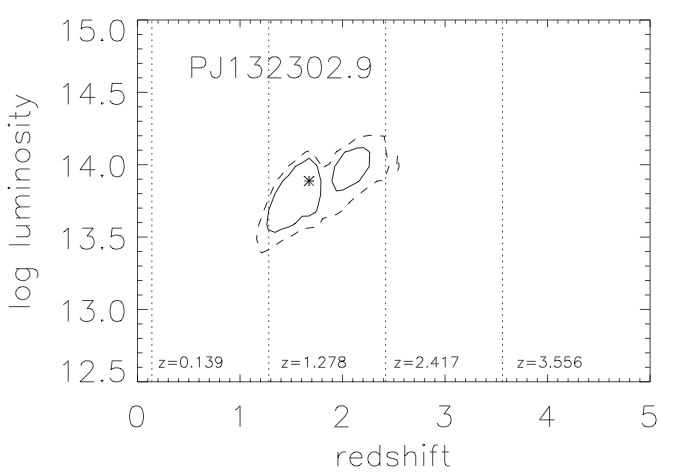
The measured RSR spectra of all eight observed sources covering the entire redshift range are shown in Figure 2, and the measured and derived CO line quantities are summarized in Table 2. As discussed in detail by Yun et al. (2015), two or more CO transitions fall within the RSR spectral band at , and a unique redshift for the CO source can be determined from the RSR spectrum alone (as is the case for the source PJ160917.8). If only one CO line is detected as in the seven out of eight cases shown in Fig. 2, additional information is required to determine the exact redshift. We derive a unique redshift for all eight Planck-Herschel sources observed using their panchromatic photometric redshift support as discussed in Appendix A.
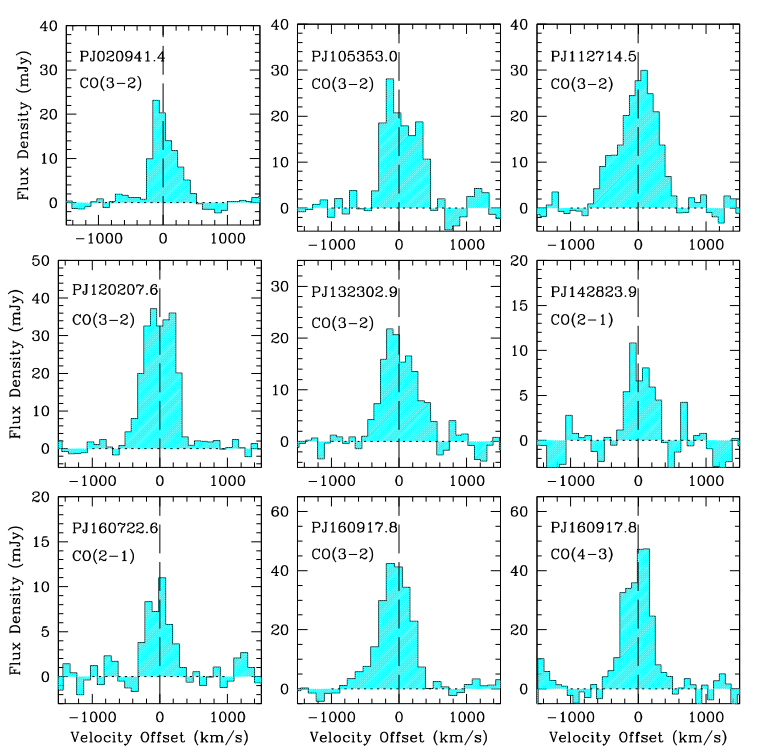
The zoom-in view of the individual CO lines in Figure 3 clearly shows that all of the CO lines are fully resolved by the RSR, some with the characteristic “top hat” profile commonly seen for CO lines in rotationally supported galaxies, while others show an asymmetric profile of a more complex kinematics, perhaps resulting from differential lensing. The measured line widths , corrected for the instrumental resolution (see appendix), ranges between 372 and 652 km s-1. For the five sources in common with Cañameras et al. (2015), the measured line widths and line integrals agree well with theirs, with the median ratios of 1.1 and 0.81, respectively, except for PJ105353.0 (our line width and line flux are factors of 1.6 and 1.9 larger).
The CO line luminosity, , is computed for each observed CO transition using Eq. (3) by Solomon et al. (1997),
with in Jy km s-1, in GHz, and in Mpc. The molecular gas mass is derived first by converting these line luminosities to using the average “SMG” ratios of , , and (Carilli & Walter, 2013) and then applying the standard CO-to- conversion factor of [K km s-1 pc2]-1 (Bolatto et al., 2013). As discussed in detail by Bolatto et al. in their review article, this conversion from to can vary by a factor of up to 5 or more, depending on metallicity, excitation, and dynamical state of the gas. However, there are no compelling reasons to believe any of these concerns are important for these Planck-Herschel or other high redshift sources (see the detailed discussions by Scoville et al., 2015), and we adopt the standard Galactic conversion factor. The derived molecular gas masses (uncorrected for an unknown magnification factor ) are extremely large and make these Planck-Herschel sources some of the most luminous CO emitters ever detected – see Figure 9 by Carilli & Walter (2013) for a comparison. One of these sources, PJ020941.3, is already shown to be a strongly lensed object with a magnification of (Geach et al., 2015), yielding the intrinsic gas mass of . Even if they are all strongly magnified with , their gas masses corrected for lensing are still comparable to some of the most gas-rich SMGs ever studied.
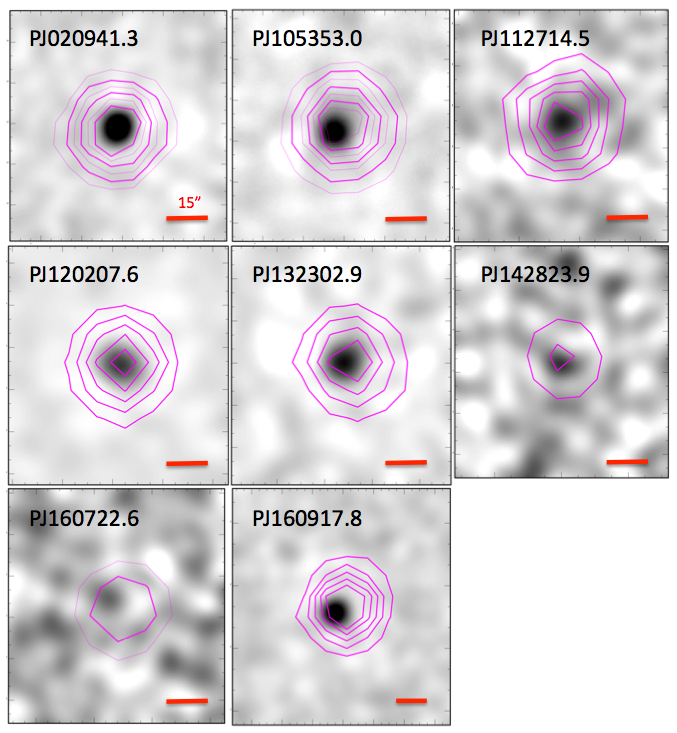
3.2 AzTEC Measurements
Continuum observations were made with the AzTEC camera (Wilson et al., 2008), a 1.1mm continuum camera that is a facility instrument on the LMT between March 21 and May 18 of 2014. Only the inner 32-m diameter area of the LMT’s primary mirror was illuminated during these Early Science observations, leading to a beam diameter (FWHM) of 8.5″. The telescope executed a modified Lissajous pattern in order to modulate the telescope bore-sight on the sky. This pattern is described in Wilson et al. (2008) though the pattern parameters were adjusted for the LMT to provide a fully-sampled 1.5′ area of sky with near-uniform coverage. For each source, the pattern was centered on the location of the Herschel source coordinates matched to the low resolution Planck point source detections. The observations were made over a wide range of atmospheric conditions with 225 GHz opacities ranging from to 0.3. On-source integration times varied from 3-40 minutes depending on the quality of the detection as measured in real time. Pointing corrections were applied for each observation based on pointing measurements of nearby radio quasars made immediately prior to or immediately following the science observation. The measured pointing corrections with respect to the nominal LMT pointing model were ″ in azimuth and ″in elevation.
AzTEC observations were calibrated using a set of 106 beam-maps of bright radio quasars and asteroids made during the full observing season. The full set of maps were used to measure the elevation-dependent gain of the telescope. For these observations a correction as large as a factor of 1.4 in gain was required for the lowest-elevation observations. The resulting flux uncertainty, as measured by a concurrent monitoring program is 10 per cent. We note that, starting from the fall of 2014, the removal of an astigmatism term from the primary mirror using the active surface system resulted in a flat gain curve for the entire elevation range.
The data for each source was reduced using the AzTEC Standard Pipeline described in detail in Wilson et al. (2008) and Scott et al. (2008). Since we are nominally searching for point sources, we use the standard Wiener filtering technique described in Perera et al. (2008). The pipeline produces a filtered signal map (in Jy/beam), a filtered weight map (in beam2/Jy2), and a filtered point spread function. Because of the Wiener filter, the flux of any detected point source may be read directly from the peak-flux pixel near the center of the source. A typical noise in the AzTEC images is mJy, and our target sources are detected with = 4-20 (see Fig. 4). These values are reported in Table 3, with a minimum measurement uncertainty of 10 per cent for sources detected with .
| Source ID | (mJy) | (mJy) | (mJy) | (mJy) | (mJy) |
|---|---|---|---|---|---|
| PJ020941.3 | |||||
| PJ105353.0 | |||||
| PJ112714.5 | |||||
| PJ120207.6 | |||||
| PJ132302.9 | |||||
| PJ142823.9 | |||||
| PJ160722.6 | |||||
| PJ160917.8 |
4 Spectral Energy Distribution Analysis of the Planck-Herschel Sources
4.1 Modified Blackbody Model
We explore constraints on the infrared luminosity and attempt to characterize the dust emission for these systems by analyzing their SEDs using a modified blackbody model. We adopt the functional form based on the derivation by Yun & Carilli (2002) for the modified blackbody model. A detailed accounting of our method is outlined in Appendix C. As summarized in Table 4, the characteristic dust temperature and IR luminosity, derived primarily from the three Herschel SPIRE band photometric measurements (250, 350, and 500 µm) and the AzTEC 1100 µm continuum measurements (see Table 3), range between 43-84 K and . There is a good constraint on most sources (see Fig. 12), although dust temperature is not constrained well for some of our sources. The best fit models are also shown in solid magenta lines in Figure 5, suggesting that the wavelength coverage of our photometric data is not sufficient to fully probe their dust SED in some cases. The star formation rates in Table 4 are calculated using the empirical calibration by Kennicutt (1998), corrected for the Kroupa IMF [i.e., ].
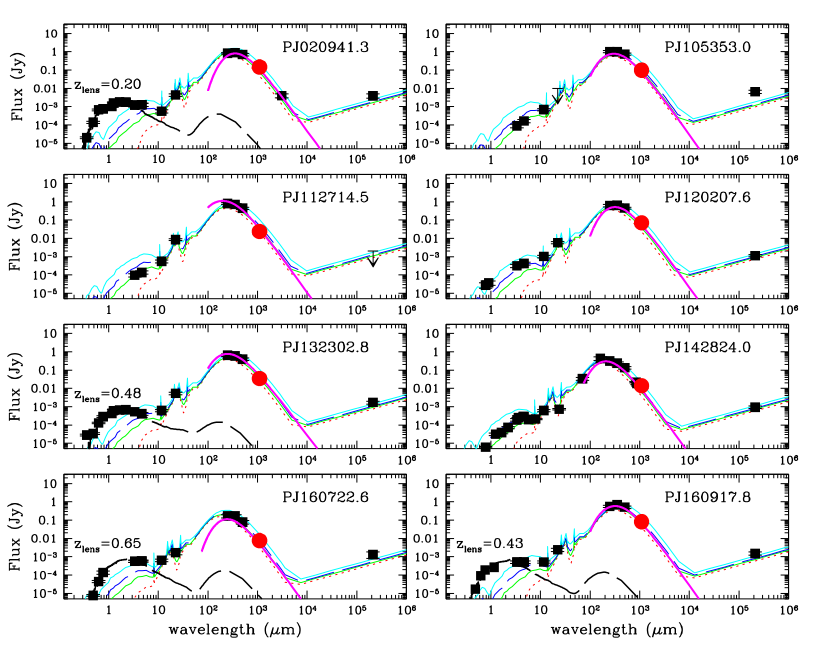
4.2 Template SED Analysis
In addition to their Herschel SPIRE and AzTEC photometry that trace the peak of the dust SED, all eight Planck-Herschel sources are clearly detected in a wide range of wavelength bands, from optical to radio as shown in Figures 6 & 7 (also see Table 5). By analysing these SEDs using model templates, it may be possible to gain additional insights into the nature of their extreme luminosity. In particular, we compare the observed SEDs with the model SEDs of young stellar clusters embedded in a giant molecular cloud and evolved by different amounts of time by Efstathiou et al. (2000) in Figure 5. Since the discrete SED templates available cannot be tuned for a particular object, especially in the UV, optical, and near-IR where source and dust geometry can lead to a large dispersion, we only fit the long wavelength data at µm. The good agreement between the data and the models suggests that intense star formation activities can account for most of the observed properties in nearly all cases. The radio to millimeter wavelengths part of the SED is constructed using the well established radio-IR correlation for star forming galaxies as described by Yun & Carilli (2002), and the observed 1.4 GHz radio emission is also consistent with the radio and IR luminosity being powered by a pure starburst in nearly all cases – see additional discussions on the nature of the powering source in § 6.1.2.
Using the best fit SED models shown in Figure 5, we compute the template based IR luminosity () between 8-1000 µm and star formation rate for each Planck-Herschel source (see Table 4). The IR luminosity derived from the best fit template SED ranges between , in good agreement with the estimates from the modified blackbody model calculation discussed above (§ 4.1). This is not surprising given that the Herschel SPIRE photometry points constrain the bulk of the luminosity in both models.
A significant deviation from the Efstathiou templates is seen in the rest frame optical portion of the SEDs in at least four cases. A subset of these sources are already known to be lensed by a foreground galaxy (see § 5 and Cañameras et al., 2015), and the presence of one or more foreground lensing galaxy along the same line of sight is naturally expected. Indeed, for PJ020941.3, PJ132302.8, PJ160722.6, and PJ160917.8, an addition of an elliptical galaxy SED by Polletta et al. (2007) nicely accounts for the excess flux in the rest frame optical bands, as shown in Figure 5. This photometric evidence for a foreground lensing galaxy is further discussed below for individual objects (see § 5).
| Source ID | |||||||
|---|---|---|---|---|---|---|---|
| ( | ( yr-1) | (K) | ( | ( yr-1) | () | () | |
| PJ020941.3 | 21,276 | 15,027 | |||||
| PJ105353.0 | 30,681 | 29,983 | |||||
| PJ112714.5 | 12,021 | 23,816 | |||||
| PJ120207.6 | 15,000 | 10,639 | |||||
| PJ132302.9 | 13,085 | 13,393 | |||||
| PJ142823.9 | 2,138 | 2,123 | |||||
| PJ160722.6 | 1,503 | 1,064 | |||||
| PJ160917.8 | 21,226 | 21,226 |
† is the far-infrared luminosity derived by integrating between 8-1000 µm in wavelength (Sanders & Mirabel, 1996). The exceedingly high dust masses are likely magnified by an unknown magnification factor due to lensing.
| Source ID | (mJy) | (mJy) | (mJy) | (mJy) | (mJy) | (mJy) | (mJy) |
|---|---|---|---|---|---|---|---|
| PJ020941.3 | |||||||
| PJ105353.0 | … | ||||||
| PJ112714.5 | |||||||
| PJ120207.6 | … | … | … | ||||
| PJ132302.9 | |||||||
| PJ142823.9 | … | … | … | … | |||
| PJ160722.6 | … | … | … | ||||
| PJ160917.8 |
(1) For JHK Photometry, a star(*) indicates a UKIDSS photometry while the remaining photometry come from the 2MASS catalog.
5 Analysis of Individual Sources
5.1 PJ020941.3
PJ020941.3 is a Planck source found in the Herschel-Stripe 82 Survey field and is associated with the galaxy SDSS J020941.27+001558.5. Our photometric redshift analysis predicts a lensed, dusty starburst galaxy at with the dust peak near 350 µm with mJy. We detect 1100 µm continuum emission easily using AzTEC, measuring mJy, centered on the Herschel source position (see Fig. 4). Using the RSR we detected CO (3-2) line at 97.31 GHz, yielding a redshift of (a single line redshift resolved using the photometric redshift support as shown in Fig. 11).
The nature of this source, also known as ‘9io9’ (Geach et al., 2015), is unique due to the fact that two unrelated research teams have identified it entirely independently. Our initial selection of PJ020941.3 arose from matching Planck’s 857 GHz position coordinates to Herschel SPIRE observations in the HerS-82 survey (see 2.3). As we were ready to observe this source using the LMT, a Director’s Discretionary Time request was made by an independent team based in the United Kingdom. The preliminary results from VISTA-CFHT Stripe 82 survey (Geach et al. in prep) were combined to form multiple band images of potential lens candidates. Tens of thousands of images were passed along to the SPACEWARPS citizen science project (Marshal et al. in prep, More et al. in prep), whereby this collaboration made its way to the British Broadcasting Corporation (BBC) Stargazing Live! broadcast from 7th January 2014 to 9th January 2014. Citizen scientists were trained to identify the features reflective of gravitational lensing, and the partial red Einstein ring of ’9io9’ was chosen as the best lens candidate. Their follow-up spectroscopy yielded redshifted optical emission lines at , and their lensing model constructed from near-infrared imaging data suggests a lensing magnification of .
5.2 PJ105353.0
One of Planck sources observed by the ”Must-Do” Herschel SPIRE program, PJ105353.0, also known as the radio source NVSS J105352+055623, is one of our brightest sources. It has a 350 µm flux density of mJy, and it peaks in the 250 µm band at mJy. This is the second brightest AzTEC source we detected with mJy, well centered on the Herschel SPIRE 350 µm peak position (see Fig. 4). The bright line detected by the RSR at 86.334 GHz (Fig. 2) is robustly identified as CO (3–2) line by the photometric redshift support (see Fig. 11), placing this object at . No bright optical source is seen on any of the SDSS images. Its flat spectral energy distribution in the SPIRE bands clearly indicates that this is indeed a high redshift source, and its exceedingly high flux is expected to be a lensed thermal emission from a dusty background source. The 1.4 GHz radio continuum reported by the NVSS, mJy, is slightly above what is expected from its far-IR emission (see Fig. 5), and this “radio-excess” may be an indication of a radio AGN (see Yun et al., 2001). Cañameras et al. (2015) identify the single line detected using the IRAM 30m telescope as CO (3–2) line at “”, and their 2″resolution 870 µm image obtained using the Submillimeter Array (SMA) shows a single source without clear evidence for lensing.
5.3 PJ112714.5
PJ112714.5 is a Herschel “Must-Do” survey source and is one of our brightest sources with a flat SED across the Herschel SPIRE channels, peaking in the 250 µm band. An AzTEC source with mJy is detected coincident with the Herschel source as seen in Fig. 4, and it has a red WISE mid-IR counterpart with detections in all four bands. The observed SED supports the RSR detected line at 106.877 GHz to be CO (3-2) at a (see Fig. 11). Cañameras et al. (2015) identify the single line they detected using the IRAM 30m telescope as CO (3–2) line at “”. Their 2″resolution 870 µm SMA image shows a single, slightly extended source without a clear optical counterpart, offset from a group of galaxies at , suggesting possible lensing by a galaxy group rather than by a single foreground galaxy (e.g., George et al., 2013; Timmons et al., 2015). An NVSS radio source with mJy (see Fig. 6) is also found just 18 ″ away, suggesting a rather confused and busy foreground environment.
5.4 PJ120207.6
PJ120207 is another Herschel “Must-Do” survey source and is one of our brightest 350 µm peakers ( mJy) with . The observed SED is flat across the 250 and 350 µm bands and drops slightly at 500 µm. An AzTEC source with mJy is detected coincident with the Herschel source as seen in Fig. 4, and it has a red WISE mid-IR counterpart with detections in all four bands. No optical galaxy is found at the AzTEC position, but there is an SDSS source (SDSS J120207.68+533432.5) located 6.8″ away from the AzTEC position, and this galaxy is a possible lensing source (Cañameras et al., 2015). The RSR has detected a single line at an observed frequency of 100.501 GHz, which we identify as CO (3–2) line at . Cañameras et al. (2015) identify the same line detected using the IRAM 30m telescope as CO (3–2) line at “”. Their 2″resolution 870 µm SMA image shows two sources separated by about 4″, suggesting lensing by a foreground galaxy. No radio counterpart is found for this object in the VLA FIRST survey.
5.5 PJ132302.9
PJ132302 is a bright 350 µm source ( mJy) with , and the dust peak of this Herschel “Must-Do” survey source occurs in the 250 µm band with mJy. An AzTEC source with mJy is detected coincident with the Herschel source as seen in Fig. 4, and it also has a red WISE mid-IR counterpart with detections in all four bands (see Fig. 7). The SDSS image shows a crowded field with a cluster of sources that are identified as “stars” by the SDSS database. The nearest match to the WISE source is SDSS J132302.83+5535555.1, which is consistent with a galaxy when analysed together with the WISE and 2MASS photometry (see Fig. 5), possibly representing the foreground lensing galaxy. The RSR has detected a single line at an observed frequency of 101.202 GHz, which we identify as CO (3–2) line at . Cañameras et al. (2015) identify the same line detected using the IRAM 30m telescope as CO (3–2) line at “”. Their 2″resolution 870 µm SMA image shows an unresolved source centered on a faint optical source about 3″northeast of the SDSS galaxy. The 1.4 GHz FIRST source VLA J132303.1+553558.6 with mJy coincides with the SMA source position.
5.6 PJ142823.9
PJ142823.9 is a bright Herschel source previously identified as ‘HBootes03’ by Wardlow et al. (2013) and is also a well-known Spitzer-identified hyperluminous infrared galaxy (HyLIRG) MIPS J142824.0+352619 (Borys et al., 2006; Swinbank et al., 2006). An extensive discussion of this object is found in these papers, and here we highlight only the details relevant to our discussions. We identify the line detected at 99.131 GHz as that of CO (2–1) line at , and our measured line integral of Jy km s-1 and the line width of km s-1 agree very well with the previously reported Nobeyama Millimeter Array measurements by Iono et al. (2006, Jy km s-1, km s-1). Borys et al. (2006) have suggested gravitational lensing by a foreground as a possible explanation for the large IR luminosity, with a modest magnification factor (). Hailey-Dunsheath et al. (2010) detected the 158-µm [C II] fine-structure line and derived a relatively large ratio of , much higher than those found in the local ULIRGs and high-redshift QSOs and more similar to the values seen in the local starburst galaxies like M82. This large ratio would also be naturally explained by gravitational lensing.
5.7 PJ160722.6
PJ160722.6 is the faintest Herschel source matched with the Planck catalog, with mJy and mJy, and its flat SED across the Herschel SPIRE bands is suggestive of a high redshift source. Our AzTEC imaging revealed a relatively faint source coincident with the Herschel source (see Fig. 4), with mJy. This source is detected in all four WISE bands (see Fig. 7), but its mid-IR SED is flatter than those of the others. When combined with the photometry from the United States Naval Observatory B1.0 Catalog (Monet et al., 2003), the optical to mid-IR SED indicates the presence of a foreground galaxy at (see Fig. 5), likely lensing the background SMG. The single line detected by the RSR at 92.826 GHz is identified as the redshift CO (2–1) line at when analysed together with its panchromatic SED, as shown in Fig 11. Its relatively low redshift and modest brightness in the Herschel bands indicates that PJ160722.6 is a comparatively low luminosity () object, similar to PJ142823.9 discussed above. A faint NVSS 1.4 GHz radio source ( mJy) is also found on the Herschel source position (see Fig. 7).
5.8 PJ160917.8
PJ160917 is another bright Herschel SPIRE source in the “Must-Do” survey and a “350 µm peaker” with mJy. It has a bright WISE counterpart with a relatively flat SED across its four bands, and it also has a relatively bright optical counterpart in SDSS J160918.25+604522.2 with (see Fig. 7). A bright AzTEC source with mJy, unresolved by the 8.5″beam, is detected with a high , coincident with the Herschel source position (see Fig. 4). Our RSR spectrum shows 2 bright lines (see Fig. 2), unambiguously identifying it as the highest redshift object in our sample at . Cañameras et al. (2015) report just one CO line at “”, and their 2″resolution 870 µm SMA image shows a classic lensing morphology of a partial arc, around the presumed lensing galaxy at . The 1.4 GHz FIRST VLA source with mJy coincides with the SMA source position.
5.9 Summary on Individual Sources
The well-studied object with the most extensive complementary data, PJ020941.3, is clearly shown to be a high redshift hyperluminous IR galaxy lensed by a foreground galaxy. Another well-studied object PJ142823.9 has the smallest apparent luminosity among our sample and has little evidence to support a lensing scenario. Among the five Planck-Herschel sources with optical and SMA continuum imaging by Cañameras et al. (2015), PJ160917.8 is the clearest example of a strongly lensed object, while evidence for lensing is not as clear for the remaining four. More sensitive, higher resolution imaging will be necessary to establish the lensing scenario for these remaining sources.
6 Discussion
6.1 Extreme IR Luminosity of Planck-Herschel Sources
6.1.1 Sources with
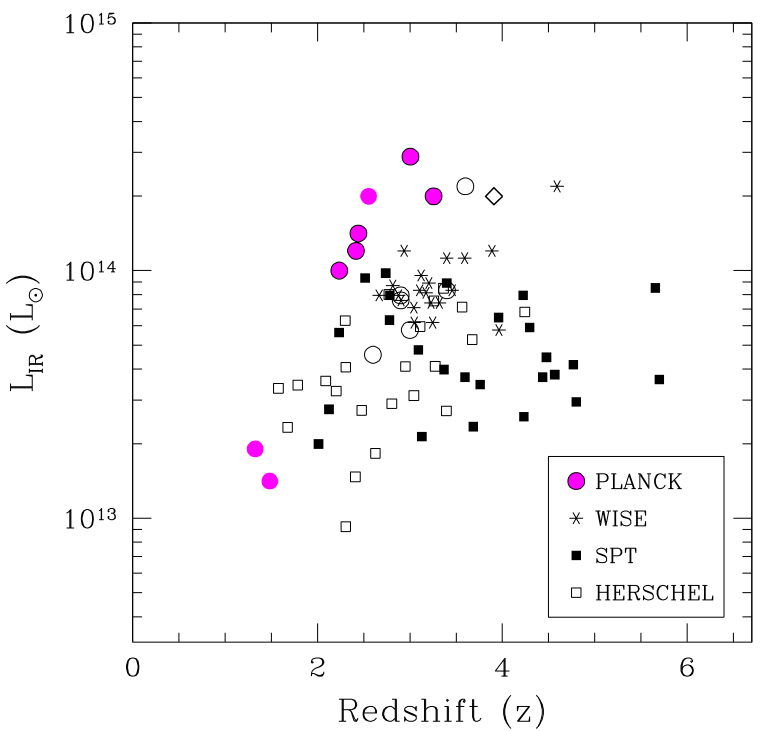
The most remarkable aspect of these Planck-Herschel sources is that their IR (8-1000 µm) luminosity is among the largest ever found. As seen in the comparison of our IR luminosity with other luminous sources discovered by other recent IR surveys in Figure 8, these Planck-Herschel sources (alongside the independently identified and overlapping targets by Cañameras et al., 2015) account for the majority of sources with rest-frame . Nearly all of them either match or exceed the IR luminosity of the WISE selected HyLIRGs by Tsai et al. (2015) that have recently been reported as “the most IR luminous galaxies”. Five out of the twenty WISE sources reported by Tsai et al. have rest-frame , with the source W22460526 being the most luminous with . In contrast, six out of eight Planck-Herschel sources in our sample and G145.2+50.9 in the Cañameras sample have exceeding , and our brightest source, PJ105353.0 with , is the brightest IR galaxy ever discovered. The strongly lensed QSO APM 08279+5255 (Irwin et al., 1998; Weiss et al., 2007) with was the only known source with this type of IR luminosity previously, and these new Planck and WISE surveys have dramatically increased the number of objects with this type of IR luminosity, by more than an order of magnitude.
Also shown in Figure 8 is the comparison of IR luminosity for our sample of Planck-Herschel sources with the strongly lensed SMGs discovered by Herschel (Bussmann et al., 2013; Wardlow et al., 2013) and the South Pole Telescope (SPT, Vieira et al., 2013; Weiß et al., 2013). Their large IR luminosity () assisted by gravitational lensing made them popular targets of recent studies of luminous IR galaxy and dusty starburst phenomenon at , during the epoch of galaxy build-up. This comparison shows that our Planck-Herschel sources are on average 5-10 times more luminous than these Herschel and SPT sources, and they are the most luminous of the IR galaxies population that accounts for a large fraction of the cosmic star formation history (Le Floc’h et al., 2005; Caputi et al., 2007; Magnelli et al., 2011). We note that two of our Planck-Herschel sources (PJ142823.9 & PJ160722.6) as well as five of the Cañameras sample sources have IR luminosity comparable to these Herschel and SPT sources, demonstrating that the Planck section is sensitive to these “lower luminosity” () objects as well. None of the Planck selected sources so far are at , unlike some of the SPT or Herschel sources, and this can be accounted by the small sample size and the comparatively shorter wavelength sample selection.
6.1.2 Nature of their high luminosity: AGN or star formation?
In the local Universe, the fraction of galaxies with a dominant AGN contribution increases with IR luminosity (e.g., Sanders & Mirabel, 1996), and the same trend may also hold true in the earlier epochs. Many of the high redshift galaxies identified by early IR surveys, such as the Cloverleaf (H1413+117) and IRAS F10214+4724 (Barvainis et al., 1992, 1995), are indeed hosting a luminous, dust-obscured AGN. Therefore, it is natural to suspect ubiquitous AGN activity among these Planck-Herschel sources, especially given their extremely large IR luminosity () typically associated with QSOs. Detailed follow-up studies of the SPT and Herschel sources with have concluded that many are gravitationally lensed sources with a typical magnification factor of (Bussmann et al., 2013; Vieira et al., 2013; Dye et al., 2014). If some or all of the Planck-Herschel sources are also magnified by a similar factor ( for PJ020941.3, Geach et al., 2015), then their intrinsic IR luminosity is , still in the QSO regime.
A quantitative analysis of the AGN contribution to the total IR luminosity is possible if the mid- to far-IR SED is fully mapped. By analyzing a large sample of high redshift galaxies with extensive mid- and far-IR data from Spitzer and Herschel, Kirkpatrick et al. (2012, 2013) have shown that the energetic contribution by AGN activity can be determined quantitatively through a spectral decomposition, even for heavily obscured, Compton thick sources. In particular, Kirkpatrick et al. (2013) have shown that combining the longer wavelength photometry from Herschel with mid-IR photometry from Spitzer (or WISE) yields the most reliable separation of AGN and SF dominated galaxies since they probe the widest range of dust properties affected.
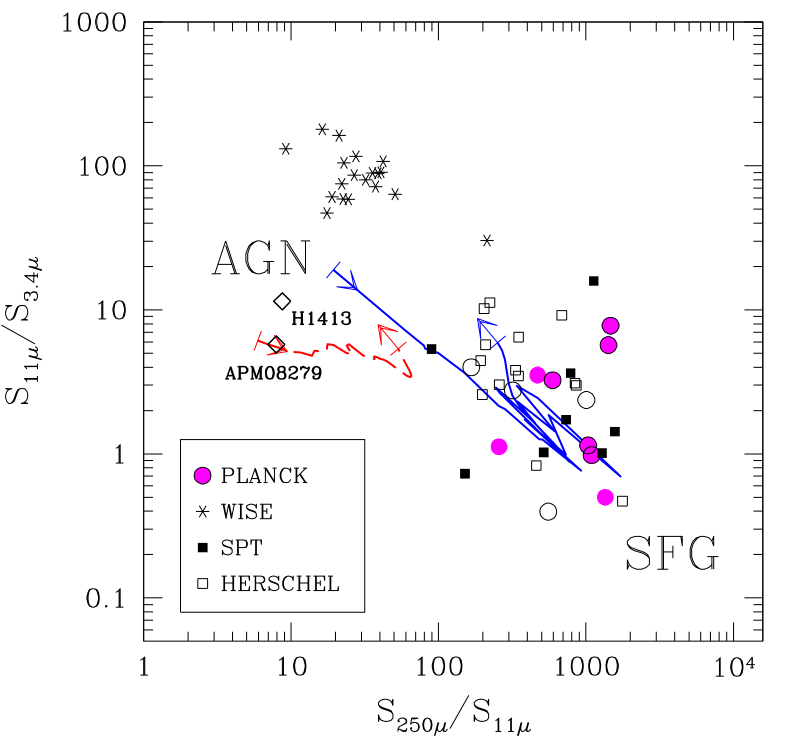
A modified version of this mid-IR to far-IR colour diagnostic plot, replacing Spitzer photometry bands with WISE photometry bands, is shown in Figure 9, and our Planck-Herschel sources appear in the region dominated by star formation activity. The two IR QSOs with the characteristic broad emission lines, APM 08279+5255 (Irwin et al., 1998) and the Cloverleaf (H1413+117, Barvainis et al., 1992, 1995) are located near the colour track of the featureless power-law AGN (long dashed line), as expected. All but one of the luminous WISE-selected IR galaxies have a relatively flat mid- to far-IR flux ratio () characteristic of power-law AGNs, but with systematically redder mid-IR colour (). By analysing their SEDs, Tsai et al. (2015) have concluded that these WISE-selected sources are likely powered by highly obscured AGNs, with their hot dust ( K) accounting for the high luminosities. Their mid-IR colour is systematically redder than the power-law AGN model track, but this is a consequence of the “W1W2-dropout” selection in their sample definition. In contrast, nearly all of our Planck-Herschel sources (also by Cañameras et al., 2015) as well as all of the SPT- and Herschel-selected IR sources appear along the SF template track (solid line). Kirkpatrick et al. (2015) have shown that AGN-powered sources rapidly cross over from the SF dominated to the AGN region on this diagnostic plot once the AGN contribution exceeds 60% of the total luminosity, and this analysis clearly indicates that our Planck-Herschel sources are primarily powered by SF activity. This conclusion is further supported by the fact that nearly all Planck-Herschel sources also follow the radio-IR correlation characteristic of star forming galaxies (see § 4.2 and Fig. 5), and the nature of the energetic activities powering their large luminosity is substantially different between the Planck-selected and the WISE-selected SMGs, despite their similarly extremely IR luminosity.
6.2 Molecular Gas Mass Estimates
6.2.1 Gas Mass Estimates from CO Line Luminosity
A standard method for deriving a total molecular gas mass from a redshifted CO line measurement is to adopt a line ratio between different rotational transitions to estimate the CO (1–0) transition luminosity and then to translate this line luminosity to a total molecular gas mass assuming an “” conversion factor (see the review by Carilli & Walter, 2013). The Table 2 by Carilli & Walter (2013) gives the average CO line ratios for SMGs as , , and of 0.85, 0.66, and 0.46, respectively. Using these ratios, we can convert the measured CO line luminosities reported in Table 2 to and then to using the “Galactic” conversion factor (Bolatto et al., 2013).
The derived total molecular gas masses of our eight Planck-Herschel sources, uncorrected for the unknown magnification factor , range between and . For a typical magnification factor of , the intrinsic molecular gas masses range between , which are near to top of the range of gas masses found for high redshift SMGs that are not strongly lensed (see Carilli & Walter, 2013). The measured line widths (FWHM) of 400-650 km s-1 are somewhat large, but they are fairly typical for the most gas-rich SMGs (see Fig. 5 by Carilli & Walter). We note that earlier studies often used the “ULIRG” conversion factor of , leading to systematically smaller total gas mass, without a clear physically motivated justification. Following Scoville et al. (2015), who have argued for using the Galactic conversion even for high redshift SMGs after a thorough review of the topic, we also adopt the Galactic conversion factor for our molecular gas mass estimates. We revisit this decision by comparing these total molecular gas mass estimates with the dust continuum based ISM mass estimates in the next section (§ 6.2.2).
An upper bound to the total mass requires that the total gas mass cannot exceed the dynamical mass of the system. A virial mass of a pressure supported spherical system with a 1-D velocity dispersion ( is , where is the characteristic radius of the system in kpc. For a rotationally supported disk with a radius , an equivalent dynamical mass with a rotational speed is . Therefore, the maximum possible gas mass for a 10 kpc radius disk is for a galaxy with observed CO line width of 650 km s-1, which exceeds the CO-derived gas mass for the eight Planck-Herschel sources by factors of 2 to 30. These gas mass estimates may be somewhat over-estimated, by a factor of order unity as discussed below. Accounting for the remainder of the difference requires that nearly all of these galaxies must be strongly lensed by at least these factors (2 to 30), even though we lack any direct evidence for lensing in most cases. The empirical estimate for the magnification factor based on measured CO line width and line luminosity, as proposed by Harris et al. (2012), is essentially a different formulation of this upper mass limit.
6.2.2 ISM Mass Estimates from AzTEC m Photometry
As an alternative to deriving total gas mass from CO measurements that can be observationally expensive, Scoville et al. (2015) have proposed an empirical calibration for total ISM mass derived from the optically thin, long wavelength dust continuum emission and adopting a gas-to-dust ratio (GDR). As shown in their Figure 1, CO line luminosity is linearly correlated with the monochromatic luminosity at the rest frame 850 µm for local star forming galaxies, local ULIRGs, and SMGs, spanning over six orders of magnitude in luminosity. This in turn can be used to derive a dust mass using the constant scaling factor based on the local calibration.
Our AzTEC 1100 µm photometry is well suited for this application as we are probing near the Rayleigh-Jeans part of the spectrum ( = 260-470 µm) at the redshift of these Planck-Herschel sources (see Fig. 5). Considering that the average IR luminosity density should be at least 10 times higher for our Planck-Herschel sources compared with the local and galaxies used for the calibration, we adopt a dust temperature 1.5 times higher than considered by Scoville et al., or K333This adopted dust temperature is lower than the the luminosity-weighted dust temperature derived from the IR SED analysis ( = 42-84 K, see Table 4), but Scoville et al. (2015) make a compelling argument for using a lower, mass-weighted – see their Appendix A.2 for a detailed discussion.. Adopting Eq. A14 by Scoville et al., the ISM mass, which is effectively the total molecular gas mass, can be derived from the observed AzTEC flux density as,
where is the luminosity distance in Mpc, and is the measured flux density at 1100 µm in mJy (for µm). Here we adopt the value of ergs/sec/Hz/ M⊙ (Scoville et al. Eq. A11), and the RJ correction factor that accounts for any deviation away from the dependance as
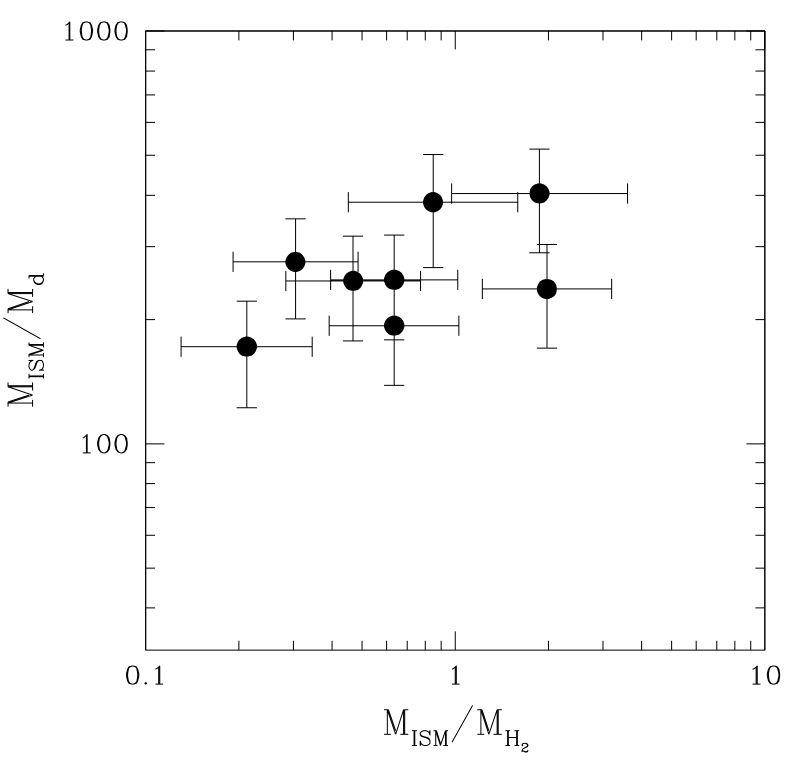
The total ISM mass we derive for these Planck-Herschel sources range between and , uncorrected for the unknown magnification factor (see Table 4). As shown in Figure 10, the median ratio between this ISM mass and the CO-derived mass (§ 6.2.1) for our sample is , with a significant scatter, and this indicates that the ISM mass derived from the AzTEC 1100 µm photometry is systematically smaller by a factor of 1.5 compared with the CO-derived . The sample plot also shows that the gas-to-dust ratio for the same sample has a median value of , which is close to the nominal value in the local Universe for metal-rich galaxies (, Draine et al., 2007). This median value and the small scatter suggest that the ISM masses derived following calibration by Scoville et al. (2015) and the dust masses derived using an independent calibration (see Appendix D) are at least consistent, probably because of their shared assumptions.
A possible explanation that our CO-derived might be a slight over-estimate is in line with the results of recent theoretical works. By modeling the impact of metallicity, gas temperature, and velocity dispersion, Narayanan et al. (2012) have postulated a weakly dependent reduction in with increasing velocity dispersion for high redshift galaxies with a larger turbulent support. Specifically, Narayanan et al. model predicts a reduction in by 20% and 40% (compared with the Galactic value) with a factor of 2 and 5 increase in velocity dispersion, respectively. A reduction in by this magnitude would bring our ratio and the gas-to-dust ratio to a much better agreement. We note that our estimates of are systematically larger than those reported by Cañameras et al. (2015) by a significant amount, with the median for the five objects in common being 6.6 times larger for our estimates. In their gas mass derivation, Cañameras et al. adopted the “ULIRG” conversion factor, which immediately leads to 5 times smaller gas masses. In addition, Cañameras et al. did not explicitly account for the excitation dependent correction for observing different CO rotational transitions (see Carilli & Walter, 2013), leading to a further factor of 1.5 reduction in their mass estimates. Their combined effects should lead to 7.5 times smaller masses, which can more than account for the factor of 6.6 difference. The lower gas masses derived by Cañameras et al. should in turn lead to an average gas-to-dust ratio of 444Cañameras et al. (2015) report gas-to-dust ratios of using their CO-derived and dust mass derived from their SED modeling. This low suggests that either they under-estimate their gas masses or over-estimate the dust masses. In deriving their dust masses, Cañameras et al. use the luminosity-weighted , which should lead to systematically lower estimates of , as explicitly cautioned to avoid by Scoville et al. (2015). Therefore, it follows that their estimates are indeed substantially under-estimated.. These considerations of average GDR and ratio suggest that our CO-derived gas masses are within a factor of 2 of the correct values.
7 Conclusions
A further understanding of how to link the IR galaxies making up the cosmic infrared background (CIRB) with the entire galaxy population across all redshifts is revolutionized by the systematic detection of gravitationally lensed SMGs. These systems are some of the most interesting objects to study because the magnifying property of lensing allow us to probe (1) physical details of the intense star formation activities at sub-kpc scale that are beyond the conventional means including the ALMA and the JVLA; and (2) dusty star forming galaxies beyond the current detection limit, with yr-1 that account for the bulk of stellar mass build-up at .
In this pilot study for identifying a large population of strongly lensed SMGs using the Planck survey data, we report our successful identification of eight candidate sources drawn from the Planck Compact Source Catalog using the public Herschel archival data and the results from our detailed follow-up investigation utilizing new AzTEC 8.5″resolution 1100 µm imaging and CO spectroscopy using the Redshift Search Receiver on the LMT. Our new observations have shown that these are some of the most luminous galaxies ever found with up to , and our Planck-Herschel sources at redshifts of are also some of the most gas-rich galaxies found ( for ). The SED analysis using the mid- to far-IR colour diagnostic plot developed by Kirkpatrick et al. (2013) shows that these sources are powered primarily by the intense SF activity, unlike the similarly luminous IR galaxies identified in the WISE survey by Tsai et al. (2015), which are powered primarily by luminous AGNs. Our examination of the radio-IR correlation also supports this SF scenario.
The results of our pilot study suggest that a much larger population of strongly lensed SMGs can be potentially found in the Planck Compact Source Catalog, including sources with down to . At least four (out of eight) Planck-Herschel sources are associated with a bright foreground optical galaxy, strongly supporting the lensing hypothesis, and the source PJ020941.3 has been definitively shown to be a partial Einstein ring lensed by a foreground galaxy (, Geach et al., 2015). A larger survey to identify a much larger sample of lensed SMGs in the Planck Compact Source Catalog is already underway, and the results of this expanded study will be reported in a future paper.
Acknowledgments
We would like to thank A. Pope, N. Scoville, R. Snell, J. Vieira for useful discussions and D. F. Gallup for his assistance during the initial development of the project. This work would not have been possible without the long-term financial support from the Mexican Science and Technology Funding Agency, CONACYT (Consejo Nacional de Ciencia y Tecnología) during the construction and early operational phase of the Large Millimeter Telescope Alfonso Serrano, as well as support from the the US National Science Foundation via the University Radio Observatory program, the Instituto Nacional de Astrofísica, Óptica y Electrónica (INAOE) and the University of Massachusetts, Amherst (UMass). The UMass LMT group acknowledges support from NSF URO and ATI grants (AST-0096854, AST-0215916, AST-0540852, and AST-0704966) for the LMT project and the construction of the RSR and AzTEC. KH and RC would like to acknowledge support from a William Bannick Student Travel Grant. We are grateful to all of the LMT observers from Mexico and UMass who took data for this project. This publication makes use of data products from the Wide-field Infrared Survey Explorer, which is a joint project of the University of California, Los Angeles, and the Jet Propulsion Laboratory/California Institute of Technology, funded by the National Aeronautics and Space Administration. This work is based in part on observations made with the Herschel Space Observatory, which is an ESA space observatory with science instruments provided by European-led Principal Investigator consortia and with important participation from NASA, and the Planck, which is European Space Agency mission with significant NASA involvement. This research has made use of the NASA/ IPAC Extra- galactic Database (NED) which is operated by the Jet Propulsion Laboratory, California Institute of Technology, under contract with the National Aeronautics and Space Administration. This research has made use of the NASA/ IPAC Infrared Science Archive, which is operated by the Jet Propulsion Laboratory, California Institute of Technology, under contract with the National Aeronautics and Space Administration.
References
- Barvainis et al. (1992) Barvainis R., Antonucci R., Coleman P., 1992, ApJ, 399, L19
- Barvainis et al. (1995) Barvainis R., Antonucci R., Hurt T., Coleman P., Reuter H.-P., 1995, ApJ, 451, L9
- Becker et al. (1995) Becker R. H., White R. L., Helfand D. J., 1995, ApJ, 450, 559
- Blain (1998) Blain A. W., 1998, MNRAS, 297, 511
- Blain et al. (2002) Blain A. W., Smail I., Ivison R. J., Kneib J.-P., Frayer D. T., 2002, Physics Reports, 369, 111
- Bolatto et al. (2013) Bolatto A. D., Wolfire M., Leroy A. K., 2013, ARA&A, 51, 207
- Borys et al. (2006) Borys C., et al., 2006, ApJ, 636, 134
- Bussmann et al. (2013) Bussmann R. S., et al., 2013, ApJ, 779, 25
- Cañameras et al. (2015) Cañameras R., et al., 2015, A&A, 581, A105
- Caputi et al. (2007) Caputi K. I., Lagache G., Yan L., Dole H., Bavouzet N., Le Floc’h E., Choi P. I., Helou G., Reddy N., 2007, ApJ, 660, 97
- Carilli & Walter (2013) Carilli C. L., Walter F., 2013, ARA&A, 51, 105
- Carilli & Yun (1999) Carilli C. L., Yun M. S., 1999, ApJ, 513, L13
- Casey et al. (2012) Casey C. M., et al., 2012, ApJ, 761, 139
- Casey et al. (2014) Casey C. M., Narayanan D., Cooray A., 2014, Physics Reports, 541, 45
- Clements et al. (2014) Clements D. L., et al., 2014, MNRAS, 439, 1193
- Condon et al. (1998) Condon J. J., Cotton W. D., Greisen E. W., Yin Q. F., Perley R. A., Taylor G. B., Broderick J. J., 1998, AJ, 115, 1693
- Dessauges-Zavadsky et al. (2015) Dessauges-Zavadsky M., et al., 2015, A&A, 577, A50
- Draine et al. (2007) Draine B. T., et al., 2007, ApJ, 663, 866
- Dunne et al. (2003) Dunne L., Eales S., Ivison R., Morgan H., Edmunds M., 2003, Nature, 424, 285
- Dye et al. (2014) Dye S., et al., 2014, MNRAS, 440, 2013
- Efstathiou et al. (2000) Efstathiou A., Rowan-Robinson M., Siebenmorgen R., 2000, MNRAS, 313, 734
- Erickson et al. (2007) Erickson N., Narayanan G., Goeller R., Grosslein R., 2007, in Baker A. J., Glenn J., Harris A. I., Mangum J. G., Yun M. S., eds, From Z-Machines to ALMA: (Sub)Millimeter Spectroscopy of Galaxies Vol. 375 of Astronomical Society of the Pacific Conference Series, An Ultra-Wideband Receiver and Spectrometer for 74–110 GHz. pp 71–+
- Fu et al. (2012) Fu H., Jullo E., Cooray A., Bussmann R. S., Ivison R. J., et al., 2012, ApJ, 753, 134
- Geach et al. (2015) Geach J. E., et al., 2015, MNRAS, 452, 502
- George et al. (2013) George R. D., et al., 2013, MNRAS, 436, L99
- Hailey-Dunsheath et al. (2010) Hailey-Dunsheath S., Nikola T., Stacey G. J., Oberst T. E., Parshley S. C., Benford D. J., Staguhn J. G., Tucker C. E., 2010, ApJ, 714, L162
- Harris et al. (2012) Harris A. I., et al., 2012, ApJ, 752, 152
- Heinis et al. (2013) Heinis S., et al., 2013, MNRAS, 429, 1113
- Hildebrand (1983) Hildebrand R. H., 1983, QJRAS, 24, 267
- Hughes et al. (2010) Hughes D. H., et al., 2010, in Society of Photo-Optical Instrumentation Engineers (SPIE) Conference Series Vol. 7733 of Society of Photo-Optical Instrumentation Engineers (SPIE) Conference Series, The Large Millimeter Telescope
- Hughes et al. (1997) Hughes D. H., Dunlop J. S., Rawlings S., 1997, MNRAS, 289, 766
- Iono et al. (2006) Iono D., et al., 2006, ApJ, 640, L1
- Irwin et al. (1998) Irwin M. J., Ibata R. A., Lewis G. F., Totten E. J., 1998, ApJ, 505, 529
- Ivison et al. (2013) Ivison R. J., et al., 2013, ApJ, 772, 137
- James et al. (2002) James A., Dunne L., Eales S., Edmunds M. G., 2002, MNRAS, 335, 753
- Johnson et al. (2013) Johnson S. P., et al., 2013, MNRAS, 431, 662
- Kennicutt (1998) Kennicutt Jr. R. C., 1998, ARA&A, 36, 189
- Kirkpatrick et al. (2012) Kirkpatrick A., et al., 2012, ApJ, 759, 139
- Kirkpatrick et al. (2013) Kirkpatrick A., et al., 2013, ApJ, 763, 123
- Kirkpatrick et al. (2015) Kirkpatrick A., Pope A., Sajina A., Roebuck E., Yan L., Armus L., Díaz-Santos T., Stierwalt S., 2015, ApJ, 814, 9
- Knudsen et al. (2009) Knudsen K. K., Neri R., Kneib J.-P., van der Werf P. P., 2009, A&A, 496, 45
- Knudsen et al. (2008) Knudsen K. K., van der Werf P. P., Kneib J.-P., 2008, MNRAS, 384, 1611
- Le Floc’h et al. (2005) Le Floc’h E., et al., 2005, ApJ, 632, 169
- Magnelli et al. (2011) Magnelli B., et al., 2011, A&A, 528, A35
- Monet et al. (2003) Monet D. G., Levine S. E., Canzian B., Ables H. D., et al., 2003, AJ, 125, 984
- Narayanan et al. (2012) Narayanan D., Krumholz M. R., Ostriker E. C., Hernquist L., 2012, MNRAS, 421, 3127
- Negrello et al. (2005) Negrello M., González-Nuevo J., Magliocchetti M., Moscardini L., De Zotti G., Toffolatti L., Danese L., 2005, MNRAS, 358, 869
- Negrello et al. (2010) Negrello M., Hopwood R., De Zotti G., Cooray A., Verma A., et al., 2010, Science, 330, 800
- Oliver et al. (2012) Oliver S. J., et al., 2012, MNRAS, 424, 1614
- Perera et al. (2008) Perera T. A., et al., 2008, MNRAS, 391, 1227
- Planck Collaboration I (2014) Planck Collaboration I 2014, A&A, 571, A1
- Planck Collaboration XXVII (2015) Planck Collaboration XXVII 2015, A&A, 582, A30
- Planck Collaboration XXVIII (2014) Planck Collaboration XXVIII 2014, A&A, 571, A28
- Planck Collaboration XXXIX (2016) Planck Collaboration XXXIX 2016, ArXiv e-prints
- Polletta et al. (2007) Polletta M., Tajer M., Maraschi L., Trinchieri G., Lonsdale C. J., Chiappetti L., Andreon S., Pierre M., et al., 2007, ApJ, 663, 81
- Sanders & Mirabel (1996) Sanders D. B., Mirabel I. F., 1996, ARA&A, 34, 749
- Scott et al. (2008) Scott K. S., et al., 2008, MNRAS, 385, 2225
- Scoville et al. (2014) Scoville N., et al., 2014, ApJ, 783, 84
- Scoville et al. (2015) Scoville N., et al., 2015, ArXiv e-prints
- Solomon et al. (1997) Solomon P. M., Downes D., Radford S. J. E., Barrett J. W., 1997, ApJ, 478, 144
- Swinbank et al. (2006) Swinbank A. M., Chapman S. C., Smail I., Linder C., Borys C., Blain A. W., Ivison R. J., Lewis G. F., 2006, MNRAS, 371, 465
- Swinbank et al. (2011) Swinbank A. M., et al., 2011, ApJ, 742, 11
- Tamura et al. (2015) Tamura Y., Oguri M., Iono D., Hatsukade B., Matsuda Y., Hayashi M., 2015, PASJ, 67, 72
- Timmons et al. (2015) Timmons N., et al., 2015, ArXiv e-prints
- Tsai et al. (2015) Tsai C.-W., et al., 2015, ApJ, 805, 90
- Vieira et al. (2013) Vieira J. D., et al., 2013, Nature, 495, 344
- Viero et al. (2014) Viero M. P., et al., 2014, ApJS, 210, 22
- Wall (1996) Wall J. V., 1996, QJRAS, 37, 519
- Wardlow et al. (2013) Wardlow J. L., et al., 2013, ApJ, 762, 59
- Weiss et al. (2007) Weiss A., Downes D., Walter F., Henkel C., 2007, in Baker A. J., Glenn J., Harris A. I., Mangum J. G., Yun M. S., eds, From Z-Machines to ALMA: (Sub)Millimeter Spectroscopy of Galaxies Vol. 375 of Astronomical Society of the Pacific Conference Series, CO Line SEDs of High-Redshift QSOs and Submm Galaxies. pp 25–+
- Weiß et al. (2013) Weiß A., et al., 2013, ApJ, 767, 88
- White et al. (1997) White R. L., Becker R. H., Helfand D. J., Gregg M. D., 1997, ApJ, 475, 479
- Wilson et al. (2008) Wilson G. W., et al., 2008, MNRAS, 386, 807
- Yun et al. (2008) Yun M. S., et al., 2008, MNRAS, 389, 333
- Yun & Carilli (2002) Yun M. S., Carilli C. L., 2002, ApJ, 568, 88
- Yun et al. (2012) Yun M. S., et al., 2012, MNRAS, 420, 957
- Yun et al. (2015) Yun M. S., et al., 2015, MNRAS, 454, 3485
- Yun et al. (2007) Yun M. S., Heyer M., Aretxaga I., 2007, in Baker A. J., Glenn J., Harris A. I., Mangum J. G., Yun M. S., eds, From Z-Machines to ALMA: (Sub)Millimeter Spectroscopy of Galaxies Vol. 375 of Astronomical Society of the Pacific Conference Series, Redshift Determination Algorithms for Broadband Spectroscopic Data. p. 174
- Yun et al. (2001) Yun M. S., Reddy N. A., Condon J. J., 2001, ApJ, 554, 803
- Zavala et al. (2015) Zavala J. A., et al., 2015, MNRAS, 452, 1140
Appendix A Determining Unique CO Redshift using IR Photometric Redshift
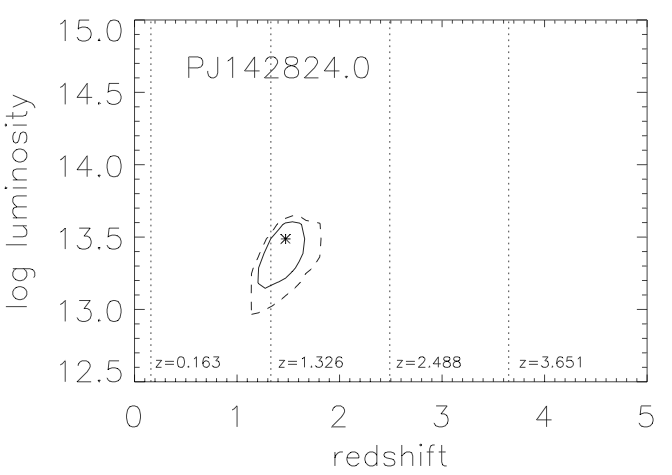
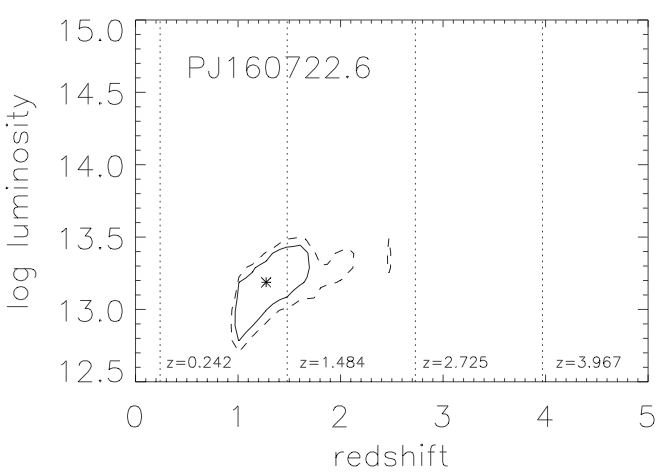
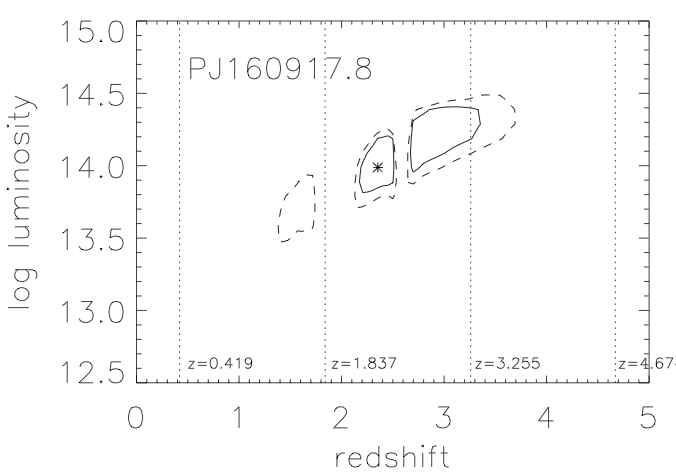
A unique redshift can be determined when two or more spectral lines are detected in a single RSR spectrum, such as for PJ160917.8 in Fig. 2. Only one CO line falls within RSR band in the redshift range between and , however, and additional information such as photometric redshift is needed in order to distinguish different redshift solutions – see discussions by Yun et al. (2015). Specifically, Yun et al. have demonstrated the use of radio-millimetric photometric redshift technique (Carilli & Yun, 1999) as an effective means to provide the redshift support using minimum additional data. A more thorough photometric redshift analysis using all available photometry data can in principle provide a stronger support for the redshift discrimination.
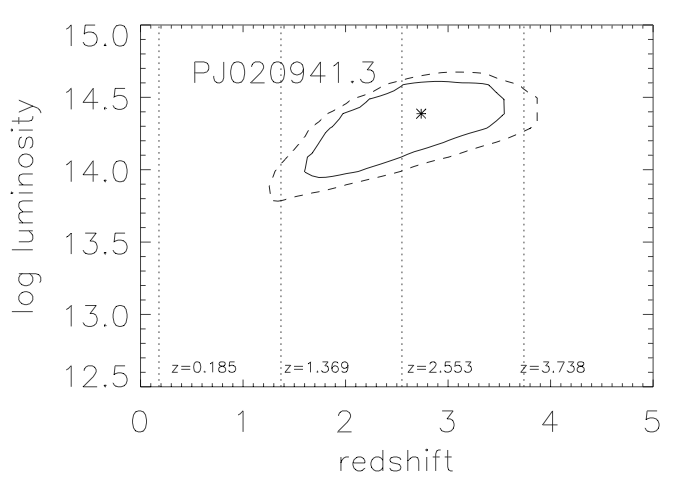
The use of a full photometric redshift analysis for deriving a unique redshift solution for an RSR spectrum is demonstrated in Fig. 11. For this analysis, photometric data points from WISE (11 & 22 µm), Herschel, AzTEC, and VLA are analyzed using the template SEDs by Efstathiou et al. (2000). A minimum value for an entire suite of template SEDs is computed at each grid point in the redshift-luminosity parameter space, and a map of the minimum values is constructed. The over-all best fit solution with the overall minimum is shown as an asterisk in each panel, and it is often close to one of the redshift solutions corresponding to a CO line seen in the RSR spectrum. The dotted and solid contours denote the 68 and 90 percentile confidence levels derived based on the reduced values (Wall, 1996), and a weighted likelihood is used to select a unique redshift solution based on this analysis. Vertical gaps and discontinuities in the confidence contours seen in some panels are the artifacts arising from the WISE photometry points passing through the PAH emission line features in the SED templates, which are generally not modeled very well by the templates used. These WISE photometry provide useful constraint on the photometric redshift for high redshift dusty starbursts with their characteristic red colour (see Yun et al., 2008, 2012), and including these data is still helpful for narrowing down the acceptable solutions, even with these apparent artifacts.
Appendix B Line Width Correction for the Instrumental Resolution
Unlike nearby spiral galaxies that are rotationally supported, many high redshift CO sources are thought to be at least partially pressure-supported, and their CO line profiles are often characterized as a Gaussian in shape. The frequency response of the RSR is also roughly Gaussian. For a line with an intrinsic Gaussian width , the full width half maximum (FWHM) CO line width is . The measured CO line then has a Gaussian width of with an apparent line width of , which is the result of the intrinsic line width convolved with the Instrumental resolution of . Since , the intrinsic line width can be recovered as
The spectral channel width of 31.25 MHz translates to a velocity resolution of km s-1, where is the observed CO line frequency in GHz. The CO line width reported in Table 2 is the deconvolved line width after correcting for the instrumental spectral resolution of the RSR as shown here. The magnitude of correction is small, km s-1, and is expected to be significantly only when the line width is close to the spectral resolution.
Appendix C Modified Blackbody Model
The dust mass estimates are highly dependent on the dust temperature distribution amongst the ISM. Yun & Carilli (2002) provide an expression for a radio-to-FIR spectrum parameterised by SFR, dust temperature, and luminosity distance in their Eq 15. In order to characterize the dust temperature for each source we adapted this equation to its relative functional form with dust temperature as a free parameter. In modeling the Rayleigh-Jeans part of the dust spectrum, one can adopt a value for , the critical frequency at which the light coming from the dust clouds becomes optically thick. We take to be 2000 GHz (150 µm) as in Yun & Carilli. The dust emissivity index, , is held fixed at a value of 1.8 to remain consistent with the comparative analyses by Scoville et al. (2015). Typical values for with respect to SMGs range from 1.5 to 2.0 (see Scoville et al., 2014). There are essentially two descriptors of the SED model that uniquely characterize the best fit once a given value for is assumed: a normalization factor related to the total star formation rate , and the dust temperature .
where is the frequency in the rest frame of the object. A discrete range of normalization factors for each source were recorded for every dust temperature sampled (ranging from 0.5-99.5 K with increments of 0.4 K) in order to compute minimum reduced values. In order to track the internal degeneracy between the normalization factor and dust temperature and to effectively characterize the upper and lower limits, we produce a 2-dimensional plot given the normalization factor versus the rest-frame dust temperature.
The resulting SED analyses for each sample galaxy are shown in Figure 12. The minimum is marked with an asterisk, and the 68 and 90 percentile confidence levels computed following Wall (1996) are shown by a solid and dot-dash contours. By modifying the Yun & Carilli (2002) relation as adopted here, the term “” is no longer a true estimate of star formation rate and is simply a scaling factor instead. We explicitly compute IR luminosity ( 8-1000 µm) from the best fit model and compute star formation rate using the calibration by Kennicutt (1998) corrected for the Kroupa IMF. The best fit modified blackbody model parameters and derived quantities are reported in Table 4.


Appendix D Dust Mass Calculation
Following Hildebrand (1983), the total dust mass detected with a flux density of at the observed frequency , located at a luminosity distance of is
where is the mass absorption coefficient and is the Planck function,
Mass absorption coefficient is a major source of uncertainty, arising from our poor understanding of the grain properties such as density, size, shape, etc. (see Hughes et al., 1997). Several authors reviewed this subject and produced new estimates with varying assumptions (e.g. James et al., 2002; Dunne et al., 2003), all falling within a factor of 2 of the Hughes et al. value m2 kg-1. Thus for our dust mass calculation we adopt
where dust emissivity is the same value used for the ISM mass calculation in § 6.2.2. We a caution that a systematic uncertainly of up to a factor of 2 may result from this choice of .
For a galaxy at high redshift , we can re-write the equation for dust mass in terms of the measured flux density at the observed frequency as