2School of Physics and Astronomy, University of Leeds, Leeds, UK
Giant molecular filaments in the Milky Way
Abstract
Context. Filamentary structures are common morphological features of the cold, molecular interstellar medium (ISM). Recent studies have discovered massive, hundred-parsec-scale filaments that may be connected to the large-scale, Galactic spiral arm structure. Addressing the nature of these giant molecular filaments (GMFs) requires a census of their occurrence and properties.
Aims. We perform a systematic search of GMFs in the fourth Galactic quadrant and determine their basic physical properties.
Methods. We identify GMFs based on their dust extinction signatures in the near- and mid-infrared and the velocity structure probed by 13CO line emission. We use the 13CO line emission and ATLASGAL dust emission data to estimate the total and dense gas masses of the GMFs. We combine our sample with an earlier sample from literature and study the Galactic environment of the GMFs.
Results. We identify nine GMFs in the fourth Galactic quadrant. Six in the Centaurus spiral arm and three in inter-arm regions. Combining this sample with an earlier study using the same identification criteria in the first Galactic quadrant results in 16 GMFs, nine of which are located within spiral arms. The GMFs have sizes of 80-160 pc and 13CO-derived masses between M⊙. Their dense gas mass fractions are between 1.5-37, which is higher in the GMFs connected to spiral arms. We also compare the different GMF-identification methods and find that emission and extinction-based techniques overlap only partially, thereby highlighting the need to use both to achieve a complete census.
1 Introduction
Filamentary structures are present in the interstellar medium (ISM) in a wide variety of environments over a wide range of scales, and they may play a major role in star formation (e.g., André et al. 2014). Especially the presence of parsec-sized filamentary structures in the ISM and their close relationship with star formation have been known for several decades (e.g., Schneider & Elmegreen 1979; Bally et al. 1987; Beuther et al. 2011; Hacar et al. 2013; Kainulainen et al. 2013; André et al. 2014; Molinari et al. 2014; Stutz & Gould 2015). These filaments are omnipresent in molecular clouds, no matter whether these clouds are quiescent or harbor star-forming activity (e.g., Molinari et al. 2014). Understanding the physical origin and evolution of filaments is therefore needed to explain the whole process of star formation.
The discovery of “Nessie” (Jackson et al. 2010; Goodman et al. 2014), an 80 pc long filament associated with the Scutum-Centaurus spiral arm, has initiated the study of a family of giant molecular filaments (GMFs) in the Milky Way. In addition to Nessie, four other GMFs had been discovered early on and studied (Beuther et al. 2011; Kainulainen et al. 2011; Battersby & Bally 2014; Li et al. 2013; Tackenberg et al. 2013). All these five GMFs were identified first as absorption features against the mid-infrared (MIR) background of the Galaxy and confirmed to be continuous physical objects using additional spectral line information. The existence of such filaments raises the question whether they could be connected to the large-scale, Galactic spiral arm structure. A systematic Galactic census of GMFs, characterizing their occurrence and properties, is required to answer this question.
The first systematic study of GMFs was carried out by Ragan et al. (2014, hereafter, R14). Their study focused on the first Galactic quadrant. R14 identified a series of filamentary near-infrared (NIR) and MIR extinction features. They used 13CO spectral information to search for low-density gas bridges connecting the extinction features. Their goal was to find the longest possible extent of the gas connecting filamentary structures. They found seven GMFs with lengths between 50-230 pc and masses on the order of 104-105 M☉. They used the Milky Way spiral-arm model of Vallée (2008) to investigate the GMFs in the Galactic context. They found that, unlike Nessie, six out of eight of their GMFs lie in inter-arm regions, rather than in spiral arms.
Goodman et al. (2014) suggest that Nessie may be a part of much longer structure that is located in the Galactic midplane within a spiral arm. They call this structure a “bone”. Using a method similar to R14, Zucker et al. (2015) report ten new bones. These bones are smaller and less massive than the GMFs of R14.
Recently, Wang et al. (2015) have approached the census of GMFs from a different perspective. They used dust emission from Herschel to identify nine GMFs with masses and lengths similar to those found by R14. Generally, both filament-finding methods do not identify the same filaments; if they do so, the size of the structures is not necessarily the same. Using a more recent model of the spiral structure of our Galaxy (Reid et al. 2014), they found much higher coincidence between their GMFs and spiral arms than R14 (who used the Vallée 2008, model), with seven out of nine filaments located in Scutum-Centaurus and Sagittarius spiral arms.
Owing to the relatively low number of known GMFs and uncertainties in the Galactic models, the relation of GMFs to the Galactic structure remains an open question. Extending the census of GMFs to other quadrants is key to obtain a Galaxy-wide piture of the physical properties of the GMFs.
One key problem in identifying GMFs is that column density data (extinction or emission) alone are not sufficient; spectral line data are needed to ascertain that the structure has a continuous velocity pattern (and hence is likely a continuous object in three dimensions). In short, the extinction patterns must be connected by a molecular gas tracer, usually 13CO, and exhibit velocity coherence (i.e., the velocities of the filaments must have no steep jumps, but rather show continuous velocity gradients, if any). The requirement of having 13CO data greatly hampers building a systematic census of GMFs: an unbiased 13CO survey exists only for the first Galactic quadrant (Jackson et al. 2006, Galactic Ring Survey, GRS hereafter). The GRS covered the region and . The recent three-mm Ultimate Mopra Milky Way Survey (Barnes et al. 2011, 2014, ThruMMS)111http://www.astro.ufl.edu/ peterb/research/thrumms/ presents a good opportunity to trace molecular cloud dynamics in the fourth Galactic quadrant. This ongoing survey covers the fourth quadrant in 12CO, 13CO, C18O, and CN.
In this paper, we extend the current census of GMFs to the fourth Galactic quadrant. We identify the GMFs as NIR/MIR extinction features that are connected structures in 13CO data as probed by the ThruMMS survey. We present a sample of nine newly identified GMFs and their physical properties. We place the results in the Galactic context with the help of models of the spiral-arm pattern of the Galaxy. Finally, we compare the different filament-finding methods to better understand their limitations and complementarity with each others.
2 Data and methods
2.1 Data
2.1.1 12CO and 13CO data
We use the 13CO(J1–0) observations of the ThrUMMS survey DR3 (Barnes et al. 2011, 2014) to test the velocity coherence of the filament candidates. We also use the data to estimate the distance to the GMFs and to obtain their total masses. This ongoing survey is observing the fourth Galactic quadrant at latitudes in 12CO, 13CO, C18O and CN with an angular resolution of and an approximate rms of 1.5 K km/s. ThruMMS offers full spectral coverage of the 13CO line at a spectral resolution km/s. The observations of 12CO and 13CO are mostly complete at . However, less than 25% is complete at Galactic latitudes .
2.1.2 Dust continuum at as a dense gas tracer
We employ the ATLASGAL survey (Schuller et al. 2009; Csengeri et al. 2014) to trace the dense gas component of the GMFs. This survey observed cold dust emission in a large area () of the Galactic plane at m, with a FWHM of 19.2 and a mJy/beam. Although dust emission at sub-mm wavelengths does not generally trace only dense gas, ATLASGAL filters out large scale (2.5) emission, thus making the observations specially sensitive to the densest gas component, generally located in the cold interior of molecular clouds.
2.1.3 Velocity data for the dense gas tracer
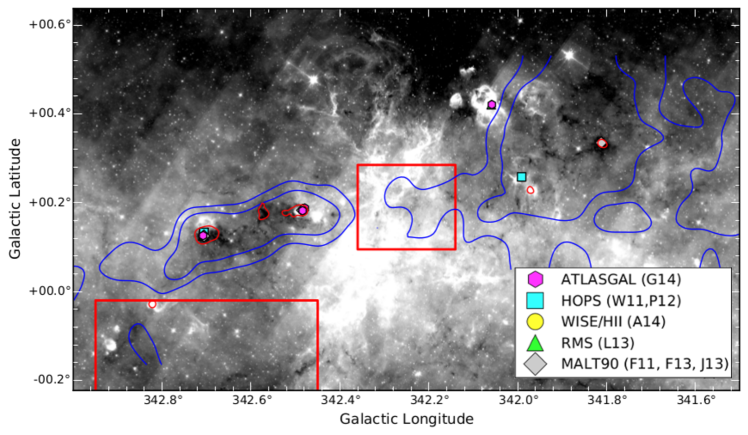
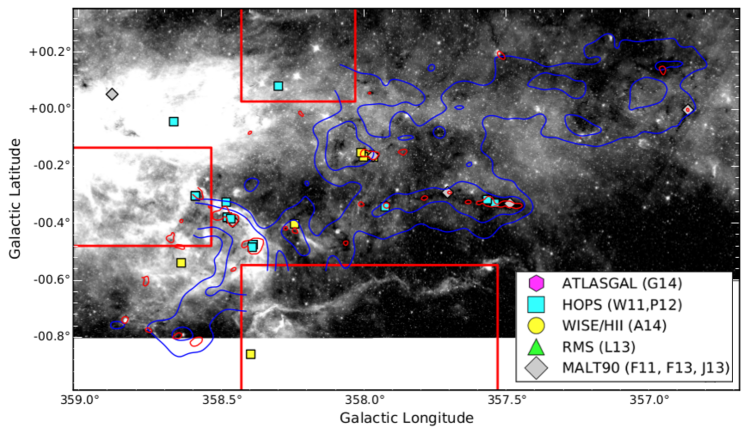
Unfortunately, with only ATLASGAL data, we cannot know whether the emission arises from a GMF or from a different point along the line-of-sight. We need extra spectral information. We employ several catalogs of star formation signposts to confirm that the dense gas is associated with the GMF. We search for counterparts of these catalogs with ATLASGAL clumps and compare the velocity of the sources with those of the GMFs.
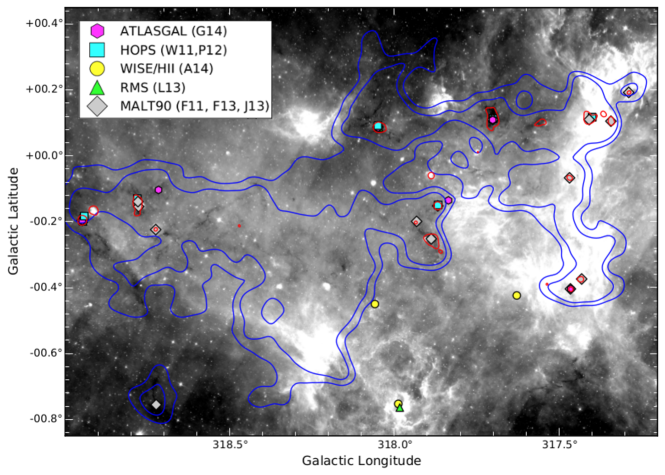
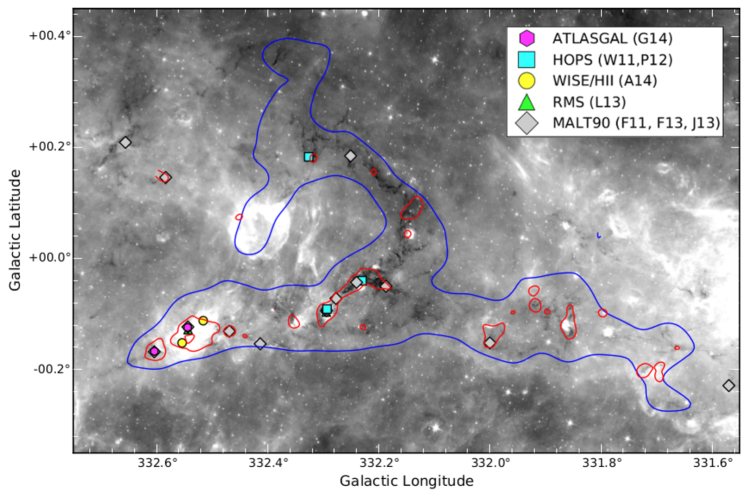
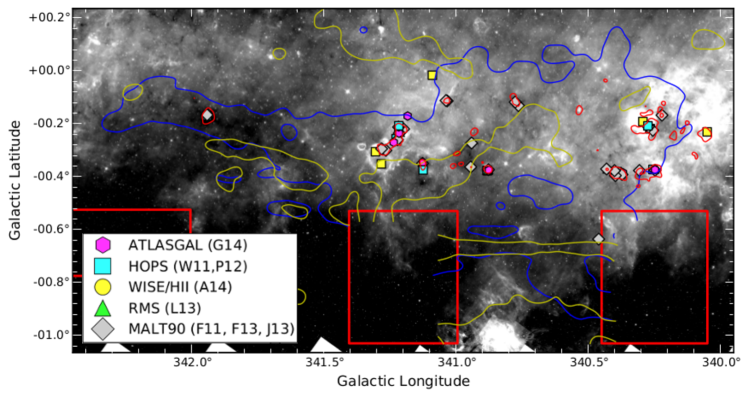
We use the sources with radio recombination line counterparts in the WISE catalog of H II regions (Anderson et al. 2014), the Red MSX Survey (Lumsden et al. 2013, RMS), and the catalogs of NH3 (Purcell et al. 2012) and clumps H2O masers (Walsh et al. 2011) of the HOPS survey. In addition, we use a series of follow-up studies of the ATLASGAL survey: the catalogs of CO depletion and isotopic ratios (Giannetti et al. 2014), methanol massers (Urquhart et al. 2013), and massive star-forming clumps (Urquhart et al. 2014). Further, we use the the catalog of dense clumps from the MALT90 survey (Foster et al. 2011, 2013; Jackson et al. 2013). We list the dense gas tracers associated to the GMFs in Table LABEL:tab:denseTracers.
2.2 Identifying giant molecular filaments
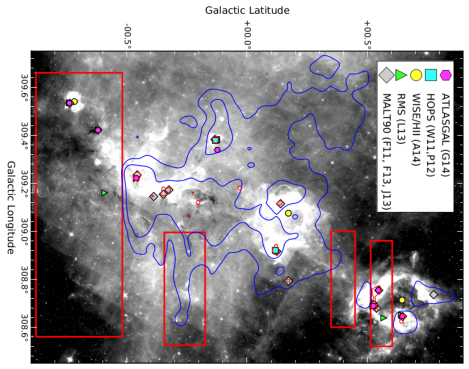
We identify the filament candidates following the same procedure as in R14. The first step is to identify filamentary extinction features by-eye at MIR and NIR wavelengths in the Galactic plane (see Fig. 4–12). In this step, we use available data from GLIMPSE (Benjamin et al. 2003) and 2MASS (Skrutskie et al. 2006) surveys222Both surveys can be visualized in web interfaces at: http://www.alienearths.org/glimpse/ and http://aladin.u-strasbg.fr/AladinLite/, representing wide, unbiased and continuous coverage of the Galactic plane at MIR and NIR wavelengths.
A group of 5 coauthors inspected the data by eye searching for the extinction features. The GMF candidates must satisfy two conditions: 1) the extinction features must have a projected length of , and 2) the group members, in pairs of two persons, must independently confirm the extinction feature as a filament-like structure. Massive episodes of star-formation can disrupt filaments, so we allow for gaps in the extinction structures if signs of massive star-formation are present (e.g., H II regions). We note that the photodissociation regions surrounding H II regions have strong PAH emission. As a result, NIR extinction features may coincide with emission at MIR wavelengths (e.g, 8 m) if there are H II regions or strong radiation sources nearby (Draine 2011). Following this procedure, we find 12 GMF candidates within the fourth Galactic quadrant. The candidates are listed in Table LABEL:tab:filCandList. In the next section, we explore whether the GMF candidates are physically connected using line emission data.
| Candidate ID | ||||
|---|---|---|---|---|
| F358.9-357.4 | 358.9 | 357.4 | -0.4 | -0.4 |
| F354.7-349.7a𝑎aa𝑎aThese filament candidates have not been confirmed as GMFs because they are not velocity coherent. | 354.7 | 349.7 | 0.4 | 0.5 |
| F343.2-341.7 | 343.2 | 341.7 | 0.0 | 0.4 |
| F341.9-337.1 | 341.9 | 337.1 | -0.2 | -0.4 |
| F335.6-333.6 | 335.6 | 333.6 | -0.2 | 0.4 |
| F329.3-326.5 a𝑎aa𝑎aThese filament candidates have not been confirmed as GMFs because they are not velocity coherent. | 329.3 | 326.5 | -0.3 | 0.0 |
| F329.4-327.1 b𝑏bb𝑏bThere is only ThruMMS coverage for the part of the filament. | 329.4 | 327.1 | -0.3 | 1.4 |
| F326.7-325.8 b𝑏bb𝑏bThere is only ThruMMS coverage for the part of the filament. | 326.7 | 325.8 | 0.9 | -0.2 |
| F324.5-321.4 | 324.5 | 321.4 | -0.5 | 0.1 |
| F319.0-318.7 | 319.0 | 318.7 | -0.1 | -0.8 |
| F309.5-308.7 | 309.5 | 308.7 | -0.7 | 0.6 |
| F307.2-305.4 | 307.2 | 305.4 | -0.3 | 0.8 |
2.2.1 Velocity coherence of the candidates
To avoid projection effects caused by physically unrelated molecular clouds along the line-of-sight, we only consider the candidates listed in Table LABEL:tab:filCandList as GMFs once it is confirmed that they are velocity coherent structures. Very long filaments are likely to show velocity gradients due to the differential rotation of the Galaxy. These gradients depend on the location of the filament in the Galaxy. For this reason, we do not restrict the velocity range of the filament candidates, but rather require them to show continuous velocity variations, without steep jumps. The filaments satisfying this requirement are considered velocity coherent.
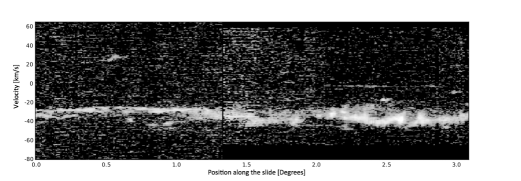
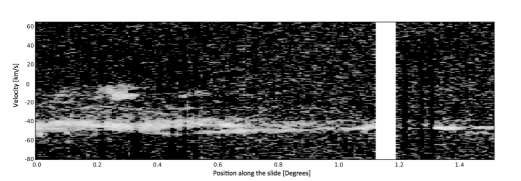
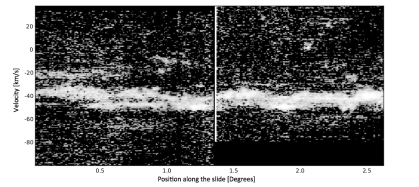
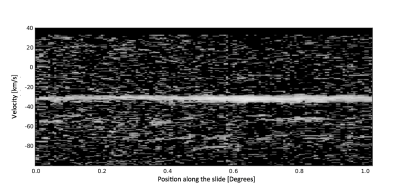
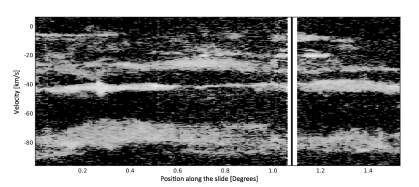
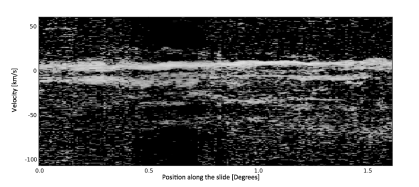
We test the velocity coherence of the candidates using 13CO observations of the ThrUMMS survey (see Sect. 2.1.1). We create position-velocity (PV) diagrams for each GMF candidate integrating the full spectral coverage collapsed over the whole latitude axis. In this step, we used the function sum of python. In the cases in which the PV diagrams show a series of different PV-components, we create 13CO integrated intensity maps for each component. We then compare the extinction features with the 13CO integrated intensity maps. If they represent a single 13CO structure, then the filament candidates are labeled GMFs.
The following candidates are eliminated because their extinction features have no single coherent 13CO velocity component: F354.7-349.7 and F329.3-326.5. The candidates F329.4-327.1 and F326.7-325.8 could not be confirmed because of the lack of proper coverage in the ThrUMMS data. The remaining nine candidates were classified as GMFs.
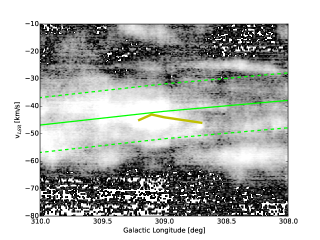
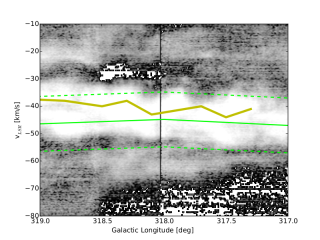
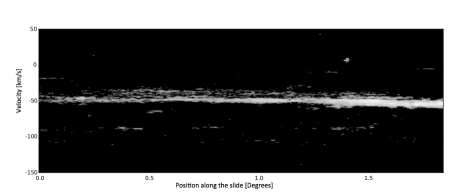
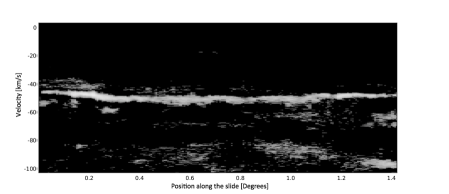
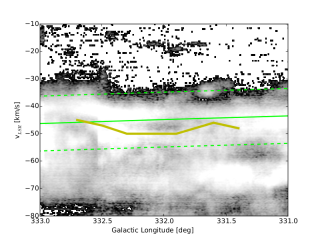
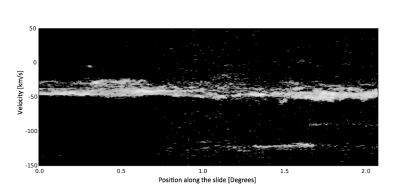
The spiral arms are seen as seen as a single 13CO component with a wide-velocity range in the PV diagrams (see Fig. 4–12). If our GMFs lie inside spiral arms, then it is possible that we are integrating over the full spiral arm, thus overestimating the velocity range of the GMF. We do a fine tuning of the velocity range of the GMFs. We created position-velocity (PV) diagrams over a line following the identified extinction features for each candidate. This process can be done with the python tool, Glue444http://www.glueviz.org/. These PV diagrams are shown in the bottom panels of Fig. 4–12. We also show in Table LABEL:tab:lbvtracks the l–b–v tracks of each filament.
2.2.2 Biases in the extinction-based filament finding method
We acknowledge that this method is necessarily subjective. We make an effort to reduce the subjectivity by requiring that at least three group members agree with the filament identification. In addition, some GMFs that could have been potentially identified may have been missed by our search approach.
Our filament finding method is biased towards the identification of quiescent structures (R14). Even though we allow for gaps in filaments if they carry signs of massive star formation, such violent episodes can disrupt molecular clouds, making them difficult (if not impossible) to be identified as GMFs.
The observation of extinction features against NIR and MIR background requires intense background emission to have enough contrast to identify extinction features. This is true at low Galactic latitudes, where the star density is high, but it is not the case at high latitudes. In general, this is not a severe issue in this work since we target specifically the Galactic plane. However, the region shows low background emission at MIR wavelengths. The identification of extinction features in this region is therefore more difficult due to the lack of contrast between the background and the dense foreground structures.
2.3 Estimating the total and dense molecular gas masses
2.3.1 Total molecular gas mass
To calculate the total gas mass of the filaments, we first obtain the column densities of 13CO. We do so following a standard scheme in which the kinetic temperature of the 13CO, , is assumed to be the same as that of 12CO, and equal to the kinetic temperature, (e.g., Rohlfs & Wilson 2004). We obtain from the brightness temperature of the optically thick line 12CO, ,
| (1) |
with obtained from the peak of the 12CO emission. The optical depth of the 13CO line, , is obtained via
| (2) |
We integrate the 13CO spectra with peaks over 1.5 K555 This value represents the rms of the 13CO spectra. to obtain the total column density of 13CO
| (3) |
For consistency with R14, we convert into 12CO column densities, , using a 12CO/13CO ratio that varies with galactocentric distance following the linear relation (Milam et al. 2005). The galactocentric distances of the filaments are listed in Table. LABEL:tab:filCandVelo. Finally, the 12CO column densities are converted into column densities of molecular gas following: / (Pineda et al. 2010). We find that 13CO integrated intensities of 1.5 K / km/s correspond to .
Finally, we obtain the total molecular gas mass of the GMFs via
| (4) |
where is the mass of the molecular hydrogen, and the number and area of the pixels inside the GMF respectively, and the distance to the GMF (See Sect. 3.1.1).
2.3.2 Dense gas mass
We used the ATLASGAL data to estimate the dense gas mass of the GMFs. We required the ATLASGAL emission to be detected at 5 (250 mJy/beam) for consistency with R14. This emission is equivalent to . We estimate the dense gas mass of each GMF via
| (5) |
where is the ATLASGAL flux, is the distance to the filament, and is the blackbody radiation at 870 m as a function of temperature, , which we assume K. is the gas-to-dust ratio (Draine 2011). We used a dust absorption coefficient at , extrapolated from the dust model of Ossenkopf & Henning (1994) for dust grains with thin ice mantles and a mean density of cm-3.
It is possible that the ATLASGAL emission along the line-of-sight of a filament is not related to the GMF, but rather with molecular clouds at different distances. To avoid this line-of-sight confusion we use spectral information of the star-forming signposts introduced in Sect. 2.1.3. If any of these signposts is associated to an ATLASGAL clump in projection and its 666LSR stands for local standard of rest. lies inside the velocity range of the GMF, then we assume that this ATLASGAL clump is part of the GMF. If we found no star-forming signposts in an ATLASGAL clump, we also assume it to be part of the GMF. If the of the signposts associated with ATLASGAL emission is outside the range of velocities of the GMF, then the associated ATLASGAL clumps are neglected.
3 Results
3.1 Physical properties of the GMFs
In this section we present physical properties of the GMFs: length, velocity gradient, total mass, dense gas mass, and dense gas mass fraction.
3.1.1 Kinematic distance, length and velocity gradient
Before obtaining the mass and length of the GMFs, we estimate their kinematic distances using 13CO data. We fit the spectrum of each GMF with a Gaussian and define the as the centroid of the fit. We used the model of the Galactic spiral arm pattern by Reid et al. (2014) to convert into kinematic distances, assuming the standard Galactic parameters. Our filament-finding method favors identification of nearby filaments. Although infrared dark clouds (IRDCs) can be seen against the MIR background at both sides of the Galaxy, only those in the near side would appear as clear extinction features at NIR wavelengths (Kainulainen et al. 2011). Our extinction method is therefore limited to find filaments up to 8 kpc distance (Kainulainen et al. 2011). We therefore assumed the near kinematic distances to our GMFs. The velocities and distances to the GMFs are listed in Table LABEL:tab:filCandVelo. We find distances between 2.2–3.7 kpc. These are similar to previously identified GMFs. For comparison with the kinematic distances, we also list in Table LABEL:tab:filCandVelo the distances derived from dust extinction (Marshall et al. 2009). We estimated the mean extinction distance to the GMFs as the average of every counterpart in Marshall et al. (2009) associated to the GMFs and assume their standard deviation as the uncertainty. In general we obtain larger distances using this method. This is consistent with a systematic offset of 1.5 kpc between kinematic and extinction derived distances, already reported in Marshall et al. (2009).
We estimate the angular length of the GMFs using a line that follows the extinction and emission features at from end to end of the significant 13CO emission (1.5 K km/s) of each filament (see Fig. 4–12). The significant emission is estimated measuring the noise of the CO integrated intensity maps. We find angular lengths between and . The angular length is converted into physical length using the distances previously estimated. No corrections are applied for the projection effects. These lengths are therefore lower limits. We found GMF projected lengths between 40–170 pc, with a mean of 100 pc. These values are similar to the filaments identified by R14.
We estimate the projected velocity gradient of the GMFs as -, where and are the velocity centroids at both ends of the GMF and is the projected length of the GMF. Most of the GMFs exhibit projected velocity gradients throughout their extent, except the GMF 324.5-321.4, that shows no projected velocity gradient over its 120 pc size. We found projected velocity gradients between 0–120 km/s kpc-1 (see Table LABEL:tab:filCandVelo). We emphasize that these velocity gradients are projected. We did not correct them from projection effects. Therefore, these gradients offer a pure observational measure and should not be directly connected to velocity gradients introduced by Galactic rotation or shear motions.
| Filament ID | d𝑑dd𝑑dWe have used the kinematic distances to the sources, with the exception of GMF 358.9-357.4, for which we have used the extinction-based distance estimate. | Rgal | ||||||||
|---|---|---|---|---|---|---|---|---|---|---|
| GMF | [] | [] | [] | [km s-1] | [kpc] | [kpc] | [pc] | [km s-1 kpc-1] | [pc] | [pc] |
| 307.2-305.4 | [307.4,304.7] | [-0.3,0.6] | 3.1 | -29, -35, -39 | 3.1 | 168 | 59 | 7.2 | 20 | |
| 309.5-308.7 | [309.6,308.6] | [-0.7,0.7] | 1.5 | -41, -43, -47 | 3.7 | 97 | 62 | 6.8 | 25 | |
| 319.0-318.7 | [319.0,317.3] | [-0.8,0.2] | 2.6 | -35, -40, -44 | 2.8 | 73 | 123 | 6.7 | 25 | |
| 324.5-321.4 | [324.3,321.4] | [-0.3,0.2] | 3.1 | -32, -32, -32 | 2.2 | —c𝑐cc𝑐cNo Marshall et al. (2009) counterparts in this filament. | 119 | 0 | 6.9 | 7 |
| 324.5-321.4ba𝑎aa𝑎aMost conservative definition of GMF324.5-321.4 (See Sect. A.4). | [322.7,321.4] | [-0.2,0.2] | 1.0 | -32, -32, -32 | 2.2 | c𝑐cc𝑐cNo Marshall et al. (2009) counterparts in this filament. | 38 | 0 | 6.9 | 21 |
| 335.6-333.6a | [335.8,332.2] | [0.0,-0.6] | 2.0 | -46, -50, -53 | 3.4 | 119 | 59 | 5.7 | 7 | |
| 335.6-333.6b | [332.8,331.6] | [-0.2,-0.2] | 1.4 | -48, -50, -51 | 3.3 | 81 | 39 | 5.8 | 13 | |
| 341.9-337.1 | [342.2,340.2] | [-0.1,-0.2] | 2.1 | -43, -44, -48 | 3.5 | 128 | 31 | 5.3 | 7 | |
| 343.2-341.7 | [342.8,341.7] | [0.0,0.5] | 1.5 | -43, -41, -41 | 3.4 | 89 | 22 | 5.3 | 33 | |
| 358.9-357.4 | [358.1,357.4] | [-0.4,-0.3] | 1.6 | 5, 7, 8 | —b𝑏bb𝑏bWe avoid the use of kinematic distance in this GMF since it lies in the Galactic center region. | 81 | 37 | 5.6 | 3 |
3.1.2 Dense gas mass fraction (DGMF)
We estimate the total molecular gas mass and the dense gas mass of the GMFs following the procedures described in Sect. 2.3.1 and Sect. 2.3.2. We obtain total molecular cloud masses in the range of M☉. We found dense gas masses between M☉.
We calculate the dense gas mass fraction (DGMF) of the GMFs as the ratio of the dense to total molecular gas masses of the GMFs. This quantity has been recently connected to the star-forming rate of molecular clouds (Heiderman et al. 2010; Lada et al. 2010, 2012; Abreu-Vicente et al. 2015). In general, we find DGMFs between 1.5% and 15%. However, the filament GMF 335.6-333.6 shows a larger DGMF, 37%. This large value is related to the massive H II complex G333, from which most of the ATLASGAL emission of the GMF arises (see Fig 8). The DGMF of this filament agrees with values found in massive ( M☉) H II regions in the Galactic plane (Abreu-Vicente et al. 2015). The lower DGMF values found in the other filaments are consistent with those found in the GMF sample of R14 and other large molecular filaments (Battersby & Bally 2014; Kainulainen et al. 2013). These values are also characteristic for local star-forming clouds (Kainulainen et al. 2009; Lada et al. 2010, 2012) and high-mass star-forming clumps (Johnston et al. 2009; Battisti & Heyer 2014).
The main uncertainty in our dense gas mass estimates is the distance to the filaments. This is also the case for the total gas mass. Unfortunately, the ThruMMS data has a non-uniform noise coverage that may lead to lose significant 13CO emission in some of our GMFs, limiting our ability to measure their total gas mass. In addition, five of the GMFs are only partly covered by the ThruMMS data. As a consequence of these issues, we can only measure lower limits of the actual total gas mass in most of our GMFs, resulting in upper limits for the DGMFs. These are indicated in Table LABEL:tab:filCandVelo2. We also show these regions in Fig. 4–12.
| Filament ID | M(13CO) | M(AGAL) | DGMF | Assoc. | Arm |
|---|---|---|---|---|---|
| [ M☉] | [ M☉] | [%] | |||
| GMF 307.2-305.4 | 10.6 | G 305 H II complex | Centaurus | ||
| GMF 309.5-308.7 | RCW 179,Gum 48d | Centaurus | |||
| GMF 319.0-318.7 | 2.9 | … | Centaurus | ||
| GMF 324.5-321.4 | IRDC 321.71+0.07 | … | |||
| GMF 324.5-321.4b | 5.0 | IRDC 321.71+0.07 | … | ||
| GMF 335.6-333.6 | RCW106, G333 | Centaurus | |||
| GMF 335.6-333.6b | 15.0 | … | Centaurus | ||
| GMF 341.9-337.1 | … | … | |||
| GMF 343.2-341.7 | … | … | |||
| GMF 358.9-357.4 | IRDC G357 | Centaurus |
3.2 Giant molecular filaments in the Galaxy
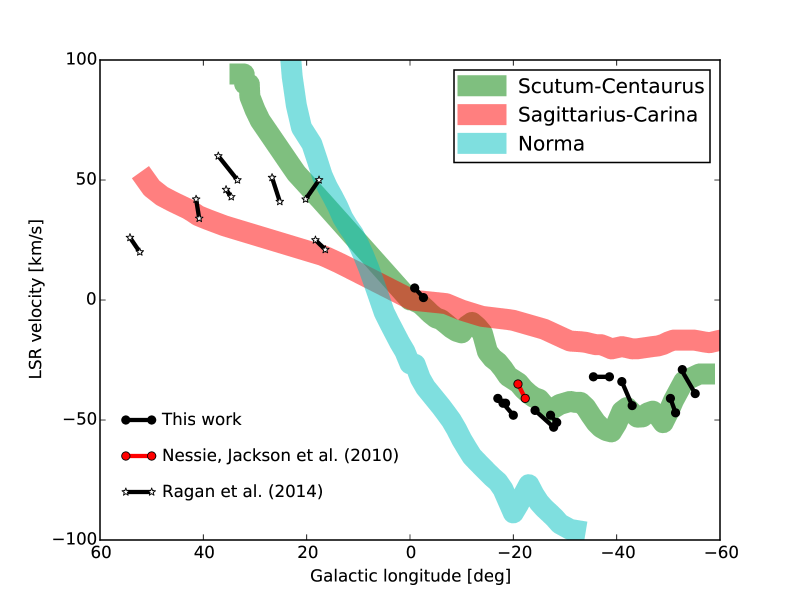
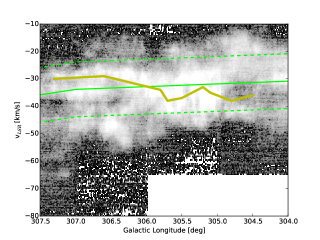
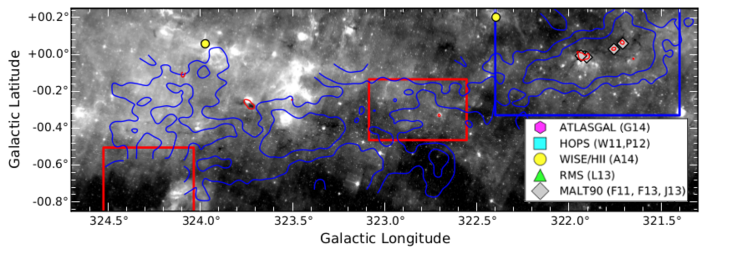
What is the role of the GMFs in the Galactic spiral structure? Do they belong to the spiral arms or to inter-arm regions? We explore the answer to these questions in Fig. 1, in which we show the of the three inner spiral arms in the fourth quadrant as function of their galactic longitude following Reid et al. (2014). For simplicity, since our filament finding method is more likely to reveal filaments in the near side of the Galaxy (Sect. 3.1.1), we only show the near distance solutions of the spiral arms. We measure the velocities at the ends of the filaments and plot them in Fig. 1. We find that six out of nine of our GMFs are connected to the Centaurus spiral arm, while three GMFs lie in inter-arm regions.
We also re-examine the locations of the GMFs identified by R14 using the Reid et al. (2014) model. We find that three out of their seven GMFs are connected to spiral arms (see Fig. 1), two of them to the Sagittarius arm and a third one to the Scutum arm. If we put together the GMF samples of R14 and this work we find that nine out of 16 GMFs are related to spiral arms. The percentage of spiral arm filaments higher in the fourth quadrant (67%) than in the first (¡50%). In the first quadrant the GMFs are associated to the Sagittarius and Scutum arms, while in the fourth quadrant they are preferentially connected to the Centaurus arm.
The higher fraction of spiral arm filaments found by us compared to R14 is affected by our use of the Reid et al. (2014) model instead of the Vallée (2008) model. One of the main differences between Vallée (2008) and (Reid et al. 2014) is that the latter compare their model with typical spiral arm tracers such as H II regions or massers while this step is not done in the former work. The velocities of the Sagittarius arm, the closest spiral arm in the first quadrant, are significantly different in Vallée (2008) and (Reid et al. 2014) models.
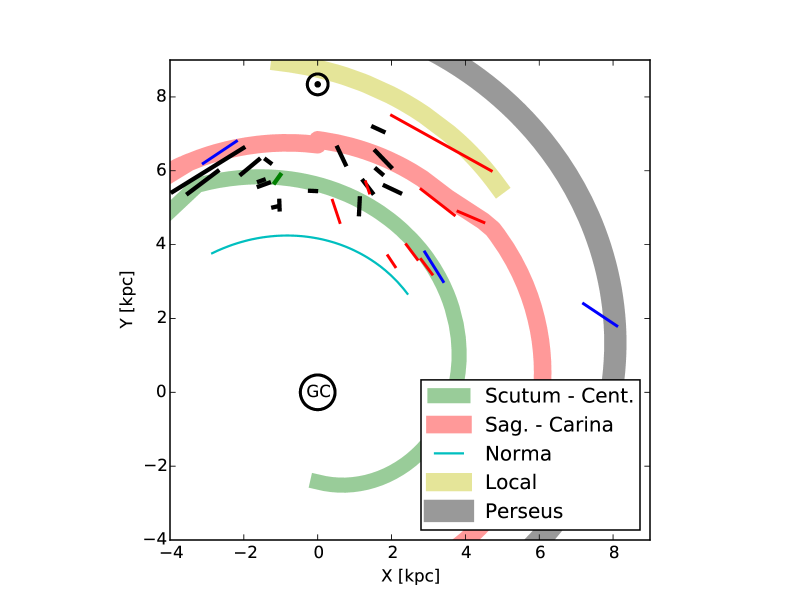
Now we study the relative orientations of the GMFs compared to the spiral arms. Here we analyze together the GMF samples of this work and R14. Figure 2 shows that there are seven GMFs connected to the Scutum-Centaurus arm, two to the Sagittarius arm and there are seven GMFs located in inter-arm regions. Four of the GMFs connected to spiral arms in Fig. 2 are connected only by one of their ends. We now address whether the uncertainties are large enough to place part of a filament in an inter-arm region even if it lies within a spiral arm.
There are three main sources of error that play a role in the location of the filaments: the spiral arm width, the velocity resolution of the 13CO spectra, and the uncertainty in the kinematic distance. The latter is by far the most important. The distance uncertainties of our GMFs, obtained from the Reid et al. (2014) model, range between [0.7–0.3] kpc (see Table. LABEL:tab:filCandVelo). These uncertainties are larger than the widths of the Scutum-Centaurus and Sagittarius spiral arms, 0.17 kpc and 0.26 kpc respectively, in the Reid et al. (2014) model. The estimates of the exact location of the filaments, based on these kinetic distances alone, are not enough to claim are not enough to claim that the GMFs are located in spiral arms, inter-arm regions or connect both.
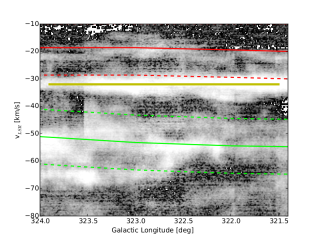
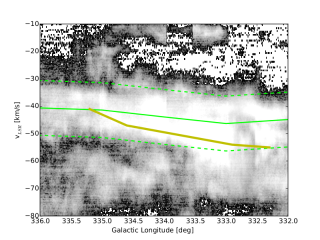
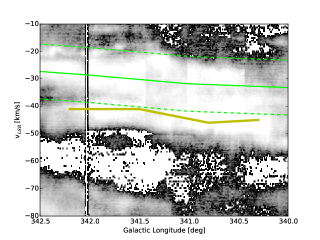
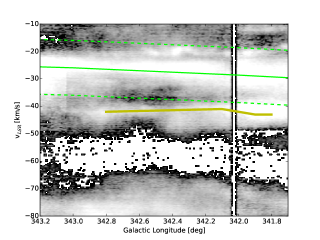
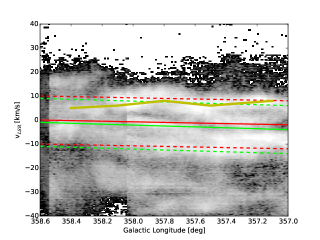
We now complement this study with PV diagrams of the 12CO emission, integrated between . If a GMF lies inside a spiral arm, its velocity should be consistent with that of the spiral arm. A spiral arm appears in a PV diagram as a strong single component. We overlay a line showing the velocity of the GMF as function of its Galactic longitude on the PV diagram. If this line falls completely inside 12CO emission of any spiral arm, we could say that the GMF is completely within it. If it falls outside, we can confirm that the GMF is located in an inter-arm region. We show the results of this experiment in the bottom panels of Fig. 4–12. These figures confirm that every GMF connected to a spiral arm in Fig. 2 has velocities consistent with the arm over its whole extent. These data offer no support for the hypothesis that some of the GMFs could be a spur (i.e., a filament connecting spiral-arms with inter-arm regions observed in external galaxies.) Similarly, the inter-arm GMFs show velocities not consistent with the spiral arms. We note that the spiral arm positions of some of our GMFs are independently confirmed by previous works, focused on particular H II regions or IRDCs within them (see App. A).
4 Discussion
4.1 Comparing large-scale filament finding methods
Three methods have been used so far to systematically search for tens-of-parsec scale filaments. Two of them, based on identification of the filaments as extinction features against the MIR/NIR background of the Galactic plane, have been used by R14, Zucker et al. (2015), and this work. In this work and in R14 we look for the largest filamentary structures in the Milky Way, irrespective of their relative orientation with respect to the galactic midplane or spiral arms. The filaments revealed by both works are known as GMFs. Instead, Zucker et al. (2015) search explicitly for Nessie analogues (i.e., filaments within spiral arms and parallel to the Galactic midplane). They refer to these filaments bones. The third method identifies the filaments as extended emission features at far-infrared (FIR) wavelengths using Herschel data (Wang et al. 2015). We will refer to these as emission-identified filaments. In principle, this naming scheme does not imply that the physical properties of the objects are different, nor that they should be called differently.
We compare first the GMFs and the bones. In the galactic plane areas common to Zucker et al. (2015), R14, and this work there are nine bones, including Nessie, and 16 GMFs, seven from R14 and nine from this paper. At first look, the bones should be a sub-group of the GMFs in which only GMFs (or sub regions within them) parallel to the Galactic mid-plane and inside spiral arms would be identified as bones. However, only three bones correspond to our GMFs. The filaments 10, 8 and 5 in Zucker et al. (2015) are sub-regions of the GMF 335.6-333.6, GMF 358.9-357.4, and GMF 20-17.9999As it has been noted by Zucker et al. (2015) that this GMF may not satisfy all the requirements to be considered as such. Concretely, it shows a steep jump in velocity in the PV diagram., respectively. The main reasons why only three out of nine bones of Zucker et al. (2015) overlap with the GMFs is because these bones have angular lengths clearly below , which is one of our GMF requirements. This property makes the bones and GMFs not directly comparable to each other.
We now compare the extinction and emission-identified filaments. Only three out of nine emission filaments in Wang et al. (2015) have also been identified in extinction. These filaments, labeled in Wang et al. (2015) as G339, G11, and G26, correspond respectively to Nessie, the filament 6 in Zucker et al. (2015), and the GMF 26.7-25.4 in R14. The emission-identified filaments can be missed as extinction filaments because of lack of contrast between the filament and the MIR/NIR background. On the other hand, extinction filaments may not be identified in emission due to background and foreground confusion along the line-of-sight. Despite these differences both methods are likely to reveal quiescent structures in the early stages of star-formation. We conclude that the extinction and emission filament finding methods compliment each other well, finding filaments that can only be identified using one of both methods.
Do the physical properties of the filaments identified with the three different techniques agree? The bones have lengths between 13 pc and 52 pc and are the smallest of the three samples. The lengths of the emission-identified filaments (37–99 pc) are comparable to those of the GMFs (see Table LABEL:tab:filCandVelo). The bones and emission-identified filaments have masses on the order , and with the GMFs being the most massive large-scale filaments (see Table LABEL:tab:filCandVelo2). The masses of the emission-identified filaments and the bones are comparable to the dense gas masses of the GMFs. This is a selection effect. The masses of the bones are obtained over an area equivalent to the extinction feature and not over the full 13CO emission as it is the case for our GMFs101010Not to mention that they are generally smaller than the GMFs and the emission-identified filaments. The similarity between the masses of the emission-identified filaments and the dense gas mass of the GMFs is a consequence of the dense gas material traced by the FIR continuum at 350 and 500 . The area covered by this emission is limited to dense regions that are surrounded by more diffuse 13CO emission. The masses of the emission filaments and bones are therefore comparable only to the dense gas mass of the GMFs rather than to the total mass.
The direct comparison of the physical properties of the different kind of large filaments found so far is not straightforward. Each of the techniques used so far measures the filament properties on its on way. We encourage the use of the technique used in this paper to obtain the bulk properties of long filaments in the future, so that they can be compared to the existing sample.
Do these filament techniques preferentially find spiral- or inter-arm filaments? In this discussion we do not include the bones since they lie within spiral arms by definition. Seven out of nine (78%) emission-identified filaments lie in spiral arms (Wang et al. 2015), as shown with the red filaments of Fig. 2. This percentage is lower for the extinction filaments (11 out of 18, 61%). Although the percentage of spiral arm emission-identified filaments is larger than that of extinction filaments, we acknowledge that with the small number of statistics we have this different may not be significant.
4.2 Dense gas mass fraction and its variation with the filament location
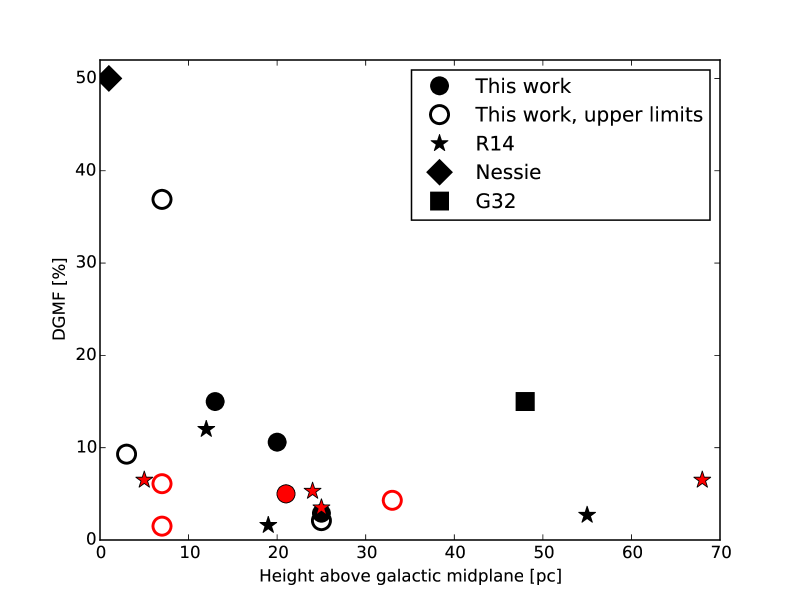
R14 found a tentative anti-correlation between the DGMF of the filaments and their distance to the Galactic midplane. They also found that the filament with highest DGMF in their sample was located in a spiral arm. This is also the case of the large-scale filament with the highest DGMF known to date, Nessie, with a DGMF (Goodman et al. 2014). However, we note that the dense gas mass estimates in Goodman et al. (2014) are made using HCN and not using sub-mm dust emission as in R14 or this work. The results of R14 have however poor statistics due to the low number of GMFs in their sample. We explore this relationship further with our extended GMF sample.
The GMFs lie preferentially above the physical galactic midplane, which is located at about in the fourth quadrant. In Fig. 3 we show the relationship between the height above the galactic plane, , and the DGMFs of the GMF samples of this work, R14, Battersby & Bally (2014) and Nessie. It shows no correlation at all between and the DGMFs. The two filaments with the largest DGMFs lie close to the galactic midplane. However, the scatter in the DGMFs at any , and particularly at pc, is also very high. We therefore conclude that there is no evidence for correlation between the height above the galactic plane and the DGMF of the filaments. However, in this work we only cover scales of a few tens of parsecs, while we are able to study kilo-parsec scales along the line of sight. We cannot rule out the possibility of a DGMF- relation at larger scales.
Another interesting points to look at are the difference in the DGMFs of spiral arm filaments and inter-arm filaments and the difference in DGMFs within different spiral arms. We found that the DGMF of the GMFs that belong to the Scuttum-Crux arm is , while that of the GMFs in the Sagittarius arm is , where the uncertainties are the standard deviation of the mean DGMFs. However, only two GMFs lie in the Sagittarius arm, generating a very poor statistical sample. Now we compare the DGMFs of arm and inter-arm GMFs. We estimate the mean DGMFs for every giant filament (GMF or emission) with DGMF estimates. We find that the mean DGMF in spiral arm filaments is while this value is lower in the inter-arm filaments, . We note the big scatter in the DGMF of the spiral arm filaments, due mainly to Nessie and GMF 335.6-333.6, with DGMFs of 50% and 37% respectively. We performed an independent-samples t-test to compare the DGMFs of spiral- and inter-arm GMFs. We used the task ttest-ind from the package scipy in Python. This task returns the -value and also a -value111111 If the -value returned by ttest-ind is lower than 0.10, then both means are significantly different. that is an indication on the significance of the means. We found a significant difference in the DGMFs of spiral-arm () and inter-arm GMFS (), with =2.02 and =0.07. We can therefore assume that the mean DGMF of the spiral arm GMFs is higher than that of the inter-arm filaments. This is in agreement with observations in external galaxies, where the amount of dense gas is larger in the spiral arms than in inter-arm regions (Hughes et al. 2013; Schinnerer et al. 2013). The connection between the DGMF and the star-forming activity of molecular clouds (Kainulainen et al. 2009; Lada et al. 2010, 2012; Abreu-Vicente et al. 2015) and this result suggest that the spiral arm filaments have larger star-forming potential than the inter-arm filaments. In other words, the star-forming activity of the GMFs depend on its Galactic location with respect to the spiral arms.
The masses of our GMFs, and also those of R14, are consistent with the definition of giant molecular clouds (GMCs). Stark & Lee (2006) found, using a sample of 56 GMCs (defined by them as molecular clouds with M☉), that all GMCs were related to spiral arms. Only a 10% of less massive clouds were found to be unrelated to spiral arms. Following the GMC definition of Stark & Lee (2006), we found that five out of 14 GMFs consistent with GMC masses are in inter-arm regions. We therefore find that most of the GMCs in the Galaxy are related to spiral arms, as it was found by (Dame et al. 1986). Although the GMC population is enhanced in the spiral arms, the star-forming activity is not significantly enhanced on them (Eden et al. 2012, 2013; Moore et al. 2012). Our results agree with a picture on which a non-negligible amount GMCs can be found outside spiral arms, as also seen in external galaxies (Schinnerer et al. 2013). Also in external galaxies, Foyle et al. (2010) have reported significant star-forming activity in inter-arm regions.
5 Conclusions
We have used the 2MASS, GLIMPSE, and ThruMMS surveys to extend the GMF catalog initiated in R14 to the fourth Galactic quadrant. We inspected visually the NIR/MIR images to look for filamentary extinction features of at least one degree in angular length. We then used spectral 13CO information from the ThruMMS survey to confirm that those features are continuous in velocity.
-
•
We present a sample of nine newly identified GMFs. The projected lengths of the new GMFs range from 38 pc to 168 pc. Total masses as traced by 13CO are between and . We also used the cold dust emission at 870 to estimate the dense gas mass of the GMFs and found that it ranges from to .
-
•
The ratio of the dense and total gas masses is the DGMF, which ranges between 1.5% and 37%. The largest is related with the H II complex G333 in the GMF 335.6-333.6. This value agrees with the DGMFs of massive (¿) molecular clouds with H II regions found in Abreu-Vicente et al. (2015). The other values, between 1.5% and 15%, are consistent with typical DGMFs found in molecular clouds (Battisti & Heyer 2014; Abreu-Vicente et al. 2015).
-
•
We explored the role of the GMFs identified by us and R14 in the Galactic context. Adopting the Reid et al. (2014) Galactic model, we find that nine out of 16 GMFs are connected to spiral arms. Seven out of these nine filaments are connected to the Scutum-Centaurus arm and two to the Sagittarius arm. Three GMFs of R14 are related to spiral arms when the Reid et al. (2014) model is used, while only one is if Vallée (2008) model is used.
-
•
We find no correlation between the DGMFs of GMFs and the distance from the Galactic midplane. This result disagrees with the tentative correlation found by R14. However, we note that we only observed GMFs within a few tens of parsecs of the Galactic midplane. We found that the DGMFs of the spiral arm GMFs are larger than those of the inter-arm GMFs. This result agrees with observations of external galaxies showing that the DGMFs of molecular clouds within spiral arms have larger DGMFs than inter-arm clouds (Hughes et al. 2013; Schinnerer et al. 2013). The DGMF has a direct relationship with the star-forming activity (Kainulainen et al. 2009; Lada et al. 2012). This result therefore suggests that the star-forming potential of the GMFs is tightly connected to their relative position to the Galactic spiral arms.
-
•
We compared the different methods used to date to identify large filaments: filaments identified as extinction features (GMFs and bones) and emission-identified filaments. The GMFs and the emission-identified filaments have comparable sizes and are generally larger than the bones. The total masses of the bones and the emission filaments are comparable to the dense gas masses of our GMF sample. This result is an observational effect since both, bones and emission filaments, search preferentially dense gas. Emission filaments are more preferentially connected to the spiral arms than our GMFs. Due to the different biases of the extinction and emission filament finding methods, each method can identify filaments that are missed by the other.
Acknowledgements.
The work of J.A. is supported by the Sonderforschungsbereich (SFB) 881 “The Milky Way System ”and the International Max-Planck Research School (IMPRS) at Heidelberg University. The work of J.K. was supported by the Deutsche Forschungsgemeinschaft priority program 1573 (“Physics of the Interstellar Medium”). S.E.R. acknowledges support from VIALACTEA, a Collaborative Project under Framework Programme 7 of the European Union, funded under Contract # 607380. We thank to M. Reid and T. Dame for providing us with an updated version of their Galactic model and also for very useful discussions that helped to improve the manuscript. This paper has used information from the RMS survey database at www.ast.leeds.ac.uk/RMS constructed with support from the Science and Technology Facilities Council of the UK. This research has made use of the SIMBAD database, operated at the CDS, France.References
- Abreu-Vicente et al. (2015) Abreu-Vicente, J., Kainulainen, J., Stutz, A., Henning, T., & Beuther, H. 2015, A&A, 581, A74
- Anderson et al. (2014) Anderson, L. D., Bania, T. M., Balser, D. S., et al. 2014, ApJS, 212, 1
- André et al. (2014) André, P., Di Francesco, J., Ward-Thompson, D., et al. 2014, Protostars and Planets VI, 27
- Bains et al. (2006) Bains, I., Wong, T., Cunningham, M., et al. 2006, MNRAS, 367, 1609
- Bally et al. (1987) Bally, J., Langer, W. D., Stark, A. A., & Wilson, R. W. 1987, ApJ, 312, L45
- Barnes et al. (2014) Barnes, P., Lo, N., Jones, P., et al. 2014, The Three-mm Ultimate Mopra Milky way Survey (MALT110): Completion of Phase II, ATNF Proposal
- Barnes et al. (2011) Barnes, P., Lo, N., Muller, E., et al. 2011, ThrUMMS (MALT110): the Three-mm Ultimate Mopra Milky way Survey, ATNF Proposal
- Battersby & Bally (2014) Battersby, C. & Bally, J. 2014, Astrophysics and Space Science Proceedings, 36, 417
- Battisti & Heyer (2014) Battisti, A. J. & Heyer, M. H. 2014, ApJ, 780, 173
- Benjamin et al. (2003) Benjamin, R. A., Churchwell, E., Babler, B. L., et al. 2003, PASP, 115, 953
- Beuther et al. (2011) Beuther, H., Kainulainen, J., Henning, T., Plume, R., & Heitsch, F. 2011, A&A, 533, A17
- Csengeri et al. (2014) Csengeri, T., Urquhart, J. S., Schuller, F., et al. 2014, A&A, 565, A75
- Dame et al. (1986) Dame, T. M., Elmegreen, B. G., Cohen, R. S., & Thaddeus, P. 1986, ApJ, 305, 892
- Davies et al. (2012) Davies, B., Clark, J. S., Trombley, C., et al. 2012, MNRAS, 419, 1871
- Draine (2011) Draine, B. T. 2011, Physics of the Interstellar and Intergalactic Medium
- Eden et al. (2013) Eden, D. J., Moore, T. J. T., Morgan, L. K., Thompson, M. A., & Urquhart, J. S. 2013, MNRAS, 431, 1587
- Eden et al. (2012) Eden, D. J., Moore, T. J. T., Plume, R., & Morgan, L. K. 2012, MNRAS, 422, 3178
- Foster et al. (2011) Foster, J. B., Jackson, J. M., Barnes, P. J., et al. 2011, ApJS, 197, 25
- Foster et al. (2013) Foster, J. B., Rathborne, J. M., Sanhueza, P., et al. 2013, PASA, 30, 38
- Foyle et al. (2010) Foyle, K., Rix, H.-W., Walter, F., & Leroy, A. K. 2010, ApJ, 725, 534
- Giannetti et al. (2014) Giannetti, A., Wyrowski, F., Brand, J., et al. 2014, A&A, 570, A65
- Goodman et al. (2014) Goodman, A. A., Alves, J., Beaumont, C. N., et al. 2014, ApJ, 797, 53
- Hacar et al. (2013) Hacar, A., Tafalla, M., Kauffmann, J., & Kovács, A. 2013, A&A, 554, A55
- Heiderman et al. (2010) Heiderman, A., Evans, II, N. J., Allen, L. E., Huard, T., & Heyer, M. 2010, ApJ, 723, 1019
- Hindson et al. (2010) Hindson, L., Thompson, M. A., Urquhart, J. S., Clark, J. S., & Davies, B. 2010, MNRAS, 408, 1438
- Hughes et al. (2013) Hughes, A., Meidt, S. E., Schinnerer, E., et al. 2013, ApJ, 779, 44
- Jackson et al. (2010) Jackson, J. M., Finn, S. C., Chambers, E. T., Rathborne, J. M., & Simon, R. 2010, ApJ, 719, L185
- Jackson et al. (2013) Jackson, J. M., Rathborne, J. M., Foster, J. B., et al. 2013, PASA, 30, 57
- Jackson et al. (2006) Jackson, J. M., Rathborne, J. M., Shah, R. Y., et al. 2006, ApJS, 163, 145
- Johnston et al. (2009) Johnston, K. G., Shepherd, D. S., Aguirre, J. E., et al. 2009, ApJ, 707, 283
- Kainulainen et al. (2011) Kainulainen, J., Alves, J., Beuther, H., Henning, T., & Schuller, F. 2011, A&A, 536, A48
- Kainulainen et al. (2009) Kainulainen, J., Beuther, H., Henning, T., & Plume, R. 2009, A&A, 508, L35
- Kainulainen et al. (2013) Kainulainen, J., Ragan, S. E., Henning, T., & Stutz, A. 2013, A&A, 557, A120
- Karr et al. (2009) Karr, J. L., Manoj, P., & Ohashi, N. 2009, ApJ, 697, 133
- Lada et al. (2012) Lada, C. J., Forbrich, J., Lombardi, M., & Alves, J. F. 2012, ApJ, 745, 190
- Lada et al. (2010) Lada, C. J., Lombardi, M., & Alves, J. F. 2010, ApJ, 724, 687
- Li et al. (2013) Li, G.-X., Wyrowski, F., Menten, K., & Belloche, A. 2013, A&A, 559, A34
- Lumsden et al. (2013) Lumsden, S. L., Hoare, M. G., Urquhart, J. S., et al. 2013, ApJS, 208, 11
- Marshall et al. (2009) Marshall, D. J., Joncas, G., & Jones, A. P. 2009, ApJ, 706, 727
- Milam et al. (2005) Milam, S. N., Savage, C., Brewster, M. A., Ziurys, L. M., & Wyckoff, S. 2005, ApJ, 634, 1126
- Molinari et al. (2014) Molinari, S., Bally, J., Glover, S., et al. 2014, Protostars and Planets VI, 125
- Mookerjea et al. (2004) Mookerjea, B., Kramer, C., Nielbock, M., & Nyman, L.-Å. 2004, A&A, 426, 119
- Moore et al. (2012) Moore, T. J. T., Urquhart, J. S., Morgan, L. K., & Thompson, M. A. 2012, MNRAS, 426, 701
- Ossenkopf & Henning (1994) Ossenkopf, V. & Henning, T. 1994, A&A, 291, 943
- Pineda et al. (2010) Pineda, J. L., Goldsmith, P. F., Chapman, N., et al. 2010, ApJ, 721, 686
- Purcell et al. (2012) Purcell, C. R., Longmore, S. N., Walsh, A. J., et al. 2012, MNRAS, 426, 1972
- Ragan et al. (2014) Ragan, S. E., Henning, T., Tackenberg, J., et al. 2014, A&A, 568, A73
- Reid et al. (2014) Reid, M. J., Menten, K. M., Brunthaler, A., et al. 2014, ApJ, 783, 130
- Rohlfs & Wilson (2004) Rohlfs, K. & Wilson, T. L. 2004, Tools of radio astronomy
- Roman-Lopes et al. (2009) Roman-Lopes, A., Abraham, Z., Ortiz, R., & Rodriguez-Ardila, A. 2009, MNRAS, 394, 467
- Russeil (2003) Russeil, D. 2003, A&A, 397, 133
- Saito et al. (2001) Saito, H., Mizuno, N., Moriguchi, Y., et al. 2001, PASJ, 53, 1037
- Schinnerer et al. (2013) Schinnerer, E., Meidt, S. E., Pety, J., et al. 2013, ApJ, 779, 42
- Schneider & Elmegreen (1979) Schneider, S. & Elmegreen, B. G. 1979, ApJS, 41, 87
- Schuller et al. (2009) Schuller, F., Menten, K. M., Contreras, Y., et al. 2009, A&A, 504, 415
- Skrutskie et al. (2006) Skrutskie, M. F., Cutri, R. M., Stiening, R., et al. 2006, AJ, 131, 1163
- Stark & Lee (2006) Stark, A. A. & Lee, Y. 2006, ApJ, 641, L113
- Stutz & Gould (2015) Stutz, A. M. & Gould, A. 2015, ArXiv e-prints
- Tackenberg et al. (2013) Tackenberg, J., Beuther, H., Plume, R., et al. 2013, A&A, 550, A116
- Urquhart et al. (2014) Urquhart, J. S., Moore, T. J. T., Csengeri, T., et al. 2014, MNRAS, 443, 1555
- Urquhart et al. (2013) Urquhart, J. S., Moore, T. J. T., Schuller, F., et al. 2013, MNRAS, 431, 1752
- Vallée (2008) Vallée, J. P. 2008, AJ, 135, 1301
- Vasyunina et al. (2009) Vasyunina, T., Linz, H., Henning, T., et al. 2009, A&A, 499, 149
- Walsh et al. (2011) Walsh, A. J., Breen, S. L., Britton, T., et al. 2011, MNRAS, 416, 1764
- Wang et al. (2015) Wang, K., Testi, L., Ginsburg, A., et al. 2015, MNRAS, 450, 4043
- Zavagno et al. (2006) Zavagno, A., Deharveng, L., Comerón, F., et al. 2006, A&A, 446, 171
- Zucker et al. (2015) Zucker, C., Battersby, C., & Goodman, A. 2015, ArXiv:1506.08807
Appendix A Notes on individual GMFs
A.1 GMF 307.2-305.4
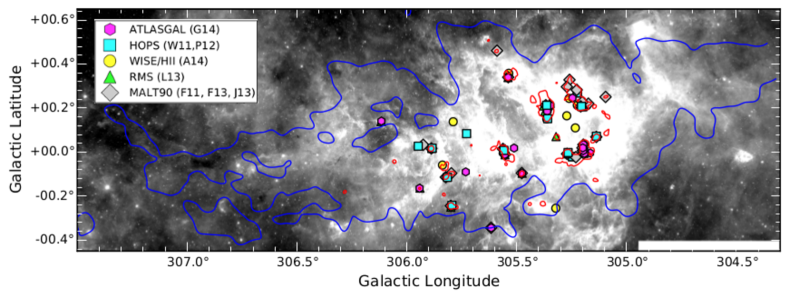
The GMF 307.2-305.4 can be identified as a mixture of emission and extinction features (see Fig. 4). This filament shows the widest velocity range of the sample [-29,-39] km/s. This wide velocity spread can be caused by the location of the filament, close to the tangent point (see also Fig. 2), or by the expanding bubble generated by the massive G305 H II complex (Hindson et al. 2010; Davies et al. 2012), that can be identified as emission in the 8 m image. This H IIregion has a molecular gas mass of (Hindson et al. 2010). We find several dense gas clumps in this complex that have velocities consistent with the GMF. GMF 307.2-305.4 lies within the Scutum-Centaurus spiral arm. This is consistent with previous works that relate G 305 to the Scutum-Centaurus arm (Hindson et al. 2010; Davies et al. 2012).
| GMF 307.2-305.4 | |||||||
| l | 307.3 | 306.6 | 305.8 | 305.7 | 305.5 | 305.2 | 305.1 |
| b | 0.14 | -0.12 | -0.10 | -0.03 | -0.03 | -0.03 | -0.05 |
| v [km/s] | -30 | -29 | -34 | -38 | -37 | -33 | -35 |
| GMF 309.5-308.7 | |||||||
| l | 309.2 | 309.1 | 309.0 | 308.7 | |||
| b | -0.48 | -0.16 | -0.13 | 0.63 | |||
| v [km/s] | -45 | -43 | -44 | -46 | |||
| GMF 319.0-318.7 | |||||||
| l | 319.3 | 318.8 | 318.5 | 318.3 | 318.1 | 317.7 | 317.5 |
| b | -0.08 | -0.17 | -0.23 | -0.38 | -0.07 | 0.07 | |
| v [km/s] | -37 | -38 | -40 | -38 | -43 | -40 | -44 |
| GMF 324.5-321.4 | |||||||
| l | 323.9 | 321.5 | |||||
| b | -0.46 | 0.10 | |||||
| v [km/s] | -32 | -32 | |||||
| GMF 335.6-333.6 | |||||||
| l | 335.2 | 334.6 | 332.9 | 332.3 | |||
| b | -0.26 | -0.21 | -0.50 | -0.48 | |||
| v [km/s] | -41 | -47 | -54 | -55 | |||
| GMF 335.6-333.6b | |||||||
| l | 332.7 | 332.5 | 332.3 | 331.9 | 331.6 | 331.4 | |
| b | -0.23 | -0.13 | -0.12 | -0.11 | -0.24 | -0.33 | |
| v [km/s] | -45 | -47 | -50 | -50 | -46 | -48 | |
| GMF 341.9-337.1 | |||||||
| l | 342.2 | 341.5 | 340.8 | 340.3 | |||
| b | -0.13 | -0.29 | -0.23 | -0.14 | |||
| v [km/s] | -41 | -41 | -46 | -45 | |||
| GMF 343.2-341.7 | |||||||
| l | 342.8 | 342.1 | 341.9 | 341.8 | |||
| b | 0.07 | 0.19 | 0.29 | ||||
| v [km/s] | -42 | -41 | -43 | -43 | |||
| GMF 358.9-357.4 | |||||||
| l | 358.4 | 358.1 | 357.8 | 357.5 | 357.1 | ||
| b | -0.48 | -0.44 | -0.32 | -0.32 | -0.02 | ||
| v [km/s] | 4 | 5 | 7 | 5 | 7 |
A.2 GMF 309.5-308.7
The only GMF aligned perpendicularly to the Galactic plane, it can be seen at 8 m as a vertical extinction feature connecting a series of strong emitting regions, known to be regions of massive star-forming activity: RCW79 (Saito et al. 2001; Russeil 2003; Zavagno et al. 2006) in the north, and Gum 48d (Karr et al. 2009) in the south, the latter connected to the Scutum-Centaurus arm. Previous distance estimates of these H II regions agree with those found in this paper. Some supernova remnants are found within GMF 309.5-308.7 and close to it at lower longitudes, confirming the very active recent massive star-forming activity in the region. Unfortunately, ThruMMS does not fully cover the filament. The southern region has not been observed in either 12CO or 13CO (see red boxes in Fig. 5). The total molecular mass of the GMF is therefore a lower limit.
A.3 GMF 319.0-318.7
We identified the GMF as an extinction feature connecting two star-forming sites. However, a close look to the GMF presents it as two dense filaments, both following extinction features connected by a diffuse envelope (see Fig. 6). This GMF is located within the predicted Scutum-Centaurus arm.
A.4 GMF 324.5-321.4
The most prominent extinction feature is the IRDC 321.71+0.07 (Vasyunina et al. 2009), located at a distance of 2.14kpc. The red box in the bottom-left corner of Fig. 7 shows that there is no ThruMMS coverage of that area. The red box in the middle of the filament shows a region with very high noise. In this region the east and west ends of GMF 324.5-321.4 are barely connected. Although the 12CO map shows a clear connection between both parts of the filament, we proceed with caution, dividing this GMF in two possible filaments: the whole filament from to , and a shorter version from to called GMF 324.5-321.4b. All the dense gas mass of this filament is located in IRDC 321.71+0.07, so that the DGMF of GMF 324.5-321.4b is considerably larger than that of the longer GMF 324.5-321.4. This is the only filament showing no velocity gradient along it. GMF 324.5-321.4 and GMF 324.5-321.4b are not connected to any spiral arm.
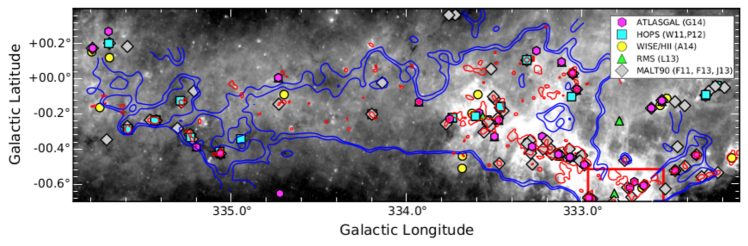
A.5 GMF 335.6-333.6
It harbors one of the best studied H II regions in the southern Galactic hemisphere, G333 or RCW106 (Mookerjea et al. 2004; Roman-Lopes et al. 2009). This H II region is located at 3.6 kpc (in agreement with the distance to our GMF), it has a size of 3090 pc and a mass of (Bains et al. 2006). GMF 335.6-333.6 is seen as an extinction feature connected to RCW106. The RCW106 complex is the main cause of the remarkably high DGMF () measured in GMF 335.6-333.6a. The end at higher galactic longitudes is connected to the S40 bubble. There is a small region of the GMF that is not covered by ThruMMS, as it is shown with the red box in Fig. 8. This GMF lies in the Scutum-Centaurus arm.
A.6 GMF 335.6-333.6b
This filament is very close to GMF 335.6-333.6a and it is recognizable as a prominent extinction feature connecting two star-forming sites. It also has velocity close to that of GMF 335.6-333.6. Although in the first step we included GMF 335.6-333.6b as part of GMF 335.6-333.6, we finally divided them for two reasons: first, because they are not connected in 13CO, and second because their velocities slightly differ. GMF 335.6-333.6b has also been identified as a Milky Way bone (see Sect. 4.1) by Zucker et al. (2015). GMF 335.6-333.6b lies in the Scutum-Centaurus arm.
A.7 GMF 341.9-337.1
GMF 341.9-337.1 has a H II region in its low-longitude end and another one, much more compact, in the middle. An extinction feature connects both star-forming sites and extends towards increasing longitudes. The southern part of the filament is not completely covered by ThruMMS (see the red boxes in Fig. 10). As shown in Fig. 10, almost every ATLASGAL clump in this filament has additional kinematic information confirming the location of the dense gas inside GMF 341.9-337.1.
This filament seem to be part of Nessie extended (Goodman et al. 2014). However, GMF 341.9-337.1 does not lie in the Scutum-Centaurus arm, as Nessie extended does, but rather in an inter-arm region (see Fig. 10). We explore the reasons of this discrepancy below. Figure 10 shows that the emission of the Scutum-Centaurus arm has velocities of about [-35,-25] km/s, while the velocities of GMF 341.9-337.1 are lower, [-48,-43] km/s. This fact raises the question on whether GMF 341.9-337.1 is connected to Nessie extended.
We integrated the 13CO emission over the expected velocity range of Nessie extended to investigate whether it overlaps with GMF 341.9-337.1. In Fig. 10 we show that both filaments overlap each other. However, there are extinction features that are only covered by GMF 341.9-337.1 and we also find that most of the star-forming sites known are connected to GMF 341.9-337.1 rather than to Nessie extended. We conclude that there are overlapping extinction features in this region, better matched by GMF 341.9-337.1. This filament lies in an inter-arm region.
A.8 GMF 343.2-341.7
Two extinction features separated by a H II region in projection. The high longitude end of the GMF is connected to another smaller H II region. The significant 13CO emission of this filament shows two separated objects, although they are connected by significant 12CO emission. We note that there are high noise features in the ThruMMS data exactly in those 13CO empty regions that could hide a significant connection between the two parts of the 13CO filament (red boxes in Fig. 11). The high longitude section of the filament shows no dense gas, nor dense clumps connected to GMF 343.2-341.7. The GMF is not connected to any spiral arm, as it is shown in the bottom panel of Fig. 11.
A.9 GMF 358.9-357.4
It lies in a very crowded region. Every spiral arm at these Galactic latitudes has velocities close to 0 km/s. This makes it difficult to isolate single velocity components. The most prominent extinction feature in GMF 358.9-357.4 is the IRDC known as G357 (Marshall et al. 2009). After isolating its velocity component we found that it lies inside a much larger 13CO complex. The distance estimates in this region are particularly hard to obtain using the Reid et al. (2014) model. We therefore rejected this model for this filament and instead used the distances from the literature: 3.3 kpc (Marshall et al. 2009). This distance estimate places GMF 358.9-357.4 in the Scuttum-Crux arm.
| Filament assoc. | Object/line | Survey | Reference | |||
|---|---|---|---|---|---|---|
| 305.18 | 0.21 | -42.5 | GMF 3054_ 3072 | C18O,13CO,C17O,13C18O | ATLASGAL | 1 |
| 305.73 | -0.09 | -40.8 | GMF 3054_ 3072 | C18O,13CO,C17O,13C18O | ATLASGAL | 1 |
| 305.17 | -0.00 | -34.2 | GMF 3054_ 3072 | C18O,13CO,C17O,13C18O | ATLASGAL | 1 |
| 305.51 | 0.02 | -39.8 | GMF 3054_ 3072 | C18O,13CO,C17O,13C18O | ATLASGAL | 1 |
| 305.36 | 0.20 | -37.5 | GMF 3054_ 3072 | NH3 (1,1) and (2,2) | HOPS | 2 |
| 305.25 | -0.02 | -31.9 | GMF 3054_ 3072 | NH3 (1,1) and (2,2) | HOPS | 2 |
| 305.22 | 0.27 | -39.7 | GMF 3054_ 3072 | NH3 (1,1) and (2,2) | HOPS | 2 |
| 304.55 | 0.34 | -42.9 | GMF 3054_ 3072 | NH3 (1,1) and (2,2) | HOPS | 2 |
| 305.22 | 0.21 | -39.0 | GMF 3054_ 3072 | H IIregions | WISE | 3 |
| 305.23 | 0.11 | -40.0 | GMF 3054_ 3072 | H IIregions | WISE | 3 |
| 305.26 | 0.24 | -39.0 | GMF 3054_ 3072 | H IIregions | WISE | 3 |
| 305.27 | 0.17 | -39.0 | GMF 3054_ 3072 | H IIregions | WISE | 3 |
| 305.32 | -0.26 | -45.0 | GMF 3054_ 3072 | H IIregions | WISE | 3 |
| 305.36 | 0.20 | -38.0 | GMF 3054_ 3072 | H IIregions | WISE | 3 |
| 305.36 | 0.15 | -38.0 | GMF 3054_ 3072 | H IIregions | WISE | 3 |
| 305.54 | 0.36 | -39.0 | GMF 3054_ 3072 | H IIregions | WISE | 3 |
| 305.56 | 0.01 | -45.0 | GMF 3054_ 3072 | H IIregions | WISE | 3 |
| 305.79 | 0.14 | -43.0 | GMF 3054_ 3072 | H IIregions | WISE | 3 |
| 305.84 | -0.06 | -30.0 | GMF 3054_ 3072 | H IIregions | WISE | 3 |
| 307.56 | -0.58 | -40.0 | GMF 3054_ 3072 | H IIregions | WISE | 3 |
| 307.58 | -0.25 | -37.0 | GMF 3054_ 3072 | H IIregions | WISE | 3 |
| 307.62 | -0.26 | -37.0 | GMF 3054_ 3072 | H IIregions | WISE | 3 |
| 304.89 | 0.64 | -36.2 | GMF 3054_ 3072 | YSOs and H IIregions | RMS | 4 |
| 305.19 | -0.01 | -32.5 | GMF 3054_ 3072 | YSOs and H IIregions | RMS | 4 |
| 305.20 | 0.03 | -35.6 | GMF 3054_ 3072 | YSOs and H IIregions | RMS | 4 |
| 305.20 | 0.02 | -37.2 | GMF 3054_ 3072 | YSOs and H IIregions | RMS | 4 |
| 305.20 | 0.21 | -41.0 | GMF 3054_ 3072 | YSOs and H IIregions | RMS | 4 |
| 305.20 | 0.21 | -41.0 | GMF 3054_ 3072 | YSOs and H IIregions | RMS | 4 |
| 305.27 | -0.01 | -31.5 | GMF 3054_ 3072 | YSOs and H IIregions | RMS | 4 |
| 305.32 | 0.07 | -38.8 | GMF 3054_ 3072 | YSOs and H IIregions | RMS | 4 |
| 305.35 | 0.22 | -39.0 | GMF 3054_ 3072 | YSOs and H IIregions | RMS | 4 |
| 305.37 | 0.21 | -34.6 | GMF 3054_ 3072 | YSOs and H IIregions | RMS | 4 |
| 305.37 | 0.18 | -39.6 | GMF 3054_ 3072 | YSOs and H IIregions | RMS | 4 |
| 305.38 | 0.21 | -33.6 | GMF 3054_ 3072 | YSOs and H IIregions | RMS | 4 |
| 305.47 | -0.10 | -37.7 | GMF 3054_ 3072 | YSOs and H IIregions | RMS | 4 |
| 305.54 | 0.34 | -34.8 | GMF 3054_ 3072 | YSOs and H IIregions | RMS | 4 |
| 305.55 | 0.02 | -39.0 | GMF 3054_ 3072 | YSOs and H IIregions | RMS | 4 |
| 305.55 | -0.01 | -37.6 | GMF 3054_ 3072 | YSOs and H IIregions | RMS | 4 |
| 305.56 | 0.01 | -38.8 | GMF 3054_ 3072 | YSOs and H IIregions | RMS | 4 |
| 305.80 | -0.24 | -31.5 | GMF 3054_ 3072 | YSOs and H IIregions | RMS | 4 |
| 305.80 | -0.25 | -31.5 | GMF 3054_ 3072 | YSOs and H IIregions | RMS | 4 |
| 305.89 | 0.02 | -33.9 | GMF 3054_ 3072 | YSOs and H IIregions | RMS | 4 |
| 305.88 | 0.02 | -33.9 | GMF 3054_ 3072 | YSOs and H IIregions | RMS | 4 |
| 305.94 | -0.16 | -35.6 | GMF 3054_ 3072 | YSOs and H IIregions | RMS | 4 |
| 306.12 | 0.14 | -33.6 | GMF 3054_ 3072 | YSOs and H IIregions | RMS | 4 |
| 306.12 | 0.14 | -33.6 | GMF 3054_ 3072 | YSOs and H IIregions | RMS | 4 |
| 307.56 | -0.59 | -33.0 | GMF 3054_ 3072 | YSOs and H IIregions | RMS | 4 |
| 307.61 | -0.25 | -36.6 | GMF 3054_ 3072 | YSOs and H IIregions | RMS | 4 |
| 307.61 | -0.26 | -36.6 | GMF 3054_ 3072 | YSOs and H IIregions | RMS | 4 |
| 307.62 | -0.26 | -37.6 | GMF 3054_ 3072 | YSOs and H IIregions | RMS | 4 |
| 304.02 | 0.29 | -42.4 | GMF 3054_ 3072 | Several lines(a) | MALT90 | 5 |
| 304.09 | 0.42 | -41.7 | GMF 3054_ 3072 | Several lines(a) | MALT90 | 5 |
| 304.55 | 0.33 | -42.6 | GMF 3054_ 3072 | Several lines(a) | MALT90 | 5 |
| 304.67 | 0.26 | -43.9 | GMF 3054_ 3072 | Several lines(a) | MALT90 | 5 |
| 304.71 | 0.60 | -26.7 | GMF 3054_ 3072 | Several lines(a) | MALT90 | 5 |
| 304.79 | -0.87 | -27.1 | GMF 3054_ 3072 | Several lines(a) | MALT90 | 5 |
| 304.79 | 0.58 | -25.1 | GMF 3054_ 3072 | Several lines(a) | MALT90 | 5 |
| 304.87 | 0.61 | -35.4 | GMF 3054_ 3072 | Several lines(a) | MALT90 | 5 |
| 304.89 | 0.63 | -36.6 | GMF 3054_ 3072 | Several lines(a) | MALT90 | 5 |
| 304.90 | 0.58 | -34.5 | GMF 3054_ 3072 | Several lines(a) | MALT90 | 5 |
| 304.92 | 0.52 | -33.1 | GMF 3054_ 3072 | Several lines(a) | MALT90 | 5 |
| 304.93 | 0.55 | -35.4 | GMF 3054_ 3072 | Several lines(a) | MALT90 | 5 |
| 305.10 | 0.25 | -39.0 | GMF 3054_ 3072 | Several lines(a) | MALT90 | 5 |
| 305.14 | 0.07 | -36.7 | GMF 3054_ 3072 | Several lines(a) | MALT90 | 5 |
| 305.17 | 0.22 | -40.9 | GMF 3054_ 3072 | Several lines(a) | MALT90 | 5 |
| 305.19 | -0.01 | -33.8 | GMF 3054_ 3072 | Several lines(a) | MALT90 | 5 |
| 305.20 | 0.03 | -36.3 | GMF 3054_ 3072 | Several lines(a) | MALT90 | 5 |
| 305.20 | 0.01 | -32.7 | GMF 3054_ 3072 | Several lines(a) | MALT90 | 5 |
| 305.20 | 0.02 | -34.9 | GMF 3054_ 3072 | Several lines(a) | MALT90 | 5 |
| 305.20 | 0.23 | -38.7 | GMF 3054_ 3072 | Several lines(a) | MALT90 | 5 |
| 305.21 | 0.21 | -41.1 | GMF 3054_ 3072 | Several lines(a) | MALT90 | 5 |
| 305.23 | 0.28 | -39.6 | GMF 3054_ 3072 | Several lines(a) | MALT90 | 5 |
| 305.23 | -0.02 | -29.1 | GMF 3054_ 3072 | Several lines(a) | MALT90 | 5 |
| 305.26 | 0.33 | -39.0 | GMF 3054_ 3072 | Several lines(a) | MALT90 | 5 |
| 305.27 | -0.01 | -32.3 | GMF 3054_ 3072 | Several lines(a) | MALT90 | 5 |
| 305.27 | 0.30 | -38.2 | GMF 3054_ 3072 | Several lines(a) | MALT90 | 5 |
| 305.36 | 0.20 | -39.1 | GMF 3054_ 3072 | Several lines(a) | MALT90 | 5 |
| 305.37 | 0.21 | -34.4 | GMF 3054_ 3072 | Several lines(a) | MALT90 | 5 |
| 305.48 | -0.10 | -38.5 | GMF 3054_ 3072 | Several lines(a) | MALT90 | 5 |
| 305.54 | 0.34 | -34.5 | GMF 3054_ 3072 | Several lines(a) | MALT90 | 5 |
| 305.55 | -0.01 | -36.8 | GMF 3054_ 3072 | Several lines(a) | MALT90 | 5 |
| 305.56 | 0.01 | -39.3 | GMF 3054_ 3072 | Several lines(a) | MALT90 | 5 |
| 305.59 | 0.46 | -36.0 | GMF 3054_ 3072 | Several lines(a) | MALT90 | 5 |
| 305.62 | -0.34 | -32.5 | GMF 3054_ 3072 | Several lines(a) | MALT90 | 5 |
| 305.80 | -0.10 | -40.8 | GMF 3054_ 3072 | Several lines(a) | MALT90 | 5 |
| 305.80 | -0.24 | -32.6 | GMF 3054_ 3072 | Several lines(a) | MALT90 | 5 |
| 305.82 | -0.11 | -42.0 | GMF 3054_ 3072 | Several lines(a) | MALT90 | 5 |
| 305.89 | 0.02 | -33.9 | GMF 3054_ 3072 | Several lines(a) | MALT90 | 5 |
| 305.93 | 0.03 | -33.2 | GMF 3054_ 3072 | Several lines(a) | MALT90 | 5 |
| 307.54 | -0.58 | -36.3 | GMF 3054_ 3072 | Several lines(a) | MALT90 | 5 |
| 307.56 | -0.59 | -34.0 | GMF 3054_ 3072 | Several lines(a) | MALT90 | 5 |
| 307.61 | -0.26 | -37.0 | GMF 3054_ 3072 | Several lines(a) | MALT90 | 5 |
| 307.63 | -0.32 | -36.3 | GMF 3054_ 3072 | Several lines(a) | MALT90 | 5 |
| 307.76 | 0.35 | -44.5 | GMF 3054_ 3072 | Several lines(a) | MALT90 | 5 |
| 304.00 | 0.28 | -41.4 | GMF 3054_ 3072 | CH3OH masers | ATLASGAL | 6 |
| 304.89 | 0.64 | -36.1 | GMF 3054_ 3072 | CH3OH masers | ATLASGAL | 6 |
| 305.19 | -0.01 | -32.5 | GMF 3054_ 3072 | CH3OH masers | ATLASGAL | 6 |
| 305.20 | 0.03 | -35.6 | GMF 3054_ 3072 | CH3OH masers | ATLASGAL | 6 |
| 305.20 | 0.01 | -35.9 | GMF 3054_ 3072 | CH3OH masers | ATLASGAL | 6 |
| 305.20 | 0.02 | -37.2 | GMF 3054_ 3072 | CH3OH masers | ATLASGAL | 6 |
| 305.21 | 0.21 | -42.6 | GMF 3054_ 3072 | CH3OH masers | ATLASGAL | 6 |
| 305.25 | 0.25 | -36.9 | GMF 3054_ 3072 | CH3OH masers | ATLASGAL | 6 |
| 305.27 | -0.01 | -31.5 | GMF 3054_ 3072 | CH3OH masers | ATLASGAL | 6 |
| 305.35 | 0.21 | -39.0 | GMF 3054_ 3072 | CH3OH masers | ATLASGAL | 6 |
| 305.36 | 0.19 | -38.1 | GMF 3054_ 3072 | CH3OH masers | ATLASGAL | 6 |
| 305.36 | 0.15 | -38.5 | GMF 3054_ 3072 | CH3OH masers | ATLASGAL | 6 |
| 305.37 | 0.21 | -33.8 | GMF 3054_ 3072 | CH3OH masers | ATLASGAL | 6 |
| 305.48 | -0.10 | -37.7 | GMF 3054_ 3072 | CH3OH masers | ATLASGAL | 6 |
| 305.54 | 0.34 | -34.8 | GMF 3054_ 3072 | CH3OH masers | ATLASGAL | 6 |
| 305.55 | -0.01 | -37.6 | GMF 3054_ 3072 | CH3OH masers | ATLASGAL | 6 |
| 305.56 | 0.01 | -38.8 | GMF 3054_ 3072 | CH3OH masers | ATLASGAL | 6 |
| 305.62 | -0.34 | -32.5 | GMF 3054_ 3072 | CH3OH masers | ATLASGAL | 6 |
| 305.80 | -0.24 | -31.5 | GMF 3054_ 3072 | CH3OH masers | ATLASGAL | 6 |
| 305.82 | -0.11 | -41.0 | GMF 3054_ 3072 | CH3OH masers | ATLASGAL | 6 |
| 305.89 | 0.02 | -33.9 | GMF 3054_ 3072 | CH3OH masers | ATLASGAL | 6 |
| 305.94 | -0.16 | -35.5 | GMF 3054_ 3072 | CH3OH masers | ATLASGAL | 6 |
| 306.12 | 0.14 | -33.6 | GMF 3054_ 3072 | CH3OH masers | ATLASGAL | 6 |
| 307.56 | -0.59 | -34.7 | GMF 3054_ 3072 | CH3OH masers | ATLASGAL | 6 |
| 307.62 | -0.26 | -36.5 | GMF 3054_ 3072 | CH3OH masers | ATLASGAL | 6 |
| 305.14 | 0.07 | -38.4 | GMF 3054_ 3072 | H2O masers | HOPS | 8 |
| 305.20 | 0.21 | -39.1 | GMF 3054_ 3072 | H2O masers | HOPS | 8 |
| 305.27 | -0.00 | -37.9 | GMF 3054_ 3072 | H2O masers | HOPS | 8 |
| 305.36 | 0.15 | -35.6 | GMF 3054_ 3072 | H2O masers | HOPS | 8 |
| 305.36 | 0.21 | -33.6 | GMF 3054_ 3072 | H2O masers | HOPS | 8 |
| 305.56 | 0.01 | -37.7 | GMF 3054_ 3072 | H2O masers | HOPS | 8 |
| 305.73 | 0.08 | -43.9 | GMF 3054_ 3072 | H2O masers | HOPS | 8 |
| 305.79 | -0.24 | -27.6 | GMF 3054_ 3072 | H2O masers | HOPS | 8 |
| 305.82 | -0.12 | -27.5 | GMF 3054_ 3072 | H2O masers | HOPS | 8 |
| 305.88 | 0.02 | -28.3 | GMF 3054_ 3072 | H2O masers | HOPS | 8 |
| 305.95 | 0.03 | -41.5 | GMF 3054_ 3072 | H2O masers | HOPS | 8 |
| 307.13 | 0.32 | -42.8 | GMF 3054_ 3072 | H2O masers | HOPS | 8 |
| 307.27 | 0.08 | -31.0 | GMF 3054_ 3072 | H2O masers | HOPS | 8 |
| 307.95 | 0.02 | -45.0 | GMF 3054_ 3072 | H2O masers | HOPS | 8 |
| 309.34 | -0.12 | -51.3 | GMF 3095_ 3087 | C18O,13CO,C17O,13C18O | ATLASGAL | 1 |
| 309.94 | 0.40 | -41.3 | GMF 3095_ 3087 | C18O,13CO,C17O,13C18O | ATLASGAL | 1 |
| 309.38 | -0.13 | -50.6 | GMF 3095_ 3087 | NH3 (1,1) and (2,2) | HOPS | 2 |
| 308.71 | 0.65 | -50.0 | GMF 3095_ 3087 | H IIregions | WISE | 3 |
| 309.07 | 0.17 | -47.0 | GMF 3095_ 3087 | H IIregions | WISE | 3 |
| 309.54 | -0.72 | -43.0 | GMF 3095_ 3087 | H IIregions | WISE | 3 |
| 308.00 | -0.39 | -37.6 | GMF 3095_ 3087 | YSOs and H IIregions | RMS | 4 |
| 308.64 | 0.57 | -44.4 | GMF 3095_ 3087 | YSOs and H IIregions | RMS | 4 |
| 308.65 | 0.65 | -47.9 | GMF 3095_ 3087 | YSOs and H IIregions | RMS | 4 |
| 308.65 | 0.65 | -47.9 | GMF 3095_ 3087 | YSOs and H IIregions | RMS | 4 |
| 308.65 | 0.64 | -47.9 | GMF 3095_ 3087 | YSOs and H IIregions | RMS | 4 |
| 308.69 | 0.52 | -47.7 | GMF 3095_ 3087 | YSOs and H IIregions | RMS | 4 |
| 308.70 | 0.53 | -47.0 | GMF 3095_ 3087 | YSOs and H IIregions | RMS | 4 |
| 308.92 | 0.12 | -49.9 | GMF 3095_ 3087 | YSOs and H IIregions | RMS | 4 |
| 308.92 | 0.12 | -49.9 | GMF 3095_ 3087 | YSOs and H IIregions | RMS | 4 |
| 309.16 | -0.59 | -48.3 | GMF 3095_ 3087 | YSOs and H IIregions | RMS | 4 |
| 309.22 | -0.46 | -41.4 | GMF 3095_ 3087 | YSOs and H IIregions | RMS | 4 |
| 309.42 | -0.62 | -43.3 | GMF 3095_ 3087 | YSOs and H IIregions | RMS | 4 |
| 309.54 | -0.74 | -52.0 | GMF 3095_ 3087 | YSOs and H IIregions | RMS | 4 |
| 309.54 | -0.74 | -52.0 | GMF 3095_ 3087 | YSOs and H IIregions | RMS | 4 |
| 309.53 | -0.74 | -52.0 | GMF 3095_ 3087 | YSOs and H IIregions | RMS | 4 |
| 309.98 | 0.55 | -42.4 | GMF 3095_ 3087 | YSOs and H IIregions | RMS | 4 |
| 308.12 | -0.34 | -47.1 | GMF 3095_ 3087 | Several lines(a) | MALT90 | 5 |
| 308.64 | 0.65 | -47.6 | GMF 3095_ 3087 | Several lines(a) | MALT90 | 5 |
| 308.68 | 0.54 | -44.9 | GMF 3095_ 3087 | Several lines(a) | MALT90 | 5 |
| 308.69 | 0.53 | -46.4 | GMF 3095_ 3087 | Several lines(a) | MALT90 | 5 |
| 308.69 | 0.53 | -46.3 | GMF 3095_ 3087 | Several lines(a) | MALT90 | 5 |
| 308.74 | 0.78 | -46.7 | GMF 3095_ 3087 | Several lines(a) | MALT90 | 5 |
| 308.75 | 0.55 | -47.4 | GMF 3095_ 3087 | Several lines(a) | MALT90 | 5 |
| 308.79 | 0.17 | -51.1 | GMF 3095_ 3087 | Several lines(a) | MALT90 | 5 |
| 308.92 | 0.12 | -50.7 | GMF 3095_ 3087 | Several lines(a) | MALT90 | 5 |
| 309.11 | 0.14 | -42.6 | GMF 3095_ 3087 | Several lines(a) | MALT90 | 5 |
| 309.14 | -0.39 | -41.8 | GMF 3095_ 3087 | Several lines(a) | MALT90 | 5 |
| 309.15 | -0.35 | -40.9 | GMF 3095_ 3087 | Several lines(a) | MALT90 | 5 |
| 309.17 | -0.33 | -42.1 | GMF 3095_ 3087 | Several lines(a) | MALT90 | 5 |
| 309.23 | -0.46 | -41.1 | GMF 3095_ 3087 | Several lines(a) | MALT90 | 5 |
| 309.38 | -0.13 | -50.3 | GMF 3095_ 3087 | Several lines(a) | MALT90 | 5 |
| 309.42 | -0.62 | -42.7 | GMF 3095_ 3087 | Several lines(a) | MALT90 | 5 |
| 309.53 | -0.74 | -52.5 | GMF 3095_ 3087 | Several lines(a) | MALT90 | 5 |
| 309.98 | 0.55 | -41.3 | GMF 3095_ 3087 | Several lines(a) | MALT90 | 5 |
| 309.99 | 0.51 | -41.5 | GMF 3095_ 3087 | Several lines(a) | MALT90 | 5 |
| 308.00 | -0.39 | -37.6 | GMF 3095_ 3087 | CH3OH masers | ATLASGAL | 6 |
| 308.65 | 0.65 | -47.1 | GMF 3095_ 3087 | CH3OH masers | ATLASGAL | 6 |
| 308.69 | 0.53 | -46.7 | GMF 3095_ 3087 | CH3OH masers | ATLASGAL | 6 |
| 308.75 | 0.55 | -47.4 | GMF 3095_ 3087 | CH3OH masers | ATLASGAL | 6 |
| 308.92 | 0.12 | -49.9 | GMF 3095_ 3087 | CH3OH masers | ATLASGAL | 6 |
| 309.22 | -0.46 | -40.5 | GMF 3095_ 3087 | CH3OH masers | ATLASGAL | 6 |
| 309.38 | -0.13 | -49.5 | GMF 3095_ 3087 | CH3OH masers | ATLASGAL | 6 |
| 309.42 | -0.62 | -42.9 | GMF 3095_ 3087 | CH3OH masers | ATLASGAL | 6 |
| 309.53 | -0.74 | -52.0 | GMF 3095_ 3087 | CH3OH masers | ATLASGAL | 6 |
| 309.98 | 0.55 | -41.3 | GMF 3095_ 3087 | CH3OH masers | ATLASGAL | 6 |
| 308.92 | 0.12 | -50.5 | GMF 3095_ 3087 | H2O masers | HOPS | 8 |
| 309.38 | -0.13 | -50.6 | GMF 3095_ 3087 | H2O masers | HOPS | 8 |
| 317.84 | -0.14 | -40.2 | GMF 3190_ 3187 | C18O,13CO,C17O,13C18O | ATLASGAL | 1 |
| 318.72 | -0.10 | -38.1 | GMF 3190_ 3187 | C18O,13CO,C17O,13C18O | ATLASGAL | 1 |
| 318.94 | -0.19 | -34.6 | GMF 3190_ 3187 | NH3 (1,1) and (2,2) | HOPS | 2 |
| 318.78 | -0.13 | -38.2 | GMF 3190_ 3187 | NH3 (1,1) and (2,2) | HOPS | 2 |
| 317.70 | 0.11 | -44.0 | GMF 3190_ 3187 | NH3 (1,1) and (2,2) | HOPS | 2 |
| 317.40 | 0.12 | -41.0 | GMF 3190_ 3187 | NH3 (1,1) and (2,2) | HOPS | 2 |
| 317.03 | 0.03 | -36.0 | GMF 3190_ 3187 | H IIregions | WISE | 3 |
| 317.24 | 0.52 | -51.0 | GMF 3190_ 3187 | H IIregions | WISE | 3 |
| 317.63 | -0.42 | -38.0 | GMF 3190_ 3187 | H IIregions | WISE | 3 |
| 317.99 | -0.75 | -37.0 | GMF 3190_ 3187 | H IIregions | WISE | 3 |
| 317.03 | 0.36 | -50.0 | GMF 3190_ 3187 | YSOs and H IIregions | RMS | 4 |
| 317.03 | 0.36 | -50.0 | GMF 3190_ 3187 | YSOs and H IIregions | RMS | 4 |
| 317.98 | -0.76 | -44.6 | GMF 3190_ 3187 | YSOs and H IIregions | RMS | 4 |
| 318.05 | 0.09 | -49.3 | GMF 3190_ 3187 | YSOs and H IIregions | RMS | 4 |
| 318.05 | 0.09 | -49.3 | GMF 3190_ 3187 | YSOs and H IIregions | RMS | 4 |
| 318.05 | 0.09 | -49.3 | GMF 3190_ 3187 | YSOs and H IIregions | RMS | 4 |
| 317.06 | 0.26 | -40.0 | GMF 3190_ 3187 | Several lines(a) | MALT90 | 5 |
| 317.29 | 0.19 | -40.6 | GMF 3190_ 3187 | Several lines(a) | MALT90 | 5 |
| 317.34 | 0.11 | -43.4 | GMF 3190_ 3187 | Several lines(a) | MALT90 | 5 |
| 317.41 | 0.11 | -40.1 | GMF 3190_ 3187 | Several lines(a) | MALT90 | 5 |
| 317.43 | -0.37 | -39.3 | GMF 3190_ 3187 | Several lines(a) | MALT90 | 5 |
| 317.46 | -0.40 | -43.5 | GMF 3190_ 3187 | Several lines(a) | MALT90 | 5 |
| 317.47 | -0.07 | -35.2 | GMF 3190_ 3187 | Several lines(a) | MALT90 | 5 |
| 317.70 | 0.11 | -42.8 | GMF 3190_ 3187 | Several lines(a) | MALT90 | 5 |
| 317.87 | -0.15 | -40.4 | GMF 3190_ 3187 | Several lines(a) | MALT90 | 5 |
| 317.89 | -0.25 | -36.4 | GMF 3190_ 3187 | Several lines(a) | MALT90 | 5 |
| 317.93 | -0.20 | -36.1 | GMF 3190_ 3187 | Several lines(a) | MALT90 | 5 |
| 318.05 | 0.09 | -50.2 | GMF 3190_ 3187 | Several lines(a) | MALT90 | 5 |
| 318.72 | -0.76 | -35.0 | GMF 3190_ 3187 | Several lines(a) | MALT90 | 5 |
| 318.73 | -0.22 | -49.7 | GMF 3190_ 3187 | Several lines(a) | MALT90 | 5 |
| 318.78 | -0.15 | -37.2 | GMF 3190_ 3187 | Several lines(a) | MALT90 | 5 |
| 318.78 | -0.14 | -37.1 | GMF 3190_ 3187 | Several lines(a) | MALT90 | 5 |
| 318.95 | -0.20 | -34.5 | GMF 3190_ 3187 | Several lines(a) | MALT90 | 5 |
| 317.03 | 0.36 | -49.5 | GMF 3190_ 3187 | CH3OH masers | ATLASGAL | 6 |
| 317.46 | -0.40 | -43.0 | GMF 3190_ 3187 | CH3OH masers | ATLASGAL | 6 |
| 317.70 | 0.11 | -43.4 | GMF 3190_ 3187 | CH3OH masers | ATLASGAL | 6 |
| 318.05 | 0.09 | -49.3 | GMF 3190_ 3187 | CH3OH masers | ATLASGAL | 6 |
| 317.87 | -0.15 | -52.7 | GMF 3190_ 3187 | H2O masers | HOPS | 8 |
| 318.05 | 0.09 | -52.0 | GMF 3190_ 3187 | H2O masers | HOPS | 8 |
| 321.93 | -0.01 | -32.3 | GMF 3245_ 3214 | NH3 (1,1) and (2,2) | HOPS | 2 |
| 321.69 | -0.50 | -34.7 | GMF 3245_ 3214 | NH3 (1,1) and (2,2) | HOPS | 2 |
| 322.40 | 0.20 | -30.0 | GMF 3245_ 3214 | H IIregions | WISE | 3 |
| 323.97 | 0.06 | -30.0 | GMF 3245_ 3214 | H IIregions | WISE | 3 |
| 323.25 | 0.65 | -33.4 | GMF 3245_ 3214 | YSOs and H IIregions | RMS | 4 |
| 321.71 | 0.06 | -32.7 | GMF 3245_ 3214 | Several lines(a) | MALT90 | 5 |
| 321.76 | 0.03 | -32.4 | GMF 3245_ 3214 | Several lines(a) | MALT90 | 5 |
| 321.90 | -0.01 | -31.7 | GMF 3245_ 3214 | Several lines(a) | MALT90 | 5 |
| 321.93 | -0.01 | -32.6 | GMF 3245_ 3214 | Several lines(a) | MALT90 | 5 |
| 333.13 | -0.43 | -53.1 | GMF 3356_ 3336 | C18O,13CO,C17O,13C18O | ATLASGAL | 1 |
| 333.59 | -0.19 | -48.4 | GMF 3356_ 3336 | C18O,13CO,C17O,13C18O | ATLASGAL | 1 |
| 335.70 | 0.27 | -50.1 | GMF 3356_ 3336 | C18O,13CO,C17O,13C18O | ATLASGAL | 1 |
| 333.23 | -0.33 | -52.4 | GMF 3356_ 3336 | C18O,13CO,C17O,13C18O | ATLASGAL | 1 |
| 333.26 | 0.16 | -46.5 | GMF 3356_ 3336 | C18O,13CO,C17O,13C18O | ATLASGAL | 1 |
| 335.59 | -0.29 | -46.1 | GMF 3356_ 3336 | NH3 (1,1) and (2,2) | HOPS | 2 |
| 335.43 | -0.23 | -43.9 | GMF 3356_ 3336 | NH3 (1,1) and (2,2) | HOPS | 2 |
| 335.07 | -0.41 | -39.2 | GMF 3356_ 3336 | NH3 (1,1) and (2,2) | HOPS | 2 |
| 334.20 | -0.20 | -47.4 | GMF 3356_ 3336 | NH3 (1,1) and (2,2) | HOPS | 2 |
| 333.74 | -0.22 | -47.9 | GMF 3356_ 3336 | NH3 (1,1) and (2,2) | HOPS | 2 |
| 333.54 | -0.24 | -48.5 | GMF 3356_ 3336 | NH3 (1,1) and (2,2) | HOPS | 2 |
| 333.46 | -0.16 | -43.2 | GMF 3356_ 3336 | NH3 (1,1) and (2,2) | HOPS | 2 |
| 333.18 | -0.41 | -52.1 | GMF 3356_ 3336 | NH3 (1,1) and (2,2) | HOPS | 2 |
| 332.23 | -0.04 | -48.0 | GMF 3356_ 3336 | NH3 (1,1) and (2,2) | HOPS | 2 |
| 332.14 | -0.45 | -55.0 | GMF 3356_ 3336 | H IIregions | WISE | 3 |
| 332.52 | -0.11 | -50.0 | GMF 3356_ 3336 | H IIregions | WISE | 3 |
| 332.55 | -0.15 | -50.0 | GMF 3356_ 3336 | H IIregions | WISE | 3 |
| 332.66 | -0.62 | -48.0 | GMF 3356_ 3336 | H IIregions | WISE | 3 |
| 332.85 | -1.50 | -41.0 | GMF 3356_ 3336 | H IIregions | WISE | 3 |
| 332.96 | 0.77 | -52.0 | GMF 3356_ 3336 | H IIregions | WISE | 3 |
| 332.98 | 0.77 | -52.0 | GMF 3356_ 3336 | H IIregions | WISE | 3 |
| 333.01 | -0.44 | -53.8 | GMF 3356_ 3336 | H IIregions | WISE | 3 |
| 333.13 | -0.44 | -52.0 | GMF 3356_ 3336 | H IIregions | WISE | 3 |
| 333.29 | -0.40 | -50.0 | GMF 3356_ 3336 | H IIregions | WISE | 3 |
| 333.31 | -0.36 | -50.0 | GMF 3356_ 3336 | H IIregions | WISE | 3 |
| 333.59 | -0.09 | -53.7 | GMF 3356_ 3336 | H IIregions | WISE | 3 |
| 333.63 | -0.20 | -46.0 | GMF 3356_ 3336 | H IIregions | WISE | 3 |
| 333.68 | -0.44 | -50.0 | GMF 3356_ 3336 | H IIregions | WISE | 3 |
| 333.68 | -0.51 | -50.0 | GMF 3356_ 3336 | H IIregions | WISE | 3 |
| 335.69 | 0.12 | -51.0 | GMF 3356_ 3336 | H IIregions | WISE | 3 |
| 335.75 | -0.16 | -52.0 | GMF 3356_ 3336 | H IIregions | WISE | 3 |
| 335.79 | 0.15 | -51.0 | GMF 3356_ 3336 | H IIregions | WISE | 3 |
| 332.29 | -0.10 | -48.4 | GMF 3356_ 3336 | YSOs and H IIregions | RMS | 4 |
| 332.47 | -0.52 | -52.6 | GMF 3356_ 3336 | YSOs and H IIregions | RMS | 4 |
| 332.47 | -0.52 | -52.6 | GMF 3356_ 3336 | YSOs and H IIregions | RMS | 4 |
| 332.54 | -0.13 | -47.5 | GMF 3356_ 3336 | YSOs and H IIregions | RMS | 4 |
| 332.79 | -0.24 | -44.3 | GMF 3356_ 3336 | YSOs and H IIregions | RMS | 4 |
| 332.81 | -0.65 | -47.4 | GMF 3356_ 3336 | YSOs and H IIregions | RMS | 4 |
| 332.96 | -0.68 | -48.5 | GMF 3356_ 3336 | YSOs and H IIregions | RMS | 4 |
| 332.96 | 0.77 | -44.5 | GMF 3356_ 3336 | YSOs and H IIregions | RMS | 4 |
| 332.96 | 0.77 | -44.5 | GMF 3356_ 3336 | YSOs and H IIregions | RMS | 4 |
| 333.01 | 0.77 | -48.3 | GMF 3356_ 3336 | YSOs and H IIregions | RMS | 4 |
| 333.02 | 0.76 | -47.9 | GMF 3356_ 3336 | YSOs and H IIregions | RMS | 4 |
| 333.03 | -0.06 | -40.9 | GMF 3356_ 3336 | YSOs and H IIregions | RMS | 4 |
| 333.05 | 0.03 | -45.3 | GMF 3356_ 3336 | YSOs and H IIregions | RMS | 4 |
| 333.07 | -0.45 | -53.0 | GMF 3356_ 3336 | YSOs and H IIregions | RMS | 4 |
| 333.11 | 0.10 | -44.1 | GMF 3356_ 3336 | YSOs and H IIregions | RMS | 4 |
| 333.13 | -0.44 | -50.4 | GMF 3356_ 3336 | YSOs and H IIregions | RMS | 4 |
| 333.13 | -0.43 | -51.2 | GMF 3356_ 3336 | YSOs and H IIregions | RMS | 4 |
| 333.29 | -0.40 | -51.6 | GMF 3356_ 3336 | YSOs and H IIregions | RMS | 4 |
| 333.29 | -0.39 | -51.6 | GMF 3356_ 3336 | YSOs and H IIregions | RMS | 4 |
| 333.32 | 0.11 | -47.7 | GMF 3356_ 3336 | YSOs and H IIregions | RMS | 4 |
| 333.47 | -0.24 | -50.7 | GMF 3356_ 3336 | YSOs and H IIregions | RMS | 4 |
| 333.50 | -0.33 | -50.2 | GMF 3356_ 3336 | YSOs and H IIregions | RMS | 4 |
| 333.56 | -0.22 | -47.7 | GMF 3356_ 3336 | YSOs and H IIregions | RMS | 4 |
| 333.60 | -0.21 | -49.2 | GMF 3356_ 3336 | YSOs and H IIregions | RMS | 4 |
| 333.76 | -0.23 | -48.9 | GMF 3356_ 3336 | YSOs and H IIregions | RMS | 4 |
| 333.93 | -0.13 | -43.4 | GMF 3356_ 3336 | YSOs and H IIregions | RMS | 4 |
| 334.72 | -0.65 | -44.6 | GMF 3356_ 3336 | YSOs and H IIregions | RMS | 4 |
| 335.06 | -0.43 | -38.4 | GMF 3356_ 3336 | YSOs and H IIregions | RMS | 4 |
| 335.06 | -0.43 | -38.4 | GMF 3356_ 3336 | YSOs and H IIregions | RMS | 4 |
| 335.20 | -0.39 | -37.1 | GMF 3356_ 3336 | YSOs and H IIregions | RMS | 4 |
| 335.95 | 0.03 | -54.8 | GMF 3356_ 3336 | YSOs and H IIregions | RMS | 4 |
| 336.00 | -0.85 | -47.4 | GMF 3356_ 3336 | YSOs and H IIregions | RMS | 4 |
| 332.00 | -0.15 | -50.5 | GMF 3356_ 3336 | Several lines(a) | MALT90 | 5 |
| 332.19 | -0.05 | -48.0 | GMF 3356_ 3336 | Several lines(a) | MALT90 | 5 |
| 332.20 | 0.62 | -38.3 | GMF 3356_ 3336 | Several lines(a) | MALT90 | 5 |
| 332.23 | -0.54 | -52.3 | GMF 3356_ 3336 | Several lines(a) | MALT90 | 5 |
| 332.24 | -0.04 | -48.3 | GMF 3356_ 3336 | Several lines(a) | MALT90 | 5 |
| 332.25 | 0.18 | -49.8 | GMF 3356_ 3336 | Several lines(a) | MALT90 | 5 |
| 332.28 | -0.07 | -48.6 | GMF 3356_ 3336 | Several lines(a) | MALT90 | 5 |
| 332.28 | -0.55 | -53.0 | GMF 3356_ 3336 | Several lines(a) | MALT90 | 5 |
| 332.29 | -0.09 | -49.2 | GMF 3356_ 3336 | Several lines(a) | MALT90 | 5 |
| 332.32 | -0.56 | -53.6 | GMF 3356_ 3336 | Several lines(a) | MALT90 | 5 |
| 332.35 | -0.43 | -48.4 | GMF 3356_ 3336 | Several lines(a) | MALT90 | 5 |
| 332.41 | -0.50 | -54.1 | GMF 3356_ 3336 | Several lines(a) | MALT90 | 5 |
| 332.41 | -0.15 | -50.0 | GMF 3356_ 3336 | Several lines(a) | MALT90 | 5 |
| 332.45 | -0.39 | -41.7 | GMF 3356_ 3336 | Several lines(a) | MALT90 | 5 |
| 332.47 | -0.13 | -50.3 | GMF 3356_ 3336 | Several lines(a) | MALT90 | 5 |
| 332.47 | -0.52 | -51.1 | GMF 3356_ 3336 | Several lines(a) | MALT90 | 5 |
| 332.52 | -0.63 | -50.4 | GMF 3356_ 3336 | Several lines(a) | MALT90 | 5 |
| 332.54 | -0.12 | -47.3 | GMF 3356_ 3336 | Several lines(a) | MALT90 | 5 |
| 332.58 | 0.15 | -45.0 | GMF 3356_ 3336 | Several lines(a) | MALT90 | 5 |
| 332.60 | -0.17 | -46.9 | GMF 3356_ 3336 | Several lines(a) | MALT90 | 5 |
| 332.64 | -0.61 | -49.6 | GMF 3356_ 3336 | Several lines(a) | MALT90 | 5 |
| 332.66 | 0.21 | -47.0 | GMF 3356_ 3336 | Several lines(a) | MALT90 | 5 |
| 332.72 | -0.68 | -47.9 | GMF 3356_ 3336 | Several lines(a) | MALT90 | 5 |
| 332.74 | -0.62 | -50.1 | GMF 3356_ 3336 | Several lines(a) | MALT90 | 5 |
| 332.76 | -0.47 | -52.8 | GMF 3356_ 3336 | Several lines(a) | MALT90 | 5 |
| 332.82 | -0.70 | -53.7 | GMF 3356_ 3336 | Several lines(a) | MALT90 | 5 |
| 332.83 | 0.74 | -47.9 | GMF 3356_ 3336 | Several lines(a) | MALT90 | 5 |
| 332.94 | -0.69 | -48.4 | GMF 3356_ 3336 | Several lines(a) | MALT90 | 5 |
| 332.96 | 0.78 | -45.5 | GMF 3356_ 3336 | Several lines(a) | MALT90 | 5 |
| 332.96 | -0.68 | -49.1 | GMF 3356_ 3336 | Several lines(a) | MALT90 | 5 |
| 332.99 | -0.49 | -53.6 | GMF 3356_ 3336 | Several lines(a) | MALT90 | 5 |
| 333.00 | -0.44 | -54.8 | GMF 3356_ 3336 | Several lines(a) | MALT90 | 5 |
| 333.01 | -0.47 | -54.2 | GMF 3356_ 3336 | Several lines(a) | MALT90 | 5 |
| 333.02 | 0.77 | -48.5 | GMF 3356_ 3336 | Several lines(a) | MALT90 | 5 |
| 333.02 | 0.77 | -49.0 | GMF 3356_ 3336 | Several lines(a) | MALT90 | 5 |
| 333.03 | -0.06 | -41.8 | GMF 3356_ 3336 | Several lines(a) | MALT90 | 5 |
| 333.05 | 0.03 | -44.9 | GMF 3356_ 3336 | Several lines(a) | MALT90 | 5 |
| 333.07 | -0.45 | -53.7 | GMF 3356_ 3336 | Several lines(a) | MALT90 | 5 |
| 333.07 | -0.40 | -53.6 | GMF 3356_ 3336 | Several lines(a) | MALT90 | 5 |
| 333.13 | -0.43 | -52.5 | GMF 3356_ 3336 | Several lines(a) | MALT90 | 5 |
| 333.17 | -0.43 | -51.2 | GMF 3356_ 3336 | Several lines(a) | MALT90 | 5 |
| 333.18 | -0.40 | -50.4 | GMF 3356_ 3336 | Several lines(a) | MALT90 | 5 |
| 333.20 | -0.35 | -49.8 | GMF 3356_ 3336 | Several lines(a) | MALT90 | 5 |
| 333.22 | -0.40 | -52.4 | GMF 3356_ 3336 | Several lines(a) | MALT90 | 5 |
| 333.28 | -0.49 | -54.7 | GMF 3356_ 3336 | Several lines(a) | MALT90 | 5 |
| 333.29 | -0.42 | -50.5 | GMF 3356_ 3336 | Several lines(a) | MALT90 | 5 |
| 333.30 | -0.35 | -50.4 | GMF 3356_ 3336 | Several lines(a) | MALT90 | 5 |
| 333.31 | -0.37 | -50.6 | GMF 3356_ 3336 | Several lines(a) | MALT90 | 5 |
| 333.31 | 0.10 | -46.4 | GMF 3356_ 3336 | Several lines(a) | MALT90 | 5 |
| 333.45 | -0.18 | -45.3 | GMF 3356_ 3336 | Several lines(a) | MALT90 | 5 |
| 333.47 | -0.17 | -44.7 | GMF 3356_ 3336 | Several lines(a) | MALT90 | 5 |
| 333.47 | -0.48 | -54.7 | GMF 3356_ 3336 | Several lines(a) | MALT90 | 5 |
| 333.48 | -0.23 | -49.5 | GMF 3356_ 3336 | Several lines(a) | MALT90 | 5 |
| 333.50 | -0.12 | -49.1 | GMF 3356_ 3336 | Several lines(a) | MALT90 | 5 |
| 333.51 | -0.10 | -47.2 | GMF 3356_ 3336 | Several lines(a) | MALT90 | 5 |
| 333.52 | 0.06 | -40.2 | GMF 3356_ 3336 | Several lines(a) | MALT90 | 5 |
| 333.52 | -0.27 | -49.8 | GMF 3356_ 3336 | Several lines(a) | MALT90 | 5 |
| 333.54 | -0.25 | -48.5 | GMF 3356_ 3336 | Several lines(a) | MALT90 | 5 |
| 333.56 | -0.30 | -48.9 | GMF 3356_ 3336 | Several lines(a) | MALT90 | 5 |
| 333.77 | -0.26 | -49.5 | GMF 3356_ 3336 | Several lines(a) | MALT90 | 5 |
| 334.20 | -0.20 | -47.5 | GMF 3356_ 3336 | Several lines(a) | MALT90 | 5 |
| 335.06 | -0.43 | -39.5 | GMF 3356_ 3336 | Several lines(a) | MALT90 | 5 |
| 335.21 | -0.07 | -44.3 | GMF 3356_ 3336 | Several lines(a) | MALT90 | 5 |
| 335.22 | -0.34 | -39.3 | GMF 3356_ 3336 | Several lines(a) | MALT90 | 5 |
| 335.23 | -0.32 | -40.1 | GMF 3356_ 3336 | Several lines(a) | MALT90 | 5 |
| 335.28 | -0.13 | -45.2 | GMF 3356_ 3336 | Several lines(a) | MALT90 | 5 |
| 335.31 | -0.28 | -40.5 | GMF 3356_ 3336 | Several lines(a) | MALT90 | 5 |
| 335.43 | -0.24 | -44.7 | GMF 3356_ 3336 | Several lines(a) | MALT90 | 5 |
| 335.46 | -0.23 | -43.5 | GMF 3356_ 3336 | Several lines(a) | MALT90 | 5 |
| 335.59 | 0.18 | -49.6 | GMF 3356_ 3336 | Several lines(a) | MALT90 | 5 |
| 335.59 | -0.27 | -47.2 | GMF 3356_ 3336 | Several lines(a) | MALT90 | 5 |
| 335.69 | 0.20 | -49.8 | GMF 3356_ 3336 | Several lines(a) | MALT90 | 5 |
| 335.71 | -0.35 | -39.5 | GMF 3356_ 3336 | Several lines(a) | MALT90 | 5 |
| 335.79 | 0.17 | -50.3 | GMF 3356_ 3336 | Several lines(a) | MALT90 | 5 |
| 332.30 | -0.09 | -48.2 | GMF 3356_ 3336 | CH3OH masers | ATLASGAL | 6 |
| 332.35 | -0.44 | -47.6 | GMF 3356_ 3336 | CH3OH masers | ATLASGAL | 6 |
| 332.36 | 0.60 | -42.6 | GMF 3356_ 3336 | CH3OH masers | ATLASGAL | 6 |
| 332.47 | -0.52 | -51.9 | GMF 3356_ 3336 | CH3OH masers | ATLASGAL | 6 |
| 332.54 | -0.12 | -46.7 | GMF 3356_ 3336 | CH3OH masers | ATLASGAL | 6 |
| 332.60 | -0.17 | -46.2 | GMF 3356_ 3336 | CH3OH masers | ATLASGAL | 6 |
| 332.65 | -0.61 | -49.2 | GMF 3356_ 3336 | CH3OH masers | ATLASGAL | 6 |
| 332.70 | -0.59 | -48.4 | GMF 3356_ 3336 | CH3OH masers | ATLASGAL | 6 |
| 332.73 | -0.62 | -49.7 | GMF 3356_ 3336 | CH3OH masers | ATLASGAL | 6 |
| 332.94 | -0.69 | -48.6 | GMF 3356_ 3336 | CH3OH masers | ATLASGAL | 6 |
| 332.96 | 0.78 | -44.5 | GMF 3356_ 3336 | CH3OH masers | ATLASGAL | 6 |
| 332.96 | -0.68 | -48.5 | GMF 3356_ 3336 | CH3OH masers | ATLASGAL | 6 |
| 332.98 | 0.77 | -46.1 | GMF 3356_ 3336 | CH3OH masers | ATLASGAL | 6 |
| 332.99 | -0.49 | -53.2 | GMF 3356_ 3336 | CH3OH masers | ATLASGAL | 6 |
| 333.02 | 0.77 | -47.8 | GMF 3356_ 3336 | CH3OH masers | ATLASGAL | 6 |
| 333.03 | -0.06 | -40.9 | GMF 3356_ 3336 | CH3OH masers | ATLASGAL | 6 |
| 333.05 | 0.03 | -45.2 | GMF 3356_ 3336 | CH3OH masers | ATLASGAL | 6 |
| 333.07 | -0.45 | -53.0 | GMF 3356_ 3336 | CH3OH masers | ATLASGAL | 6 |
| 333.12 | 0.10 | -44.5 | GMF 3356_ 3336 | CH3OH masers | ATLASGAL | 6 |
| 333.13 | -0.43 | -51.9 | GMF 3356_ 3336 | CH3OH masers | ATLASGAL | 6 |
| 333.28 | -0.39 | -51.6 | GMF 3356_ 3336 | CH3OH masers | ATLASGAL | 6 |
| 333.31 | 0.11 | -47.0 | GMF 3356_ 3336 | CH3OH masers | ATLASGAL | 6 |
| 333.47 | -0.16 | -42.5 | GMF 3356_ 3336 | CH3OH masers | ATLASGAL | 6 |
| 333.47 | -0.24 | -50.1 | GMF 3356_ 3336 | CH3OH masers | ATLASGAL | 6 |
| 333.50 | -0.33 | -50.2 | GMF 3356_ 3336 | CH3OH masers | ATLASGAL | 6 |
| 333.60 | -0.21 | -47.1 | GMF 3356_ 3336 | CH3OH masers | ATLASGAL | 6 |
| 333.75 | -0.23 | -49.0 | GMF 3356_ 3336 | CH3OH masers | ATLASGAL | 6 |
| 333.93 | -0.13 | -41.1 | GMF 3356_ 3336 | CH3OH masers | ATLASGAL | 6 |
| 334.72 | -0.65 | -44.6 | GMF 3356_ 3336 | CH3OH masers | ATLASGAL | 6 |
| 335.06 | -0.43 | -38.4 | GMF 3356_ 3336 | CH3OH masers | ATLASGAL | 6 |
| 335.20 | -0.39 | -37.2 | GMF 3356_ 3336 | CH3OH masers | ATLASGAL | 6 |
| 335.43 | -0.24 | -43.5 | GMF 3356_ 3336 | CH3OH masers | ATLASGAL | 6 |
| 335.59 | -0.29 | -46.6 | GMF 3356_ 3336 | CH3OH masers | ATLASGAL | 6 |
| 335.79 | 0.17 | -49.5 | GMF 3356_ 3336 | CH3OH masers | ATLASGAL | 6 |
| 332.29 | -0.09 | -47.5 | GMF 3356_ 3336 | H2O masers | HOPS | 8 |
| 332.33 | 0.18 | -47.6 | GMF 3356_ 3336 | H2O masers | HOPS | 8 |
| 333.06 | -0.10 | -37.5 | GMF 3356_ 3336 | H2O masers | HOPS | 8 |
| 333.31 | 0.11 | -45.3 | GMF 3356_ 3336 | H2O masers | HOPS | 8 |
| 333.46 | -0.16 | -42.8 | GMF 3356_ 3336 | H2O masers | HOPS | 8 |
| 333.61 | -0.21 | -51.5 | GMF 3356_ 3336 | H2O masers | HOPS | 8 |
| 334.94 | -0.34 | -35.7 | GMF 3356_ 3336 | H2O masers | HOPS | 8 |
| 335.23 | -0.33 | -52.3 | GMF 3356_ 3336 | H2O masers | HOPS | 8 |
| 335.29 | -0.13 | -49.2 | GMF 3356_ 3336 | H2O masers | HOPS | 8 |
| 335.43 | -0.24 | -40.8 | GMF 3356_ 3336 | H2O masers | HOPS | 8 |
| 335.59 | -0.29 | -45.4 | GMF 3356_ 3336 | H2O masers | HOPS | 8 |
| 335.70 | 0.20 | -45.3 | GMF 3356_ 3336 | H2O masers | HOPS | 8 |
| 332.23 | -0.04 | -48.0 | GMF 3356_ 3336b | NH3 (1,1) and (2,2) | HOPS | 2 |
| 332.14 | -0.45 | -55.0 | GMF 3356_ 3336b | H IIregions | WISE | 3 |
| 332.52 | -0.11 | -50.0 | GMF 3356_ 3336b | H IIregions | WISE | 3 |
| 332.55 | -0.15 | -50.0 | GMF 3356_ 3336b | H IIregions | WISE | 3 |
| 332.66 | -0.62 | -48.0 | GMF 3356_ 3336b | H IIregions | WISE | 3 |
| 332.96 | 0.77 | -52.0 | GMF 3356_ 3336b | H IIregions | WISE | 3 |
| 332.98 | 0.77 | -52.0 | GMF 3356_ 3336b | H IIregions | WISE | 3 |
| 332.29 | -0.10 | -48.4 | GMF 3356_ 3336b | YSOs and H IIregions | RMS | 4 |
| 332.47 | -0.52 | -52.6 | GMF 3356_ 3336b | YSOs and H IIregions | RMS | 4 |
| 332.47 | -0.52 | -52.6 | GMF 3356_ 3336b | YSOs and H IIregions | RMS | 4 |
| 332.54 | -0.13 | -47.5 | GMF 3356_ 3336b | YSOs and H IIregions | RMS | 4 |
| 332.81 | -0.65 | -47.4 | GMF 3356_ 3336b | YSOs and H IIregions | RMS | 4 |
| 332.96 | -0.68 | -48.5 | GMF 3356_ 3336b | YSOs and H IIregions | RMS | 4 |
| 331.57 | -0.23 | -50.1 | GMF 3356_ 3336b | Several lines(a) | MALT90 | 5 |
| 331.62 | 0.53 | -51.6 | GMF 3356_ 3336b | Several lines(a) | MALT90 | 5 |
| 331.64 | 0.50 | -52.1 | GMF 3356_ 3336b | Several lines(a) | MALT90 | 5 |
| 332.00 | -0.15 | -50.5 | GMF 3356_ 3336b | Several lines(a) | MALT90 | 5 |
| 332.19 | -0.05 | -48.0 | GMF 3356_ 3336b | Several lines(a) | MALT90 | 5 |
| 332.23 | -0.54 | -52.3 | GMF 3356_ 3336b | Several lines(a) | MALT90 | 5 |
| 332.24 | -0.04 | -48.3 | GMF 3356_ 3336b | Several lines(a) | MALT90 | 5 |
| 332.25 | 0.18 | -49.8 | GMF 3356_ 3336b | Several lines(a) | MALT90 | 5 |
| 332.28 | -0.07 | -48.6 | GMF 3356_ 3336b | Several lines(a) | MALT90 | 5 |
| 332.28 | -0.55 | -53.0 | GMF 3356_ 3336b | Several lines(a) | MALT90 | 5 |
| 332.29 | -0.09 | -49.2 | GMF 3356_ 3336b | Several lines(a) | MALT90 | 5 |
| 332.32 | -0.56 | -53.6 | GMF 3356_ 3336b | Several lines(a) | MALT90 | 5 |
| 332.35 | -0.43 | -48.4 | GMF 3356_ 3336b | Several lines(a) | MALT90 | 5 |
| 332.41 | -0.50 | -54.1 | GMF 3356_ 3336b | Several lines(a) | MALT90 | 5 |
| 332.41 | -0.15 | -50.0 | GMF 3356_ 3336b | Several lines(a) | MALT90 | 5 |
| 332.47 | -0.13 | -50.3 | GMF 3356_ 3336b | Several lines(a) | MALT90 | 5 |
| 332.47 | -0.52 | -51.1 | GMF 3356_ 3336b | Several lines(a) | MALT90 | 5 |
| 332.52 | -0.63 | -50.4 | GMF 3356_ 3336b | Several lines(a) | MALT90 | 5 |
| 332.54 | -0.12 | -47.3 | GMF 3356_ 3336b | Several lines(a) | MALT90 | 5 |
| 332.58 | 0.15 | -45.0 | GMF 3356_ 3336b | Several lines(a) | MALT90 | 5 |
| 332.60 | -0.17 | -46.9 | GMF 3356_ 3336b | Several lines(a) | MALT90 | 5 |
| 332.64 | -0.61 | -49.6 | GMF 3356_ 3336b | Several lines(a) | MALT90 | 5 |
| 332.66 | 0.21 | -47.0 | GMF 3356_ 3336b | Several lines(a) | MALT90 | 5 |
| 332.72 | -0.68 | -47.9 | GMF 3356_ 3336b | Several lines(a) | MALT90 | 5 |
| 332.74 | -0.62 | -50.1 | GMF 3356_ 3336b | Several lines(a) | MALT90 | 5 |
| 332.76 | -0.47 | -52.8 | GMF 3356_ 3336b | Several lines(a) | MALT90 | 5 |
| 332.82 | -0.70 | -53.7 | GMF 3356_ 3336b | Several lines(a) | MALT90 | 5 |
| 332.83 | 0.74 | -47.9 | GMF 3356_ 3336b | Several lines(a) | MALT90 | 5 |
| 332.94 | -0.69 | -48.4 | GMF 3356_ 3336b | Several lines(a) | MALT90 | 5 |
| 332.96 | 0.78 | -45.5 | GMF 3356_ 3336b | Several lines(a) | MALT90 | 5 |
| 332.96 | -0.68 | -49.1 | GMF 3356_ 3336b | Several lines(a) | MALT90 | 5 |
| 332.99 | -0.49 | -53.6 | GMF 3356_ 3336b | Several lines(a) | MALT90 | 5 |
| 333.00 | -0.44 | -54.8 | GMF 3356_ 3336b | Several lines(a) | MALT90 | 5 |
| 332.30 | -0.09 | -48.2 | GMF 3356_ 3336b | CH3OH masers | ATLASGAL | 6 |
| 332.35 | -0.44 | -47.6 | GMF 3356_ 3336b | CH3OH masers | ATLASGAL | 6 |
| 332.47 | -0.52 | -51.9 | GMF 3356_ 3336b | CH3OH masers | ATLASGAL | 6 |
| 332.54 | -0.12 | -46.7 | GMF 3356_ 3336b | CH3OH masers | ATLASGAL | 6 |
| 332.60 | -0.17 | -46.2 | GMF 3356_ 3336b | CH3OH masers | ATLASGAL | 6 |
| 332.65 | -0.61 | -49.2 | GMF 3356_ 3336b | CH3OH masers | ATLASGAL | 6 |
| 332.70 | -0.59 | -48.4 | GMF 3356_ 3336b | CH3OH masers | ATLASGAL | 6 |
| 332.73 | -0.62 | -49.7 | GMF 3356_ 3336b | CH3OH masers | ATLASGAL | 6 |
| 332.94 | -0.69 | -48.6 | GMF 3356_ 3336b | CH3OH masers | ATLASGAL | 6 |
| 332.96 | -0.68 | -48.5 | GMF 3356_ 3336b | CH3OH masers | ATLASGAL | 6 |
| 332.98 | 0.77 | -46.1 | GMF 3356_ 3336b | CH3OH masers | ATLASGAL | 6 |
| 332.99 | -0.49 | -53.2 | GMF 3356_ 3336b | CH3OH masers | ATLASGAL | 6 |
| 332.29 | -0.09 | -47.5 | GMF 3356_ 3336b | H2O masers | HOPS | 8 |
| 332.33 | 0.18 | -47.6 | GMF 3356_ 3336b | H2O masers | HOPS | 8 |
| 340.37 | -0.39 | -43.5 | GMF 3419_ 3371 | C18O,13CO,C17O,13C18O | ATLASGAL | 1 |
| 342.48 | 0.19 | -41.5 | GMF 3419_ 3371 | C18O,13CO,C17O,13C18O | ATLASGAL | 1 |
| 341.18 | -0.17 | -43.5 | GMF 3419_ 3371 | C18O,13CO,C17O,13C18O | ATLASGAL | 1 |
| 342.71 | 0.13 | -41.8 | GMF 3419_ 3371 | NH3 (1,1) and (2,2) | HOPS | 2 |
| 341.94 | -0.17 | -42.4 | GMF 3419_ 3371 | NH3 (1,1) and (2,2) | HOPS | 2 |
| 341.23 | -0.26 | -44.3 | GMF 3419_ 3371 | NH3 (1,1) and (2,2) | HOPS | 2 |
| 340.88 | -0.38 | -44.2 | GMF 3419_ 3371 | NH3 (1,1) and (2,2) | HOPS | 2 |
| 340.39 | -0.38 | -45.8 | GMF 3419_ 3371 | NH3 (1,1) and (2,2) | HOPS | 2 |
| 340.27 | -0.22 | -46.7 | GMF 3419_ 3371 | NH3 (1,1) and (2,2) | HOPS | 2 |
| 340.29 | -0.19 | -43.0 | GMF 3419_ 3371 | H IIregions | WISE | 3 |
| 341.09 | -0.02 | -38.0 | GMF 3419_ 3371 | H IIregions | WISE | 3 |
| 341.28 | -0.35 | -38.0 | GMF 3419_ 3371 | H IIregions | WISE | 3 |
| 341.31 | -0.31 | -38.0 | GMF 3419_ 3371 | H IIregions | WISE | 3 |
| 340.43 | -0.37 | -46.8 | GMF 3419_ 3371 | YSOs and H IIregions | RMS | 4 |
| 340.88 | -0.37 | -43.5 | GMF 3419_ 3371 | YSOs and H IIregions | RMS | 4 |
| 340.88 | -0.38 | -43.5 | GMF 3419_ 3371 | YSOs and H IIregions | RMS | 4 |
| 341.13 | -0.35 | -41.3 | GMF 3419_ 3371 | YSOs and H IIregions | RMS | 4 |
| 341.13 | -0.35 | -41.3 | GMF 3419_ 3371 | YSOs and H IIregions | RMS | 4 |
| 341.21 | -0.23 | -43.4 | GMF 3419_ 3371 | YSOs and H IIregions | RMS | 4 |
| 341.22 | -0.21 | -43.2 | GMF 3419_ 3371 | YSOs and H IIregions | RMS | 4 |
| 342.06 | 0.42 | -40.5 | GMF 3419_ 3371 | YSOs and H IIregions | RMS | 4 |
| 342.71 | 0.13 | -40.8 | GMF 3419_ 3371 | YSOs and H IIregions | RMS | 4 |
| 342.71 | 0.13 | -40.8 | GMF 3419_ 3371 | YSOs and H IIregions | RMS | 4 |
| 342.71 | 0.13 | -40.8 | GMF 3419_ 3371 | YSOs and H IIregions | RMS | 4 |
| 342.71 | 0.13 | -40.8 | GMF 3419_ 3371 | YSOs and H IIregions | RMS | 4 |
| 342.96 | -0.32 | -39.7 | GMF 3419_ 3371 | YSOs and H IIregions | RMS | 4 |
| 340.27 | -0.21 | -46.3 | GMF 3419_ 3371 | Several lines(a) | MALT90 | 5 |
| 340.37 | -0.39 | -43.9 | GMF 3419_ 3371 | Several lines(a) | MALT90 | 5 |
| 340.40 | -0.40 | -46.1 | GMF 3419_ 3371 | Several lines(a) | MALT90 | 5 |
| 340.40 | -0.38 | -45.7 | GMF 3419_ 3371 | Several lines(a) | MALT90 | 5 |
| 340.43 | -0.37 | -46.4 | GMF 3419_ 3371 | Several lines(a) | MALT90 | 5 |
| 340.46 | -0.64 | -40.9 | GMF 3419_ 3371 | Several lines(a) | MALT90 | 5 |
| 340.76 | -0.13 | -39.9 | GMF 3419_ 3371 | Several lines(a) | MALT90 | 5 |
| 340.78 | -0.12 | -39.8 | GMF 3419_ 3371 | Several lines(a) | MALT90 | 5 |
| 340.88 | -0.37 | -44.5 | GMF 3419_ 3371 | Several lines(a) | MALT90 | 5 |
| 340.94 | -0.27 | -46.4 | GMF 3419_ 3371 | Several lines(a) | MALT90 | 5 |
| 340.95 | -0.36 | -45.9 | GMF 3419_ 3371 | Several lines(a) | MALT90 | 5 |
| 341.03 | -0.11 | -43.4 | GMF 3419_ 3371 | Several lines(a) | MALT90 | 5 |
| 341.04 | -0.11 | -43.3 | GMF 3419_ 3371 | Several lines(a) | MALT90 | 5 |
| 341.13 | -0.35 | -41.2 | GMF 3419_ 3371 | Several lines(a) | MALT90 | 5 |
| 341.20 | -0.22 | -43.9 | GMF 3419_ 3371 | Several lines(a) | MALT90 | 5 |
| 341.21 | -0.24 | -43.9 | GMF 3419_ 3371 | Several lines(a) | MALT90 | 5 |
| 341.22 | -0.21 | -43.7 | GMF 3419_ 3371 | Several lines(a) | MALT90 | 5 |
| 341.22 | -0.26 | -44.9 | GMF 3419_ 3371 | Several lines(a) | MALT90 | 5 |
| 341.27 | -0.30 | -43.6 | GMF 3419_ 3371 | Several lines(a) | MALT90 | 5 |
| 341.28 | -0.29 | -45.5 | GMF 3419_ 3371 | Several lines(a) | MALT90 | 5 |
| 341.81 | 0.34 | -42.0 | GMF 3419_ 3371 | Several lines(a) | MALT90 | 5 |
| 341.94 | -0.17 | -42.3 | GMF 3419_ 3371 | Several lines(a) | MALT90 | 5 |
| 342.48 | 0.18 | -41.8 | GMF 3419_ 3371 | Several lines(a) | MALT90 | 5 |
| 342.71 | 0.12 | -40.5 | GMF 3419_ 3371 | Several lines(a) | MALT90 | 5 |
| 342.96 | -0.32 | -39.6 | GMF 3419_ 3371 | Several lines(a) | MALT90 | 5 |
| 340.88 | -0.38 | -43.5 | GMF 3419_ 3371 | CH3OH masers | ATLASGAL | 6 |
| 341.13 | -0.35 | -40.6 | GMF 3419_ 3371 | CH3OH masers | ATLASGAL | 6 |
| 341.22 | -0.24 | -43.4 | GMF 3419_ 3371 | CH3OH masers | ATLASGAL | 6 |
| 341.22 | -0.21 | -43.2 | GMF 3419_ 3371 | CH3OH masers | ATLASGAL | 6 |
| 341.24 | -0.27 | -43.5 | GMF 3419_ 3371 | CH3OH masers | ATLASGAL | 6 |
| 342.06 | 0.42 | -40.5 | GMF 3419_ 3371 | CH3OH masers | ATLASGAL | 6 |
| 342.48 | 0.18 | -41.3 | GMF 3419_ 3371 | CH3OH masers | ATLASGAL | 6 |
| 342.71 | 0.13 | -40.8 | GMF 3419_ 3371 | CH3OH masers | ATLASGAL | 6 |
| 342.96 | -0.32 | -39.4 | GMF 3419_ 3371 | CH3OH masers | ATLASGAL | 6 |
| 341.12 | -0.38 | -40.7 | GMF 3419_ 3371 | H2O masers | HOPS | 8 |
| 341.22 | -0.21 | -40.9 | GMF 3419_ 3371 | H2O masers | HOPS | 8 |
| 341.99 | 0.26 | -38.1 | GMF 3419_ 3371 | H2O masers | HOPS | 8 |
| 342.48 | 0.19 | -41.5 | GMF 3432_ 3417 | C18O,13CO,C17O,13C18O | ATLASGAL | 1 |
| 341.18 | -0.17 | -43.5 | GMF 3432_ 3417 | C18O,13CO,C17O,13C18O | ATLASGAL | 1 |
| 342.71 | 0.13 | -41.8 | GMF 3432_ 3417 | NH3 (1,1) and (2,2) | HOPS | 2 |
| 341.94 | -0.17 | -42.4 | GMF 3432_ 3417 | NH3 (1,1) and (2,2) | HOPS | 2 |
| 341.23 | -0.26 | -44.3 | GMF 3432_ 3417 | NH3 (1,1) and (2,2) | HOPS | 2 |
| 341.09 | -0.02 | -38.0 | GMF 3432_ 3417 | H IIregions | WISE | 3 |
| 341.28 | -0.35 | -38.0 | GMF 3432_ 3417 | H IIregions | WISE | 3 |
| 341.31 | -0.31 | -38.0 | GMF 3432_ 3417 | H IIregions | WISE | 3 |
| 341.13 | -0.35 | -41.3 | GMF 3432_ 3417 | YSOs and H IIregions | RMS | 4 |
| 341.13 | -0.35 | -41.3 | GMF 3432_ 3417 | YSOs and H IIregions | RMS | 4 |
| 341.21 | -0.23 | -43.4 | GMF 3432_ 3417 | YSOs and H IIregions | RMS | 4 |
| 341.22 | -0.21 | -43.2 | GMF 3432_ 3417 | YSOs and H IIregions | RMS | 4 |
| 342.06 | 0.42 | -40.5 | GMF 3432_ 3417 | YSOs and H IIregions | RMS | 4 |
| 342.71 | 0.13 | -40.8 | GMF 3432_ 3417 | YSOs and H IIregions | RMS | 4 |
| 342.71 | 0.13 | -40.8 | GMF 3432_ 3417 | YSOs and H IIregions | RMS | 4 |
| 342.71 | 0.13 | -40.8 | GMF 3432_ 3417 | YSOs and H IIregions | RMS | 4 |
| 342.71 | 0.13 | -40.8 | GMF 3432_ 3417 | YSOs and H IIregions | RMS | 4 |
| 342.96 | -0.32 | -39.7 | GMF 3432_ 3417 | YSOs and H IIregions | RMS | 4 |
| 341.03 | -0.11 | -43.4 | GMF 3432_ 3417 | Several lines(a) | MALT90 | 5 |
| 341.04 | -0.11 | -43.3 | GMF 3432_ 3417 | Several lines(a) | MALT90 | 5 |
| 341.13 | -0.35 | -41.2 | GMF 3432_ 3417 | Several lines(a) | MALT90 | 5 |
| 341.20 | -0.22 | -43.9 | GMF 3432_ 3417 | Several lines(a) | MALT90 | 5 |
| 341.21 | -0.24 | -43.9 | GMF 3432_ 3417 | Several lines(a) | MALT90 | 5 |
| 341.22 | -0.21 | -43.7 | GMF 3432_ 3417 | Several lines(a) | MALT90 | 5 |
| 341.22 | -0.26 | -44.9 | GMF 3432_ 3417 | Several lines(a) | MALT90 | 5 |
| 341.27 | -0.30 | -43.6 | GMF 3432_ 3417 | Several lines(a) | MALT90 | 5 |
| 341.28 | -0.29 | -45.5 | GMF 3432_ 3417 | Several lines(a) | MALT90 | 5 |
| 341.81 | 0.34 | -42.0 | GMF 3432_ 3417 | Several lines(a) | MALT90 | 5 |
| 341.94 | -0.17 | -42.3 | GMF 3432_ 3417 | Several lines(a) | MALT90 | 5 |
| 342.48 | 0.18 | -41.8 | GMF 3432_ 3417 | Several lines(a) | MALT90 | 5 |
| 342.71 | 0.12 | -40.5 | GMF 3432_ 3417 | Several lines(a) | MALT90 | 5 |
| 342.96 | -0.32 | -39.6 | GMF 3432_ 3417 | Several lines(a) | MALT90 | 5 |
| 341.13 | -0.35 | -40.6 | GMF 3432_ 3417 | CH3OH masers | ATLASGAL | 6 |
| 341.22 | -0.24 | -43.4 | GMF 3432_ 3417 | CH3OH masers | ATLASGAL | 6 |
| 341.22 | -0.21 | -43.2 | GMF 3432_ 3417 | CH3OH masers | ATLASGAL | 6 |
| 341.24 | -0.27 | -43.5 | GMF 3432_ 3417 | CH3OH masers | ATLASGAL | 6 |
| 342.06 | 0.42 | -40.5 | GMF 3432_ 3417 | CH3OH masers | ATLASGAL | 6 |
| 342.48 | 0.18 | -41.3 | GMF 3432_ 3417 | CH3OH masers | ATLASGAL | 6 |
| 342.71 | 0.13 | -40.8 | GMF 3432_ 3417 | CH3OH masers | ATLASGAL | 6 |
| 342.96 | -0.32 | -39.4 | GMF 3432_ 3417 | CH3OH masers | ATLASGAL | 6 |
| 341.12 | -0.38 | -40.7 | GMF 3432_ 3417 | H2O masers | HOPS | 8 |
| 341.22 | -0.21 | -40.9 | GMF 3432_ 3417 | H2O masers | HOPS | 8 |
| 341.99 | 0.26 | -38.1 | GMF 3432_ 3417 | H2O masers | HOPS | 8 |
| 357.54 | -0.33 | 3.7 | GMF 3589_ 3574 | NH3 (1,1) and (2,2) | HOPS | 2 |
| 356.23 | 0.05 | 9.3 | GMF 3589_ 3574 | H IIregions | WISE | 3 |
| 356.46 | 0.01 | 4.6 | GMF 3589_ 3574 | H IIregions | WISE | 3 |
| 356.47 | -0.01 | 4.6 | GMF 3589_ 3574 | H IIregions | WISE | 3 |
| 356.47 | 0.00 | 4.6 | GMF 3589_ 3574 | H IIregions | WISE | 3 |
| 356.56 | -0.09 | 4.9 | GMF 3589_ 3574 | H IIregions | WISE | 3 |
| 358.40 | -0.86 | 5.3 | GMF 3589_ 3574 | H IIregions | WISE | 3 |
| 356.17 | -0.53 | 4.6 | GMF 3589_ 3574 | Several lines(a) | MALT90 | 5 |
| 357.49 | -0.33 | 4.3 | GMF 3589_ 3574 | Several lines(a) | MALT90 | 5 |
| 357.71 | -0.29 | 5.1 | GMF 3589_ 3574 | Several lines(a) | MALT90 | 5 |
| 356.66 | -0.26 | 6.6 | GMF 3589_ 3574 | CH3OH massive star-forming clumps | ATLASGAL | 7 |
| 357.92 | -0.34 | 3.2 | GMF 3589_ 3574 | CH3OH massive star-forming clumps | ATLASGAL | 7 |
| 357.92 | -0.34 | 1.8 | GMF 3589_ 3574 | CH3OH massive star-forming clumps | ATLASGAL | 7 |
| 356.47 | 0.01 | 1.3 | GMF 3589_ 3574 | H2O masers | HOPS | 8 |
| 356.65 | -0.32 | 4.6 | GMF 3589_ 3574 | H2O masers | HOPS | 8 |
| 357.93 | -0.34 | 1.4 | GMF 3589_ 3574 | H2O masers | HOPS | 8 |
| 358.48 | -0.33 | 0.3 | GMF 3589_ 3574 | H2O masers | HOPS | 8 |