DESY 16-050 ISSN 0418-9833
March 2016
Search for QCD Instanton-Induced Processes at HERA
in the High- Domain
H1 Collaboration
Signals of QCD instanton-induced processes are searched for in neutral current deep-inelastic scattering at the electron-proton collider HERA in the kinematic region defined by the Bjorken-scaling variable , the inelasticity and the photon virtuality GeV2. The search is performed using H1 data corresponding to an integrated luminosity of pb-1. No evidence for the production of QCD instanton-induced events is observed. Upper limits on the cross section for instanton-induced processes between pb and pb, at confidence level, are obtained depending on the kinematic domain in which instantons could be produced. Compared to earlier publications, the limits are improved by an order of magnitude and for the first time are challenging predictions.
Accepted by Eur. Phys. J. C
V. Andreev20, A. Baghdasaryan32, K. Begzsuren29, A. Belousov20, A. Bolz12, V. Boudry23, G. Brandt42, V. Brisson22, D. Britzger10, A. Buniatyan2, A. Bylinkin44, L. Bystritskaya19, A.J. Campbell10, K.B. Cantun Avila18, K. Cerny26, V. Chekelian21, J.G. Contreras18, J. Cvach25, J.B. Dainton15, K. Daum31, C. Diaconu17, M. Dobre4, V. Dodonov10, G. Eckerlin10, S. Egli30, E. Elsen10, L. Favart3, A. Fedotov19, J. Feltesse9, J. Ferencei45, M. Fleischer10, A. Fomenko20, E. Gabathuler15, J. Gayler10, S. Ghazaryan10, L. Goerlich6, N. Gogitidze20, M. Gouzevitch36, C. Grab34, A. Grebenyuk3, T. Greenshaw15, G. Grindhammer21, D. Haidt10, R.C.W. Henderson14, J. Hladkỳ25, D. Hoffmann17, R. Horisberger30, T. Hreus3, F. Huber12, M. Jacquet22, X. Janssen3, H. Jung10,3, M. Kapichine8, J. Katzy10, C. Kiesling21, M. Klein15, C. Kleinwort10, R. Kogler11, P. Kostka15, J. Kretzschmar15, D. Krücker10, K. Krüger10, M.P.J. Landon16, W. Lange33, P. Laycock15, A. Lebedev20, S. Levonian10, K. Lipka10, B. List10, J. List10, B. Lobodzinski21, E. Malinovski20, H.-U. Martyn1, S.J. Maxfield15, A. Mehta15, A.B. Meyer10, H. Meyer31, J. Meyer10, S. Mikocki6, A. Morozov8, K. Müller35, Th. Naumann33, P.R. Newman2, C. Niebuhr10, G. Nowak6, J.E. Olsson10, D. Ozerov30, C. Pascaud22, G.D. Patel15, E. Perez38, A. Petrukhin36, I. Picuric24, H. Pirumov10, D. Pitzl10, R. Plačakytė10, B. Pokorny26, R. Polifka26,40, V. Radescu46, N. Raicevic24, T. Ravdandorj29, P. Reimer25, E. Rizvi16, P. Robmann35, R. Roosen3, A. Rostovtsev43, M. Rotaru4, S. Rusakov20,†, D. Šálek26, D.P.C. Sankey5, M. Sauter12, E. Sauvan17,41, S. Schmitt10, L. Schoeffel9, A. Schöning12, F. Sefkow10, S. Shushkevich37, Y. Soloviev10,20, P. Sopicki6, D. South10, V. Spaskov8, A. Specka23, M. Steder10, B. Stella27, U. Straumann35, T. Sykora3,26, P.D. Thompson2, D. Traynor16, P. Truöl35, I. Tsakov28, B. Tseepeldorj29,39, J. Turnau6, A. Valkárová26, C. Vallée17, P. Van Mechelen3, Y. Vazdik20, D. Wegener7, E. Wünsch10, J. Žáček26, Z. Zhang22, R. Žlebčík26, H. Zohrabyan32, and F. Zomer22
1 I. Physikalisches Institut der RWTH, Aachen, Germany
2 School of Physics and Astronomy, University of Birmingham,
Birmingham, UKb
3 Inter-University Institute for High Energies ULB-VUB, Brussels and
Universiteit Antwerpen, Antwerp, Belgiumc
4 Horia Hulubei National Institute for R&D in Physics and
Nuclear Engineering (IFIN-HH) , Bucharest, Romaniaj
5 STFC, Rutherford Appleton Laboratory, Didcot, Oxfordshire, UKb
6 Institute of Nuclear Physics Polish Academy of Sciences,
PL-31342 Krakow, Polandd
7 Institut für Physik, TU Dortmund, Dortmund, Germanya
8 Joint Institute for Nuclear Research, Dubna, Russia
9 Irfu/SPP, CE Saclay, GIF-SUR-YVETTE, CEDEX, France
10 DESY, Hamburg, Germany
11 Institut für Experimentalphysik, Universität Hamburg,
Hamburg, Germanya
12 Physikalisches Institut, Universität Heidelberg,
Heidelberg, Germanya
13 Institute of Experimental Physics, Slovak Academy of
Sciences, Košice, Slovak Republice
14 Department of Physics, University of Lancaster,
Lancaster, UKb
15 Department of Physics, University of Liverpool,
Liverpool, UKb
16 School of Physics and Astronomy, Queen Mary, University of London,
London, UKb
17 Aix Marseille Université, CNRS/IN2P3, CPPM UMR 7346,
13288 Marseille, France
18 Departamento de Fisica Aplicada,
CINVESTAV, Mérida, Yucatán, Méxicoh
19 Institute for Theoretical and Experimental Physics,
Moscow, Russiai
20 Lebedev Physical Institute, Moscow, Russia
21 Max-Planck-Institut für Physik, München, Germany
22 LAL, Université Paris-Sud, CNRS/IN2P3, Orsay, France
23 LLR, Ecole Polytechnique, CNRS/IN2P3, Palaiseau, France
24 Faculty of Science, University of Montenegro,
Podgorica, Montenegrok
25 Institute of Physics, Academy of Sciences of the Czech Republic,
Praha, Czech Republicf
26 Faculty of Mathematics and Physics, Charles University,
Praha, Czech Republicf
27 Dipartimento di Fisica Università di Roma Tre
and INFN Roma 3, Roma, Italy
28 Institute for Nuclear Research and Nuclear Energy,
Sofia, Bulgaria
29 Institute of Physics and Technology of the Mongolian
Academy of Sciences, Ulaanbaatar, Mongolia
30 Paul Scherrer Institut,
Villigen, Switzerland
31 Fachbereich C, Universität Wuppertal,
Wuppertal, Germany
32 Yerevan Physics Institute, Yerevan, Armenia
33 DESY, Zeuthen, Germany
34 Institut für Teilchenphysik, ETH, Zürich, Switzerlandg
35 Physik-Institut der Universität Zürich, Zürich, Switzerlandg
36 Now at IPNL, Université Claude Bernard Lyon 1, CNRS/IN2P3,
Villeurbanne, France
37 Now at Lomonosov Moscow State University,
Skobeltsyn Institute of Nuclear Physics, Moscow, Russia
38 Now at CERN, Geneva, Switzerland
39 Also at Ulaanbaatar University, Ulaanbaatar, Mongolia
40 Also at Department of Physics, University of Toronto,
Toronto, Ontario, Canada M5S 1A7
41 Also at LAPP, Université de Savoie, CNRS/IN2P3,
Annecy-le-Vieux, France
42 Now at II. Physikalisches Institut, Universität Göttingen,
Göttingen, Germany
43 Now at Institute for Information Transmission Problems RAS,
Moscow, Russial
44 Now at Moscow Institute of Physics and Technology,
Dolgoprudny, Moscow Region, Russian Federationm
45 Now at Nuclear Physics Institute of the CAS,
Řež, Czech Republic
46 Now at Department of Physics, Oxford University,
Oxford, UK
† Deceased
a Supported by the Bundesministerium für Bildung und Forschung, FRG,
under contract numbers 05H09GUF, 05H09VHC, 05H09VHF, 05H16PEA
b Supported by the UK Science and Technology Facilities Council,
and formerly by the UK Particle Physics and
Astronomy Research Council
c Supported by FNRS-FWO-Vlaanderen, IISN-IIKW and IWT
and by Interuniversity Attraction Poles Programme,
Belgian Science Policy
d Partially Supported by Polish Ministry of Science and Higher
Education, grant DPN/N168/DESY/2009
e Supported by VEGA SR grant no. 2/7062/ 27
f Supported by the Ministry of Education of the Czech Republic
under the project INGO-LG14033
g Supported by the Swiss National Science Foundation
h Supported by CONACYT,
México, grant 48778-F
i Russian Foundation for Basic Research (RFBR), grant no 1329.2008.2
and Rosatom
j Supported by the Romanian National Authority for Scientific Research
under the contract PN 09370101
k Partially Supported by Ministry of Science of Montenegro,
no. 05-1/3-3352
l Russian Foundation for Sciences,
project no 14-50-00150
m Ministery of Education and Science of Russian Federation
contract no 02.A03.21.0003
1 Introduction
The Standard Model of particle physics contains certain anomalous processes induced by instantons which violate the conservation of baryon and lepton number () in the case of electroweak interactions and chirality in the case of strong interactions [1, 2]. In quantum chromodynamics (QCD), the theory of strong interactions, instantons are non-perturbative fluctuations of the gluon field. They can be interpreted as tunnelling transitions between topologically different vacua. Deep-inelastic scattering (DIS) offers a unique opportunity [3] to discover a class of hard processes induced by QCD instantons. The corresponding cross section will be referred to as the instanton cross section. It is calculable within “instanton-perturbation theory” and is expected to be sizable [4, 5, 6, 7]. Moreover, the instanton-induced final state exhibits a characteristic signature [3, 8, 9, 10, 11]. Detailed reviews are given elsewhere [12, 13]. The theory overview given here follows closely the one in the previous H1 publication [14].
An experimental observation of instanton-induced processes would constitute a discovery of a basic and yet novel non-perturbative QCD effect at high energies. The theory and phenomenology for the production of instanton-induced processes at HERA in neutral current (NC) electron111The term “electron” is used in the following to refer to both electron and positron.-proton collisions has been worked out by Ringwald and Schrempp [3, 5, 6, 7, 8, 9]. The size of the predicted cross section is large enough to make an experimental observation possible. The expected signal rate is, however, still small compared to that from the standard NC DIS (sDIS) process. The suppression of the sDIS background is therefore the key issue. QCD instanton-induced processes can be discriminated from sDIS by their characteristic hadronic final state signature, consisting of a large number of hadrons at high transverse energy emerging from a “fire-ball”-like topology in the instanton rest system [3, 8, 9]. Discriminating observables, derived from simulation studies, are exploited to identify a phase space region where a difference between data and sDIS expectations would indicate a contribution from instanton-induced processes.
Upper cross section limits on instanton-induced processes have been reported by the H1 [14] and ZEUS [15] collaborations. This analysis is a continuation of the previous H1 search for QCD instanton-induced events using a seventeen times larger data sample. The search is carried out at significantly higher virtualities of the exchanged photons as suggested by theoretical considerations [10].
2 Phenomenology of QCD Instanton-Induced Processes in NC DIS
Instanton processes predominantly occur in photon gluon () fusion processes as sketched in figure 1. The characteristic instanton event signatures result from the following basic chirality violating reaction:
| (1) |
where , () denotes gluons, right-handed quarks (anti-quarks), and is the number of gluons produced. The chirality violation222, where # # , and is the number of quark flavours. is induced for each flavour, in accord with the corresponding axial anomaly [2]. In consequence, in every instanton event, quark anti-quark pairs of each of the flavours occur precisely once. Right-handed quarks are produced in instanton-induced processes , left-handed quarks are produced in anti-instanton ) processes. The final state induced by instantons or anti-instantons can be distinguished only by the chirality of the quarks. Experimental signatures sensitive to instanton-induced chirality violation are, however, not exploited in this analysis. Both instanton and anti-instanton processes enter likewise in the calculation of the total cross section.
|
|

In photon-gluon fusion processes, a photon splits into a quark anti-quark pair in the background of an instanton or an anti-instanton field, as shown in figure 1 . The so-called instanton subprocess is induced by the quark or the anti-quark fusing with a gluon from the proton. The partonic system contains quarks and anti-quarks, where one of the quarks (anti-quarks) acts as the current quark (). In addition, an average number of gluons is emitted in the instanton subprocess.
The quarks and gluons emerging from the instanton subprocess are distributed isotropically in the instanton rest system defined by . Therefore one expects to find a pseudo-rapidity333The pseudo-rapidity of a particle is defined as , where is the polar angle with respect to the proton direction defining the -axis. () region with a width of typically units in , densely populated with particles of relatively high transverse momentum and isotropically distributed in azimuth, measured in the instanton rest frame. The large number of partons emitted in the instanton process leads to a high multiplicity of charged and neutral particles. Besides this band in pseudo-rapidity, the hadronic final state also contains a current jet emerging from the outgoing current quark .
The instanton production cross section at HERA, , is determined by the cross section of the instanton subprocess . The subprocess cross section is calculable in instanton perturbation theory. It involves the distributions of the size of instantons and of the distance between them. By confronting instanton perturbation theory with non-perturbative lattice simulations of the QCD vacuum, limits on the validity of instanton perturbation theory have been derived [6, 7, 10]. The perturbative and lattice calculations agree for fm and . At larger or smaller , the instanton perturbative cross section grows, whereas the lattice calculations suggest that the cross section is limited. There is a relation between the variables and in momentum space and the spatial variables and . Large and values correspond to small and large , respectively. The aforementioned limits can be translated into regions of the kinematical variables and , in which the perturbative calculations are expected to be valid, and [11]. Here is the QCD scale in the scheme for flavours. In order to assure the dominance of planar diagrams the additional restriction is recommended [5, 10, 11]. The cross section depends significantly on the strong coupling444The qualitative behaviour for the instanton cross section is , where is the strong coupling. , or more precisely on , but depends only weakly on the choice of the renormalisation scale.
The calculation of the instanton production cross section in instanton perturbation theory [5-7] is valid in the dilute instanton-gas approximation for approximately massless flavours, i.e. , in the HERA kinematic domain. The contribution of heavy flavours is expected to be (exponentially) suppressed [16, 17]. Thus calculations of the instanton production cross section using the QCDINS Monte Carlo generator [11] are performed for massless flavours. It was checked that the predicted final state signature does not change significantly when heavy flavours are included in the simulation.
The analysis is performed in the kinematic region defined by and . In this kinematic region, and additionally requiring and , the cross section predicted by QCDINS is , using the QCD scale [18]. The quoted uncertainty of the instanton cross section is obtained by varying the QCD scale by one standard deviation.
The fiducial region in and of the validity of instanton perturbation theory was derived from lattice simulations, since was not available for this purpose. The perturbative instanton calculation is made in the “dilute instanton gas” approximation, where the average distance between instantons should be large compared to the instanton size. This approximation is valid for , whereas the boundary corresponds to a configuration where the distance is similar to the instanton size . A further simplifying assumption is made by choosing a simple form of the fiducial region with fixed and , whereas could be varied as a function of . In summary, the kinematic region in and , where instanton perturbation theory is reliable, is, for the reasons given above, not very well defined. Thus, the theoretical uncertainty of the instanton cross section is difficult to define and could be larger than the already significant uncertainty due to the uncertainty of the QCD scale alone. On the other hand, given that the predicted cross section is large, dedicated searches for instanton-induced processes at HERA are well motivated.
3 Experimental Method
3.1 The H1 Detector
A detailed description of the H1 detector can be found elsewhere [19, 20, 21, 22]. The origin of the H1 coordinate system is given by the nominal interaction point at . The direction of the proton beam defines the positive –axis (forward direction) and the polar angle and transverse momentum of every particle is defined with respect to this axis. The azimuthal angle defines the particle direction in the transverse plane. The detector components most relevant to this analysis are the Liquid Argon (LAr) calorimeter, which measures the positions and energies of particles over the range with full azimuthal coverage, the inner tracking detectors, which measure the angles and momenta of charged particles over the range , and a lead-fibre calorimeter (SpaCal) covering the range .
The LAr calorimeter consists of an electromagnetic section with lead absorbers and a hadronic section with steel absorbers. The electromagnetic and the hadronic sections are highly segmented in the transverse and the longitudinal directions. Electromagnetic shower energies are measured with a resolution of and hadronic energies with as determined using electron and pion test beam measurements [23, 24].
In the central region, , the central tracking detector (CTD) measures the trajectories of charged particles in two cylindrical drift chambers immersed in a uniform solenoidal magnetic field. In addition, the CTD contains a drift chamber (COZ) to improve the -coordinate reconstruction and a multi-wire proportional chamber at inner radii (CIP) mainly used for triggering [25]. The CTD measures charged particles with a transverse momentum resolution of . The forward tracking detector (FTD) is used to supplement track reconstruction in the region [26]. It improves the hadronic final state reconstruction of forward going low transverse momentum particles. The CTD tracks are linked to hits in the vertex detector, the central silicon tracker (CST) [27, 28], to provide precise spatial track reconstruction.
In the backward region the SpaCal provides an energy measurement for hadronic particles, and has a hadronic energy resolution of and a resolution for electromagnetic energy depositions of measured using test beam data [29].
The luminosity is determined by measuring the event rate for the Bethe-Heitler process , where the photon is detected in the photon tagger located at . The overall normalisation is determined using a precision measurement of the QED Compton process [30] with the electron and the photon detected in the SpaCal.
3.2 Data Samples
High neutral current DIS events are triggered mainly using information from the LAr calorimeter. The calorimeter has a finely segmented pointing geometry allowing the trigger to select localised energy deposits in the electromagnetic section of the calorimeter pointing to the nominal interaction vertex. For electrons with energies above GeV the trigger efficiency is determined to be close to [31].
This analysis is performed using the full collision data set taken in the years 2003-2007 by the H1 experiment. The data were recorded with a lepton beam of energy GeV and a proton beam of energy GeV, corresponding to a centre-of-mass energy GeV. The total integrated luminosity of the analysed data is pb-1.
3.3 Simulation of Standard and Instanton Processes
Detailed simulations of the H1 detector response to hadronic final states have been performed for two QCD models of the sDIS (background) and for QCD instanton-induced scattering processes (signal).
The background is modelled using the RAPGAP and DJANGOH Monte Carlo programs. The RAPGAP Monte Carlo program [32] incorporates the QCD matrix elements and models higher order parton emissions to all orders in using the concept of parton showers [33] based on the leading-logarithm DGLAP equations [34], where QCD radiation can occur before and after the hard subprocess. An alternative treatment of the perturbative phase is implemented in DJANGOH [35] which uses the Colour Dipole Model [36] with QCD matrix element corrections as implemented in ARIADNE [37]. In both MC generators hadronisation is modelled with the LUND string fragmentation [38, 39] using the ALEPH tune [40]. QED radiation and electroweak effects are simulated using the HERACLES [41] program, which is interfaced to the RAPGAP and DJANGOH event generators. The parton density functions of the proton are taken from the CTEQ6L set [42].
QCDINS [11, 43] is a Monte Carlo package to simulate QCD instanton-induced scattering processes in DIS. The hard process generator is embedded in the HERWIG [44] program and is implemented as explained in section 2. The number of flavours is set to . Outside the allowed region defined by and the instanton cross section is set to zero. The CTEQ5L [45] parton density functions are employed555In the phase space of this analysis the CTEQ5L and CTEQ6L gluon density distributions are almost identical.. Besides the hard instanton subprocess, subleading QCD emissions are simulated in the leading-logarithm approximation, using the coherent branching algorithm implemented in HERWIG. The hadronisation is performed according to the Lund string fragmentation.
The generated events are passed through a detailed GEANT3 [46] based simulation of the H1 detector and subjected to the same reconstruction and analysis chains as are used for the data.
3.4 Inclusive DIS Event Selection
Neutral current DIS events are triggered and selected by requiring a cluster in the electromagnetic part of the LAr calorimeter. The scattered electron is identified as the isolated cluster of highest transverse momentum. A minimal electron energy of 11 GeV is required. The remaining clusters in the calorimeters and the charged tracks are attributed to the hadronic final state (HFS), which is reconstructed using an energy flow algorithm without double counting of energy [47, 49, 48]. The default electromagnetic energy calibration and alignment of the H1 detector [50] as well as the HFS calibration [31, 51] are applied. The longitudinal momentum balance is required to be within , where the sum runs over the scattered electron and all HFS objects. Furthermore the position of the -coordinate of the reconstructed event vertex must be within of the nominal interaction point.
The photon virtuality , the Bjorken scaling variable and the inelasticity of the interaction are reconstructed from the scattered electron and the hadronic final state particles using the electron-sigma method [52]. This method is the most precise one in the kinematic range of this analysis. The events are selected to cover the phase space region defined by , and .
The events passing the above cuts yield the NC DIS sample which forms the basis of the subsequent analysis. It consists of about events. The simulated events are subjected to the same reconstruction and analysis chains as the real data. They reproduce well the shape and the absolute normalisation of the distributions of the energy and angle of the scattered electron as well as the kinematic variables , and .
3.5 Definition of the Observables and the Search Strategy
The observables used to discriminate the instanton-induced contribution from that of sDIS processes are based on the hadronic final state objects and on a selection of charged particles. Only HFS objects with are considered. Charged particles are required to have transverse momenta with GeV and polar angles with . Here and are measured in the laboratory frame.
In the following, all HFS objects are boosted to the hadronic centre-of-mass frame (HCM)666The hadronic centre-of-mass frame is defined by , where and are the -momentum of the exchanged photon and proton, respectively.. Jets are defined by the inclusive algorithm [53] as implemented in FastJet [54], with the massless recombination scheme and with the distance parameter . A cone radius is used. Jets are required to have transverse energy in the HCM frame GeV. Additional requirements on the transverse energy and pseudorapidity of the jets in the laboratory frame are imposed, and GeV, in order to ensure that jets are contained within the acceptance of the LAr calorimeter and are well calibrated. The events are selected by requiring at least one jet with GeV. The jet with the highest transverse energy is used to estimate the -momentum of the current quark (see figure 1). can be reconstructed from the particles associated with the current jet and the photon -momentum, which is obtained using the measured momentum of the scattered electron. The resolution is about . However, the distribution of the true over the reconstructed value exhibits large tails, since in about of the cases the wrong jet is identified as the current jet. Due to the limited accuracy of the reconstruction, the reconstructed , labelled , cannot be used to experimentally limit the analysis to the kinematically allowed region . Details of the reconstruction are described in [9, 55, 56].
The hadronic final state objects belonging to the current jet are not used in the definition of the following observables. A band in pseudo-rapidity with a width of units in is defined around the mean , where the sum includes hadronic final state objects [57]. This pseudo-rapidity band is referred to as the “instanton band”. The number of charged particles in the instanton band and the total scalar transverse energy of all hadronic final state objects in the instanton band are measured.
An approximate instanton rest frame, where all hadronic final state objects in the instanton band are distributed isotropically, is defined by . The definition of is given in figure 1. A numerical value of is used throughout this analysis [14]. In the instanton rest frame the sphericity and the first three normalised Fox-Wolfram moments are calculated [58, 39]. For spherical events is close to unity, while for pencil-like events tends to zero. Furthermore, the axes and are found for which in the instanton rest system the summed projections of the -momenta of all hadronic final state objects in the instanton band are minimal or maximal [8]. The relative difference between and is called . This quantity is a measure of the transverse energy weighted azimuthal isotropy of an event. For isotropic events is small while for pencil-like events is close to unity.
The reconstruction of the variable suffers from poor resolution as in the case of . Using two methods to calculate the invariant mass of the quark gluon system, , is reconstructed as , where with and where the sum runs over the HFS objects in the instanton band. The calculation is based on the scattered electron and the current jet, while the reconstruction relies on the measurement of the hadronic final state objects in the instanton band. The resolution achieved is about . As for the case of , the reconstructed cannot be used to limit the analysis to the kinematically allowed region . However, as well as can be used to discriminate instanton processes from the sDIS background.
Exploiting these observables, a multivariate discrimination technique is used to find the most sensitive set of observables to distinguish between signal and background [59].
3.6 Comparison of Data to Standard QCD Predictions
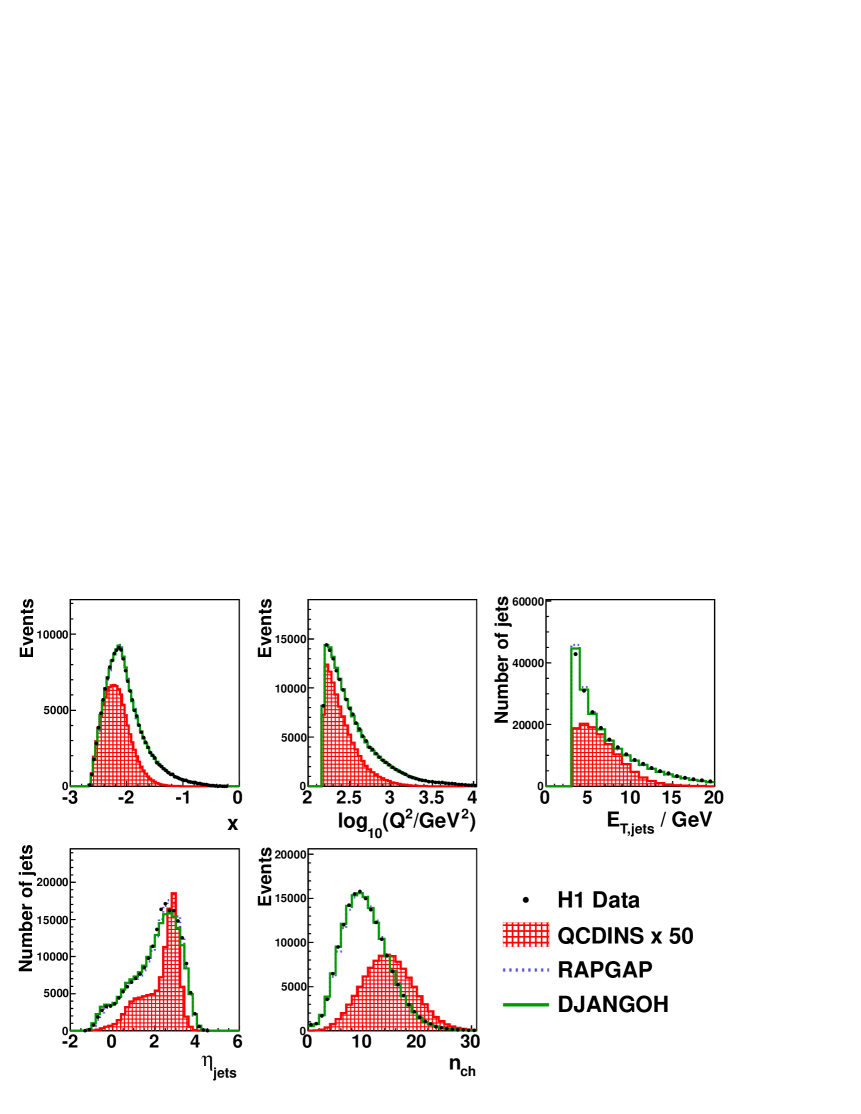
Both the RAPGAP and DJANGOH simulations provide a reasonable overall description of the experimental data in the inclusive DIS and jet sample. To further improve the agreement between Monte Carlo events and data, event weights are applied to match the jet multiplicities as a function of . The MC events are also weighted as a function of and of the most forward jet in the Breit frame [51, 31]. Furthermore, the track multiplicity distribution is weighted. The weights are obtained from the ratio of data to the reconstructed MC distributions and are applied to the events on the generator level. After these weights are applied, the simulations provide a good description of the shapes and normalisation of the data distributions. Examples of these control distributions are shown in figure 2: distributions of the kinematic variables and , the transverse energy of the jets , the pseudorapidity of the jets in the hadronic centre-of-mass frame and the charged particle multiplicity .
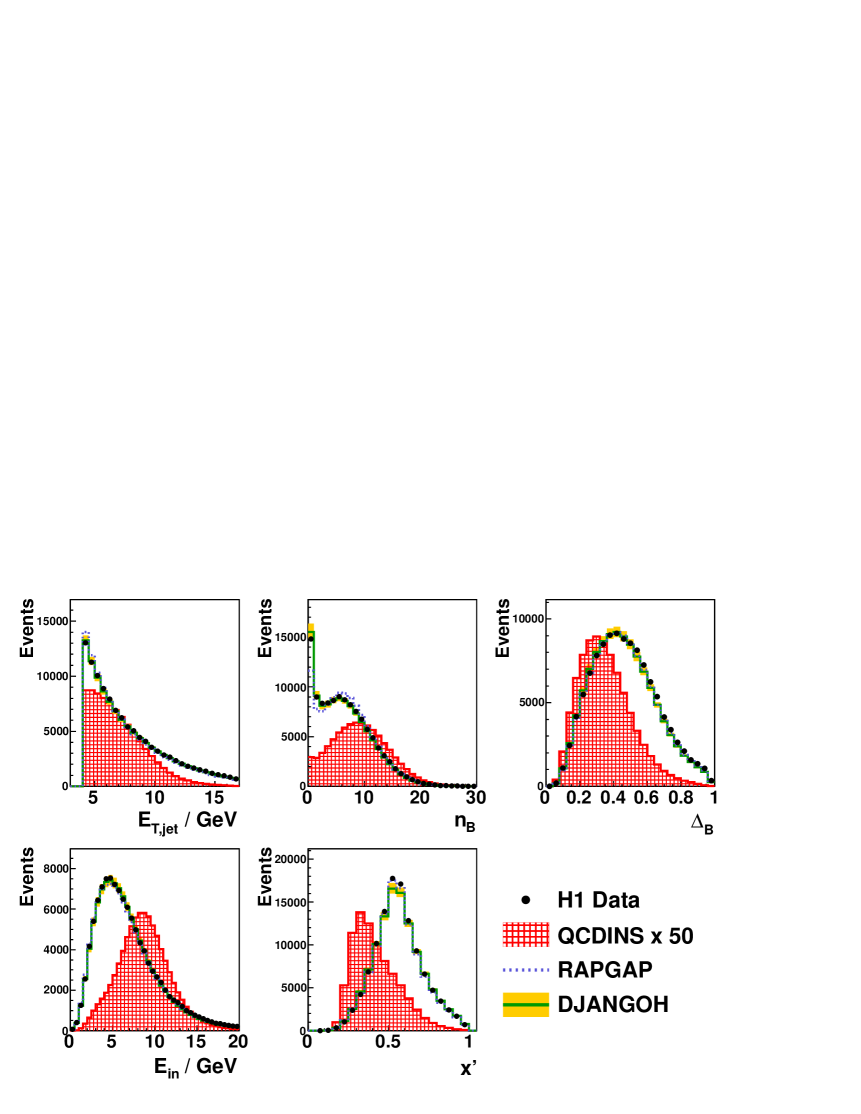
The measured distributions of the five observables , , , and are compared in figure 3 to the expectations from the standard DIS QCD models (RAPGAP, DJANGOH) and from the instanton model (QCDINS). The data are reasonably well described by the reweighted sDIS Monte Carlo simulations. The models are able to describe the data within except at very low and/or very large values of the given observable, where differences up to are observed. The expected instanton distributions differ in shape from the sDIS background. However, the magnitude of the expected signal is small and advanced discrimination methods are required to enhance the signal to background ratio.
4 Search for Instanton-Induced Events
A multivariate discrimination technique is employed to increase the sensitivity to instanton processes. The PDERS (Probability Density Estimator with Range Search) method as implemented in the TMVA ROOT package [60] is used777 The PDERS method has been cross checked with other methods: the neural network MLP (Multi-Layer Perceptron) method and two variants of the decision tree method, BDT (Boosted Decision Trees) and BDTG (Boosted Decision Trees with Gradient Boost) [59]..
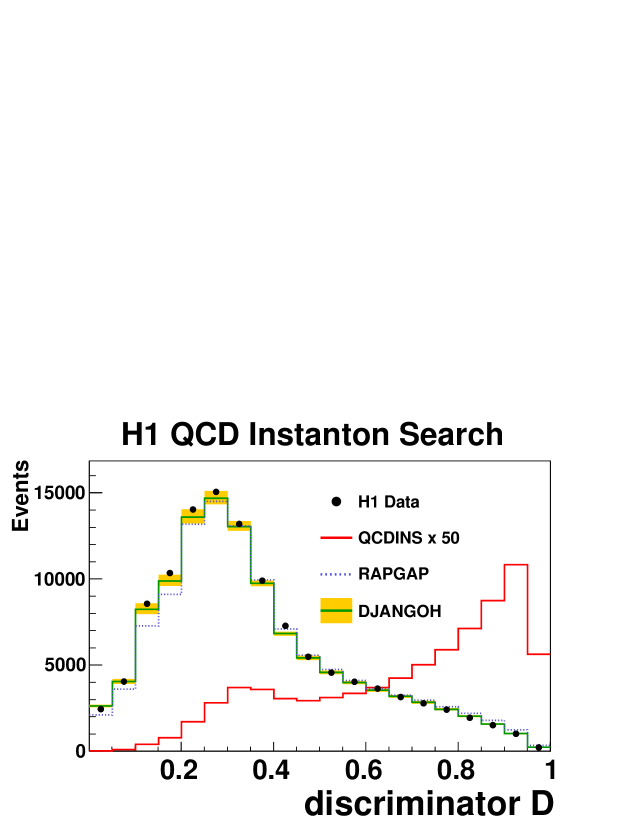
The strategy to reduce the sDIS background is based on the observables , , , and . This set of observables has been chosen since it provides the best signal to background separation [59]. Moreover, the distributions of these variables are overall well described by both Monte Carlo simulations. The distribution of the discriminator is shown in figure 4. Taking into account the systematic uncertainties, the discriminator distribution is described by the sDIS Monte Carlo simulations in the background dominated region. For predictions and data agree within systematic uncertainties. The background events are mainly concentrated at low discriminator values, while the instanton signal peaks at large values of the discriminator. At large both data and predicted background fall off steeply.
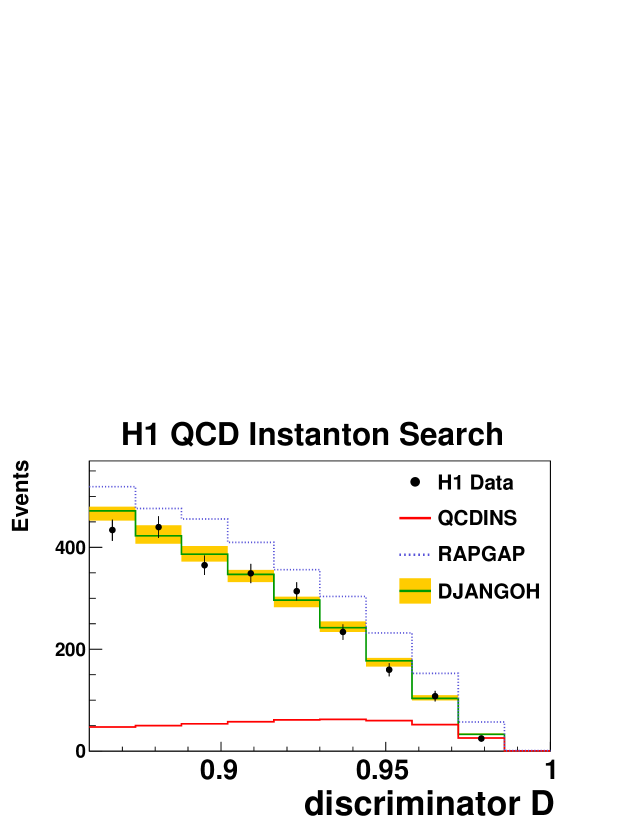
A signal region is defined for , optimised for a determination of the instanton signal from event counting. The distributions of the expected instanton signal and of the background are shown in figure 5. No excess of events is observed and the DJANGOH MC describes the data well, while the prediction of RAPGAP is systematically above the data.
| Data | DJANGOH | RAPGAP | QCDINS | |
|---|---|---|---|---|
The expected and observed number of events are summarised in table 1. In the signal region, a total of events are observed in data, while DJANGOH predicts and RAPGAP . The uncertainties on the expected number of events include experimental systematic uncertainties and small contributions from the finite sample sizes. For the expected number of instanton-induced events the dominating uncertainty is due to .
The following sources of systematic uncertainties are propagated through the full analysis chain:
- •
-
•
Depending on the electron polar angle the energy of the scattered electron is measured with a precision of [61].
-
•
The precision of the electron polar angle measurement is mrad [61].
-
•
Depending on the electron polar angle, the uncertainty on the electron identification efficiency ranges from to [51].
-
•
The uncertainty associated with the track reconstruction efficiency and the effect of the nuclear interactions in the detector material on the efficiency of track reconstruction are estimated to be each [62].
The effect of these uncertainties on the expected signal and background distributions is determined by varying the corresponding quantities by standard deviation in the MC samples and propagating these variations through the whole analysis. The above systematic and statistical uncertainties added in quadrature are shown in the figures and in table 1. The included statistical uncertainties due to the limited Monte Carlo statistics are approximately an order of magnitude smaller than the experimental systematic uncertainties.
The main contributions to the experimental systematic uncertainties arise from the energy scale calibration of the scattered electron ranging from in the background dominated region to in the signal region and from the energy scale of the HFS ranging from in the background region to in the signal region. Uncertainties connected with the track reconstruction and secondary interactions of the produced hadrons in the material surrounding the interaction region contribute to the systematic error in the signal region at a level of each, and in the background dominated region by less than . In the full range of the discriminator, the uncertainties on the electron identification and on the precision of the electron polar angle are smaller than each.
Given the observed and expected numbers of events, no evidence for QCD instanton-induced processes is observed. In the following, the data are used to set exclusion limits.
5 Exclusion Limits for Instanton-Induced Processes
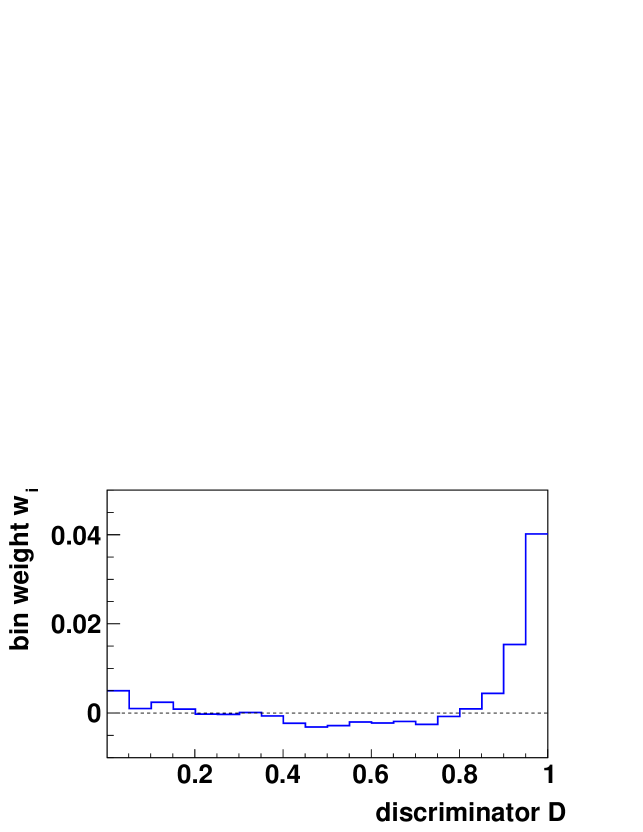
The upper limit is determined from a CLs statistical analysis [63, 64] using the method of fractional event counting [65]. A test statistic is constructed as a fractional event count of all events using the discriminator distribution:
| (2) |
where the sum runs over all bins, and is the number of events observed in bin . The weights are calculated from the predicted signal and background contributions and their uncertainties, using an appropriate set of linear equations [65]. They are defined in such a way as to ensure that only bins with both a large signal-to-background ratio and small systematic uncertainties enter with sizable weights into the test statistic . In case of negligible systematic uncertainties, the weights behave as where and are the predicted number of signal and background events in a given bin , respectively. In the presence of bin-to-bin correlated systematic uncertainties, the weights may become negative in background-dominated regions. When calculating the test statistics the negative weights correspond to a subtraction of background contributions, estimated from data. The distribution of the resulting weights is shown in figure 6. Large positive weights are attributed to bins in the signal region, . Negative weights are assigned in the region . A large number of MC experiments are generated by varying the expected number of events in absence or presence of the signal within the statistical and systematic uncertainties. Systematic uncertainties are treated as Gaussian distributions and statistical fluctuations are simulated using Poisson statistics. If , the signal hypothesis is excluded at confidence level.
Limits are calculated using the full range of the discriminator distribution as shown in figure 4. The following additional systematic uncertainties are included in the exclusion limit calculation:
-
•
The normalisation uncertainty due to the precision of the integrated luminosity measurement is [30].
-
•
The difference between the prediction from DJANGOH and RAPGAP is assigned as model uncertainty of the background estimation, i.e. the difference between two background histograms in figure 4. This model uncertainty is large, and , for small and large values of the discriminator, respectively. For intermediate values of it amounts to .
-
•
The uncertainty of the background normalisation is . This uncertainty is estimated as , where and are the total number of predicted events in the full discriminator range for the DJANGOH and RAPGAP MC simulations, respectively.
-
•
The uncertainty of the predicted signal cross section due to the uncertainty of (section 2) varies from 20 to 50% depending on the region in and .
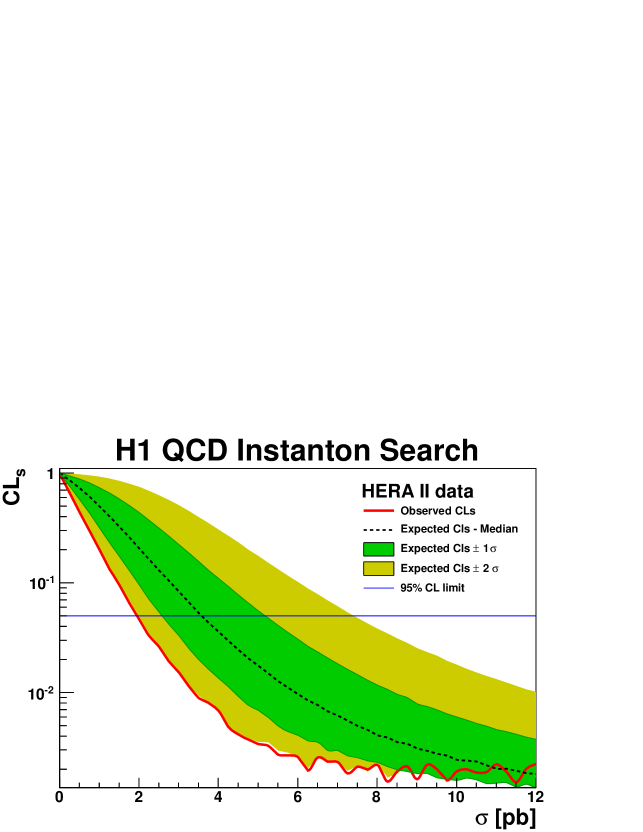
Figure 7 shows the behaviour of the observed CLs as a function of the instanton signal cross section. In this study the total instanton cross section is taken as a free parameter, whereas the signal shape is taken from the QCDINS simulation. At CL, the observed limit is pb, as compared to a median expected cross section limit of pb. The first (second) set of uncertainties indicates the corresponding () deviations of the median expected cross section limit. The observed deviation between the expected and observed limit is caused by a downward fluctuation of the observed data test statistics . This downward fluctuation receives contributions both from regions where the weights are positive and the data are below the background prediction and from regions where the are negative and the data are somewhat larger than expected.
The QCD instanton model implemented in QCDINS, restricted to the kinematic region defined by and , predicts a cross section of pb, and thus is excluded by the H1 data. Note that the cross section uncertainty of , stemming from the variation of , is already included in the observed limit of pb.
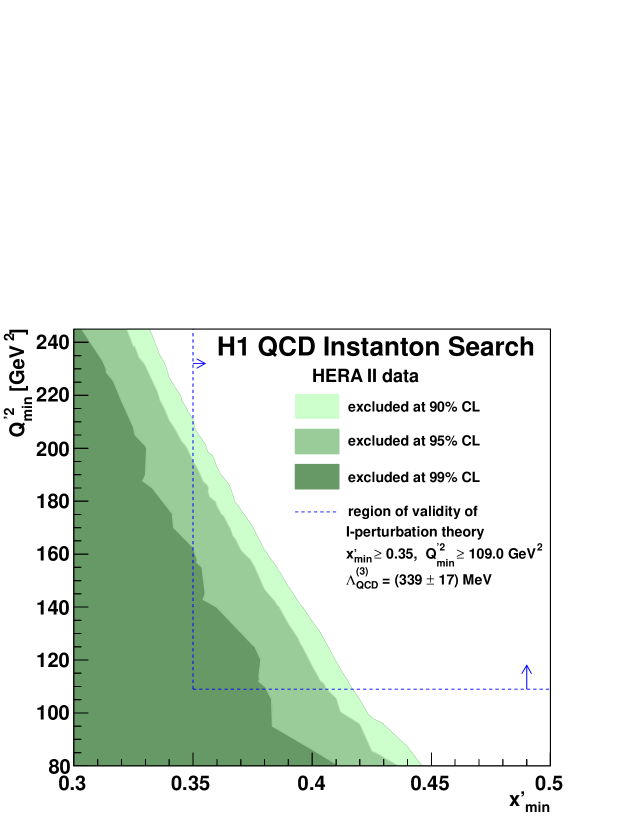
In order to assess the sensitivity of the instanton cross section on the kinematic variables and , limits are also determined as a function of the lower bounds and . As explained in section 3.3, outside these bounds the instanton cross section is set to zero. The results are shown in figure 8, where the observed confidence levels, using the QCDINS predictions, are shown in the plane. At confidence level, parameter values are excluded at fixed . For fixed , values of are excluded. The exclusion regions depend somewhat on the choice of and its uncertainty. In order to assess these effects, the analysis was repeated for MeV [66] instead of MeV . For this choice, more stringent limits are obtained. For example, at fixed the excluded range at confidence level would change to .
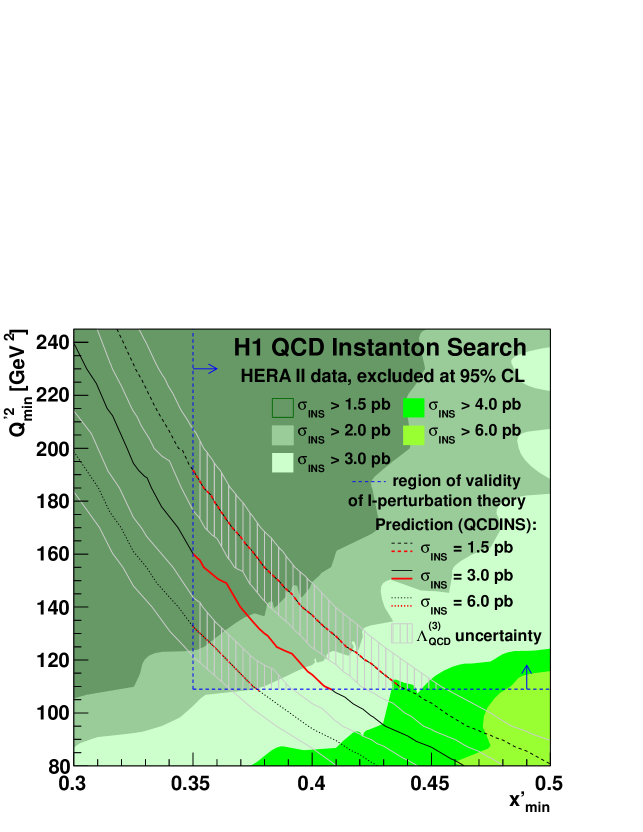
A less model-dependent search is presented in figure 9. Here, limits on the instanton cross section are determined as a function of the parameters and , using the signal shapes predicted by QCDINS. No uncertainty on the instanton cross section normalisation is included in this determination of the experimental cross section limit. The most stringent exclusion limits of order pb are observed for large and small . For increasing the limits are getting weaker. At the nominal QCDINS setting, and , one expects to find back an exclusion limit of pb, as discussed with figure 7. The limit in figure 9, however, is observed to be somewhat better, because the theory uncertainty on the cross section normalisation is included in figure 7 but not in figure 9.
6 Conclusions
A search for QCD instanton-induced processes is presented in neutral current deep-inelastic scattering at the electron-proton collider HERA. The kinematic region is defined by the Bjorken-scaling variable , the inelasticity and the photon virtuality GeV2. The search is performed using H1 data corresponding to an integrated luminosity of pb-1.
Several observables of the hadronic final state of the selected events are exploited to identify a potentially instanton-enriched sample. Two Monte Carlo models, RAPGAP and DJANGOH, are used to estimate the background from the standard NC DIS processes. The instanton-induced processes are modelled by the program QCDINS. In order to extract the expected instanton signal a multivariate data analysis technique is used. No evidence for QCD instanton-induced processes is observed. In the kinematic region defined by the theory cut-off parameters and an upper limit of pb on the instanton cross section at CL is determined, as compared to a median expected limit of pb. Thus, the corresponding predicted instanton cross section of pb is excluded by the H1 data. Limits are also set in the kinematic plane defined by and . These limits may be used to assess the compatibility of theoretical assumptions such as the dilute gas approximation with H1 data, or to test theoretical predictions of instanton properties such as their size and distance distributions.
Upper cross section limits on instanton-induced processes reported previously by the H1 [14] and ZEUS [15] collaborations are above the theoretical predicted cross sections. In a domain of phase space with a lower range ( GeV2), H1 reported an upper limit of pb at CL, about a factor five above the corresponding theoretical prediction. At high ( GeV2), the ZEUS Collaboration obtained an upper limit of pb at CL in comparison to a predicted cross section of pb. In summary, compared to earlier publications, QCD instanton exclusion limits are improved by an order of magnitude and are challenging predictions based on perturbative instanton calculations with parameters derived from lattice QCD.
Acknowledgements
We thank A. Ringwald and F. Schrempp for many helpful discussions and for help with their computer program. We are grateful to the HERA machine group whose outstanding efforts have made this experiment possible. We thank the engineers and technicians for their work in constructing and maintaining the H1 detector, our funding agencies for financial support, the DESY technical staff for continual assistance and the DESY directorate for support and for the hospitality which they extend to the non DESY members of the collaboration. We would like to give credit to all partners contributing to the EGI computing infrastructure for their support for the H1 Collaboration.
References
- [1] A. A. Belavin, A. M. Polyakov, A. S. Shvarts and Y. S. Tyupkin, Phys. Lett. B 59 (1975) 85.
- [2] G. ’t Hooft, Phys. Rev. Lett. 37 (1976) 8; G. ’t Hooft, Phys. Rev. D 14 (1976) 3432; [Erratum-ibid. D 18 (1976) 2199].
- [3] A. Ringwald and F. Schrempp, (Vladimir, Russia, 1994), D. Grigoriev et al. (Eds.), Proc. of the 8th Int. Seminar, pp. 170, [hep-ph/9411217].
- [4] I. I. Balitsky and V. M. Braun, Phys. Lett. B 314 (1993) 237 [hep-ph/9305269].
- [5] S. Moch, A. Ringwald and F. Schrempp, Nucl. Phys. B 507 (1997) 134 [hep-ph/9609445].
- [6] A. Ringwald and F. Schrempp, Phys. Lett. B 438 (1998) 217 [hep-ph/9806528].
- [7] A. Ringwald and F. Schrempp, Phys. Lett. B 459 (1999) 249 [hep-lat/9903039].
- [8] M. Gibbs et al., (Hamburg, Germany, 1996), G. Ingelman, A. deRoeck, and R. Klanner (Eds.), vol. 1, p. 509.
- [9] T. Carli, J. Gerigk, A. Ringwald and F. Schrempp, (Hamburg, Germany, 1999), A. Doyle, G. Ingelman, H. Jung and G. Grindhammer (Eds.), p.329, [hep-ph/9906441].
- [10] A. Ringwald and F. Schrempp, Phys. Lett. B 503 (2001) 331 [hep-ph/0012241].
- [11] A. Ringwald and F. Schrempp, Comput. Phys. Commun. 132 (2000) 267 [hep-ph/9911516]. Available at http://www.desy.de/ t00fri/qcdins/qcdins.html.
- [12] A. Ringwald and F. Schrempp, (Schloss Ringberg, Tegernsee, Germany, 1999), G. Grindhammer, B. Kniehl, G. Kramer and W. Ochs (Eds.), Lect. Notes Phys. 546 (2000) 203, [hep-ph/9909338].
- [13] F. Schrempp, J. Phys. G 28 (2002) 915 [hep-ph/0109032].
- [14] C. Adloff et al. [H1 Collaboration], Eur. Phys. J. C 25 (2002) 495 [hep-ex/0205078].
- [15] S. Chekanov et al. [ZEUS Collaboration], Eur. Phys. J. C 34 (2004) 255 [hep-ex/0312048].
- [16] F. Schrempp, private communication, December 2015.
- [17] N. Andrei and D. J. Gross, Phys. Rev. D 18 (1978) 468.
- [18] S. Aoki et al., Eur. Phys. J. C 74 (2014) 2890 [arXiv:1310.8555].
- [19] I. Abt et al. [H1 Collaboration], Nucl. Instrum. Meth. A 386 (1997) 310.
- [20] I. Abt et al. [H1 Collaboration], Nucl. Instrum. Meth. A 386 (1997) 348.
- [21] B. Andrieu et al. [H1 Calorimeter Group], Nucl. Instrum. Meth. A 336 (1993) 460.
- [22] R. D. Appuhn et al. [H1 SpaCal Group], Nucl. Instrum. Meth. A 386 (1997) 397.
- [23] B. Andrieu et al. [H1 Calorimeter Group], Nucl. Instrum. Meth. A 336 (1993) 499.
- [24] B. Andrieu et al. [H1 Calorimeter Group], Nucl. Instrum. Meth. A 350 (1994) 57.
- [25] J. Becker et al., Nucl. Instrum. Meth. A 586 (2008) 190 [physics/0701002].
- [26] P. J. Laycock et al., JINST 7 (2012) T08003 [arXiv:1206.4068].
- [27] D. Pitzl et al., Nucl. Instrum. Meth. A 454 (2000) 334 [hep-ex/0002044].
- [28] B. List, Nucl. Instrum. Meth. A 501 (2001) 49.
- [29] T. Nicholls et al. [H1 SPACAL Group Collaboration], Nucl. Instrum. Meth. A 374 (1996) 149.
- [30] F. D. Aaron et al. [H1 Collaboration], Eur. Phys. J. C 72 (2012) 2163, [arXiv:1205.2448] Erratum ibid, 74 (2014) 2733.
- [31] V. Andreev et al. [H1 Collaboration], Eur. Phys. J. C 75 (2015) 65, [arXiv:1406.4709].
- [32] H. Jung, Comput. Phys. Commun. 86 (1995) 147, RAPGAP available at http://www.desy.de/jung/rapgap/rapgap-desy.html.
- [33] M. Bengtsson and T. Sjöstrand, Z. Phys. C 37 (1988) 465.
-
[34]
V. N. Gribov and L. N. Lipatov,
Yad. Fiz. 15 (1972) 781
[Sov. J. Nucl. Phys. 15 (1972) 438];
Y. L. Dokshitzer, Sov. Phys. JETP 46 (1977) 641 [Zh. Eksp. Teor. Fiz. 73 (1977) 1216];
G. Altarelli and G. Parisi, Nucl. Phys. B 126 (1977) 298. - [35] K. Charchula, G. A. Schuler and H. Spiesberger, Comput. Phys. Commun. 81 (1994) 381.
- [36] G. Gustafson and U. Pettersson, Nucl. Phys. B 306 (1988) 746;
- [37] L. Lönnblad, Comput. Phys. Commun. 71 (1992) 15.
- [38] B. Andersson, G. Gustafson, G. Ingelman and T. Sjöstrand, Phys. Rep. 97 (1983) 31.
- [39] T. Sjöstrand, Comput. Phys. Commun. 82 (1994) 74, [hep-ph/9508391].
- [40] S. Schael et al. [ALEPH Collaboration], Phys. Lett. B 606 (2005) 265.
- [41] A. Kwiatkowski, H. Spiesberger and H. J. Mohring, Comput. Phys. Commun. 69 (1992) 155.
- [42] J. Pumplin et al., JHEP 0207 (2002) 012 [hep-ph/0201195].
- [43] M. Gibbs, A. Ringwald and F. Schrempp, (Paris, France, 1995), J.-F. Laporte and Y. Sirois (Eds.), pp. 341, hep-ph/9506392.
- [44] G. Marchesini et al., Comput. Phys. Commun. 67 (1992) 465.
- [45] H. L. Lai et al. [CTEQ Collaboration], Eur. Phys. J. C 12 (2000) 375 [hep-ph/9903282].
- [46] R. Brun et al., CERN-DD-EE-84-1 (1987).
- [47] M. Peez, Search for deviations from the standard model in high transverse energy processes at the electron proton collider HERA (in French). Dissertation, Univ. Lyon, 2003, DESY-THESIS-2003-023. Available at http://www-h1.desy.de/publications/theses_list.html.
- [48] B. Portheault, First measurement of charged and neutral current cross sections with the polarized positron beam at HERA II and QCD-electroweak analysis (in French). Dissertation, Univ. Paris XI Orsay, LAL-05-05, 2005. Available at http://www-h1.desy.de/publications/theses_list.html.
- [49] S. Hellwig, Investigation of the double tagging method for the analysis of charm (in German). Diploma thesis, Univ. Hamburg,2004. Available at http://www-h1.desy.de/publications/theses_list.html.
- [50] C. Adloff et al. [H1 Collaboration], Eur. Phys. J. C 30 (2003) 1 [hep-ex/0304003].
- [51] R. Kogler, Measurement of jet production in deep-inelastic ep scattering at HERA. Dissertation, Univ. Hamburg, DESY-THESIS-2011-003, MPP-2010-175,2010. Available at http://www-h1.desy.de/publications/theses_list.html.
- [52] U. Bassler and G. Bernardi, Nucl. Instrum. Meth. A 426 (1999) 583 [hep-ex/9801017].
- [53] S. D. Ellis and D. E. Soper, Phys. Rev. D 48 (1993) 3160 [hep-ph/9305266].
- [54] M. Cacciari and G. P. Salam, Phys. Lett. B 641 (2006) 57 [hep-ph/0512210].
- [55] J. Gerigk, QCD-Instanton-induzierte Prozesse in tiefunelastischer -Streuung. Diploma Thesis, Univ. Hamburg, MPI-PhE/98-20 (1998). Available at http://www-h1.desy.de/publications/theses_list.html.
- [56] B. Koblitz [H1 Collaboration], J. Phys. G 28 (2002) 927 [hep-ex/0110042].
- [57] B. Koblitz, Search for Instanton-Induced Processes with the H1 Detector in Deep-Inelastic Electron-Proton Collisions at HERA. Dissertation, Univ. Hamburg, 2002, MPI-PhE/2002-07. Available at http://www-h1.desy.de/publications/theses_list.html.
- [58] G. C. Fox and S. Wolfram, Nucl. Phys. B 149 (1979) 413 [Erratum-ibid. B 157 (1979) 543].
- [59] P. Sopicki, Search for QCD instantons in the H1 experiment at HERA (in Polish). Dissertation, Inst. of Nucl. Physics Polish Acad. of Sciences, Cracow, 2013. Available at http://www-h1.desy.de/publications/theses_list.html
- [60] A. Höcker et al., PoS ACAT (2007) 040 [physics/0703039].
- [61] F. D. Aaron et al. [H1 Collaboration], JHEP 1209 (2012) 061 [arXiv:1206.7007].
- [62] M. Brinkmann, Measurement of the meson production cross section and at high in scattering at HERA. Dissertation, Univ. Hamburg, DESY-THESIS-2010-016. Available at http://www-h1.desy.de/publications/theses_list.html.
- [63] A. L. Read, 1st Workshop on Confidence Limits, CERN, Geneva, Switzerland,17-18 Jan 2000, 81-101, CERN-OPEN-2000-205.
- [64] T. Junk, Nucl. Instrum. Meth. A 434 (1999) 435 [hep-ex/9902006].
- [65] P. Bock, JHEP 0701 (2007) 080 [hep-ex/0405072].
- [66] K. A. Olive et al. [Particle Data Group Collaboration], Chin. Phys. C 38 (2014) 090001.