Discovery of molecular hydrogen in SN 1987A
Abstract
Both CO and SiO have been observed at early and late phases in SN 1987A. H2 was predicted to form at roughly the same time as these molecules, but was not detected at early epochs. Here we report the detection of NIR lines from H2 at m and m in VLT/SINFONI spectra obtained between days 6489 and 10,120. The emission is concentrated to the core of the supernova in contrast to H and approximately coincides with the [Si I]/[Fe II] emission detected previously in the ejecta. Different excitation mechanisms and power sources of the emission are discussed. From the nearly constant H2 luminosities we favour excitation resulting from the 44Ti decay.
Subject headings:
supernovae: general— supernovae: individual (SN 1987A) — molecular processes1. INTRODUCTION
Observations of molecules in supernovae (SNe) have turned out to yield important diagnostics of the conditions in the cooling ejecta. The first examples were discovered in SN 1987A shortly after explosion. CO was first detected 112 days after explosion (Spyromilio et al., 1988) and persisted to over 600 days (Bouchet & Danziger, 1993). Both the fundamental and overtone bands were detected. Somewhat later, at days, the fundamental band of SiO was also detected (Aitken et al., 1988; Roche et al., 1991). From NLTE modeling of the rovibrational lines the masses were estimated to be for CO (Liu et al., 1992) and for SiO (Liu & Dalgarno, 1994). Recently at an age of 26 years both these molecules have been detected in rotational transitions at K with ALMA (Kamenetzky et al., 2013; Matsuura et al., 2015). The CO mass was, however, at this epoch at least an order of magnitude larger than the estimate from the NIR observations in Liu et al. (1992), indicating that most of the molecule formation may have occurred later than the last NIR observations.
In addition to these molecules, Culhane & McCray (1995, hereafter CMC) predicted that molecular hydrogen, H2, would form in the core. Their calculations showed that between 400 and 1000 days after explosion this would increase from a very low level to of the total H abundance, where it would freeze out. Utrobin & Chugai (2005) later found that H2 could be present in the tenuous H envelope even at weeks after explosion, with an abundance of of atomic H.
Although predicted long ago, and constituting a substantial fraction of the ejecta mass, no detection of H2 has been found in a SN. While H2 has been detected in the Crab nebula (Graham et al., 1990) the origin of this is unknown, although Graham et al. argue for the formation in the ejecta. In this paper we report clear evidence of H2 from NIR rovibrational ejecta lines in SN 1987A observed with VLT/SINFONI at very late phases.
2. Observations
| Date | Epoch | Band | Exposure | Seeing |
|---|---|---|---|---|
| days | s | ″ | ||
| 2004-11-29 | 6489 | K | 1800 | 0.68 |
| 2005-10-30 – 2005-11-14 | 6832 | K | 5400 | 0.38 |
| 2005-10-22 – 2005-11-18 | 6830 | H | 4200 | 0.31 |
| 2007-11-07 – 2008-01-19 | 7615 | K | 9000 | 0.43 |
| 2007-11-07 – 2008-01-09 | 7602 | H | 4800 | 0.31 |
| 2010-11-05 – 2011-01-02 | 8694 | K | 10800 | 0.35 |
| 2014-10-12 – 2014-12-01 | 10120 | K | 7200 | 0.58 |
The H and K-band observations, covering m and m, respectively, were obtained 2004–2014 using the SINFONI Integral Field Spectrograph at the VLT (Eisenhauer et al., 2003; Bonnet et al., 2004). The log of the observations is given in Table 1. The data were reduced using the standard ESO pipeline (Modigliani et al., 2007) and are discussed in detail in Kjær et al. (2010), together with modelling of the atomic emission. Additional dedicated software was developed by us to combine observations spread over many epochs. The absolute reproducibility (cross calibration) of the standard stars was better than 5%. The encircled energy of the PSF for 80% of the emission is in the 2005 K-band observation (Kjær et al., 2010), which gives a good measure of the spatial resolution. The spectral resolution is and for the K- and H-band, respectively. Because of the short exposure of the 2004 observations we do not discuss this epoch further. The observations in 2004, 2005, 2011 and 2014 are discussed in Kjær et al. (2007, 2010) and Larsson et al. (2013, 2016).
The Q-branch of H2 at m is awkwardly located near the end of the K-band atmospheric window and also near the rise of the thermal background from the telescope, which could give rise to the appearance of features in the spectra. We have therefore examined individually all frames to ensure that the residual thermal and atmospheric backgrounds do not create artefacts that would mimic the Q-branch emission from the SN.
3. Results
In Fig. 1 we show a compilation of the K-band spectra of the ejecta from 2005 to 2014, days 6832, 7606, 8694 and 10,120.
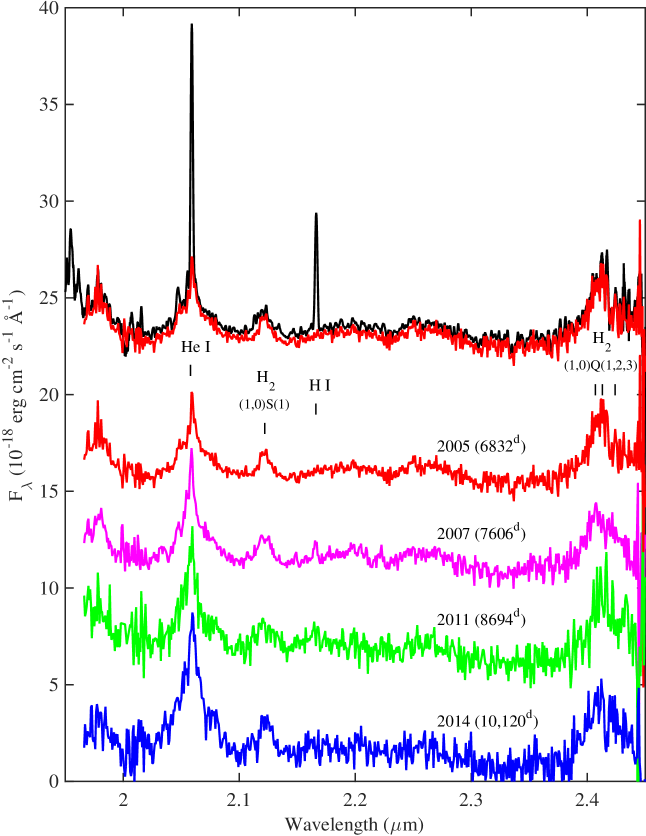
In order to minimise the contamination from the ring and to compare the fluxes from the same co-moving region we use an expanding elliptical aperture enclosing the emitting H2 region, shown in Fig. 2. Scattered light from the ring was removed as in Larsson et al. (2016), using the fact that lines from the ring are much narrower (FWHM ) compared to the ejecta lines (FWHM ). This subtraction is illustrated in the upper spectrum in Fig. 1. The spectra were binned by a factor three.
The strongest line at all epochs is the He I 2.058 m line. We also see a faint Br line at 2.166m. In addition to these, there is a clear line at 2.12m and a strong, broad feature at 2.40m. Based on the absence of other natural candidates (see Sect. 4.1) we identify the 2.12m line as the (1,0) S(1) transition in H2 and the feature at 2.40m as a blend of the (1,0) Q(1 – 3) transitions at 2.406, 2.413, 2.423 m. We do not detect the overtone CO band, which would peak between 2.30-2.35 m.
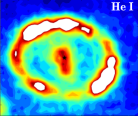
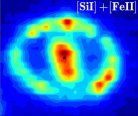
In Fig. 2 we show the spatial distribution in 2005 of the 2.40m feature, with and without subtraction of the ’continuum’ in the line-free region between m, together with H2 2.12 m, H from HST (Larsson et al., 2013), and He I 2.058 m, and [Si I]/[Fe II] from SINFONI (Kjær et al., 2010). The emission from the circumstellar ring in the 2.12 m and 2.40m images is a result of H I line and continuum emission.
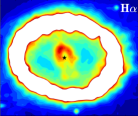
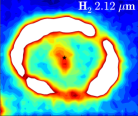
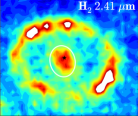
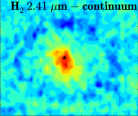
From the figure we note that the 2.12 m and 2.40m emission have a markedly different distribution compared to H. Most of the emission is concentrated to the center, which indicates that it is not affected by the X-ray heating from the ring collision, which dominates the H morphology (Larsson et al., 2011).
4. Origin of the H2 emission
4.1. Spectral modeling
To check that the identification of the lines with H2 is consistent with wavelengths and expected relative fluxes, as well as the presence of other lines in this spectral window, we have calculated synthetic spectra for different assumptions for the H2 excitation. Because the temperature in the H rich gas in the SN core is K (Jerkstrand et al., 2011; Kamenetzky et al., 2013) thermal excitations of the vibrational levels are likely to be unimportant. The remaining possibilities are excitation by non-thermal electrons or alternatively by UV fluorescence. Both these processes can lead to ionization or photodissociation of the H2. Reformation of the molecule will then lead to vibrational-rotational excitation. Black & Dalgarno (1976), however, argue that fluorescence should be more efficient, unless the UV flux is heavily absorbed.
There are two sources of non-thermal electrons in the ejecta. The 44Ti decay, which dominates the radioactive input (Jerkstrand et al., 2011; Boggs et al., 2015), produces positrons, which results in a cascade of non-thermal electrons with energies eV. Whether the positrons will reach the H rich blobs of the ejecta depends on the magnetic field. Coulomb collisions alone cannot trap them in the iron rich regions where the positrons are created (Jerkstrand et al., 2011), but even a weak field decreases the mean free path dramatically. It is, however, conceivable that a fraction of the positrons may escape the 44Ti sites and may then ionize and excite the H rich parts of the core. The other source of fast electrons may be X-rays from the interaction with the ring. The evolution of the optical flux from the ejecta is now dominated by these X-rays (Larsson et al., 2011). When absorbed these give rise to fast electrons, and a similar cascade of non-thermal electrons as the positrons (Fransson et al., 2013). A similar scenario has been advocated by Richardson et al. (2013) for the H2 emission in the Crab nebula. The presence of a pulsar generating the relativistic particles makes, however, the situation different from the ejecta in SN 1987A.
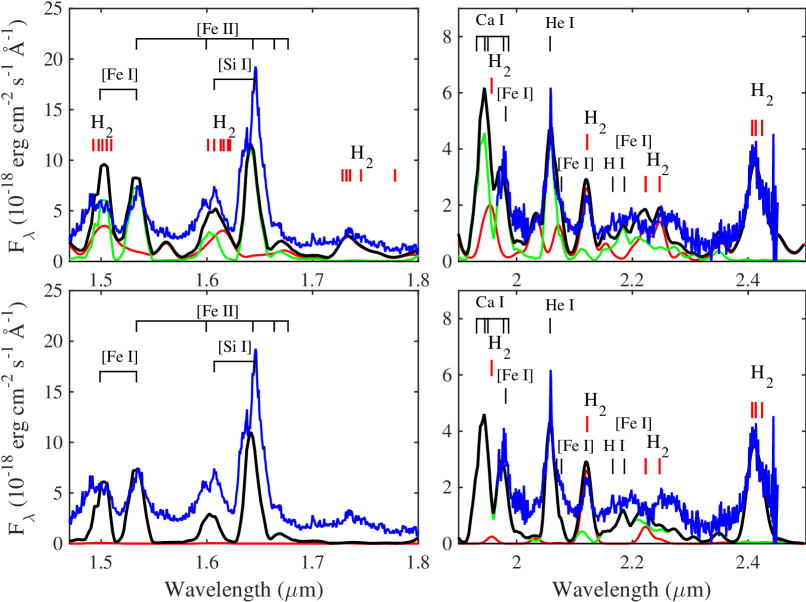
To test the non-thermal electron scenario we use the relative fluxes calculated by Gredel & Dalgarno (1995, their Table 4). Note that the relative strengths of the lines depend on the rotational temperature of the ground state levels, as well as the degree of ionization. The calculation referred to assumes a temperature of 300 K for the ground state populations and an electron energy of 30 eV. We have then normalized the line fluxes to that of the 2.122m line. To approximately include the atomic lines we have also added the 44Ti powered ejecta spectrum from Kjær et al. (2010), scaled to the extraction aperture we use (Fig. 3).
There may also be a weak continuum contribution. Synchrotron emission from the ring is observed at radio wavelengths with a spectrum mJy (Indebetouw et al., 2014). Extrapolating to 2.2 m gives a flux of . A minor fraction from high latitude emission above the ring plane could therefore contribute to the NIR continuum, unless synchrotron cooling would steepen the spectrum. Dust emission from ultra-small grains could also contribute. From ALMA observations we know there is a strong source of dust emission in the core of the SN (Matsuura et al., 2015) with a temperature of K. Sarangi & Cherchneff (2015) find that the size distribution of grains ranges from Å to micron sized grains. Ultra-small grains will be transiently heated by UV photons to very high temperatures (e.g., Draine, 2011) and emit their radiation in the mid- to NIR. While the absolute line fluxes depend on the continuum level, our qualitative results for the spectral models are not sensitive to these assumptions. Because of the uncertainty we have not included this component.
The line profiles are assumed to be Gaussian with FWHM , the same as that found for the CO lines (Kamenetzky et al., 2013). We concentrate here on the co-added H- and K-band spectra from 2005 and 2007 which have the best S/N . In the lower panel of Fig. 3 we show these spectra together with the synthetic spectrum.
UV fluorescence from the H2 ground state requires photons between 912 Å and 1108 Å, which may be created internally in the ejecta (Sect. 5), or alternatively from the ring collision. Ly is strong from the ring (France et al., 2011) and resonance fluorescence from the H2 levels (Shull, 1978) may be possible. This process, however, requires either a temperature of K or a sufficiently strong UV field for a significant population of this level. Between 912 Å and Å little is known about the flux from the ring.
For the UV fluorescence model we have taken the relative H2 line strengths from Model 14 of Black & van Dishoeck (1987) and again scaled this to the 2.122m flux. The relative line strengths are not very sensitive to the specific shape of the spectrum in the far-UV or to the density as long as this is .
Comparing the two models, the relative flux of the 2.122m and the 2.40m lines is similar and close to the observed ratio, especially considering the uncertain continuum level. This, together with the good fit of the line profiles, confirms the H2 line identifications. Note also the absence of atomic lines at both these wavelengths.
The main difference between the two models is the near absence of excitations to in the non-thermal model. In the K-band Gredel & Dalgarno (1995) find the the (2,1)S(1) 2.248m/(1,0)S(1) 2.122m ratio to be 0.54 the UV dominated case, compared to 0.06 in the non-thermal electron case. From Fig. 3 we see that the 2.248m and 2.223m lines give a better fit to the feature at m for the UV fluorescence model. According to this model weaker lines at 1.953, 2.034, 2.071, 2.351m may also be present in the observations. Although the H-band is more crowded, we note that there is in the UV model a line feature at 1.74m which does not coincide with any line included in the atomic model and coincides with a blend of comparatively strong H2 lines between m. Also H2 lines at 1.50 and 1.62 m may possibly be present. The models in Fig. 3 therefore favour the UV excitation model. This conclusion is, however, fairly marginal, given the S/N level of the spectrum and uncertainties in both the H2 and atomic line fluxes.
From the line fits we estimate the total luminosity in the 2014 (day 10,120) spectrum of the 2.40m H2 lines to and of the 2.122m line to . This should be compared to the total input from positrons which is , or of the bolometric luminosity (Larsson et al., 2011). For the non-thermal electron case Gredel & Dalgarno (1995) finds that of the H2 emission is in the 1.95 - 2.45 m range, while in the UV fluorescence case 15 % is in this range. The total energy required for the IR H2 lines is therefore and , respectively.
4.2. Time evolution
A distinguishing factor between the two different sources of energy for the H2 emission, either from the radioactive decay of 44Ti in the ejecta or from an external UV or X-ray flux from the ring collision, is the time evolution. From day 6500 to 9200 both the soft and hard X-ray flux from the ring increased by a factor of (Helder et al., 2013). If the excitation is connected to the external X-ray or UV flux we expect the H2 emission to increase by a substantial factor, while the energy input by 44Ti is expected to decrease slowly.
A complication when measuring the flux evolution is the strong and wavelength dependent ‘continuum’ level, which most likely is a blend of weak lines and true continuum (e.g., Fig. 3). This makes absolute measurements of the fluxes difficult and prone to systematic errors. Using the same prescription for the continuum level the trends should, however, not be affected. For the ’continuum’ we use the average flux between m for the He I and the H2 2.122 m lines and the m range for the H2 2.40 m blend, which are chosen to be reasonably free of other emission lines. To minimize any remaining contribution from scattered emission from the ring to the He I line we exclude for this line the central part within in the flux measurement.
From Table 2 we conclude that the H2 2.40 m luminosity is nearly constant within the statistical errors, which we estimate to , while the He I line shows an increase by a factor of from day 6832 to 10,120. The low H2 2.122 m flux makes it difficult to draw any firm conclusion from this, although it is consistent with a constant flux within the errors. Note that these luminosities are likely to be systematically underestimated by a considerable factor, as is e.g., seen from the models in Fig. 3. The absolute luminosities given in Sect. 3 are probably more accurate. Here we are more concerned with the time evolution, without making assumptions about the excitation mechanism.
| Epoch | H2 2.122 m | H2 2.40 m | He I 2.058 m |
|---|---|---|---|
| 6832 | 0.37 | 3.11 | 1.10 |
| 7606 | 0.45 | 2.88 | 1.35 |
| 8694 | 0.57 | 3.32 | 1.59 |
| 10,120 | 0.64 | 3.45 | 2.54 |
The nearly constant H2 luminosities indicate that these lines are powered by the 44Ti decay, either through the UV generated in the ejecta or possibly through leaking positrons. Gamma-rays from the 44Ti decay gives an input decreasing with time as . They, however, only contribute marginally to the H2 luminosity.
5. Discussion and conclusions
Summarizing, we find that the spectrum marginally favours the UV fluorescence model and that it is powered by the 44Ti decay. These may together be realized if the excitation is dominated by diffuse internal UV radiation in the ejecta.
The H2 emission is concentrated to the core, as is the case for the [Si I]/[Fe II] 1.644m line (Fig. 2). This result is consistent with the absence of time evolution. The presence of H2 in the core is also consistent with the H profile from early observations, which was seen down to (Kozma & Fransson, 1998). Outside the core the UV and X-ray emission from the ring collision may dissociate the H2, while these X-rays are responsible for most of the H emission, resulting in the ’horse-shoe’ shape in Fig. 2. The core itself is largely shielded from X-rays by the high metallicity (Fransson et al., 2013). Also the UV from the ring may be absorbed at energies higher than the C I photoelectric threshold at 11.2 eV ( Å), depending on the covering factor of the C rich regions relative to the H rich in the core.
The UV excitation scenario requires an internally generated UV field, like the He I two-photon continuum, as proposed by CMC (see also Jerkstrand et al., 2011). CMC also point out that the total opacity of the H rich region in the range Å should be dominated by resonance scattering in the Lyman and Werner bands of H2, converting the radiation in this region into fluorescence lines between 1400 Å and Å. Sternberg (1989) has calculated this in detail, based on an ISM-like UV spectrum. Of particular interest is the strong blend of lines at 1590-1610 Å, which also stands out in the simulations of CMC. In the COS spectrum by France et al. (2011) there is indeed a weak feature at this wavelength. The spectrum is, however, complex and the significance of this feature is marginal.
Most of the H2 formation in the CMC models took place before days after explosion. NIR observations between days 377 to 1114 (Meikle et al., 1993) showed a weak feature which they proposed could be due to the 2.122m line., but noted that this could be due to [Fe II] 2.133 m. In the spectra before 600 days this feature was much stronger than in the models by CMC, while at later epochs it was consistent with the models. The observations of Meikle et al. (1993) did not show the 2.40m line, so no definite conclusion could be drawn.
Other H2 lines expected in the UV case include blends at 1.24, 1.31, and 1.40 m. The J-band is, however, more crowded than the K-band and has a lower S/N and Strehl ratio and is therefore here not shown. The lowest excitation lines of H2 at 28.211m and 17.030m are expected to have fluxes and times the 2.122m line, respectively.
Finally, the fact that the He I line shows an increase similar to H (Fransson et al., 2013) implies that at least part of this emission should be affected by the X-ray input from the ring collision. This is somewhat surprising, given the similar distribution of this emission to that of H2 (Fig. 2). The He I emission, however, has contributions both from the H, He and Fe/He zones (Kjær et al., 2010). The Fe/He component, together with the mixed-in H- and He-rich material in the core, may therefore explain the centrally peaked He I emission, while the former two components in the envelope may be responsible for the luminosity increase, which is mainly seen in the line wings, as for H (Larsson et al., 2016).
In conclusion, the discovery of H2 in SN 1987A adds a new and important diagnostic of the conditions in the ejecta and may, together with observations with ALMA, provide new insight into the chemistry of the H rich regions of the core (e.g., Cherchneff & Dwek, 2009).
References
- Aitken et al. (1988) Aitken, D. K., Smith, C. H., James, S. D., et al. 1988, MNRAS, 235, 19P
- Black & Dalgarno (1976) Black, J. H., & Dalgarno, A. 1976, ApJ, 203, 132
- Black & van Dishoeck (1987) Black, J. H., & van Dishoeck, E. F. 1987, ApJ, 322, 412
- Bonnet et al. (2004) Bonnet, H., Abuter, R., Baker, A., et al. 2004, The Messenger, 117, 17
- Boggs et al. (2015) Boggs, S. E., Harrison, F. A., Miyasaka, H., et al. 2015, Science, 348, 670
- Bouchet & Danziger (1993) Bouchet, P., & Danziger, I. J. 1993, A&A, 273, 451
- Cherchneff & Dwek (2009) Cherchneff, I., & Dwek, E. 2009, ApJ, 703, 642
- Culhane & McCray (1995) Culhane, M., & McCray, R. 1995, ApJ, 455, 335 (CMC)
- Draine (2011) Draine, B. T. 2011, Physics of the Interstellar and Intergalactic Medium by Bruce T. Draine. Princeton University Press, 2011. ISBN: 978-0-691-12214-4,
- Eisenhauer et al. (2003) Eisenhauer, F., Abuter, R., Bickert, K., et al. 2003, in Society of Photo-Optical Instrumentation Engineers (SPIE) Conference Series, Vol. 4841, Instrument Design and Performance for Optical/Infrared Ground-based Telescopes, ed. M. Iye & A. F. M. Moorwood, 1548–1561
- France et al. (2011) France, K., McCray, R., Penton, S. V., et al. 2011, ApJ, 743, 186
- Fransson et al. (2013) Fransson, C., Larsson, J., Spyromilio, J., et al. 2013, ApJ, 768, 88
- Graham et al. (1990) Graham, J. R., Wright, G. S., & Longmore, A. J. 1990, ApJ, 352, 172
- Gredel & Dalgarno (1995) Gredel, R., & Dalgarno, A. 1995, ApJ, 446, 852
- Helder et al. (2013) Helder, E. A., Broos, P. S., Dewey, D., et al. 2013, ApJ, 764, 11
- Indebetouw et al. (2014) Indebetouw, R., Matsuura, M., Dwek, E., et al. 2014, ApJ, 782, L2
- Jerkstrand et al. (2011) Jerkstrand, A., Fransson, C., & Kozma, C. 2011, A&A, 530, A45
- Kamenetzky et al. (2013) Kamenetzky, J., McCray, R., Indebetouw, R., et al. 2013, ApJ, 773, L34
- Kjær et al. (2007) Kjær, K., Leibundgut, B., Fransson, C., et al. 2007, A&A, 471, 617
- Kjær et al. (2010) Kjær, K., Leibundgut, B., Fransson, C., Jerkstrand, A., & Spyromilio, J. 2010, A&A, 517, A51
- Kozma & Fransson (1998) Kozma, C., & Fransson, C. 1998, ApJ, 496, 946
- Larsson et al. (2016) Larsson, J., Fransson, C., Spyromilio, J., et al. 2016, in preparation
- Larsson et al. (2011) Larsson, J., Fransson, C., Östlin, G., et al. 2011, Nature, 474, 484
- Larsson et al. (2013) Larsson, J., Fransson, C., Kjaer, K., et al. 2013, ApJ, 768, 89
- Liu & Dalgarno (1994) Liu, W., & Dalgarno, A. 1994, ApJ, 428, 769
- Liu et al. (1992) Liu, W., Dalgarno, A., & Lepp, S. 1992, ApJ, 396, 679
- Matsuura et al. (2015) Matsuura, M., Dwek, E., Barlow, M. J., et al. 2015, ApJ, 800, 50
- Meikle et al. (1993) Meikle, W. P. S., Spyromilio, J., Allen, D. A., Varani, G.-F., & Cumming, R. J. 1993, MNRAS, 261, 535
- Modigliani et al. (2007) Modigliani, A., Hummel, W., Abuter, R., et al. 2007, arXiv:astro-ph/0701297
- Richardson et al. (2013) Richardson, C. T., Baldwin, J. A., Ferland, G. J., et al. 2013, MNRAS, 430, 1257
- Roche et al. (1991) Roche, P. F., Aitken, D. K., & Smith, C. H. 1991, MNRAS, 252, 39P
- Sarangi & Cherchneff (2015) Sarangi, A., & Cherchneff, I. 2015, A&A, 575, A95
- Shull (1978) Shull, J. M. 1978, ApJ, 224, 841
- Spyromilio et al. (1988) Spyromilio, J., Meikle, W. P. S., Learner, R. C. M., & Allen, D. A. 1988, Nature, 334, 327
- Sternberg (1989) Sternberg, A. 1989, ApJ, 347, 863
- Utrobin & Chugai (2005) Utrobin, V. P., & Chugai, N. N. 2005, A&A, 441, 271