The ultraluminous X-ray source NGC 5643 ULX1: a large stellar mass black hole accreting at super-Eddington rates?
Abstract
A sub-set of the brightest ultraluminous X-ray sources (ULXs), with X-ray luminosities well above erg s-1, typically have energy spectra which can be well described as hard power-laws, and short-term variability in excess of . This combination of properties suggests that these ULXs may be some of the best candidates to host intermediate mass black holes (IMBHs), which would be accreting at sub-Eddington rates in the hard state seen in Galactic X-ray binaries. In this work, we present a temporal and spectral analysis of all of the available XMM-Newton data from one such ULX, the previously poorly studied 2XMM J143242.1440939, located in NGC 5643. We report that its high quality EPIC spectra can be better described by a broad, thermal component, such as an advection dominated disc or an optically thick Comptonising corona. In addition, we find a hint of a marginal change in the short-term variability which does not appear to be clearly related to the source unabsorbed luminosity. We discuss the implications of these results, excluding the possibility that the source may be host an IMBH in a low state, and favouring an interpretation in terms of super-Eddington accretion on to a black hole of stellar origin. The properties of NGC 5643 ULX1 allow us to associate this source to the population of the hard/ultraluminous ULX class.
keywords:
accretion, accretion discs – X-rays: binaries – X-Rays: galaxies – X-rays: individuals (NGC 5643 ULX1)1 Introduction
Ultraluminous X-ray Sources (ULXs) are extragalactic, point-like, non-nuclear sources that are characterised by isotropic X-ray luminosities greater than erg s-1 (e.g. Fabbiano 1989), which is close to the Eddington limit of a 10 M⊙ black hole (BH). Observational evidence strongly suggests that the majority of ULXs are accreting BH X-ray binaries (XRBs) with massive donors (e.g. Zampieri & Roberts 2009; Feng & Soria 2011; and references therein). Luminosities higher than 3 erg s-1 rule out Eddington limited accretion onto typical stellar-mass BHs (sMBHs, M⊙), and the non-nuclear locations of ULXs in their host galaxies rules out accretion on to supermassive BHs. Despite this, it has been proposed that ULXs may be powered by accretion on to either sMBHs (King et al. 2001) or massive stellar BHs formed in low-metallicity environments ( M⊙; Zampieri & Roberts 2009; Mapelli et al. 2009; Belczynski et al. 2010). Both of these scenarios would require that many ULXs must be accreting matter at or above the Eddington limit (e.g. Ohsuga & Mineshige, 2011), possibly with a degree of beaming further boosting their radiative emission (e.g. King et al. 2001; Begelman et al. 2006; Poutanen et al. 2007; King 2009). In at least two ULXs it has been possible to constrain the mass of the compact object to within the stellar-mass and massive stellar regimes (5–30 M⊙ in Liu et al. 2013 and 14 M⊙ in Motch et al. 2014), whilst in one other case the first robust evidence of a neutron star in a ULX has been reported (M82 X-2, Bachetti et al., 2014).
Amongst ULXs, those brighter than erg s-1 (e.g. HLX-1 in ESO 243-49; Farrell et al. 2009) are difficult to explain within this framework and are instead good candidates to host IMBHs ( M⊙; e.g. Colbert & Mushotzky 1999). These would be accreting in the canonical sub-Eddington regimes, which produce the observed states in Galactic XRBs (i.e. hard and soft states; e.g. McClintock & Remillard, 2006; Fender & Belloni, 2012). However, potential formation and feeding mechanisms of IMBHs are still a matter of debate. It has been suggested that they may originate from either the collapse of primordial Population III stars (Madau & Rees, 2001); the dynamical collapse of supermassive stars forming in the centre of very dense stellar super-clusters (Portegies Zwart et al., 2004); grow from sMBHs that undergo repeated mergers in a dense globular cluster (Miller & Hamilton, 2002); or via a merger with a dwarf galaxy that expelled a nuclear IMBH (Farrell et al., 2012; Mapelli et al., 2012). In all these scenarios ULX activity can only start after the capture of a massive star, able to provide the required mass transfer to power the extreme ULX luminosities (e.g. Hopman et al. 2004; Mapelli et al. 2011). Hence, identifying IMBHs is of crucial importance not only for simply proving their existence and assessing these formation scenarios, but also due to the likely implications for our understanding of the initial seeding and subsequent growth of nuclear BHs in galaxies (Volonteri, 2010).
High quality XMM-Newton X-ray spectra of ULXs with luminosities lower than erg s-1 show ubiquitous spectral curvature at moderately high energy ( keV, Stobbart et al. 2006; Gladstone et al. 2009), often coupled to a soft excess of keV. As these features are not commonly observed in Galactic XRBs, they imply a new spectral regime, which is usually referred to as the “ultraluminous state” (Roberts, 2007; Gladstone et al., 2009), and may be associated with super-Eddington accretion. A few luminous ULXs have very recently been observed with NuSTAR, resulting in spectra which demonstrate that the high energy curvature persists above 10 keV (Bachetti et al., 2013; Walton et al., 2013; Rana et al., 2014), confirming this result. The spectral curvature may arise either from Comptonisation in a cold, optically thick corona lying above an accretion disc (e.g. Stobbart et al. 2006; Gladstone et al. 2009); from a modified accretion disc, i.e. a slim disc (Mizuno et al., 2007); or the hot inner regions of the disc, which are highly distorted by advection, turbulence, self-heating and spin (Beloborodov, 1998; Suleimanov et al., 2002; Kawaguchi, 2003). The soft component is thought to originate from the photosphere of a radiatively-driven wind that is ejected from the spherization radius of the accretion disc down to its innermost regions, which is expected to occur at super-Eddington accretion rates (e.g. Shakura & Sunyaev 1973; Poutanen et al. 2007; Ohsuga & Mineshige 2007; Ohsuga et al. 2009). Partially-inhomogeneous winds in ULXs may explain the puzzling short-term variability reported in some ULXs (Heil et al., 2009), through a combination of inclination angle and accretion rate (e.g. Middleton et al. 2011; Takeuchi et al. 2013; Middleton et al. 2015). These same factors also determine the observed energy spectrum (e.g. Sutton et al., 2013; Pintore et al., 2014).
On the other hand, HLX-1 in ESO 243-49 (Farrell et al., 2009), which has a peak luminosity of erg s-1, is observed with a strikingly different set of properties than standard ULXs. It displays a spectral evolutionary pattern similar to that of the Galactic BH X-ray transients (e.g. McClintock & Remillard 2006; Fender & Belloni 2012), undergoing periodic outbursts (Godet et al., 2014; Webb et al., 2014) in which the source switches from a high luminosity soft state to a fainter hard state (Servillat et al., 2011). Multi-wavelength emission has been detected from HLX-1 as it undergoes this out-burst cycle. In particular, radio emission has been detected, which is associated with discrete jet ejection events (Webb et al., 2012), similar to those that have been observed during hard-to-soft state transitions state in Galactic BHs. By assuming that HLX-1 was in a similar state, the authors of that study were able to refine the BH mass estimates to M⊙. Other good IMBH candidates include: M82 X-1 (Feng et al., 2010), for which a BH mass of M⊙ has been suggested based on the tentative identification of twin-peak quasi periodic oscillations (Pasham et al., 2014); and an X-ray source in the galaxy NGC 2276 (Mezcua et al., 2015). Also, a sub-sample of moderately-high luminosity ULXs (5 erg s-1) show hard power-law like spectra, with no high energy turn-off and short-term variability at the level of (Sutton et al., 2012). These sources may possibly be IMBHs in a hard state, although their apparently flat spectral shape may simply be the result of poor counting statistics.


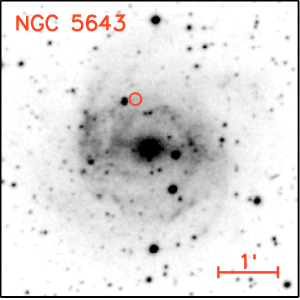
Walton et al. (2011) carried out a cross-correlation between the 2XMM-DR3 and the RC3 catalogues, revealing a number of new extreme ULXs ( erg s-1). The target of this study (2XMM J143242.1440939) is the nearest source from a preliminary extension of that work (Earnshaw et al. in prep.). 2XMM J143242.1440939 is located in NGC 5643, which is an SAB(rs)c galaxy with a low-luminosity Seyfert II nucleus and strong star formation in its spiral arms (Phillips et al., 1983). NGC 5643 is at a distance of Mpc (Tully & Fisher, 1988), and 2XMM J143242.1-440939 (hereafter, NGC 5643 ULX1) is located 0.8 arcminutes from its nucleus (Guainazzi et al. 2004; Figure 1). The observed peak X-ray luminosity of NGC 5643 ULX1 is erg s-1, although its historical flux record shows it has varied in luminosity by a factor of 3–4 (see the following sections). Recent X-ray observations with low counting statistics were consistent with it having a hard power-law continuum spectrum (, Guainazzi et al. 2004; Matt et al. 2013) and short-term fractional variability at the level of . In this work we perform a spectral and temporal analysis of all XMM-Newton observations of the source, including our new very long observation taken on August 28 2014. We make use of the high quality data from this XMM-Newton observation ( ks) to test whether we can rule out either sub- or super-Eddington accretion in NGC 5643 ULX1. Besides the ULX, NGC 5643 hosts also an AGN (Guainazzi et al., 2004; Bianchi et al., 2006; Annuar et al., 2015). Results of the spectral analysis of the AGN are also briefly reported in and discussed in Appendix A.
The paper is structured as follows: in Section 2 we summarize the data selection and reduction procedures, in Section 3 we present the results of our timing and spectral analysis of NGC 5643 ULX1, and in Section 4 we discuss the implications of these.
| No. | Obs.ID. | Date | Exp. | Net Exp. a | Counts |
|---|---|---|---|---|---|
| (ks) | (ks) | ||||
| 1 | 0140950101 | 2003/02/08 | 9.7 | 9.4 | 1480b |
| 2 | 0601420101 | 2009/07/26 | 54.5 | 12.0 | 690c |
| 3 | 0744050101 | 2014/08/28 | 116.9 | 104.0 | 20466b |
a Net exposure time after removing high energy particle contamination; b total number of EPIC-pn counts; c total number of EPIC-MOS counts.
2 Data Reduction
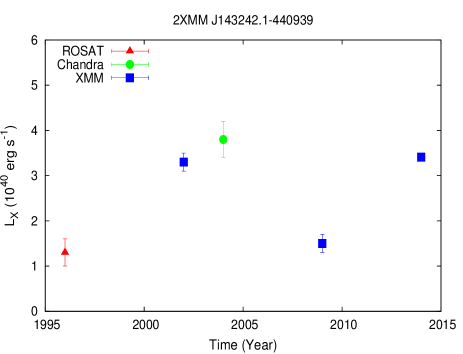
NGC 5643 ULX1 was observed once with both the ROSAT (August 28 1997) and Chandra (December 26 2004) satellites, and three times with XMM-Newton (see log in Table 1). In this work we mainly focus on the XMM-Newton observations, but also briefly consider the Chandra data. The ROSAT dataset was largely excluded, as it was taken with the HRI detector, which has negligible energy resolution.
The Chandra observation was reduced using the ciao v.4.6 software adopting the standard procedures. In order to verify the point-like nature of NGC 5643 ULX1, we used chart and marx data analysis software to simulate the PSF for the observation at the source position. We used ten times the real exposure time to better sample the PSF. The ciao tool srcextent was used to confirm that the source is not extended at 90 confidence. However, we found that the Chandra data were affected by pile-up (estimated with the ciao v.4.6 software) and the data quality and spectral properties of NGC 5643 ULX1 were comparable to that of the XMM-Newton observation 2, thus do not provide significant additional information. Therefore, in the rest of this work we focus mainly on the XMM-Newton data. The observed ROSAT and Chandra count rates are used only to estimate the unabsorbed luminosity, assuming a power-law spectral shape with photon index of 1.7 as was found from the low quality XMM-Newton data (see below).
We carried out a spectral and temporal analysis on all the available XMM-Newton observations (Table 1), which were taken in Imaging mode, of NGC 5643 ULX1. The data sets were reduced using SAS v. 13.5.0 and the most recent EPIC calibrations. After selecting good time intervals free of background flares, we extracted spectra and lightcurves from events with pattern for EPIC-pn (which allows for single and double pixel events) and pattern for EPIC-MOS (which allows for single, double, triple and quadruple pixel events). We set ‘flag=0’ in order to exclude bad pixels and events coming from the CCD edges. EPIC-MOS and pn source and background spectra were extracted from 20” radius circular regions (the latter on the same CCD where the source is located and far from the read-out node). These were chosen to be smaller than is typically used for XMM-Newton data in order to reduce contamination by the nucleus of NGC 5643, which is located ′′ from the ULX. Finally, we note that, in observation 2, NGC 5643 ULX1 was on a CCD gap of the EPIC-pn instrument, as such we only analysed the EPIC-MOS data.
All of the extracted spectra were rebinned such that they had at least 25 counts per bin so that they could be analysed using the statistic. Spectral fitting was performed using XSPEC v.12.8.2 (Arnaud, 1996). For each observation, we fitted the EPIC-pn (except for observation 2) and both EPIC-MOS spectra simultaneously in the 0.3–10 keV energy range. In all fits, a multiplicative constant was used to account for residual calibration differences between the three instruments. The constant was fixed to 1 for EPIC-pn and allowed to vary for the EPIC-MOS spectra. In the case of observation 2, we fixed the constant to 1 of the EPIC-MOS1 spectrum. In general, the differences among the three instruments were less than 5.
3 Analysis of the ULX
3.1 High quality data
3.1.1 Timing analysis
We start by reporting results from observation 3, as it has the best quality data. This observation caught NGC 5643 ULX1 in a constant flux state, with an average count rate in the EPIC-pn instrument of cts s-1 (Figure 2-bottom).
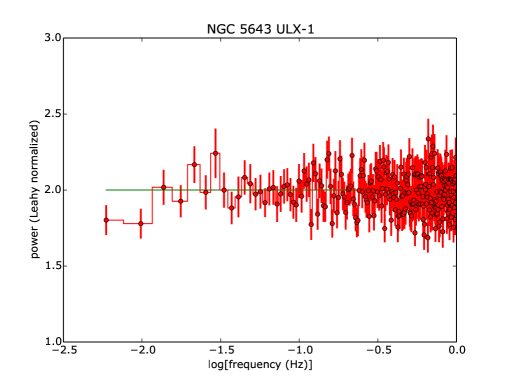
To check for short-term variability, we calculated the EPIC-pn power spectral density (PSD) on the timescale of the longest continuous segment in this observation (77 ks). There were no significant features in the PSD, indicating that the variability was consistent with white noise. The upper limit to root mean square (rms) variability of periodic signals in excess of the white noise, in the frequency range Hz, was 4.3 at the 90 per cent confidence level (c.l.). The confidence levels refers to the probability (expressed in terms of the Gaussian probability distribution) that the variability of a signal is lower than the reported threshold (see van der Klis 1994). We also calculated PSDs in the –1 Hz frequency range, which were averaged over 10 intervals and linearly rebinned in frequency to 32 bins (Figure 3). Again, no significant variability was detected above the Poisson noise. We calculated the upper limit to the rms of the signal in the frequency range Hz to be 10.4 at the 90.0 % c.l..
Finally, because no short-term variability was detected above the Poisson noise, we also estimated the 3 upper limit on the rms fractional variability (e.g. Vaughan et al., 2003) to be 9%, in the timescale 100s–77ks. For a direct comparison with observation 1 (see section 3.2), we also estimated the rms fractional variability on timescales 100s-8000s, finding a 3 upper limit of .
| Model | a | b,c | e | g,h | i | [0.3-10 keV] k | l | |||
| ( cm2) | (keV) | (keV) | ( erg s-1) | |||||||
| Observation 1 | ||||||||||
| powerlaw | - | - | - | - | - | 1.8 | 102.46/93 | |||
| diskbb | - | - | - | - | - | [137.84/93] | ||||
| diskpbb | 0.56 | - | - | - | - | 100.86/92 | ||||
| Observation 2 | ||||||||||
| powerlaw | - | - | - | - | - | 0.80 | 21.65/22 | |||
| diskbb | - | - | - | - | - | [50.99/22] | ||||
| diskpbb | 0.53 | - | - | - | - | 21.18/21 | ||||
| Observation 3 | ||||||||||
| powerlaw | - | - | - | - | - | 1.92 | 1001.86/936 | |||
| diskbb | - | - | - | - | - | [1220.74/936] | ||||
| diskbb+powerlaw | - | - | - | 2.23 | 981.16/934 | |||||
| powerlaw+diskbb | - | - | - | 1.2 | 884.41/934 | |||||
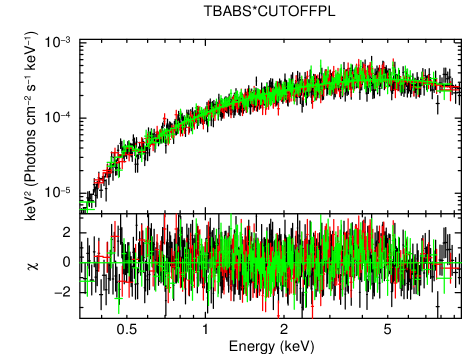
| cut-off powerlaw | - | - | - | 5.4 | - | 1.81 | 892.41/935 | |||
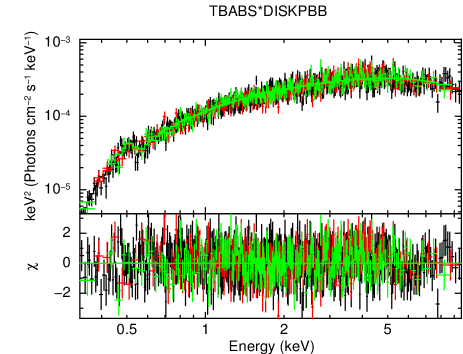
| diskpbb | 0.60 | - | - | - | - | 886.13/935 | ||||
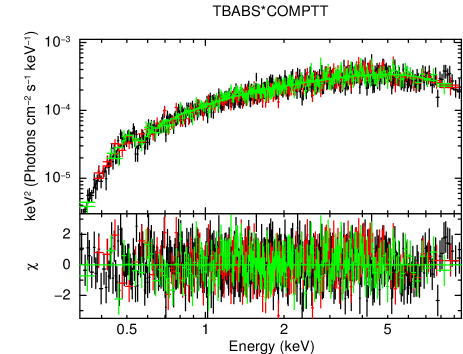
| comptt | - | - | - | 3.8 | 877.57/934 | |||||
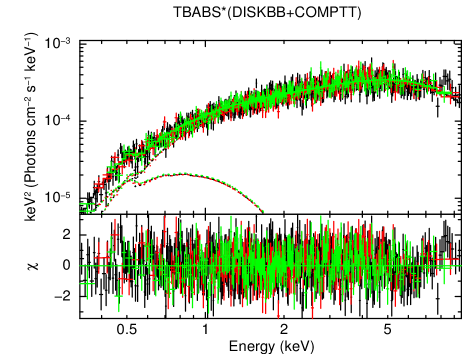
| diskbb+comptt | - | 1.0 | - | 2.1 | 875.41/933 |
a Intrinsic column density in excess to the Galactic one; b inner disc temperature; c seed photons temperature for Comptonisation; d exponent of the radial dependence of the disc temperature; e normalisation of the disc component; f photon index of the powerlaw component; g electron temperature of the corona; h e-folding energy of the cutoffpl model; i optical depth of the corona; j normalisation of the comptt or powerlaw component; k unabsorbed total X-ray luminosity in the 0.3–10 keV energy band assuming a distance of 16.9 Mpc; l reduced ; square brackets indicate that the fit is not statistically acceptable.
3.1.2 Spectral analysis
The first stage of our spectral analysis was to look for short-term spectral variability during the long observation. We extracted light curves with 500s binning in the 0.3–1.5 and 1.5–10 keV energy ranges, which were selected such that there were similar count rates in each band. The ratios of the corresponding light curves are consistent with being constant () at 3 significance. As such, we analyse the time-averaged X-ray spectrum from the entire observation.
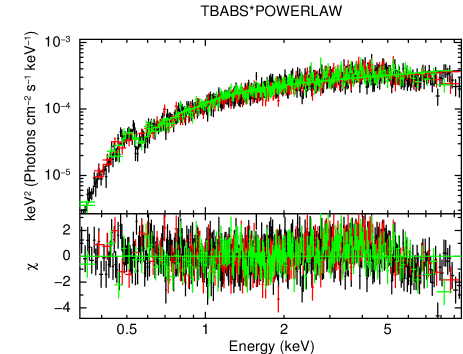
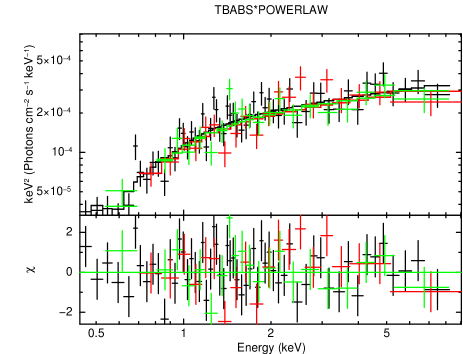
We initially fitted the EPIC-pn and EPIC-MOS spectra with a power-law absorbed by neutral material. We considered two neutral absorbers (modeled with tbabs in XSPEC), one fixed to the Galactic value in the direction of the ULX ( cm-2; Kalberla et al., 2005), and the other free to vary to model absorption close to the ULX. Although this resulted in a statistically acceptable fit ( of 1002 for 936 degrees of freedom, with parameters given in Table 2), the power-law model resulted in hard residuals. Using the cflux convolution pseudo-model we estimated the unabsorbed X-ray luminosity to be erg s-1 (for a distance of 16.9 Mpc). The large fit statistic is mainly due to a clear roll-over at energies higher than 5 keV that cannot be reproduced by a power-law (see the residuals in Figure 4-top-left). To test the statistical significance of the high energy roll-over we followed the method of Stobbart et al. (2006), and compared a power-law and a broken power-law (bknpower in xspec) model fitted to the keV spectra. We found that a bknpower fit with the two photon indexes tied together is statistically acceptable (/dof = 506.31/423) but a significant improvement in the fit ( = 103.54 for 2 additional dof) is found by allowing them to vary. The broken power-law fit provided a clearly superior description, with a F-test probability of that the improvement was due to a random fluctuations in an intrinsic power-law spectrum.
In the sub-Eddington hard state XRBs exhibit both high levels of short-term variability (larger than 10) and a hard power-law spectrum (e.g. McClintock & Remillard, 2006). As such, the detection of a high energy break and the absence of short term variability allow us to robustly conclude that NGC 5643 ULX1 was not in the sub-Eddington hard state during observation 3. To test whether it may have been in the sub-Eddington soft state we also fitted the spectra with an absorbed multicolour disc (diskbb; Mitsuda et al. 1984), finding that this resulted in a statistically poorer fit than the power-law (). This excludes the possibility that ULX1 was in the sub-Eddington soft state.
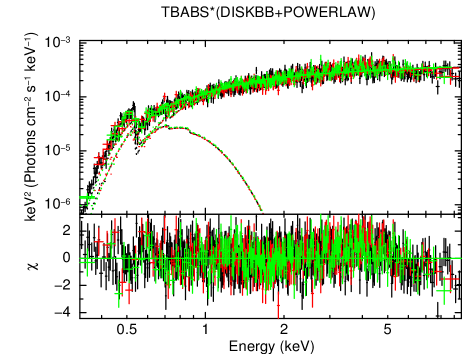
Next, we considered a multicolour disc added to the power-law model. Adopting this two-component model, we found a good fit with a hot disc ( keV) with the power-law dominating at low energies ( for 2 additional dof with respect to a single power-law; see Table 2). Additionally, a cool disc ( keV) and a powerlaw results in an improved fit over a power-law alone, although this is at lower significance than the hot disc ( for 2 additional dof, /dof). Although this is statistically acceptable, residuals can be clearly seen at energies keV (Figure 4-top-right). Furthermore, when combined with the cool disc the power-law has a photon index of , which is inconsistent with the steep powerlaw state seen in Galactic BHs ().
Based on the spectral analysis of observation 3, we are able to conclude that NGC 5643 ULX1 was not in any of the canonical sub-Eddington spectral states seen in Galactic BHs. Hence, based on the assumption that sub-Eddington IMBHs would be in the same accretion states as Galactic XRBs (albeit with some rescaling to account for the BH mass), we may strongly rule-out the possibility that NGC 5643 ULX1 contains an IMBH. Furthermore, the degeneracy between hot and cool accretion discs when fitting the spectra with the two-component multicolour disc plus power-law model is not unusual in ULXs and it has been investigated in the past (e.g. Stobbart et al., 2006). Therefore, the spectral properties of NGC 5643 ULX1 appear to be consistent with the standard ULX population. As such, we attempted to classify NGC 5643 ULX1 using the multicolour disc plus power-law model, according to the scheme proposed by Sutton et al. (2013). Since we found two statistical minima for this model (i.e. a hot or a cold disc model), we may classify the source as being in either the broadened-disc state or the hard-ultraluminous state. However, the minimum with a hot disc was statistically preferable, suggesting that NGC 5643 ULX1 is best classified as a broadened-disc source (although see Section 4 for caveats with this interpretation).
To further investigate the spectral properties of the source, particularly the high energy cut-off, we adopted several more spectral models. The first of these was a single power-law with an exponential cut-off (cutoffpl in xspec). This model strongly improved the fit statistic compared to the standard power-law ( for 1 additional dof, Figure 4-centre-left) and strongly reduced the high energy residuals. The best fitting model parameters were an intrinsic neutral hydrogen column density of 4 cm-2 and a power-law photon index of 1.1, which broke at keV. Similar fits are not unusual for ULXs (e.g. Gladstone et al., 2009). However, this model is phenomenological. In terms of more physical models, the spectrum of NGC 5643 ULX1 can be well described by both an advection-dominated slim disc (diskpbb111This model describes a modified accretion disc with ( is the disc radius), with corresponding to a standard (Shakura & Sunyaev, 1973) disc, and to an advection dominated slim disc (e.g. Kawaguchi, 2003).; e.g. Mineshige et al. 1994) and a Comptonisation model (comptt; Titarchuk 1994). Both models are statistically acceptable (see Table 2) and show that a broad, thermal-like component was a good description of the entire 0.3–10 keV spectrum.
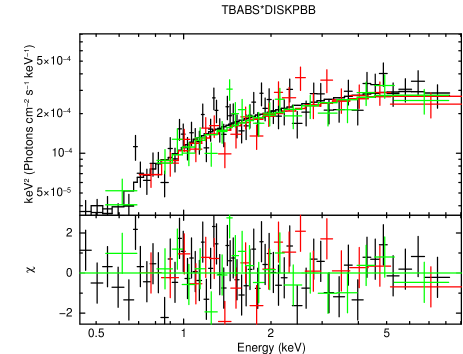
The best fitting parameters for the diskpbb model gave an intrinsic neutral column density of cm-2 and a disc temperature of 2.6 keV. However, this temperature is clearly high and unusual with respect to those observed in Galactic BHs (McClintock & Remillard, 2006). Additionally, the value of the p parameter suggests that the disc has to be significantly advection dominated (p=) and hence that the accretion rate in the disc is likely super-Eddington. From this model we infer a 0.3–10 keV unabsorbed luminosity of erg s-1 (flux of erg s-1 cm-2). Alternatively, the Comptonisation model resulted in a column density of cm-2 (consistent with the previous model within the uncertainties) and corresponded to a cold, optically thick corona ( and kT keV), fed by seed photons with a temperature of 0.1 keV. The estimated unabsorbed luminosity is consistent with that found with the diskpbb model. We note that a few 0.3–10 keV spectra of high luminosity ULXs ( erg s-1) can be also described by only a single component model, such as Comptoniation or an advection dominated disc (e.g. IC 342 X-1, Gladstone et al. 2009, although see Sutton et al. 2013 for caveats about this interpretation).
It has been suggested that the hard spectral component observed in ULXs may originate from an optically thick corona above the accretion disc, or from the inner disc itself (e.g. Stobbart et al., 2006; Gladstone et al., 2009). High quality X-ray spectra of luminous ULXs can often be well-fitted by a two-component model consisting of Comptonisation and another soft component. Here, the soft component is associated with an optically thick wind ejected by the disc when the accretion rate locally exceeds the Eddington limit (e.g. Poutanen et al., 2007; Ohsuga et al., 2009; Takeuchi et al., 2014). The Comptonisation component originates from the hot, inner accretion disc (e.g. Middleton et al., 2011; Kajava et al., 2012; Middleton et al., 2015). However, if both components are present in NGC 5643 ULX1 and the inclination angle is suitable (see e.g. Middleton et al. 2015), then we would expect to observe both of these features in its spectrum. Hence, although it is not required by the data, we tentatively added a multicolour disc component to the Comptonisation model. This does not result in a statistically significant improvement ( 2 for 2 additional dof), and the parameters of the corona are consistent with those derived from the single component model. However, the temperature of the soft component ( keV) is in line with what found in many other ULXs (e.g. Stobbart et al., 2006; Gladstone et al., 2009; Sutton et al., 2013; Pintore et al., 2014; Middleton et al., 2014; Walton et al., 2013; Bachetti et al., 2014). We note instead that the column density is poorly constrained and that the soft component is very weak and represents only a marginal fraction of the total flux ().
Finally, we highlight that irrespective of the adopted model, small structured residuals are still observed at the energies of 6–7 keV and 8 keV. The former is probably caused by a small, residual contamination from the nearby AGN (which has a strong iron emission complex; see Appendix A) in both source spectrum and background.
3.2 Low quality data
The spectra extracted from observations 1 and 2 have only moderate numbers of counts in comparison to observation 3. They can only be used to constrain simple models, and do not provide any further significant evidence for high energy spectral curvature.
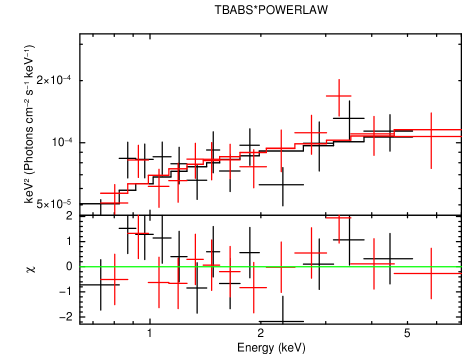
The energy spectrum extracted from observation 1 can be well described by either an absorbed power-law (dof=102.46/93) or a diskpbb (dof=100.86/92; see Table 2 and Figure 5-top), although a multicolour disc is statistically rejected at 3 significance (dof=137.84/93). A Comptonisation model provides an adequate fit to the data (dof=100.76/98), but most of the spectral parameters (column density, electron temperature and seed photons temperature) are unconstrained. The single powerlaw results in a photon index of 1.7, and a neutral column of cm-2. The diskpbb model indicates a very hot inner disc temperature ( keV), which is consistent with that found for observation 3. Similarly, the -index () suggests an advection dominated disc, indicating that the source is accreting at above the Eddington limit. Finally, both the neutral absorption ( cm-2) and unabsorbed luminosity ( erg s-1) are consistent with observation 3.
Observation 1 did not contain sufficient counts to calculate a meaningful PDS, although we were able to calculate the rms fractional variability. This was done in the time domain, with lightcurves binned to 100 s in order to accrue sufficient counts in each bin. We estimated the 0.3–10 keV fractional variability to be (on timescales of 100s–8000s, i.e. where the duration of 8000s refers to the longest continuous segment of the observation). This value is higher than the upper-limit from observation 3 but they are both consistent within the 3 uncertainties. Furthermore, despite the poor quality data of observation 1, the fluxes of observations 1 and 3 appear to be comparable (Figure 2-top-left) and their spectra broadly similar.
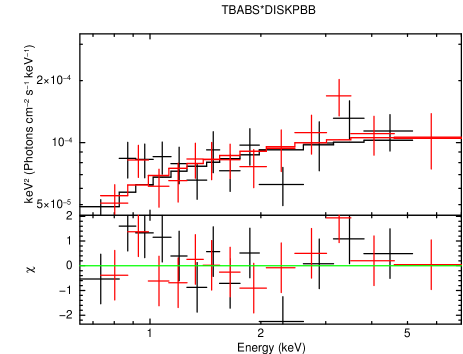
The observation 2 spectrum (Figure 2-top-right) is also well fitted by a single absorbed power-law model (dof=21.65/22; , N cm-2). This has an unabsorbed luminosity of erg s-1, hence represents a significant drop in flux from the other observations. Again, the spectrum can also be well fitted by a diskpbb (dof=21.18/21; see Table 2 and Figure 5-bottom), although some of the parameters are poorly constrained. As with observation 1, a multicolour disc can be strongly rejected (dof=50.99/22). For completeness, we also investigated whether the change in luminosity could be dependent on the column density. To test this, we adopted the diskpbb model and fixed N to cm-2 (i.e. the best fit value of the diskpbb model when fitted to the spectrum from observations 3). This test confirmed that the factor of 2-3 luminosity variability was not driven by changes in the absorption column. By stacking the MOS1 and MOS2 lightcurves we were only able to place an upper limit on the 0.3–10 keV rms fractional variability (on timescales 100s–12800s) of (estimated with the ftools lcstats).
We followed two approaches to test where the observation 1 and 2 spectra were consistent with that from observation 3. Firstly, we simultaneously fitted the EPIC-pn (where available) and EPIC-MOS spectra from all three of the observations with either a diskpbb or a comptt model. The spectral parameters were fixed to the best-fitting values from observation 3, and only normalisation was free to vary between the observations. This resulted in a statistically acceptable fit (dof=623.49/637), strongly indicating that the spectral properties of the ULX remained unchanged between the observations. In addition, we note that the normalisation of the model in observations 2 is, as previously found, more than a factor of 2 lower than those in observation 1 and 3, confirming the existence of flux variability between the datasets. The second approach was to create a simulated spectrum based on the parameters of the best-fitting model from observation 3. The simulated exposure time was chosen such that it was comparable to observations 1 and 2. The spectrum was then fitted with an absorbed power-law, obtaining a statistically acceptable fit, with a spectral index that was indistinguishable from observations 1 and 2 (1.7). Based on both of these tests we can conclude that the the source does not display long-term spectral variability, despite changing in its X-ray luminosity.
4 Discussion
NGC 5643 ULX1 is a luminous ULX that is associated with the galaxy NGC 5643, which is at a distance at 16.9 Mpc. The source was initially identified using ROSAT/HRI data (Guainazzi et al., 2004) at a luminosity of erg s-1. It was subsequently detected by Chandra and XMM-Newton with luminosities of 1–4 erg s-1, indicating the ULX exhibited long-term flux variability up to a factor of 2–3 (Figure 6). We note that it is unlikely that this object is a background quasi-stellar object (QSO) as it does not have any detected optical counterpart in the DSS (down to ), in a short VLT/FORS1 exposure (down to a comparable magnitude). An optical counterpart would likely be detected in these observations if the source were a QSO with an observed X-ray flux of erg cm-2 s-1 (0.3–10 keV). We can place a lower-limit on the (0.3–3.5 keV) X-ray to optical flux ratio of 15, which is above the typical range of seen in most AGNs (0.1-10; e.g. Maccacaro et al. 1988). This is further supported by the lack of a detection of any potential counterpart to the ULX in infrared 2MASS and WISE images of the field.
NGC 5643 ULX1 was considered an intriguing source because, in low quality data, it appeared to show X-ray properties reminiscent of an IMBH accreting at sub-Eddington rates. Here we instead report that during a long XMM-Newton observation, the ULX had a spectrum which could be well modelled either in terms of a cold, optically thick Comptonizing corona or a very hot (2.5–3 keV), advection dominated disc. The high energy roll-over was further confirmed by a NuSTAR observation of the source (Annuar et al., 2015), indicating that the spectral shape of NGC 5643 ULX1 was more complex than the single powerlaw as found in low-quality data. Furthermore, it is important to note that we observed a change in luminosity of a factor of 2–3 between the observations, without significant spectral changes.
It is worth-noting that for most of the ULX population, the X-ray data are of poor quality and the paucity of the counting statistics can lead to an incorrect or uncertain interpretation of their nature. This was the case of NGC 5643 ULX1. The properties showed by NGC 5643 ULX1 are not unusual for the ULXs. Indeed, a number of other ULXs showed similar degeneracies between spectral shape, luminosity and short-term variability when comparing low and high quality data, and it has been proposed that these ULXs may be sMBHs or massive stellar BHs accreting at super-Eddington rates (e.g. Stobbart et al., 2006; Roberts, 2007; Gladstone et al., 2009; Heil et al., 2009; Middleton et al., 2011; Sutton et al., 2013; Pintore et al., 2014; Middleton et al., 2015). If the power-law-dominated spectra of NGC 5643 ULX1 are indeed simply due to the poor data quality and the intrinsic spectra are actually similar to the highest quality observation, then the marginally different levels of short-term variability could be explained by the effects of an outflow ejected by the accretion disc at radii where it is locally super-Eddington (Poutanen et al., 2007; Ohsuga & Mineshige, 2011; Takeuchi et al., 2014). If the wind is turbulent, it could increase the short-term variability when our line of sight encounters turbulences in the wind (Takeuchi et al., 2014; Middleton et al., 2015). Therefore, if we believe to the very marginally different short-term variability observed at the same luminosity in two XMM-Newton observations of this source, it could be explained as a substantial difference in homogeneity of the wind itself (Middleton et al., 2015). However, we note that if the outflow/wind extends above the whole disc, we may expect to observe its photosphere in the form of a cold thermal component.
If it is indeed a standard ULX, the spectral properties of NGC 5643 ULX1 may be associated with the broadened disc classification proposed by Sutton et al. (2013). However, we note that this classification may be ambiguous given the observed high X-ray luminosity and intermittent short-term variability, and this source could potentially be associated with the hard ultraluminous class. This could be the case if the source is seen close to face-on. We suggest that the X-ray spectrum could be dominated by the hard emission component, which is amplified by beaming in the funnel of the wind and scattered on the wind photosphere (e.g. Middleton et al., 2015). In such conditions the soft spectral component may be suppressed, allowing the hard component to dominate, giving a harder spectrum (e.g. Sutton et al. 2013, Sutton et al. 2013b). This scenario cannot be distinguished from an advection dominated disc, but we note that very marginal indications of a soft component are evident when the highest quality spectra are fitted with the multicolour disc plus Comptonisation model. Recently, a few other ULXs with luminosities erg s-1 have been reported to have single component, disc-like spectra (Circinus ULX5, NGC 5907 ULX1; Walton et al., 2013; Sutton et al., 2013), including one HLX candidate in the galaxy NGC 470, which appears to be disc-like when it is most luminous (Sutton et al., 2012). Similarly, several other well-studied lower luminosity ULXs have been reported to become spectrally harder with increasing luminosity (the NGC 1313 X-2 when it has a ‘very thick’ spectra, Pintore & Zampieri 2012; Holmberg IX X-1, Vierdayanti et al. 2010, Luangtip et al. submitted). The feasibility of this scenario is seemingly confirmed by Kawashima et al. (2012), who used Monte-Carlo simulations to simulate radiation spectra from supercritical BH accretion flows. They showed that a source accreting at the highest super-Eddington rates, where the wind envelope can cover the whole object and down-scatter the photons emitted in the hot inner regions, could appear with similar spectral properties to NGC 5643 ULX1 when viewed close to face-on. This may naturally explain the (marginally) increased short-term variability in observation 1, whereas the potential origin of variability in a simple advection dominated disc is unclear. However, high levels of short-variability are generally seen in ULXs with a soft spectral shape, rather than hard sources such as NGC 5643 ULX1 (e.g. Sutton et al., 2013). As such, we can speculate that in NGC 5643 ULX1 the wind does not completely cover the disc, but the hard component is beamed by the wind funnel so still dominates the observed spectrum. In this case, if clumps of wind material are blown in to the funnel and intersect our line of sight, they could feasibly produce the observed short-term variability.
Based on the similarities between this source and NGC 1313 X-2, we tentatively estimated the mass of the compact object using the hardness-intensity diagrams from Pintore et al. (2014). As NGC 5643 ULX1 displays similar spectral hardness to NGC 1313 X-2, we suggest that they may be accreting at similar fractions of Eddington. As NGC 5643 ULX1 is a factor of more luminous than NGC 1313 X-2, for the same spectral hardness, we suggest that the BH in NGC 5643 ULX1 is also 4 times larger than that in NGC 1313 X-2. Indeed, at a luminosity of erg s-1, this ULX is consistent with containing a 30 M⊙ BH which is emitting at 10 times the Eddington limit (cf. Poutanen et al. 2007). This proposed scenario could be tested using further moderately long (40 ks) combined XMM-Newton and NuSTAR observations, which could trace the evolution of the source.
We must caution that the distance to the galaxy (hence the ULX distance as well) may be over estimated in this and previous work. Sanders et al. (2003) estimated a distance of 13.9 Mpc, based on the assumption of the cosmic attractor model (Mould et al., 2000). At this distance the luminosities of ULX1 would be reduced by 30%. This would mean that the ULX is less extreme in luminosity than previously reported and possibly more similar to the bulk population of typical ULXs in the nearby Universe (e.g. Gladstone et al. 2009; Middleton et al. 2011; Vierdayanti et al. 2010; Pintore & Zampieri 2012; Sutton et al. 2013; Pintore et al. 2014; Middleton et al. 2015; Walton et al. 2013; Bachetti et al. 2013). This would imply that our previous highly tentative mass estimate for the black hole relative to NGC 1313 X-2 should be lowered to a factor of 2–3.
5 Conclusions
We have analysed all of the available XMM-Newton observations of the SAB(rs)c galaxy NGC 5643, with the primary purpose of studying ULX1. This is an improvement over previous work, as for the first time we report results from a new observation with unprecedented data quality for this source. The ULX is particularly luminous ( erg s-1) and has an energy spectrum that can be reproduced by models of an advection dominated disc or a Comptonising corona, without showing significant spectral variability. Such a thermal-like spectral state is not seen in Galactic sub-Eddington accreting BH binaries, where soft spectra are generally well fitted by a standard Shakura & Sunyaev accretion disc (Shakura & Sunyaev, 1973). In addition, the short-term variability of this source appears to (very marginally) vary independently of the luminosity of the ULX. These results have allowed us to rule-out canonical sub-Eddington spectral states (i.e. sub-Eddington hard and soft states) which would be expected if the ULX contained an IMBH. Instead, we favour an interpretation of this source as BH of stellar origin accreting at super-Eddington rates. In particular, we suggest that the source may be seen almost face-on, with a strong outflow which beams and amplifies the hard emission produced in the inner disc. This is equivalent to the hard/ultraluminous state proposed by Sutton et al. (2013) for the highest luminosity ULXs. This scenario can not only produce the hard spectral shape seen in this ULX, but if the wind is turbulent, it also naturally explains the observed random short-term variability. Based on this interpretation, we tentatively estimate the mass of the BH in this system to be M⊙.
Acknowledgements
We thank the anonymous referee for his/her useful comments which helped us to improve the paper. We acknowledge financial support through INAF grant PRIN-2011-1 (Challenging ultraluminous X-ray sources: chasing their black holes and formation pathways) and INAF grant PRIN 2012-6. Based on observations obtained with XMM-Newton, an ESA science mission with instruments and contributions directly funded by ESA Member States and NASA. LZ acknowledges financial support from the ASI/INAF contract n. I/037/12/0. MJM appreciates support from ERC grant 340442. TPR was funded as part of the STFC consolidated grant awards ST/K00861/1 and ST/L00075X/1. ADS was supported by an appointment to the NASA Postdoctoral Program at Marshall Space Flight Center, administered by Universities Space Research Association through a contract with NASA.
References
- Annuar et al. (2015) Annuar A., Gandhi P., Alexander D. M., Lansbury G. B., Arévalo P., Ballantyne D. R., Baloković M., Bauer e. a., 2015, ArXiv e-prints
- Arnaud (1996) Arnaud K. A., 1996, in Jacoby, G. H. and Barnes, J., eds., Astronomical Data Analysis Software and Systems V. Vol. 101 of ASP Conf. Ser., San Francisco CA, XSPEC: The First Ten Years. p. 17
- Bachetti et al. (2014) Bachetti M., Harrison F. A., Walton D. J., Grefenstette B. W., Chakrabarty D., Fürst F., Barret et al. 2014, Nature, 514, 202
- Bachetti et al. (2013) Bachetti M., Rana V., Walton D. J., Barret D., Harrison F. A., et al. 2013, ApJ, 778, 163
- Begelman et al. (2006) Begelman M. C., King A. R., Pringle J. E., 2006, MNRAS, 370, 399
- Belczynski et al. (2010) Belczynski K., Bulik T., Fryer C. L., Ruiter A., Valsecchi F., Vink J. S., Hurley J. R., 2010, ApJ, 714, 1217
- Beloborodov (1998) Beloborodov A. M., 1998, MNRAS, 297, 739
- Bianchi et al. (2006) Bianchi S., Guainazzi M., Chiaberge M., 2006, A&A, 448, 499
- Colbert & Mushotzky (1999) Colbert E. J. M., Mushotzky R. F., 1999, ApJ, 519, 89
- Fabbiano (1989) Fabbiano G., 1989, ARA&A, 27, 87
- Farrell et al. (2012) Farrell S. A., Servillat M., Pforr J., Maccarone T. J., Knigge C., Godet O., Maraston C., Webb N. A., Barret D., Gosling A. J., Belmont R., Wiersema K., 2012, ApJ, 747, L13
- Farrell et al. (2009) Farrell S. A., Webb N. A., Barret D., Godet O., Rodrigues J. M., 2009, Nature, 460, 73
- Fender & Belloni (2012) Fender R., Belloni T., 2012, Science, 337, 540
- Feng et al. (2010) Feng H., Rao F., Kaaret P., 2010, ApJ, 710, L137
- Feng & Soria (2011) Feng H., Soria R., 2011, New Astronomy Reviews, 55, 166
- Gladstone et al. (2009) Gladstone J. C., Roberts T. P., Done C., 2009, MNRAS, 397, 1836
- Godet et al. (2014) Godet O., Lombardi J. C., Antonini F., Barret D., Webb N. A., Vingless J., Thomas M., 2014, ApJ, 793, 105
- Guainazzi et al. (2004) Guainazzi M., Rodriguez-Pascual P., Fabian A. C., Iwasawa K., Matt G., 2004, MNRAS, 355, 297
- Heil et al. (2009) Heil L. M., Vaughan S., Roberts T. P., 2009, MNRAS, 397, 1061
- Hopman et al. (2004) Hopman C., Portegies Zwart S. F., Alexander T., 2004, ApJ, 604, L101
- Kajava et al. (2012) Kajava J. J. E., Poutanen J., Farrell S. A., Grisé F., Kaaret P., 2012, MNRAS, 422, 990
- Kalberla et al. (2005) Kalberla P. M. W., Burton W. B., Hartmann D., Arnal E. M., Bajaja E., Morras R., Pöppel W. G. L., 2005, A&A, 440, 775
- Kawaguchi (2003) Kawaguchi T., 2003, ApJ, 593, 69
- Kawashima et al. (2012) Kawashima T., Ohsuga K., Mineshige S., Yoshida T., Heinzeller D., Matsumoto R., 2012, ApJ, 752, 18
- King (2009) King A. R., 2009, MNRAS, 393, L41
- King et al. (2001) King A. R., Davies M. B., Ward M. J., Fabbiano G., Elvis M., 2001, ApJ, 552, L109
- Liu et al. (2013) Liu J.-F., Bregman J. N., Bai Y., Justham S., Crowther P., 2013, Nature, 503, 500
- Maccacaro et al. (1988) Maccacaro T., Gioia I. M., Wolter A., Zamorani G., Stocke J. T., 1988, ApJ, 326, 680
- Madau & Rees (2001) Madau P., Rees M. J., 2001, ApJ, 551, L27
- Mapelli et al. (2009) Mapelli M., Colpi M., Zampieri L., 2009, MNRAS, 395, L71
- Mapelli et al. (2011) Mapelli M., Ripamonti E., Zampieri L., Colpi M., 2011, MNRAS, 416, 1756
- Mapelli et al. (2012) Mapelli M., Zampieri L., Mayer L., 2012, MNRAS, 423, 1309
- Matt et al. (2013) Matt G., Bianchi S., Marinucci A., Guainazzi M., Iwawasa K., Jimenez Bailon E., 2013, A&A, 556, A91
- McClintock & Remillard (2006) McClintock J. E., Remillard R. A., 2006, in Compact stellar X-ray sources, ed. W. H. G. Levin and M. van der Klis. Cambridge: Cambridge University Press, p. 157
- Mezcua et al. (2015) Mezcua M., Roberts T. P., Lobanov A. P., Sutton A. D., 2015, MNRAS, 448, 1893
- Middleton et al. (2015) Middleton M. J., Heil L., Pintore F., Walton D. J., Roberts T. P., 2015, MNRAS, 447, 3243
- Middleton et al. (2011) Middleton M. J., Sutton A. D., Roberts T. P., 2011, MNRAS, 417, 464
- Middleton et al. (2014) Middleton M. J., Walton D. J., Roberts T. P., Heil L., 2014, MNRAS, 438, L51
- Miller & Hamilton (2002) Miller M. C., Hamilton D. P., 2002, MNRAS, 330, 232
- Mineshige et al. (1994) Mineshige S., Hirano A., Kitamoto S., Yamada T. T., Fukue J., 1994, ApJ, 426, 308
- Mitsuda et al. (1984) Mitsuda K., Inoue H., Koyama K., Makishima K., Matsuoka M., Ogawara Y., Suzuki K., Tanaka Y., Shibazaki N., Hirano T., 1984, PASJ, 36, 741
- Mizuno et al. (2007) Mizuno T., Miyawaki R., Ebisawa K., et al. 2007, PASJ, 59, 257
- Motch et al. (2014) Motch C., Pakull M. W., Soria R., Grisé F., Pietrzyński G., 2014, Nature, 514, 198
- Mould et al. (2000) Mould J. R., Huchra J. P., Freedman W. L., Kennicutt Jr. R. C., Ferrarese L., Ford H. C., Gibson B. K., Graham J. A., Hughes S. M. G., Illingworth G. D., Kelson D. D., Macri L. M., Madore B. F., Sakai S., Sebo K. M., Silbermann N. A., Stetson P. B., 2000, ApJ, 529, 786
- Ohsuga & Mineshige (2007) Ohsuga K., Mineshige S., 2007, ApJ, 670, 1283
- Ohsuga & Mineshige (2011) Ohsuga K., Mineshige S., 2011, ApJ, 736, 2
- Ohsuga et al. (2009) Ohsuga K., Mineshige S., Mori M., Kato Y., 2009, PASJ, 61, L7
- Pasham et al. (2014) Pasham D. R., Strohmayer T. E., Mushotzky R. F., 2014, Nature, 513, 74
- Phillips et al. (1983) Phillips M. M., Charles P. A., Baldwin J. A., 1983, ApJ, 266, 485
- Pintore & Zampieri (2012) Pintore F., Zampieri L., 2012, MNRAS, 420, 1107
- Pintore et al. (2014) Pintore F., Zampieri L., Wolter A., Belloni T., 2014, MNRAS, 439, 3461
- Portegies Zwart et al. (2004) Portegies Zwart S. F., Baumgardt H., Hut P., Makino J., McMillan S. L. W., 2004, Nature, 428, 724
- Poutanen et al. (2007) Poutanen J., Lipunova G., Fabrika S., Butkevich A. G., Abolmasov P., 2007, MNRAS, 377, 1187
- Rana et al. (2014) Rana V., Harrison F. A., Bachetti M., Walton D. J., Furst F., Barret D., Miller J. M., Fabian A. C., Boggs S. E., Christensen F. C., Craig W. W., Grefenstette B. W., Hailey C. J., Madsen K. K., Ptak A. F., Stern D., Webb N. A., Zhang W. W., 2014, ArXiv e-prints
- Roberts (2007) Roberts T. P., 2007, Ap&SS, 311, 203
- Ross & Fabian (2007) Ross R. R., Fabian A. C., 2007, MNRAS, 381, 1697
- Sanders et al. (2003) Sanders D. B., Mazzarella J. M., Kim D.-C., Surace J. A., Soifer B. T., 2003, AJ, 126, 1607
- Servillat et al. (2011) Servillat M., Farrell S. A., Lin D., Godet O., Barret D., Webb N. A., 2011, ApJ, 743, 6
- Shakura & Sunyaev (1973) Shakura N. I., Sunyaev R. A., 1973, A&A, 24, 337
- Stobbart et al. (2006) Stobbart A.-M., Roberts T. P., Wilms J., 2006, MNRAS, 368, 397
- Suleimanov et al. (2002) Suleimanov V. F., Ghosh K. K., Austin R. A., Ramsey B. D., 2002, Astronomy Letters, 28, 745
- Sutton et al. (2013) Sutton A. D., Roberts T. P., Gladstone J. C., Farrell S. A., Reilly E., Goad M. R., Gehrels N., 2013, MNRAS, 434, 1702
- Sutton et al. (2013) Sutton A. D., Roberts T. P., Middleton M. J., 2013, MNRAS, 435, 1758
- Sutton et al. (2012) Sutton A. D., Roberts T. P., Walton D. J., Gladstone J. C., Scott A. E., 2012, MNRAS, 423, 1154
- Takeuchi et al. (2013) Takeuchi S., Ohsuga K., Mineshige S., 2013, PASJ, 65, 88
- Takeuchi et al. (2014) Takeuchi S., Ohsuga K., Mineshige S., 2014, PASJ
- Titarchuk (1994) Titarchuk L., 1994, ApJ, 434, 570
- Tully & Fisher (1988) Tully R. B., Fisher J. R., 1988, Catalog of Nearby Galaxies
- van der Klis (1994) van der Klis M., 1994, A&A, 283, 469
- Vaughan et al. (2003) Vaughan S., Edelson R., Warwick R. S., Uttley P., 2003, MNRAS, 345, 1271
- Vierdayanti et al. (2010) Vierdayanti K., Done C., Roberts T. P., Mineshige S., 2010, MNRAS, 403, 1206
- Volonteri (2010) Volonteri M., 2010, Nature, 466, 1049
- Walton et al. (2013) Walton D. J., Fuerst F., Harrison F., Stern D., Bachetti M., Barret D., Bauer F., Boggs S. E., Christensen F. E., Craig W. W., Fabian A. C., Grefenstette B. W., Hailey C. J., Madsen K. K., Miller J. M., Ptak A., Rana V., Webb N. A., Zhang W. W., 2013, ApJ, 779, 148
- Walton et al. (2013) Walton D. J., Miller J. M., Harrison F. A., Fabian A. C., Roberts T. P., Middleton M. J., Reis R. C., 2013, ApJ, 773, L9
- Walton et al. (2011) Walton D. J., Roberts T. P., Mateos S., Heard V., 2011, MNRAS, 416, 1844
- Webb et al. (2012) Webb N., Cseh D., Lenc E., Godet O., Barret D., Corbel S., Farrell S., Fender R., Gehrels N., Heywood I., 2012, Science, 337, 554
- Webb et al. (2014) Webb N. A., Godet O., Wiersema K., Lasota J.-P., Barret D., Farrell S. A., Maccarone T. J., Servillat M., 2014, ApJ, 780, L9
- Zampieri & Roberts (2009) Zampieri L., Roberts T. P., 2009, MNRAS, 400, 677
Appendix A Spectral Analysis of the AGN
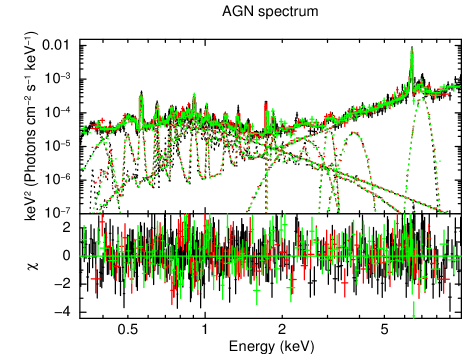
Besides the ULX, NGC 5643 hosts also an AGN. The AGN is known to be heavily absorbed and characterised by a large iron emission feature, probably associated with Compton reflection of hard photons (e.g. Guainazzi et al. 2004; Bianchi et al. 2006; Annuar et al. 2015). Other emission features have also been found in the XMM-Newton spectra of the AGN, and these have been associated with photoionised emission regions. Annuar et al. (2015) studied a combination of NuSTAR and XMM-Newton data with the aim of well characterising the spectral properties of the AGN. They found that different reflection/obscuration models can well describe the data, indicating that both Compton thick absorption by a toroidal absorber and reflection from distant, cold material are important in explaining the AGNs spectral properties. However, the properties of all of the components are still a matter of debate, and with the recent long XMM-Newton observation we have an unprecedented chance to study these features in high quality data at low energies ( keV).
We extracted the spectrum of the AGN in observation 3, choosing extraction regions of 20′′ and 40′′ for the AGN and the background, respectively. The spectra clearly show a prominent emission line 6.4 keV, plus many other emission features. Simple models, such as a blackbody plus a power-law or APEC plasma emission plus a power-law result in poor fits and broadband residuals. Instead we found that the XMM-Newton continuum spectrum can be well fitted by the combination of a neutral absorbed powerlaw, a reflection component (modelled with reflionx, Ross & Fabian 2007, e.g.) and a photoionised plasma (apec model in xspec). We fixed the chemical abundance of both the reflection and APEC plasma components to 1, and left the photon indices of the power-law and the ionising flux for the reflection component free to vary independently. This three-component model provides an improvement in the fit to the data (dof=941/589, see Table 3), with respect to the simpler models mentioned above, and the iron emission line is well modelled, allowing us to associate it with reflection. The neutral column density is cm-2, which is intermediate between values reported for the previous XMM-Newton observations (e.g. Guainazzi et al., 2004; Matt et al., 2013), but significantly lower than the value reported by Annuar et al. (2015). The power-law has a photon index of and can adequately reproduce the soft part of the spectrum with the additional contribution from the keV APEC plasma. The very flat powerlaw photon index would give an unusually low Compton parameter; hence it may actually suggest that this component represents the tail of a thermal component which is outside of the XMM-Newton bandpass. The reflection component mainly contributes to the high energy spectrum. From the inferred parameters, we can conclude that reflection occurs in a very-low ionisation medium ( erg cm s-1) illuminated by an ionising flux with a flat photon index. We note that the photon index is pegged at the lower limit allowed by the reflionx model (), although this may depend on the uncertainties in the illuminating emission, which is probably above the XMM-Newton bandpass. Hence we cannot exclude the possibility that the ionising flux spectrum is even flatter.
| tbabs | (1022 cm-2)a | |
| apec | (keV)b | |
| Abundancec | =1 (fixed) | |
| Norm. ()d | ||
| powerlaw | e | |
| Norm. f | ||
| reflionx | g | =1 (fixed) |
| h | ||
| Log i | ||
| ()j | ||
| 686.61/571 |
a Neutral column density; b photoionised plasma temperature; c chemical abundance of the plasma; d normalisation of the APEC plasma; e photon index; f power-law normalisation; g ratio of the iron and hydrogen abundances; h photon index of the illuminating power-law spectrum; i logarithm of the ionisation parameter in units of erg cm s-1; j normalisation of the reflionx component.
Emission lines are still evident as residuals in the spectrum. These include: moderately broad ( eV) emission lines at 0.320.3 keV, 1.730.1 keV and 3.050.5 keV (with equivalent widths, EWs, of 400 eV, 150 eV and 180 eV), associated with the neutral K transition of C, Si and Ar, and three broad (250 eV) emission features 2.290.8 keV, 3.80.1 keV and 7.000.7 keV (with EWs of 520 eV, 220 eV and 500 eV respectively), associated with neutral K transitions of N and Ca, and the highly ionised Fe XXVI K line respectively (see Figure 7). The best fitting model that includes the emission lines results in a fit statistic of , which is formally acceptable (see table 3). We suggest that the C, Si, Ar, Ca and N lines are related to the reflection component which produces the intense 6.4 keV Fe emission line, whilst the Fe XXVI emission line may be generated in a very ionised region close to the central supermassive BH. We infer a 0.3–10 keV unabsorbed luminosity of erg s-1, thus confirming that the source is a low luminosity AGN (e.g. Guainazzi et al. 2004; Matt et al. 2013; Annuar et al. 2015).
The spectral analysis shows that the AGN has a complex spectral shape that can be well modelled in the soft band by a photoionised plasma and a steep power-law with photon index of 5. The plasma emission has a temperature of keV and an unabsorbed 0.3–10 keV luminosity of 3 erg s-1, and may originate from gas heated by shocks or winds in regions of intense star formation (Guainazzi et al., 2004). These two components could be associated with an optically thin medium located close to the X-ray source, in which the tail of a cold thermal component from outside of the XMM-Newton bandpass is reprocessed, mainly through photoelectric absorption. The hard energy band is dominated by a reflection component that appears to be produced by the scattering of hard photons (with a spectral index of 1.4) in a low-ionised medium (almost neutral). Some broad emission features are also observed, which we identify as K neutral transitions of C, Si, Ar, Ca and N. These emission features are probably associated with the same reflection processes which dominate the high energy continuum emission. The broadening (up to 0.3 keV) could be caused by either scatterings in a high-velocity medium, thermal Compton scattering or by relativistic effects. Our results are consistent with the broadband spectral study presented by Annuar et al. (2015), who found that a combination of highly Compton thick absorption ( cm-2) and cold reflection are at work in this source. The 2.0–10 keV unabsorbed luminosity found in observation 3 ( erg s-1) is clearly lower than the erg s-1 reported by Annuar et al. (2015), and we relate this discrepancy to both the significantly lower absorption column found in this work and to possible real slight variation in the X-ray luminosity. Annuar et al. (2015) showed that a model which take into account only reflection converges towards low values of the column density. Instead, a combination of toroidal absorption and reflection may result in more reliable estimates of the column density.