PASA \jyear2024
The disc origin of the Milky Way bulge
Abstract
The Galactic bulge, that is the prominent out-of-plane over-density present in the inner few kiloparsecs of the Galaxy, is a complex structure, as the morphology, kinematics, chemistry and ages of its stars indicate. To understand the nature of its main components – those at [Fe/H] dex – it is necessary to make an inventory of the stellar populations of the Galactic disc(s), and of their borders : the chemistry of the disc at the solar vicinity, well known from detailed studies of stars over many years, is not representative of the whole disc. This finding, together with the recent revisions of the mass and sizes of the thin and thick discs, constitutes a major step in understanding the bulge complexity. N-body models of a boxy/peanut-shaped bulge formed from a thin disc through the intermediary of a bar have been successful in interpreting a number of global properties of the Galactic bulge, but they fail in reproducing the detailed chemo-kinematic relations satisfied by its components and their morphology. It is only by adding the thick disc to the picture that we can understand the nature of the Galactic bulge.
doi:
10.1017/pas.2024.xxxkeywords:
Galaxy: bulge – Galaxy: disc – Galaxy: kinematics and dynamics – Galaxy: evolution1 THE GALACTIC BULGE
The bar-like shape and boxy/peanut structure of the Galactic bulge, found also in a large number of external galaxies (Lütticke et al. 2000; Kormendy &
Kennicutt 2004), have been known for long time (Okuda et al. 1977; Maihara et al. 1978; Weiland
et al. 1994; Dwek et al. 1995; Binney
et al. 1997; Babusiaux &
Gilmore 2005; López-Corredoira et al. 2005; Rattenbury et al. 2007; Cao et al. 2013). This structure constitutes the innermost thick part of a longer and flatter bar, extending up to about 4–5 kpc from the Galaxy centre (Benjamin
et al. 2005; Cabrera-Lavers et al. 2007; Wegg
et al. 2015). Its orientation is between 20 and 30 degrees with respect to the Sun-Galaxy centre direction (Bissantz &
Gerhard 2002; Shen et al. 2010; Wegg &
Gerhard 2013), and at vertical distances from the plane of about 400 pc, a prominent X-shape becomes visible in the data (McWilliam &
Zoccali 2010; Nataf et al. 2010; Wegg &
Gerhard 2013; Gonzalez
et al. 2015a), indicative of a stellar bar evolving secularly after buckling (Combes &
Sanders 1981; Athanassoula 2005; Debattista et al. 2006; Martinez-Valpuesta et al. 2006; Ness et al. 2012; Di Matteo
et al. 2014).
Studies of the bulge kinematics also support its bar-like nature and thus ultimately its link to the disc. The bulge shows indeed cylindrical rotation (Howard et al. 2008; Howard
et al. 2009; Kunder
et al. 2012), as predicted by N-body models where the bulge is formed via the buckling of a pre-existing thin stellar bar formed in a cold stellar disc (Shen et al. 2010; Saha et al. 2012; Ness
et al. 2013b; Di Matteo
et al. 2015). The vertex deviation observed in the stellar velocities (Zhao
et al. 1994; Soto
et al. 2007; Babusiaux
et al. 2010), especially for its metal-rich population (Babusiaux
et al. 2010), is also an indication of its asymmetric structure.
Bulge stars span a large range in [Fe/H] and [/Fe] values (with , see Rich 1988; McWilliam & Rich 2004; Zoccali et al. 2003; Ness et al. 2013a; Gonzalez et al. 2015b), and several recent works show that their chemical patterns strikingly resemble those of stars at the solar vicinity (Meléndez et al. 2008; Alves-Brito et al. 2010; Bensby et al. 2010; Ryde et al. 2010; Gonzalez et al. 2011a, 2015b; Ryde et al. 2015; Ness & Freeman 2015), once the outer disc sequence – present at the solar vicinity and not in the inner disc (see next Section) – is removed from the comparison. It is important here to note that previous works (McWilliam & Rich 1994; Rich & Origlia 2005; Zoccali et al. 2006; Lecureur et al. 2007; Hill et al. 2011; Johnson et al. 2011) have pointed out a difference between the chemistry of the bulge and that of the thick disc at the solar vicinity, with bulge stars being more enhanced than thick disc stars of the same metallicity. This argument naturally led to exclude that the enhanced population of the bulge could be the result of the secular evolution of the disc, via bar formation (see for example Zoccali et al. 2006), as suggested also by chemical evolution models (Matteucci & Brocato 1990; Matteucci & Romano 1999; Ballero et al. 2007). However, in more recent studies, these differences appear much less dramatic than previous findings. Quoting Johnson et al. (2011), for example: “While [..] the [Si/Fe], [Ca/Fe], and [/Fe] ratios are generally enhanced by dex in bulge giants compared to thick disk giants (and dwarfs), this enhancement is not extraordinarily different than the combined measurement uncertainty and choice of abundance normalization scale […]. Interestingly, both the thick disk and bulge appear to show similar declines in the [/Fe] ratio at [Fe/H].” Indeed the current data show that the offset between the chemistry of bulge stars and that of discs stars at the solar vicinity (see Bensby et al. 2010; Gonzalez et al. 2011a; Adibekyan et al. 2012; Johnson et al. 2014; Ryde et al. 2015) is comparable to the existing systematics between spectroscopic studies of stars in the solar neighborhood (compare, for example, Alves-Brito et al. 2010; Gonzalez et al. 2011a; Adibekyan et al. 2012; Bensby et al. 2014) or between the differences among different bulge studies (Gonzalez et al. 2011a; Bensby et al. 2010; Johnson et al. 2012, 2014; Van der Swaelmen et al. 2016).
Evidence about the presence of multiple components, or populations, in the bulge comes from the investigation of its metallicity distribution function (hereafter MDF), at different latitudes and longitudes (Babusiaux
et al. 2010; Hill et al. 2011; Uttenthaler et al. 2012; Ness
et al. 2013a; Rojas-Arriagada
et al. 2014; Gonzalez
et al. 2015b). In the largest spectroscopic study of the bulge conducted so far, the ARGOS survey (Freeman
et al. 2013), Ness
et al. (2013a) decomposed the global MDFs found at latitudes (integrated over the whole range of longitudes ) into five gaussian components, called A, B, C, D and E, whose metallicities peak at about [Fe/H]=0.1 dex, -0.3 dex, -0.7 dex, -1.2 dex and -1.7 dex, respectively. Of those five components, D and E are negligible in the fields considered, representing 6% at most of the whole sample, while the proportion of populations A, B and C has been shown to vary with the height from the plane: A represents about 40% of the sample at , and decreases to 16% and 12%, respectively, at and ; the C component, on the opposite, increases with the height from the plane, passing from 20% at to 30% at and to roughly 40% at ; B shows the smallest variations, and its fractional contribution to the bulge is significant at all latitudes considered in this study (40% at , 50% at , 44% at ).
The different proportion of these components with height above the plane naturally explains the existence of a vertical metallicity gradient in the bulge, as reported by Ness
et al. (2013a) and even before in the studies of Zoccali
et al. (2008); Gonzalez et al. (2011b, 2013). Interestingly, it has been shown that the structural and kinematic properties change from one component to the other (Ness
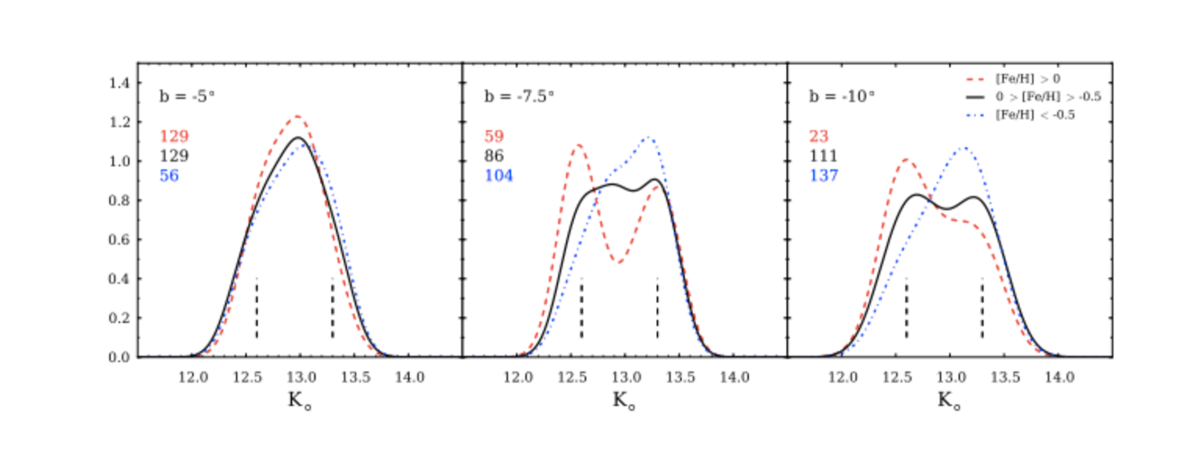
et al. 2013b, a). The most metal rich components A and B, characterized by [Fe/H] dex, show a split in the distribution of K-magnitudes of their red clump stars. This distribution is particularly suitable to understand the underlying morphology. The density of a peanut-shaped bulge indeed
shows some minimum in the centre, on its minor axis, minimum which is more accentuated at higher latitudes. On the line of sight, this produces a bimodal distribution, or a split, in the apparent K-magnitude of the red clump. In particular, it appears that in the Milky Way bulge the deepest minima between peaks in the K-magnitude distribution are found in the most metal-rich population (i.e. population A, see Fig. 1 reproduced from Ness
et al. 2013a). At the latitudes covered by ARGOS, component C does not show any split. Interestingly, however, the maximum in the K-magnitude distribution of its stars is not located at K, as would be expected from a population which reaches its maximum density in the Galaxy centre, but rather it seems to peak where the far lobe of the peanut of populations A and B is found (again, see Fig. 1 here reproduced from Ness
et al. 2013a) . I will comment more on this point in Sect. 3.
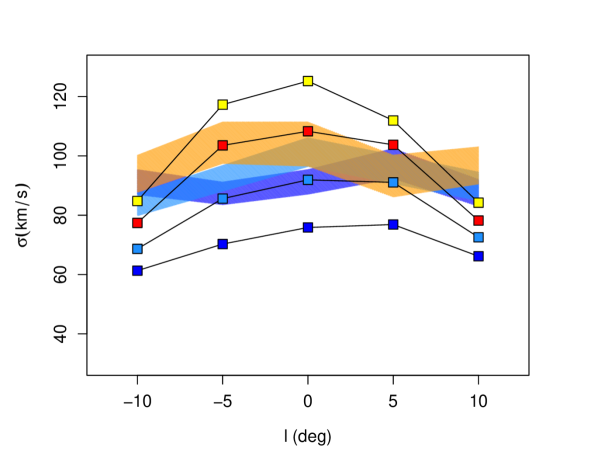
At any given latitude, populations A, B and C also show different kinematics (Ness
et al. 2013b). In particular, while the rotation curve, as deduced from radial velocities, is very similar in the three populations at all latitudes111Note however that Ness
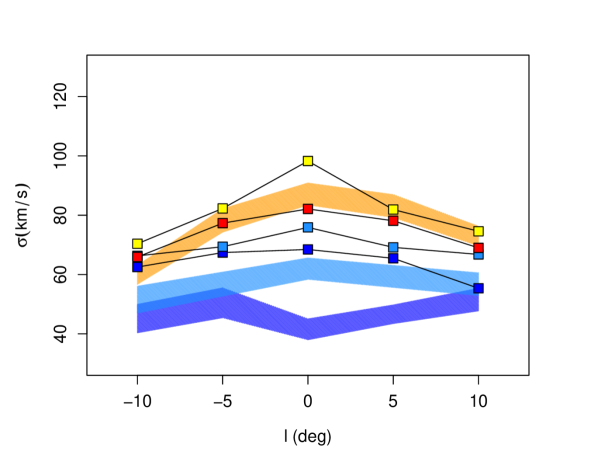
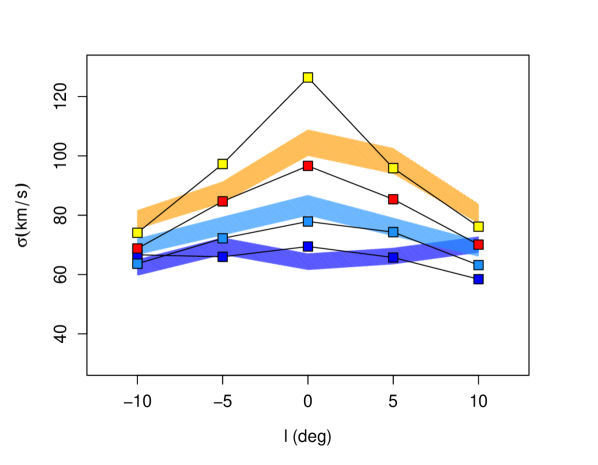
et al. (2013b) report a slightly higher (20%) value of the rotational velocity for component B, when compared to A and C., showing that the cylindrical rotation observed globally is also reproduced by each component individually, the velocity dispersions change with latitude and depend on the population examined. Component B has velocity dispersion profiles similar to A (but with higher absolute values), while component C shows dispersions constant both with longitude and latitude (see Fig. 6 in Ness
et al. 2013b). As previously said, other studies have shown that the bulge MDF can be decomposed in multiple components. Depending on the number of components found (two in Babusiaux
et al. 2010; Hill et al. 2011; Bensby et al. 2011; Uttenthaler et al. 2012; Rojas-Arriagada
et al. 2014; Gonzalez
et al. 2015b, and five in Ness
et al. (2013a)), the fraction of stars attributed to the metal-rich and metal-poor component(s) change, and accordingly their structural and kinematic properties.
Finally, few words on the ages of stars in the bulge. Isochrone fitting of main-sequence turnoff stars in the bulge have lead to the general conclusion that the majority of the stars in the bulge are old, typically Gyr (Terndrup 1988; Holtzman
et al. 1993; Ortolani et al. 1995; Feltzing &
Gilmore 2000; Zoccali
et al. 2003; Clarkson
et al. 2008; Brown
et al. 2010; Valenti
et al. 2013).
Such old ages have been interpreted as evidence that the bulge is a classical spheroid, that is a structure formed by mergers in the early phases of the Milky Way evolution (Ortolani et al. 1995; Zoccali
et al. 2003; Brown
et al. 2010). However, some findings are questioning this picture. The dating of microlensed dwarf stars in the bulge at latitudes has shown, indeed, that the most metal-rich stars ([Fe/H] dex) show a range in stellar ages from 3 to 12 Gyr (Bensby
et al. 2013, , see also Fig. 1 in Ness et al. (2014)). Young stars are not expected to be present in a classical spheroid, formed at early times, but are a natural outcome of a bulge formed secularly, through the bar (Ness et al. 2014). Moreover, very recently the VVV survey (Minniti et al. 2010) has reported the presence of numerous classical Cepheids (ages Myr) close to the Galaxy mid-plane (latitudes ) and distributed along the whole bulge longitudinal extent (Dékány
et al. 2015). The recent findings about the ages of stars in the bulge strengthen the global picture traced so far about the composite nature of this structure.
Overall the bulge shows a very well defined vertical structuring: the coldest, most metal-rich and youngest components are preferentially found at low latitudes and the weight of the dynamically hottest and most metal-poor components ([Fe/H] dex) increases with height from the plane. A population with intermediate metallicity ( [Fe/H] dex, population B in Ness
et al. (2013a)) is however found at all latitudes in similar proportions. In the following of this review, I will discuss how it is possible to explain the trends observed for the main populations of the Galactic bulge – those with [Fe/H] dex– in a scenario where these populations originate from the thin and thick discs of the Milky Way. I will not discuss further about stars with [Fe/H] dex, whose origin is very likely linked to the Galactic halo and/or the very early phases of Galactic formation (Diemand
et al. 2005; Tumlinson 2010; García Pérez et al. 2013; Ness
et al. 2013a; Howes
et al. 2014, 2015).
2 THE GALACTIC DISC(S)
To understand the nature and origin of the Milky Way bulge it is necessary to locate it in its environment: the Galaxy, and in particular its stellar disc(s). To present our most recent view of the Galactic discs, I have chosen to maintain the classical nomenclature adopted in the literature.
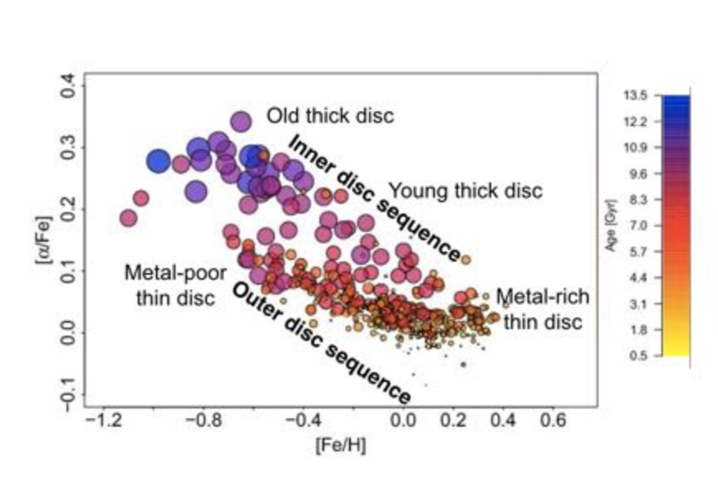
The thick disc belongs to a sequence which extends from high [/Fe] and low metallicities until it joins the metal-rich thin disc, at solar [/Fe] and super-solar metallicities. Because of the reasons recalled in the following of this section, I will refer to this sequence – running from the metal-poor thick disc to the metal-rich thin disc – also as the “inner disc sequence”. It is useful to remind at this point that this sequence shows a continuity in chemical patterns, with stellar ages decreasing with increasing metallicities from about 13 Gyr – for the oldest thick disc – to ages of about 9–10 Gyr – for the young thick disc – to ages younger than 8 Gyr for the metal-rich thin disc (see Fig. 2 and Haywood et al. 2013). However, this continuity in chemical patterns hides a halt in the star formation history of the inner disc, which took place at the transition from the thick to the thin disc formation (Haywood et al. 2016). In the following, I use also the nomenclature “inner thin disc” : this is essentially equivalent to the metal-rich thin disc, since – as we will see in Sect. 2.2 – the thin disc in the inner regions reduces to the metal-rich thin disc sequence only.
The metal-poor thin disc extends from [Fe/H] dex and super-solar [/Fe] to higher metallicities ([Fe/H] dex), but with the caveat that especially the upper limit in metallicity of this sequence is very uncertain. I will refer to this sequence also as that of the “outer thin disc”.
The Sun is at the interface of the inner and outer thin discs, in a 3 kpc wide region that shares chemical properties of both the inner and outer discs.
The “inner/outer disc” nomenclature used in this paper has been already adopted in Haywood et al. (2013), where we emphasized that “there is perhaps more continuity between the thin and thick discs than between the inner thin disc and outer thin disc. The inner thin disc and the thick disc seem to be more like the same structure […] while the outer disc appears more like a separate component” (see also Fig. 2). In the following, I will review the main reasons behind this vision, and explain why the most recent discoveries about the stellar populations of the Milky Way discs and their mutual links are of fundamental importance also for our understanding of the bulge, and its main components.
2.1 The thick disc
The thick disc, the last component discovered in the Milky Way in the early 80s (Gilmore & Reid 1983) has been for longtime seen as a population formed in a short-lived (1 Gyr) starburst episode produced at early epochs (Burkert et al. 1992; Chiappini et al. 1997, 1999; Mashonkina & Gehren 2001; Fuhrmann 2004; Reid 2005; Bernkopf & Fuhrmann 2006), chemically separated from the stellar thin disc (Fuhrmann 1998), and with a rotational lag with respect to thin disc stars between 50 and 100 km/s (Norris 1986; Wyse & Gilmore 1986; Freeman 1987; Ojha et al. 1994; Chiba & Beers 2000; Fuhrmann 2008; Bensby et al. 2014). With a scale length estimated to be similar or greater then that of the thin disc (Ojha 2001; Robin et al. 2003; Jurić et al. 2008; de Jong et al. 2010) on the basis of color-selection studies, and with a thick-to-thin disc volume density normalization at the solar vicinity of 10% at most (Robin et al. 2003; Jurić et al. 2008), it has been long considered as a minor contributor to the mass budget of the Galaxy, constituting about 20% of the thin disc mass (Robin et al. 2003). We will see in the following that the estimates of thick disc scale lengths and mass have been significantly revised. But before moving to discuss these new estimates, I will recall the main processes proposed for the formation of thick discs in galaxies.
Many different scenarios have been indeed suggested to explain thick discs formation. N-body models have shown that accretion of satellites can heat a kinematically cold disc and form, in few Gyrs, thick discs with vertical sizes, rotational lags, stellar eccentricities and masses similar to those observed for the Milky Way for appropriate orbital parameters, mass ratios and gas fractions of the progenitor galaxies (Quinn
et al. 1993; Walker
et al. 1996; Huang &
Carlberg 1997; Sellwood et al. 1998; Velazquez &
White 1999; Bekki &
Chiba 2001; Hänninen &
Flynn 2002; Read et al. 2008; Villalobos &
Helmi 2008, 2009; Purcell et al. 2009; Moster et al. 2010; Qu et al. 2010, 2011; House
et al. 2011; Bekki &
Tsujimoto 2011; Di Matteo et al. 2011; Moster et al. 2012). One of the main objection to this scenario is that it should lead to a flaring of the disc (Bournaud et al. 2009), while usually these structures are not observed to flare (van der Kruit
& Searle 1982; de Grijs 1998; Comerón
et al. 2011). Note however that recently it has been shown that it is possible to reconcile an apparent lack of flaring with thick disc formed via satellite heating (Minchev et al. 2015).
Mergers of gas rich subunits, in which discs form thick ab initio, are also a viable mechanism of formation (Brook et al. 2004, 2007; Richard et al. 2010).
Clumpy disc galaxies, where massive gas and stellar over densities scatter stars in a pre-existing thin disc, making the overall disc thicker, have also been shown to be able to form thick structures in about 1 Gyr (Bournaud et al. 2009), as suggested by Noguchi (1996). However, this scenario may have difficulties in explaining the chemo-kinematic relations satisfied by thick disc stars in the Milky Way (see Inoue &
Saitoh 2014).
Finally secular evolution processes, like radial migration, have been suggested to be able to explain the characteristics of the thick disc at the solar vicinity, namely its structure, kinematic and chemical properties (Schönrich
& Binney 2009b; Loebman et al. 2011). However, the effectiveness of this process in heating the disc has been repeatedly questioned (Minchev et al. 2012; Vera-Ciro et al. 2014; Halle et al. 2015).
These “classical” picture and scenarios have been recently challenged by a number of findings.
-
•
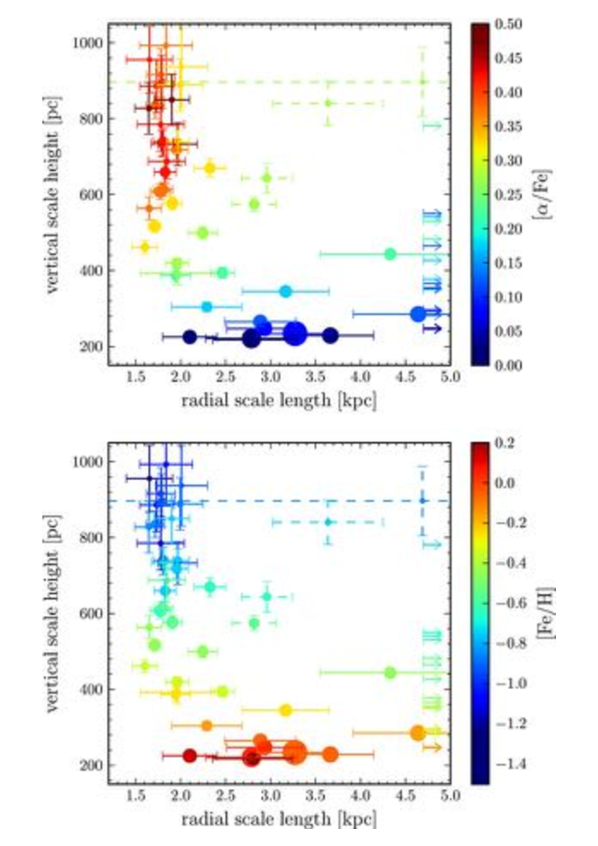
Large scale spectroscopic surveys, like SEGUE and APOGEE, have shown the existence of a structural continuity between the thick and thin discs (Bovy et al. 2012a; Bovy et al. 2012b, 2015), and inside the thick disc itself. The morphological-chemical structuring of the thick disc can be appreciated in Fig. 3 reproduced from Bovy et al. (2012b), where the vertical and radial scale lengths of disc stars grouped in bins of ([/Fe]-[Fe/H]) – the so-called “mono-abundance populations” in Bovy et al studies– are plotted, with colors coding the [/Fe] and [Fe/H], respectively. Alpha-abundant (i.e. [/Fe] 0.2-0.3 dex in the Bovy et al. (2012b) scale), thick disc stars are characterized by short scale lengths, and have scale heights that diminish with decreasing [/Fe] and increasing [Fe/H]222Note however that this trend of decreasing scale height with decreasing [] may not be valid for stars in the highest [] bins, see Minchev et al. (2014); Guiglion et al. (2015). Overall, the enhanced thick disc has a scale length significantly shorter than that of the thin disc as a whole (2 kpc for the thick disc, and about 3.6 kpc for the thin; see Bovy et al. 2012b; Cheng et al. 2012). This scale length is about a factor of two smaller than previous estimates (Ojha 2001; Jurić et al. 2008; de Jong et al. 2010). That the thick disc had a shorter scale length than the thin disc was also found by means of high-resolution spectroscopic studies, which suggest a scale length for this population similar to that found by APOGEE and SEGUE (see Bensby et al. 2011).
-
•
The analysis and dating of high spectroscopic data for stars at the solar vicinity have shown that the stars in the Galactic disc(s) satisfy a very well defined -age relation and that the enhanced thick disc formed in a prolonged burst of star formation (lasting 3-4 Gyr, see Haywood et al. (2013)). Note that since those stars span a wide range of pericentre and apocentre distances, up to 1-2 kiloparsecs from the Galactic centre, this relation is not local but should apply to the whole thick disc (see discussion in Haywood et al. 2015).
-
•
The imprint left on the chemical abundances of long-lived stars at the solar vicinity coupled with a chemical evolution model, allowed to derive a robust measurement of the Milky Way star formation history and to recognize that, in the Milky Way, the thick disc stellar population is as massive as its thin disc counterpart, suggesting a fundamental role of this component in the genesis of our Galaxy (Snaith et al. 2014, 2015).
That the thick disc is massive finds two independent confirmations.
-
1.
In the most recent thick disc scale length measurements: as discussed in Snaith et al. (2014), from the stellar surface densities derived from SEGUE (Bovy et al. 2012b, c) and assuming that the thick and thin discs separate at [/Fe] = 0.25 dex (on the SEGUE scale Bovy et al. 2012b), the thin disc contributes to the local stellar surface density, and the thick disc . Correcting for the scale length effect, the thick disc represents 47% of the stellar mass within 10 kpc of the galactic centre, in accordance with the estimates derived from the star formation history and chemical modeling.
-
2.
In the census of white dwarf stars at the solar vicinity : Fuhrmann et al. (2012) revised the fraction of local white dwarfs belonging to the thin and thick discs, respectively, finding a larger fraction of thick disc white dwarfs than what suggested by previous estimates. This finding, coupled with the different scale lengths and heights of the two populations, lead Fuhrmann et al. (2012) to the conclusion that the thin disc is not dominant in the Milky Way, and that very likely the two populations have equal masses.
The most recent findings thus point to the presence of a massive thick disc, as massive as the thin counterpart, whose density at the solar vicinity is not representative of the global thick-to-thin mass ratio, and which is mainly concentrated in the inner disc. Explaining the formation of such a massive and centrally concentrated component is of course challenging for any evolutionary model: it would require high mass fractions already in place at high redshift to sustain the prolonged star formation (Snaith et al. 2014, 2015; Haywood et al. 2015), it is at odds with secular evolution models which only predict a marginal contribution of the thick disc to the overall mass budget of the Galaxy (Minchev et al. 2012), it requires mergers and accretion events to be fine tuned enough to generate (or preserve?) kinematics-chemistry(-age) relations as those observed today on local and kpc-scale data (see Haywood et al. (2013); Bovy et al. (2012a); Bovy et al. (2012b, c) and Bird et al. (2013); Stinson et al. (2013) for predictions from cosmological models).
2.2 The thin disc
In the “classical” picture, the thin disc is the dominant and most massive stellar component of the Galaxy. Until few years ago, its kinematic and chemical properties were mostly known for stars at the solar vicinity. From kinematics studies, it has been inferred that the stars at the solar radius are significantly affected by the stellar Galactic bar : the Sun seems indeed to be located just outside the outer Lindblad resonance (hereafter OLR, see Dehnen 1999, 2000; Fux 2001; Minchev
et al. 2007), and several moving groups in the solar vicinity have been ascribed to the effect of bar resonances (Dehnen 2000; Chakrabarty 2007; Famaey et al. 2007; Famaey
et al. 2008; Antoja et al. 2009). For stars confined at about a hundred parsecs from the Sun, where ages have been determined with sufficient accuracy, data show the existence of velocity dispersions - age relations for disc stars, with the older the stars the higher their dispersions (Wielen 1977; Dehnen &
Binney 1998; Binney
et al. 2000; Nordström
et al. 2004; Seabroke &
Gilmore 2007), but note that some studies suggest a possible saturation for stars older than few Gyrs (Freeman 1991; Edvardsson et al. 1993; Gomez et al. 1997; Quillen &
Garnett 2001; Soubiran et al. 2008). These trends may be the signature of internal processes which kinematically heat stars over time (e.g. Spitzer &
Schwarzschild 1951; Lacey 1984; Carlberg &
Sellwood 1985; Kroupa 2002). But they may also reflect a much more global trend observed in all disc stars, belonging to the thin as well as to the thick disc population. These two populations, examined as a whole, show a continuous decrease of velocity dispersions with age, from the oldest thick disc stars to the youngest thin disc objects (Haywood et al. 2013). However, it is not clear how representative this relation is of the initial formation of the disc(s) and how much internal processes (heating by spiral arms, bar formation and buckling, etc) and accretion events may have changed it over time, also because different evolutionary scenarios may be able to produce similar relations at the present epoch (House
et al. 2011).
From the chemical point of view, the thin disc shows signatures of a complex formation history. Stars at the solar vicinity have a metallicity distribution which peaks around [Fe/H]0 (Haywood 2001), with the tails of the distribution extending from [Fe/H]-0.8 dex to super solar values. The large spread in metallicities of stars at the solar vicinity may be appreciated also looking at the age-metallicity relation: at any age, the dispersion is too significant to be explained simply by inhomogeneities in the interstellar medium at the time of formation of the different generations of stars (Haywood 2008; Haywood et al. 2013). Some other processes have been thus invoked. Radial migration (Roškar et al. 2008; Brunetti et al. 2011; Minchev et al. 2011; Brook
et al. 2012; Minchev
et al. 2013; Miranda
et al. 2015) has been, over the last ten years, the most popular scenario to explain the metallicity and abundance distributions of stars at the solar vicinity, starting from the early suggestion by Sellwood &
Binney (2002). N-body models have repeatedly found that radial migration (both blurring and churning, following the terminology of Schönrich
& Binney 2009a) is a global process, stimulated by the presence of one or multiple stellar asymmetries, and as such it should have naturally affected the whole disc. However, this seems at odds with a number of more recent findings (see, for example, Haywood et al. 2013; Halle et al. 2015, and the following of this section) that question the strength of radial migration and the spatial extent over which it is able to operate in our Galaxy.
Many studies are indeed revealing that the thin disc appears radially structured, with little contamination between the inner thin disc ( kpc, with being the in-plane distance from the Galactic centre) and the outer thin disc ( kpc). It is only in an intermediate region containing the solar radius ( kpc kpc) that the chemical patterns of the inner and outer disc coexist. This result is fundamental not only because it questions the borders of radial migration, but also for the comprehension of the bulge components. For this reason, I will devote the rest of the section in revising the evidence of this inner-outer disc dycothomy.
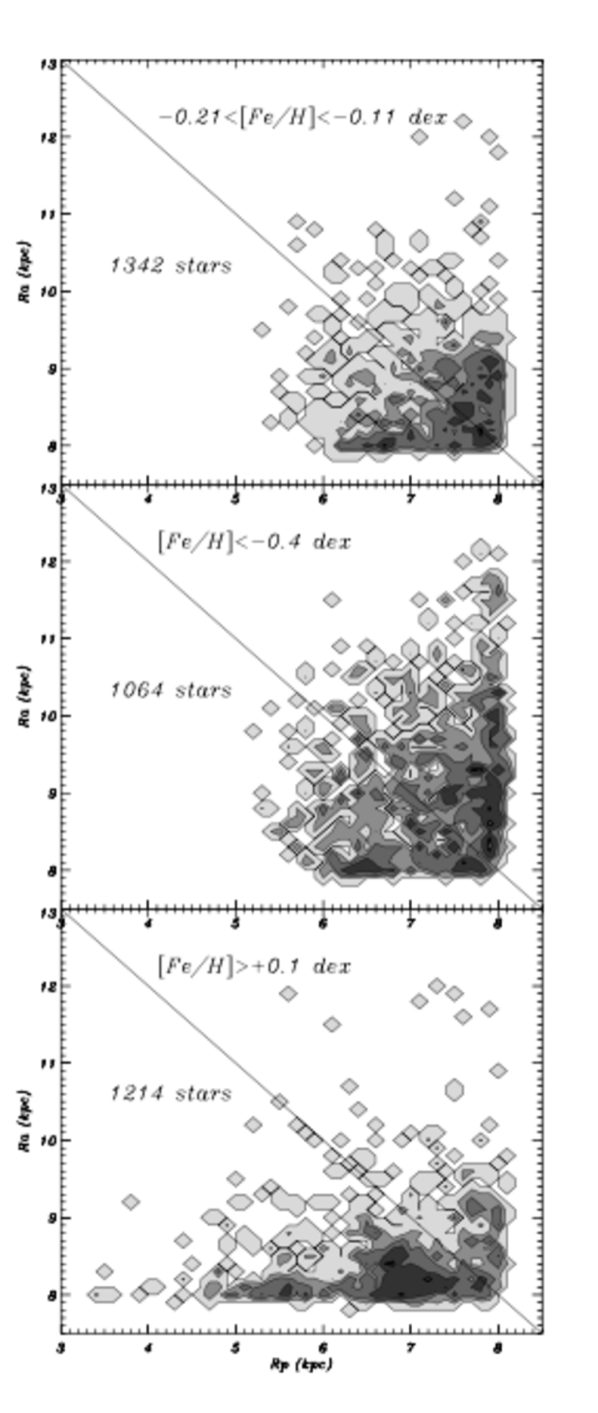
A first indication comes from the work of Haywood (2008), who shows that thin disc stars at the solar vicinity do not all share the same orbital properties: most of the metal-rich thin disc stars ([Fe/H] dex) found at the solar vicinity tend to have pericentres inside the solar radius, up to few kpc from the Galactic centre, and apocentres at or just outside the solar position, while metal-poor thin disc stars ([Fe/H] dex) have orbits which do not penetrate so much in the inner disc (their pericentres are usually above 6 kpc) and their apocentres extend much further out in the outer disc, up to 12 kpc from the Galaxy centre (see Fig. 4).
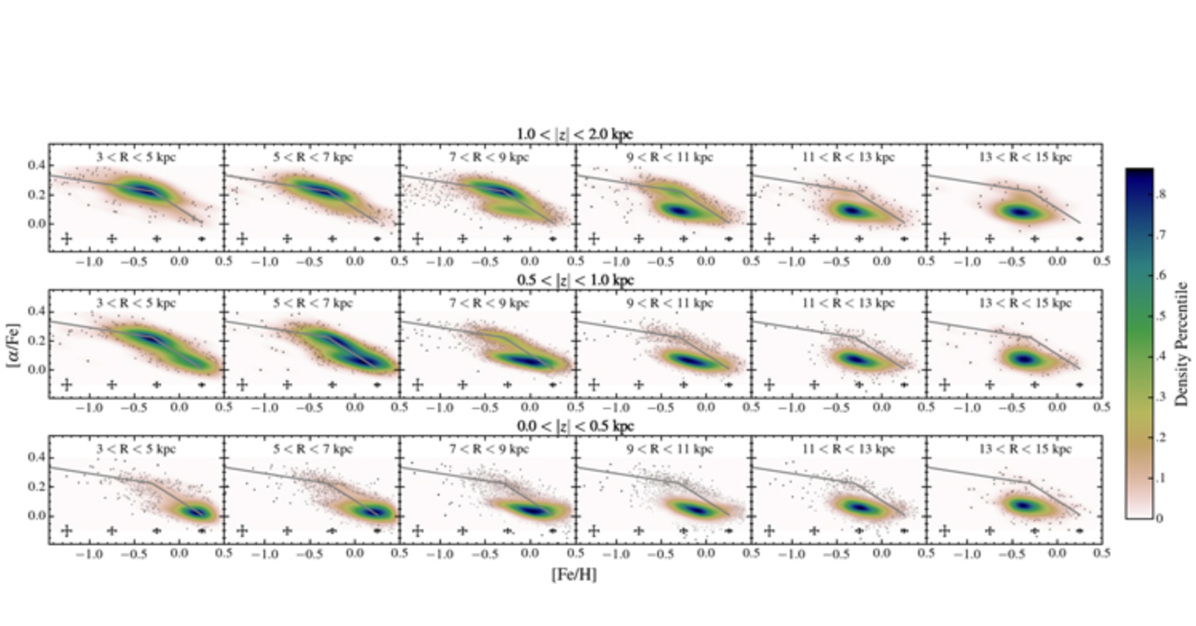
A second indication comes from the work of Bensby et al. (2011) : this study reveals that the (thin+thick discs) chemical patterns found at the solar radius are not representative of the whole disc. Only at the solar vicinity the two patterns – the one going from [/Fe]0.4 dex and [Fe/H]-1 dex to solar values, and the one going from [/Fe]0.2 dex and [Fe/H]-0.7 dex (red and blue lines, respectively, in Fig. 2 of their work)– coexist. In their inner disc sample, made of stars with distances from the galactic centre between 4 and 7 kpc, the second pattern is not present, while it is the only pattern that appears in the outer disc (distances between 9 and 13 kpc). In particular, it is striking to observe that metal-rich thin disc stars, present at the solar vicinity, are not found in the outer disc, at distances greater than kpc from the galaxy centre. In Haywood et al. (2013), we have re-investigated the question, calculating the ages of a high resolution spectroscopic sample of stars at the solar vicinity (from Adibekyan et al. 2012). From this study, we concluded that the inner ( kpc) and outer ( kpc) discs did not follow the same chemical evolution: at a given age, outer disc stars are more enriched than co-eval inner disc stars, and have metallicities up to dex lower. Having detailed chemical abundances and ages, in Snaith et al. (2014, 2015), we reconstructed the star formation histories of the inner and outer discs, showing that the outer disc started to form about 10 Gyr ago, from an interstellar medium whose metallicity was diluted by 0.3–0.4 dex with respect to the metallicity of the interstellar medium present in the inner disc at the same time. In Haywood et al. (2013), we proposed that the outer regions of the Milky Way possibly formed from a mixture of enriched material expelled from the thick disc, and of accreted, metal-poor gas. Afterwards, the evolution of the outer disc remained essentially disconnected from that of the inner disc. All these studies, except that of Bensby et al. (2011), have been based on the analysis of stars at the solar vicinity. The definite confirmation that this picture is correct, and that the chemical patterns of the inner and outer discs are different and co-exist only in the solar region comes from APOGEE. The distribution in the [-Fe]-[Fe/H] plane of about 70,000 stars in the APOGEE survey, spanning a large range of distances from the Sun, is shown in Hayden et al. (2015) and here reproduced in Fig. 5. This figure perfectly summarizes the points made in this section :
-
•
the enhanced thick disc is centrally concentrated – very few thick disc stars are indeed observed at distances greater than 10–11 kpc from the Galaxy centre;
-
•
in a 2-kpc wide region around the Sun, two chemical patterns are observed : one going from , metal-poor thick disc stars to solar [/Fe] and super–solar [Fe/H] values, the second pattern starting at [/Fe] dex and [Fe/H] dex with [Fe/H] increasing up to solar values. These two patterns co-exist only in a few kpc region around the Sun : in the outer disc the enhanced pattern disappears, while in the inner disc, it is the low- sequence which is not present.
There are at least two implications of these results which are of interest for our study:
-
•
Radial migration by churning (Sellwood & Binney 2002; Schönrich & Binney 2009a; Roškar et al. 2008; Minchev et al. 2013), that is the change of guiding radii of stars caused by the presence of one or multiple asymmetries in the stellar disc, has not been efficient in mixing stars of the inner ( kpc) and outer Milky Way disc ( kpc). The difference of chemical patterns of these two regions of the Galaxy, with an overlap only in a few-kpc zone around the Sun, implies that no siginificant migration of stars has occurred between these two regions. Whatever the formation scenario for the outer disc of the Milky Way is (gas/satellites accretion with a possible role of winds from the inner disc), and whatever the process that ignited star formation in those outer regions about 10 Gyr ago, some mechanism has prevented stars from migrating afterwards. In Halle et al. (2015), we propose that the mechanism that inhibited migration is dynamical and is related to the position of the bar OLR, position that is currently estimated to be just inside the solar radius. By using N-body models, we show indeed that the bar OLR limits the exchange of angular momentum, separating the disc in two distinct parts with minimal exchange, except in the transition zone, which is delimited by the position of the OLR at the epoch of the formation of the bar, and at the final epoch. This also implies that stars migrated in the bar/bulge region from the outer disc can originate in a region whose maximal extent is given by the final (i.e. current) position of the OLR (Di Matteo et al. 2014). Unless the Galaxy, over time, has experienced the formation of several bars, and/or strong spiral waves, with different pattern speeds (in that case the scenario would become much more complex), the picture is simple : only stars inside the solar region, where the OLR should be currently located, can have migrated in the inner disc and contributed to the bulge populations.
-
•
The chemical patterns of the inner disc are only part of the chemical patterns observed at the solar radius. When one compares the chemistry of bulge stars to those of disc stars, it is fundamental to take this result into account. In particular, if the comparison is done with the chemical patterns observed at the solar vicinity, the low- pattern of the metal-poor thin disc must not be taken into account in the comparison, simply because this pattern is typical of the outer disc and not of the region inside 6–7 kpc from the Galaxy centre. The chemical patterns of the bulge differ from those of the stellar disc at the solar vicinity as much as the latter differs from the chemical patterns of the inner disc. The difference in chemical patterns of the bulge and of the thin disc at the solar radius arises because the solar radius is not representative of the chemistry of the inner thin disc, not because the metal-rich bulge is a different population from the inner thin disc. In this respect, the enhancement of the bulge with respect to the thin disc found, for example, by Johnson et al. (2011); Gonzalez et al. (2015b) arises because the whole thin disc is included in the comparison, while the metal-poor thin disc present at the solar vicinity should be removed. Once this is done, the filiation between the inner thin disc and the metal-rich bulge becomes evident.
3 THE BULGE/BAR/DISC(S) CONNECTION IN N-BODY SIMULATIONS
The observational evidences recalled in the previous sections suggest to investigate the nature of the bulge and its stellar components in view of the recent discoveries about the disc(s) populations (Sects. 1 and 2). It is by quantifying and understanding the response of a thin+thick disc to bar formation and instabilities that we can solve the puzzle of the main (i.e. [Fe/H]) populations of the Galactic bulge.
In the following of this section, I will discuss three points, that are fundamental to me to understand why our current modeling of the Milky Way bulge is incomplete.
-
1.
N-body simulations which try to interpret the Milky Way bulge as the result of a bar instability in a pure thin disc galaxy fail in reproducing the chemo-kinematic relations, as found in the most recent surveys. They are successful in reproducing global trends, but not the trends satisfied by the individual bulge components. This failure has been evidenced in Di Matteo et al. (2015), and I will summarize here the main points made in that paper, after recalling the successes of the bulge/bar/thin disc scenario.
-
2.
If the Milky Way contains any classical bulge, its mass must be small (not more than 10%). Several independent N-body models have now reached this same conclusion, and this also means that the origin of the metal-poor populations which are significant in the bulge – 60% and more, depending on latitude, for stars with [Fe/H] dex; up to 40% for stars with [Fe/H] dex only; according to Ness et al. (2013a) – cannot be ascribed to the presence of a classical bulge, which makes 10% at most of the thin disc mass.
-
3.
Neither a pure thin disc model nor the inclusion of a low-mass classical bulge can explain the properties of the metal-poor component present in the bulge. It is only by adding the thick disc to the picture that we can naturally understand the vertical structuring of the bulge, the variation of metal-rich and metal-poor components with height, their relative weight, and the absence of a boxy/peanut-shaped structure for the metal-poor ( dex[Fe/H] dex) stars at latitudes . I will show this, by presenting the first results of N-body simulations which include a massive thick disc, and that have high enough resolution to allow to study in detail the mapping of a thin+thick disc into a boxy bulge.
3.1 The bar/bulge/thin disc connection : successes and failures
Successes
Because of the boxy/peanut-shaped nature of the Milky Way bulge and because of the marginal role that the thick disc was considered to play in the mass budget of the Galaxy until recently, all N-body models so far – except those of Bekki &
Tsujimoto (2011) – have modeled the visible Galaxy as a pure thin disc, with the possible inclusion of a classical bulge.
These models, which I will refer to also as “pure thin disc” models – even in the case they contain a small () classical bulge, as in Shen et al. (2010); Di Matteo
et al. (2015) – have been successful in reproducing a number of global characteristics of the Milky Way bulge, as its structure and X-shape, its kinematics and metallicity trends.
Martinez-Valpuesta & Gerhard (2011) and Gerhard
& Martinez-Valpuesta (2012), for example, showed how a pure thin disc model can be able to reproduce star counts observations in the Galactic plane, for the long bar, and in the inner regions of the boxy bulge ( and ), where a sudden change in the structure of the bulge is observed at (Nishiyama
et al. 2005; Gonzalez et al. 2011c). By means of a N-body model of a stellar bar grown from a thin disc, Ness et al. (2012) were able to explain the split in the distribution of red giant clump stars along the bar minor axis, as observed by ARGOS.
The pure thin disc model developed by Shen et al. (2010) has been successful in explaining the stellar kinematics of the bulge region from the BRAVA bulge survey (Howard et al. 2008), at latitudes and and longitudes . In particular, this N-body simulation reproduces the cylindrical rotation observed all over the analyzed fields and the corresponding trends in velocity dispersions. Kunder et al. (2012) confirmed this agreement, by comparing Shen et al. (2010) model to a more extended sample of stars from BRAVA at similar latitudes and longitudes. Similar results were obtained by Gardner et al. (2014), in their comparison with BRAVA, and by Zoccali et al. (2014), who used the pure thin disc N-body model presented in Martinez-Valpuesta & Gerhard (2011) and compared it with the bulge kinematics from the GIBS survey, extending the comparison between data and models also closer to the Galaxy mid-plane, at latitude . That a “pure thin disc” model is able to reproduce the global kinematics of the bulge has been also shown by Ness et al. (2013b), in their comparison with the ARGOS kinematics at latitudes and and by Di Matteo et al. (2015), who compared their N-body model to ARGOS and BRAVA data.
Such models have been shown to be able to reproduce also the vertical metallicity gradient, similar to those observed (Zoccali
et al. 2008; Gonzalez et al. 2011b, 2013; Ness
et al. 2013a). Martinez-Valpuesta & Gerhard (2013) indeed showed how an initial steep ( dex/kpc) radial metallicity gradient in the thin disc can be mapped into a comparable vertical metallicity gradient in the bulge: the most loosely bound stars, in the disc outskirts, are indeed preferentially redistributed at large heights from the plane, while more bound stars tend to be found at low latitudes (see also Di Matteo
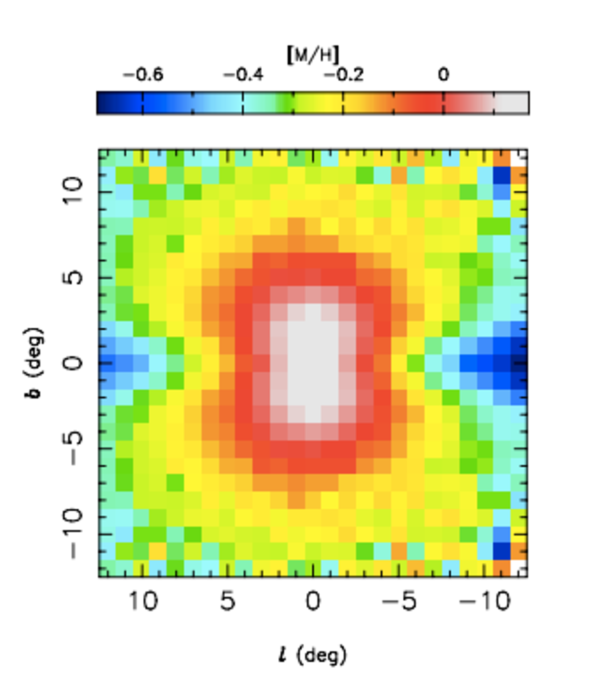
et al. 2014). This explain why, in a pure thin disc which has initially – before bar formation – a steep enough metallicity gradient, models predict also longitude-latitude metallicity maps remarkably similar to observations (see Fig. 6 and Martinez-Valpuesta & Gerhard 2013). I will comment in the following on the limitations of this scenario.
Finally, even if we are only starting to discover the spatial redistribution of stars with different ages in the Galactic bulge, the most recent findings (Bensby
et al. 2013; Dékány
et al. 2015) seem in agreement with models predictions about the presence of young stars close to the Galaxy mid-plane, as a consequence of the continuous star formation in the galactic thin disc (Ness et al. 2014).
Failures
In the scenario where the bulge formed from a pure thin disc, through the intermediate of a bar, it is fundamental that initially – i.e. before bar formation – the thin disc has a steep radial metallicity gradient ( dex/kpc as found by Martinez-Valpuesta & Gerhard (2013) and Di Matteo et al. (2015)). In this way, metal-poor stars originating at large radii in the thin disc are preferentially mapped at high latitudes in the Galactic bulge and give rise to a vertical gradient of about dex/deg, similar to the findings of Gonzalez et al. (2013). In this scenario, because all bulge stars have a thin disc origin, at a given latitude they should be all part of the boxy/peanut-shaped structure, independently on their metallicities. This fact has two consequences, which enter in conflict with the detailed structure and chemo-kinematic relations currently known for the bulge components :
-
1.
at a given latitude, all red clump stars in the Milky Way’s bulge with [Fe/H] dex should show a split in the distribution of their K-magnitudes, which is not observed;
-
2.
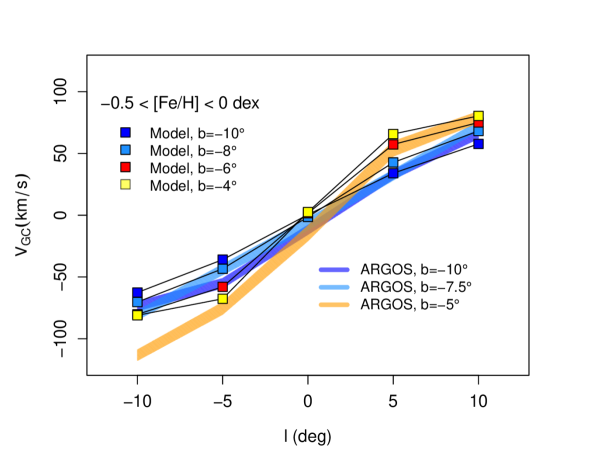
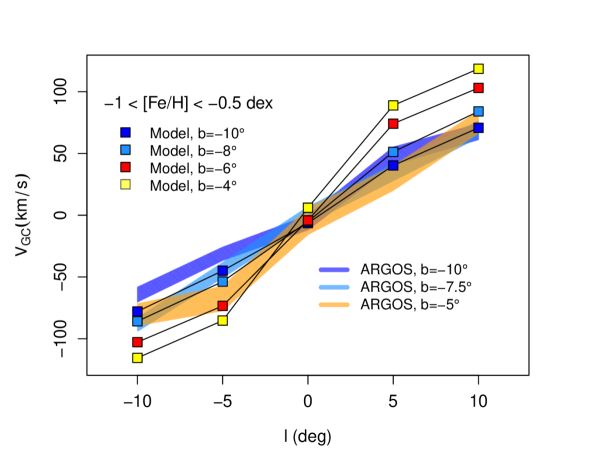
the metal-poor population (-1 dex [Fe/H] dex) should be a kinematically warm replica of the more metal rich ones (-0.5 dex [Fe/H]), which is not.
.
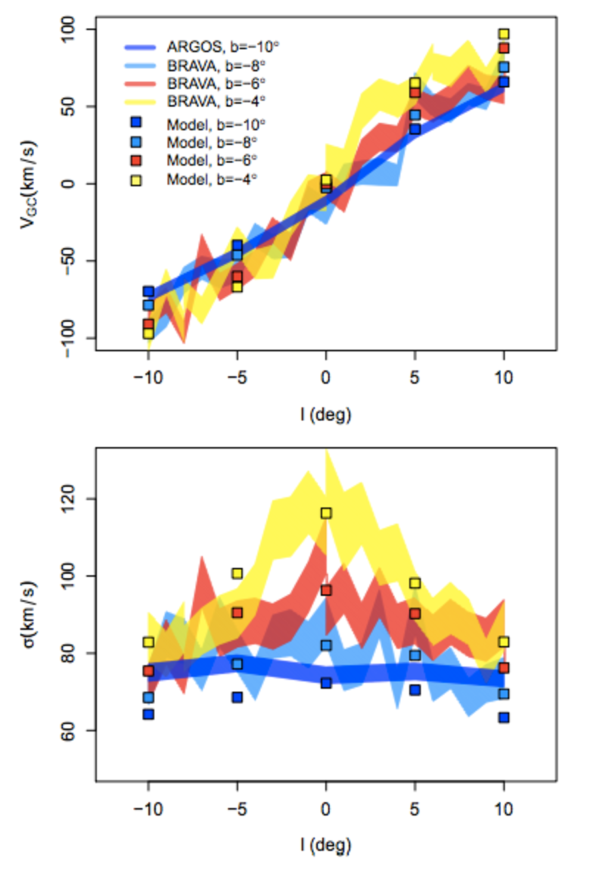
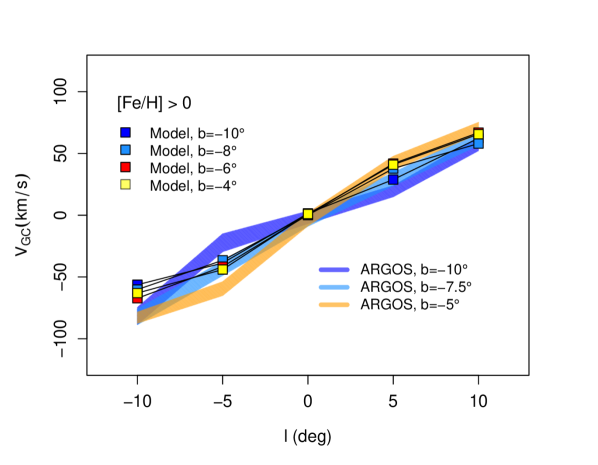
These failures have been presented and discussed in Di Matteo et al. (2015), where we have indeed shown how a “pure thin disc” model can reproduce the global kinematics and chemistry of the bulge, without reproducing the detailed chemo-kinematic and structural properties of its components. The problem is essentially related to the fact that, in such a scenario, metal-poor stars at any given latitude would contribute to the external part of the peanut and that they would have an angular momentum greater than that of more metal-rich stars (whose origin would be in the inner galaxy, given the initial radial metallicity gradient). A higher angular momentum for metal-poor stars would break the cylindrical rotation observed for this component, and would imply also a rotation curve different from that of the most metal-rich populations. This is not observed in the data, which on the contrary show that populations A, B and C all show cylindrical rotation and similar rotation curves. Moreover, because in this scenario metal-poor stars would have a thin disc origin, their velocity dispersion profiles would have a shape similar to those of the most metal-rich components, only shifted at higher absolute values. This again is not observed. As shown in Figs. 6, 7 and 8, even if successful in explaining global properties of the bulge, the “pure thin disc” model fails in reproducing the properties of its stellar components (Fig. 8). For a more extensive discussion on these points, I refer the reader to Di Matteo et al. (2014) and Di Matteo et al. (2015).
3.2 On the marginal role of any classical bulge in the Milky Way
If the metal-poor stars in the Milky Way bulge cannot have a thin disc origin, can they belong to a classical bulge ? Several N-body models, starting from those presented by Shen et al. (2010), and then Kunder
et al. (2012); Di Matteo
et al. (2014); Zoccali
et al. (2014), show that this is not a viable possibility. They all agree indeed in finding that the mass of any classical bulge present in the Galaxy must be small (10% at most). Shen et al. (2010), for example, showed that for higher mass ratios, the classical bulge would determine signatures in the global velocity dispersion profiles of stars in the bulge not compatible with BRAVA observations (see Fig. 4 in Shen et al. 2010). Subsequent works arrived to similar conclusions. Such a small classical bulge can explain neither the large fraction of metal poor-stars observed in the bulge, nor their increasing fraction with latitude. In Di Matteo
et al. (2014, Fig. 11), we have indeed shown that the contribution of a low-mass classical bulge to the total stellar density is maximal in the innermost regions of the bulge (typically inside 0.5 kpc, where it can account for 20% at most of the total local stellar density) and this fraction decreases with increasing latitude. The weight of such a classical bulge, and its trends with latitude, are significantly different from those observed for components B and/or C by Ness
et al. (2013a), excluding that a low-mass classical bulge can represent the bulk of these populations.
Moreover, a classical component would leave signatures in the kinematics of stars in the bulge. Even if stars in the classical bulge can acquire some angular momentum during the bar formation and evolution (see, for example Saha et al. 2012; Saha &
Gerhard 2013), these stars do not attain rotational velocities comparable to those of disc stars, whatever their location in the boxy structure. This is shown, for example, in Fig. 12 in Di Matteo
et al. (2014), but also in Fux (1997): in this latter model, the galactocentric radial velocity of the spheroidal component – whose mass is about 50% of that of the stellar disc – is about half the value found for disc stars in all bulge fields (see their Table 5 and their Fig. 16). This rules out the possibility that the bulk of the metal-poor stars in the Galactic bulge can be associated to a spheroid like that modeled by Fux (1997): if this was the case, metal-poor and metal-rich stars should show a significantly different amount of rotation, something excluded by the data (Ness
et al. 2013b, 2015).
3.3 On the bulge/bar/thin+thick disc connection : towards the solution ?
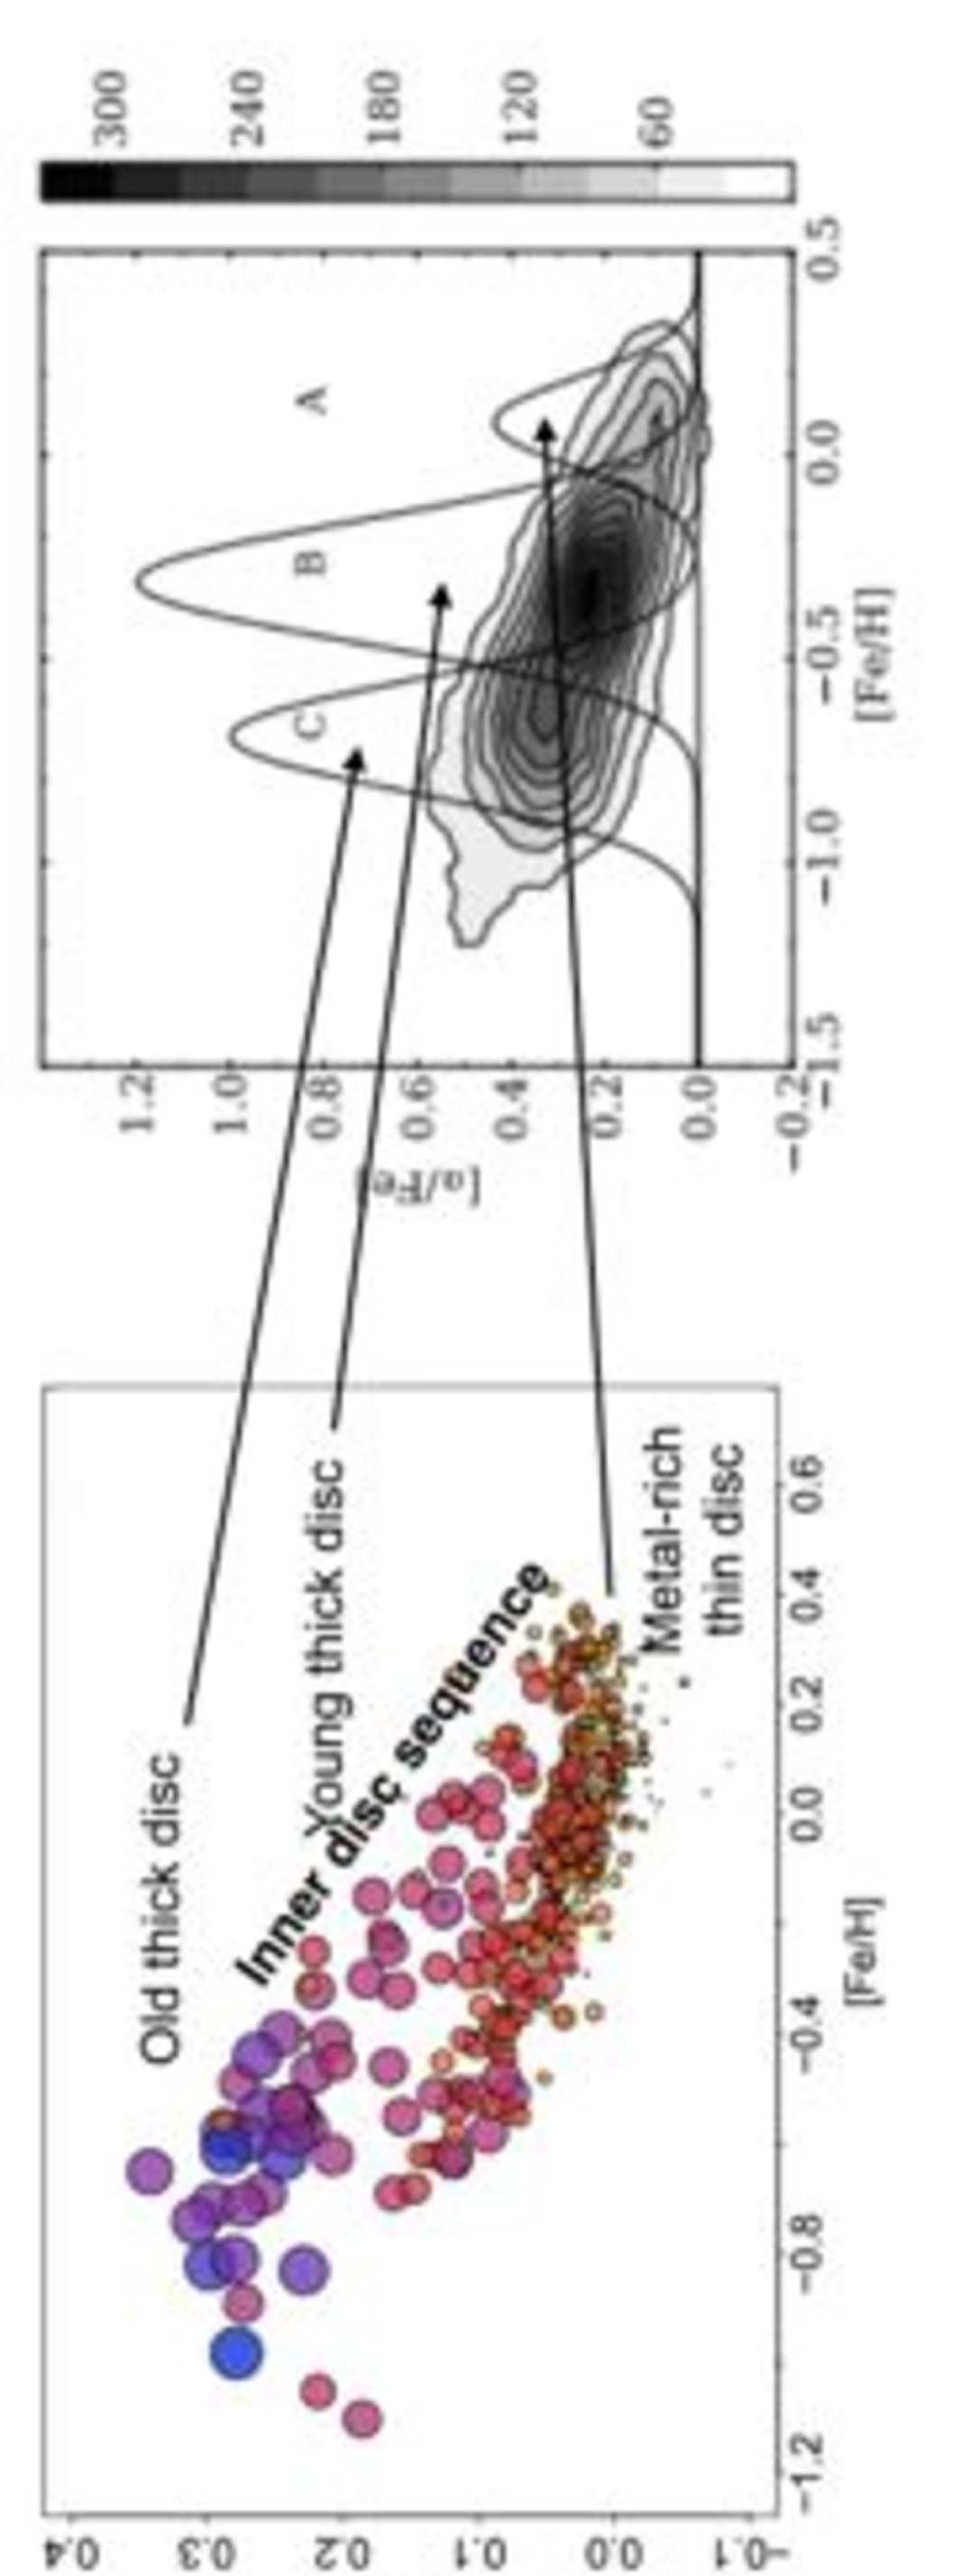
The previous discussion has shown that neither metal-poor thin disc stars trapped in the bar instability nor a classical bulge can explain the relative weight, fraction as a function of latitude, structure and kinematics of the metal-poor populations observed in the Galactic bulge. At the same time, we have learned from the evidences recalled in Sect. 2 that a thick disc is massively present in the inner regions of the Milky Way, and that is has [/Fe] and [Fe/H] compatible with those of stars in the bulge. This lead us to suggest in Di Matteo et al. (2014, 2015) that the Milky Way bulge is the result of the mapping of the thin+thick disc of the Galaxy into the boxy/peanut shaped structure. In this scenario, we can understand the chemical patterns present in the Galactic bulge already in terms of the chemical patterns of stars at the solar vicinity : the inner disc sequence is mapped into the boxy bulge, while the outer disc sequence, which – as we have seen – contains stars with pericentres slightly inside the solar radius, is not. More in details, we suggest that components A, B and C ad defined by Ness et al. (2013a) correspond, respectively, to the metal-rich thin disc, the young thick disc and the old thick disc, adopting the nomenclature of Haywood et al. (2013) and following the scheme presented here in Fig. 9, and already discussed in Di Matteo et al. (2014, 2015). Note that this scenario is somehow different from the one presented in Ness et al. (2013a): they indeed associate component C only with the thick disc, while in their interpretation component B should represent the early thin disc.
How to test the validity of this scheme with N-body simulations ? The recent observational results pose a challenge for idealized models, which have generally represented the stellar content of a Milky Way-type galaxy with a thin stellar disc and an optional bulge. The vertical structuring observed in the data, with a continuous sequence of “mono-abundance” populations, whose scale height depends on their [/Fe] and [Fe/H], needs to be captured somehow. A solution may be to use, as initial conditions, snapshots of Milky Way-like galaxies taken from cosmological simulations, where “mono-abundance” sequences have been indeed reproduced (Bird et al. 2013; Stinson et al. 2013). The limit of this approach is in the difficulty of investigating a large number of initial conditions, varying thin-to-thick disc ratios, for example, or disc(s) scale lengths and heights. To guarantee to have controlled sequences of (thin+thick) disc models, we have decided to follow a different approach, by constructing idealized galaxies, containing stellar discs of different scale heights and lengths, with masses and sizes in agreement with the most recent estimates for the Milky Way. In the following, I will show how the mapping of a thin+thick disc into a boxy/peanut-shaped bulge is done in one of these simulations, and the kind of trends it predicts. The disc galaxy modeled here is made of 25 million particles, redistributed among stars and dark matter. The stellar disc, made of 20 million particles, is structured in three components (hereafter called “thin”, “’intermediate” and “thick” discs, respectively) with scale heights varying from 0.3 kpc, to 0.6 kpc and 0.9 kpc, and with velocity dispersions at the solar vicinity similar to those observed for the thin, young thick and old thick disc, respectively (Haywood et al. 2013). The intermediate and thick disc together constitute 50% of the stellar mass in the modeled galaxy, with the remaining 50% being in the thin disc. I would like to highlight here that we chose to model only three disc components simply to identify three phases of an otherwise probably continuous chemical evolution. The same is valid for the Galactic bulge : components A, B and C have been found by fitting the bulge MDF with multiple gaussians (Ness et al. 2013a). But the existence of several components in the bulge MDF does not indicate necessarily that these components are really distinct. And indeed, the [/Fe] versus [Fe/H] plot of the ARGOS stars presented in Ness et al. (2013a) shows a continuity between the three components.
The modeled galaxy is evolved in isolation for 5 Gyr. It rapidly develops a stellar bar which buckles after a couple of Gyrs and forms a boxy/peanut-shaped bulge. A couple of results of this simulation seem worth mentioning in this context :
-
1.
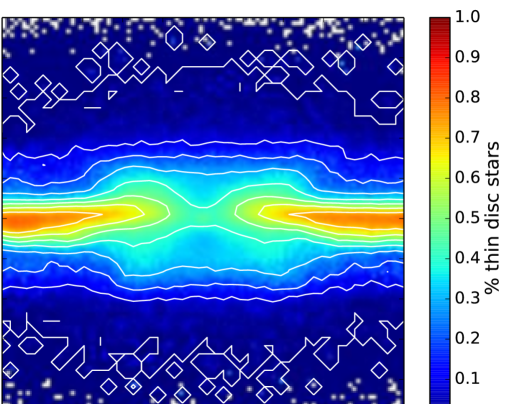
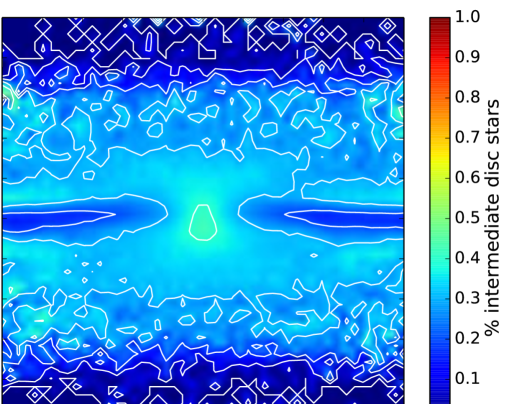
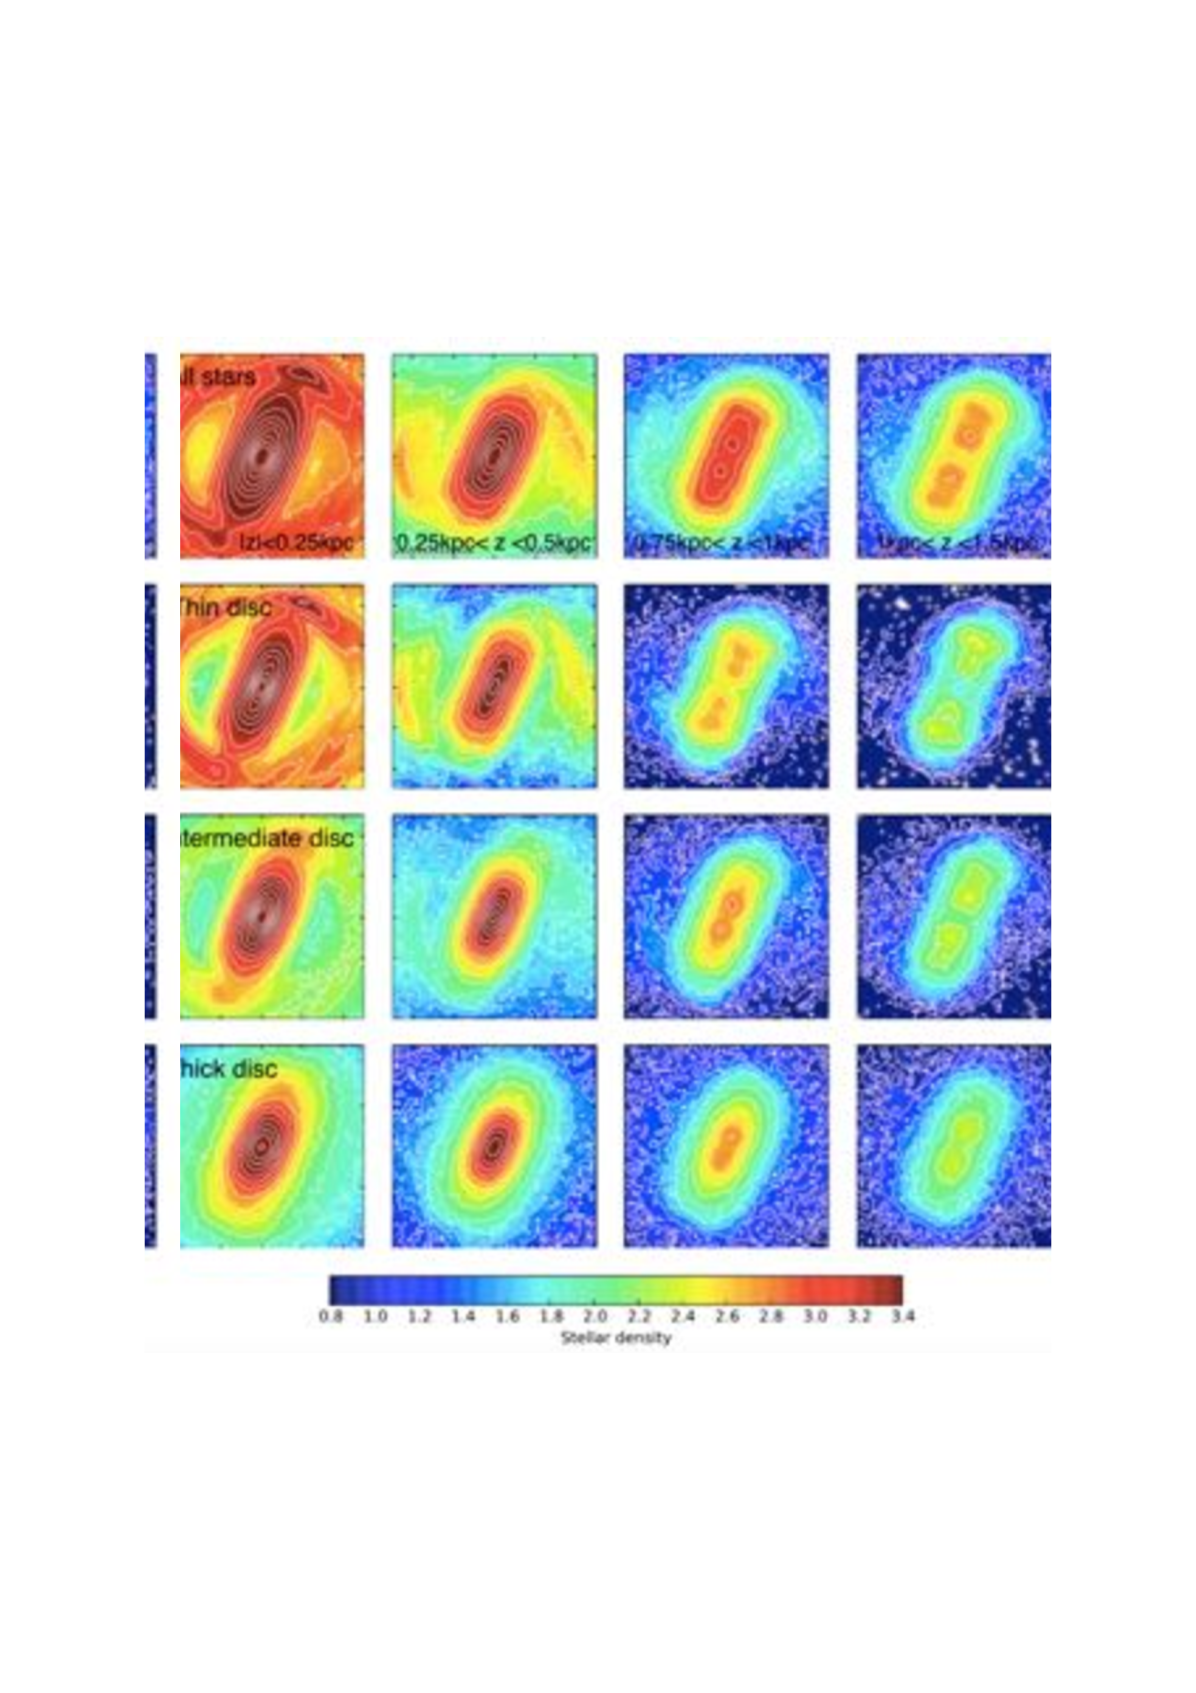
Stars of all components contribute to the stellar bar and to the boxy/peanut-shaped structure, but their relative weight depends on the characteristics of the initial stellar disc (i.e. kinematically cold or warm) and on the height above the plane (see Fig. 10). In particular, in our experiment, by integrating over the whole bulge extent, thin disc stars constitute 40% of the total stellar densities at 0.25 kpc, but this fraction diminishes to about 25% at kpc kpc. Thick disc stars show the opposite trend : they represent less than 20% of the total stellar density at 0.25 kpc, but their fraction rises to more than 40% at kpc kpc. Finally, the intermediate disc – which in our experiment should mimic the young thick disc following Haywood et al. (2013) nomenclature – has a weight which is nearly independent on the vertical distance from the plane : 40% at 0.25 kpc, 35% at kpc kpc. Note that at the highest distances from the plane, intermediate plus thick disc stars – which should mimic the young plus old thick disc, that is components B plus C in our scenario – constitute the great majority (75%) of the local stellar density. Even with the uncertainties still present in the model (thin-to-thick discs mass ratios, and in particular the fraction of young and old thick disc stars to the total thick disc mass; initial velocity dispersion profiles in the inner galaxy, etc), it is striking to see the similarity with the findings of Ness et al. (2013a). In particular the trends found for our thin and thick discs are reminiscent of those of populations A and C in Ness et al. (2013a), while our intermediate disc shows a weight whose nearly independence on the height above the plane is reminiscent of population B.
-
2.
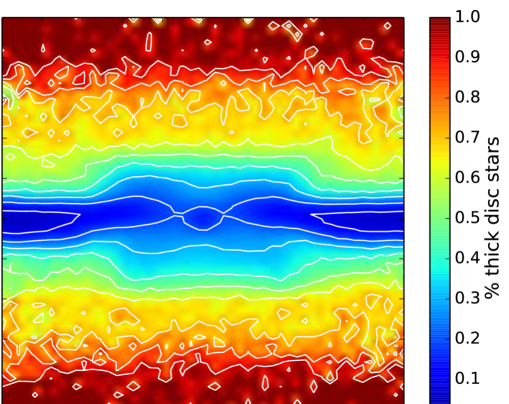
At a given height above the plane, the boxy/peanut shape is more pronounced in the kinematically cold populations than in the hottest one (see Fig. 11). In particular, in our experiment, a clear peanut-shape in the thick disc is only visible at large heights above the plane, greater than 1 kpc. This has two interesting implications.
Ness et al. (2013a) found that population C does not show any split in the K-magnitude distribution of stars at latitudes and , but interestingly at the maximum of the K-magnitude distribution of component C does not coincide with the Galaxy centre, but is shifted towards K-magnitude values similar to those where one of the two maxima of the peanut-shaped populations A and B is found (see Fig. 1 here reproduced from Ness et al. 2013a, and the previous discussion in Sect. 1). This may indicate the presence of a weak peanut-shape also in population C, but possibly visible only at larger distances from the Galactic plane than those explored by bulge surveys so far. A mapping of the outer bulge, at , would greatly help in understanding the morphology of the metal-poor bulge populations, and to clarify to what extent the characteristics that we have deduced for these stars from fields at are really representative of their ensemble.
The second implication has to do with the spatial distribution of bulge RR Lyrae stars. Dékány et al. (2013) found that, at latitudes , bulge RR Lyrae in the VVV survey do not show a strong barred distribution, as the one traced by metal-rich red clump stars at similar latitudes, but a more spherical shape (note however that, at similar latitudes, Pietrukowicz et al. (2012) found different results : their sample of RR Lyrae stars from the OGLE-III experiment shows a barred distribution similar to that of bulge red clump giants). It may be tempting to use these findings as indicative of the presence of a classical spheroid in the bulge. However, our model predicts that a different strength in the elongation of the bar in thick and thin disc stars is expected, especially at small heights above the plane. Thus, if a different spatial distribution was found between RR Lyrae with [Fe/H] dex – i.e. the RR Lyrae population with metallicities compatible with the thick disc – and metal-rich red clump giants in the bulge, this should not be taken as an indication of the presence of a classical spheroid in the bulge. As we show in Fig. 11, indeed, the thicker and kinematically warmer the disc is, the weaker and rounder its stellar bar. Also the absence of a clear bimodal distribution in RR Lyrae at can be understood in a scenario where the metal-rich (i.e. [Fe/H] dex) RR Lyrae component is related to the thick disc : indeed, as discussed in the previous point, the peanut-shaped morphology of thick disc stars appears only at large heights above the plane, and is not present at low latitudes, where not even the more metal-rich components of the bulge (A and B) show any split.
4 CONCLUSIONS
To understand the properties of the Galactic bulge and the way these properties change with metallicity, we need to place this structure in its environment, that is the Galactic stellar disc, and take into account the most recent findings about the latter. The stellar disc is vertically structured, with an enhanced, metal-poor and kinematically warm disc (the so-called thick disc) at least as massive as the thin counterpart, and mostly concentrated in the inner regions of the Galaxy. The disc is also radially structured, with chemical patterns that differ in the inner ( kpc) and outer ( kpc) regions. When this radial and vertical structuring are taken into account, the chemical similarity between the bulge and the disc becomes evident, and little room is left for the presence of any classical spheroid. N-body modeling aiming at understanding and explaining the chemo-kinematic and morphological properties of the different bulge components need to implement the new vision we have acquired of the Galactic disc(s) populations. First results about the modeling of a composite disc galaxy and its mapping into the bulge are presented and support the hypothesis of a pure (thin+thick) disc scenario for the origin of the vast majority (i.e. for stars with [Fe/H] dex) of the Milky Way bulge.
Acknowledgements.
These pages are the results of the work done in the last years with many collaborators, and I take this opportunity to thank all of them: F. Combes, A. Gómez, A. Halle, M. Haywood, D. Katz, M. Lehnert, B. Semelin, and O. Snaith. In particular, I need to thank M. Haywood for introducing me to the universe of the Galactic stellar populations, pushing me to look at the data from a new and fascinating perspective. A. Gómez is warmly thanked for the long time spent in producing Milky Way analogs from the simulations. Our science is always the results of many enriching discussions, and the ideas developed in this paper have benefited of the support and criticism of a number of colleagues that I wish to acknowledge : O. Gerhard, V. Hill, I. Martinez-Valpuesta, M.Ness, L. Origlia, A. Recio-Blanco, M. Schultheis, M. Zoccali. A special thank to F. Matteucci and C. Morossi, for organizing some of the most enriching meetings I have attended in the last years, and which have deeply contributed to shape the ideas presented in this paper. The ANR (Agence Nationale de la Recherche) is acknowledged for its financial support through the GalHis grant (P. I. : A. Robin) till 2013, and now by funding the MOD4Gaia project (ANR-15-CE31-0007). I am grateful to the Editor of this Special Issue on the Galactic bulge, B. Barbuy, for inviting me to write this contribution.References
- \definecolordarkbluergb0,0,0.597656
- Adibekyan et al. (2012) Adibekyan V. Z., Sousa S. G., Santos N. C., Delgado Mena E., González Hernández J. I., Israelian G., Mayor M., Khachatryan G., 2012, \textcolordarkblueA&A, 545, A32
- Alves-Brito et al. (2010) Alves-Brito A., Meléndez J., Asplund M., Ramírez I., Yong D., 2010, \textcolordarkblueA&A, 513, A35
- Antoja et al. (2009) Antoja T., Valenzuela O., Pichardo B., Moreno E., Figueras F., Fernández D., 2009, \textcolordarkblueApJ, 700, L78
- Athanassoula (2005) Athanassoula E., 2005, \textcolordarkblueMNRAS, 358, 1477
- Babusiaux & Gilmore (2005) Babusiaux C., Gilmore G., 2005, \textcolordarkblueMNRAS, 358, 1309
- Babusiaux et al. (2010) Babusiaux C., et al., 2010, \textcolordarkblueA&A, 519, A77
- Ballero et al. (2007) Ballero S. K., Matteucci F., Origlia L., Rich R. M., 2007, \textcolordarkblueA&A, 467, 123
- Bekki & Chiba (2001) Bekki K., Chiba M., 2001, \textcolordarkblueApJ, 558, 666
- Bekki & Tsujimoto (2011) Bekki K., Tsujimoto T., 2011, \textcolordarkblueApJ, 738, 4
- Benjamin et al. (2005) Benjamin R. A., et al., 2005, \textcolordarkblueApJ, 630, L149
- Bensby et al. (2010) Bensby T., et al., 2010, \textcolordarkblueA&A, 512, A41
- Bensby et al. (2011) Bensby T., Alves-Brito A., Oey M. S., Yong D., Meléndez J., 2011, \textcolordarkblueApJ, 735, L46
- Bensby et al. (2013) Bensby T., et al., 2013, \textcolordarkblueA&A, 549, A147
- Bensby et al. (2014) Bensby T., Feltzing S., Oey M. S., 2014, \textcolordarkblueA&A, 562, A71
- Bernkopf & Fuhrmann (2006) Bernkopf J., Fuhrmann K., 2006, \textcolordarkblueMNRAS, 369, 673
- Binney et al. (1997) Binney J., Gerhard O., Spergel D., 1997, MNRAS, 288, 365
- Binney et al. (2000) Binney J., Dehnen W., Bertelli G., 2000, \textcolordarkblueMNRAS, 318, 658
- Bird et al. (2013) Bird J. C., Kazantzidis S., Weinberg D. H., Guedes J., Callegari S., Mayer L., Madau P., 2013, \textcolordarkblueApJ, 773, 43
- Bissantz & Gerhard (2002) Bissantz N., Gerhard O., 2002, \textcolordarkblueMNRAS, 330, 591
- Bournaud et al. (2009) Bournaud F., Elmegreen B. G., Martig M., 2009, \textcolordarkblueApJ, 707, L1
- Bovy et al. (2012a) Bovy J., Rix H.-W., Hogg D. W., 2012a, \textcolordarkblueApJ, 751, 131
- Bovy et al. (2012b) Bovy J., Rix H.-W., Liu C., Hogg D. W., Beers T. C., Lee Y. S., 2012b, \textcolordarkblueApJ, 753, 148
- Bovy et al. (2012c) Bovy J., Rix H.-W., Hogg D. W., Beers T. C., Lee Y. S., Zhang L., 2012c, \textcolordarkblueApJ, 755, 115
- Bovy et al. (2015) Bovy J., Rix H.-W., Schlafly E. F., Nidever D. L., Holtzman J. A., Shetrone M., Beers T. C., 2015, preprint, (arXiv:1509.05796)
- Brook et al. (2004) Brook C. B., Kawata D., Gibson B. K., Freeman K. C., 2004, \textcolordarkblueApJ, 612, 894
- Brook et al. (2007) Brook C., Richard S., Kawata D., Martel H., Gibson B. K., 2007, \textcolordarkblueApJ, 658, 60
- Brook et al. (2012) Brook C. B., et al., 2012, \textcolordarkblueMNRAS, 426, 690
- Brown et al. (2010) Brown T. M., et al., 2010, \textcolordarkblueApJ, 725, L19
- Brunetti et al. (2011) Brunetti M., Chiappini C., Pfenniger D., 2011, \textcolordarkblueA&A, 534, A75
- Burkert et al. (1992) Burkert A., Truran J. W., Hensler G., 1992, \textcolordarkblueApJ, 391, 651
- Cabrera-Lavers et al. (2007) Cabrera-Lavers A., Hammersley P. L., González-Fernández C., López-Corredoira M., Garzón F., Mahoney T. J., 2007, \textcolordarkblueA&A, 465, 825
- Cao et al. (2013) Cao L., Mao S., Nataf D., Rattenbury N. J., Gould A., 2013, \textcolordarkblueMNRAS, 434, 595
- Carlberg & Sellwood (1985) Carlberg R. G., Sellwood J. A., 1985, \textcolordarkblueApJ, 292, 79
- Chakrabarty (2007) Chakrabarty D., 2007, \textcolordarkblueA&A, 467, 145
- Cheng et al. (2012) Cheng J. Y., et al., 2012, \textcolordarkblueApJ, 752, 51
- Chiappini et al. (1997) Chiappini C., Matteucci F., Gratton R., 1997, ApJ, 477, 765
- Chiappini et al. (1999) Chiappini C., Matteucci F., Beers T. C., Nomoto K., 1999, \textcolordarkblueApJ, 515, 226
- Chiba & Beers (2000) Chiba M., Beers T. C., 2000, \textcolordarkblueAJ, 119, 2843
- Clarkson et al. (2008) Clarkson W., et al., 2008, \textcolordarkblueApJ, 684, 1110
- Combes & Sanders (1981) Combes F., Sanders R. H., 1981, A&A, 96, 164
- Comerón et al. (2011) Comerón S., et al., 2011, \textcolordarkblueApJ, 741, 28
- Debattista et al. (2006) Debattista V. P., Mayer L., Carollo C. M., Moore B., Wadsley J., Quinn T., 2006, \textcolordarkblueApJ, 645, 209
- Dehnen (1999) Dehnen W., 1999, \textcolordarkblueApJ, 524, L35
- Dehnen (2000) Dehnen W., 2000, \textcolordarkblueAJ, 119, 800
- Dehnen & Binney (1998) Dehnen W., Binney J. J., 1998, \textcolordarkblueMNRAS, 298, 387
- Dékány et al. (2013) Dékány I., Minniti D., Catelan M., Zoccali M., Saito R. K., Hempel M., Gonzalez O. A., 2013, \textcolordarkblueApJ, 776, L19
- Dékány et al. (2015) Dékány I., et al., 2015, \textcolordarkblueApJ, 812, L29
- Di Matteo et al. (2011) Di Matteo P., Lehnert M. D., Qu Y., van Driel W., 2011, \textcolordarkblueA&A, 525, L3
- Di Matteo et al. (2014) Di Matteo P., et al., 2014, \textcolordarkblueA&A, 567, A122
- Di Matteo et al. (2015) Di Matteo P., et al., 2015, \textcolordarkblueA&A, 577, A1
- Diemand et al. (2005) Diemand J., Madau P., Moore B., 2005, \textcolordarkblueMNRAS, 364, 367
- Dwek et al. (1995) Dwek E., et al., 1995, \textcolordarkblueApJ, 445, 716
- Edvardsson et al. (1993) Edvardsson B., Andersen J., Gustafsson B., Lambert D. L., Nissen P. E., Tomkin J., 1993, A&A, 275, 101
- Famaey et al. (2007) Famaey B., Pont F., Luri X., Udry S., Mayor M., Jorissen A., 2007, \textcolordarkblueA&A, 461, 957
- Famaey et al. (2008) Famaey B., Siebert A., Jorissen A., 2008, \textcolordarkblueA&A, 483, 453
- Feltzing & Gilmore (2000) Feltzing S., Gilmore G., 2000, A&A, 355, 949
- Freeman (1987) Freeman K. C., 1987, \textcolordarkblueARA&A, 25, 603
- Freeman (1991) Freeman K. C., 1991, in Sundelius B., ed., Dynamics of Disc Galaxies. p. 15
- Freeman et al. (2013) Freeman K., et al., 2013, \textcolordarkblueMNRAS, 428, 3660
- Fuhrmann (1998) Fuhrmann K., 1998, A&A, 338, 161
- Fuhrmann (2004) Fuhrmann K., 2004, \textcolordarkblueAstronomische Nachrichten, 325, 3
- Fuhrmann (2008) Fuhrmann K., 2008, \textcolordarkblueMNRAS, 384, 173
- Fuhrmann et al. (2012) Fuhrmann K., Chini R., Hoffmeister V. H., Bernkopf J., 2012, \textcolordarkblueMNRAS, 420, 1423
- Fux (1997) Fux R., 1997, A&A, 327, 983
- Fux (2001) Fux R., 2001, \textcolordarkblueA&A, 373, 511
- García Pérez et al. (2013) García Pérez A. E., et al., 2013, \textcolordarkblueApJ, 767, L9
- Gardner et al. (2014) Gardner E., Debattista V. P., Robin A. C., Vásquez S., Zoccali M., 2014, \textcolordarkblueMNRAS, 438, 3275
- Gerhard & Martinez-Valpuesta (2012) Gerhard O., Martinez-Valpuesta I., 2012, \textcolordarkblueApJ, 744, L8
- Gilmore & Reid (1983) Gilmore G., Reid N., 1983, MNRAS, 202, 1025
- Gomez et al. (1997) Gomez A. E., Grenier S., Udry S., Haywood M., Meillon L., Sabas V., Sellier A., Morin D., 1997, in Bonnet R. M., et al., eds, ESA Special Publication Vol. 402, Hipparcos - Venice ’97. pp 621–624
- Gonzalez et al. (2011a) Gonzalez O. A., et al., 2011a, \textcolordarkblueA&A, 530, A54
- Gonzalez et al. (2011b) Gonzalez O. A., Rejkuba M., Zoccali M., Valenti E., Minniti D., 2011b, \textcolordarkblueA&A, 534, A3
- Gonzalez et al. (2011c) Gonzalez O. A., Rejkuba M., Minniti D., Zoccali M., Valenti E., Saito R. K., 2011c, \textcolordarkblueA&A, 534, L14
- Gonzalez et al. (2013) Gonzalez O. A., Rejkuba M., Zoccali M., Valent E., Minniti D., Tobar R., 2013, \textcolordarkblueA&A, 552, A110
- Gonzalez et al. (2015a) Gonzalez O. A., Zoccali M., Debattista V. P., Alonso-García J., Valenti E., Minniti D., 2015a, \textcolordarkblueA&A, 583, L5
- Gonzalez et al. (2015b) Gonzalez O. A., et al., 2015b, \textcolordarkblueA&A, 584, A46
- Guiglion et al. (2015) Guiglion G., et al., 2015, \textcolordarkblueA&A, 583, A91
- Halle et al. (2015) Halle A., Di Matteo P., Haywood M., Combes F., 2015, \textcolordarkblueA&A, 578, A58
- Hänninen & Flynn (2002) Hänninen J., Flynn C., 2002, \textcolordarkblueMNRAS, 337, 731
- Hayden et al. (2015) Hayden M. R., et al., 2015, \textcolordarkblueApJ, 808, 132
- Haywood (2001) Haywood M., 2001, \textcolordarkblueMNRAS, 325, 1365
- Haywood (2008) Haywood M., 2008, \textcolordarkblueMNRAS, 388, 1175
- Haywood et al. (2013) Haywood M., Di Matteo P., Lehnert M. D., Katz D., Gómez A., 2013, \textcolordarkblueA&A, 560, A109
- Haywood et al. (2015) Haywood M., Di Matteo P., Snaith O., Lehnert M. D., 2015, \textcolordarkblueA&A, 579, A5
- Haywood et al. (2016) Haywood M., Lehnert M. D., Di Matteo P., Snaith O., Schultheis M., Katz D., Gomez A., 2016, preprint, (arXiv:1601.03042)
- Hill et al. (2011) Hill V., et al., 2011, \textcolordarkblueA&A, 534, A80
- Holtzman et al. (1993) Holtzman J. A., et al., 1993, \textcolordarkblueAJ, 106, 1826
- House et al. (2011) House E. L., et al., 2011, \textcolordarkblueMNRAS, 415, 2652
- Howard et al. (2008) Howard C. D., Rich R. M., Reitzel D. B., Koch A., De Propris R., Zhao H., 2008, \textcolordarkblueApJ, 688, 1060
- Howard et al. (2009) Howard C. D., et al., 2009, \textcolordarkblueApJ, 702, L153
- Howes et al. (2014) Howes L. M., et al., 2014, \textcolordarkblueMNRAS, 445, 4241
- Howes et al. (2015) Howes L. M., et al., 2015, \textcolordarkblueNature, 527, 484
- Huang & Carlberg (1997) Huang S., Carlberg R. G., 1997, ApJ, 480, 503
- Inoue & Saitoh (2014) Inoue S., Saitoh T. R., 2014, \textcolordarkblueMNRAS, 441, 243
- Johnson et al. (2011) Johnson C. I., Rich R. M., Fulbright J. P., Valenti E., McWilliam A., 2011, \textcolordarkblueApJ, 732, 108
- Johnson et al. (2012) Johnson C. I., Rich R. M., Kobayashi C., Fulbright J. P., 2012, \textcolordarkblueApJ, 749, 175
- Johnson et al. (2014) Johnson C. I., Rich R. M., Kobayashi C., Kunder A., Koch A., 2014, \textcolordarkblueAJ, 148, 67
- Jurić et al. (2008) Jurić M., et al., 2008, \textcolordarkblueApJ, 673, 864
- Kormendy & Kennicutt (2004) Kormendy J., Kennicutt Jr. R. C., 2004, \textcolordarkblueARA&A, 42, 603
- Kroupa (2002) Kroupa P., 2002, \textcolordarkblueMNRAS, 330, 707
- Kunder et al. (2012) Kunder A., et al., 2012, \textcolordarkblueAJ, 143, 57
- Lacey (1984) Lacey C. G., 1984, MNRAS, 208, 687
- Lecureur et al. (2007) Lecureur A., Hill V., Zoccali M., Barbuy B., Gómez A., Minniti D., Ortolani S., Renzini A., 2007, \textcolordarkblueA&A, 465, 799
- Loebman et al. (2011) Loebman S. R., Roškar R., Debattista V. P., Ivezić Ž., Quinn T. R., Wadsley J., 2011, \textcolordarkblueApJ, 737, 8
- López-Corredoira et al. (2005) López-Corredoira M., Cabrera-Lavers A., Gerhard O. E., 2005, \textcolordarkblueA&A, 439, 107
- Lütticke et al. (2000) Lütticke R., Dettmar R.-J., Pohlen M., 2000, \textcolordarkblueA&AS, 145, 405
- Maihara et al. (1978) Maihara T., Oda N., Sugiyama T., Okuda H., 1978, PASJ, 30, 1
- Martinez-Valpuesta & Gerhard (2011) Martinez-Valpuesta I., Gerhard O., 2011, \textcolordarkblueApJ, 734, L20
- Martinez-Valpuesta & Gerhard (2013) Martinez-Valpuesta I., Gerhard O., 2013, \textcolordarkblueApJ, 766, L3
- Martinez-Valpuesta et al. (2006) Martinez-Valpuesta I., Shlosman I., Heller C., 2006, \textcolordarkblueApJ, 637, 214
- Mashonkina & Gehren (2001) Mashonkina L., Gehren T., 2001, \textcolordarkblueA&A, 376, 232
- Matteucci & Brocato (1990) Matteucci F., Brocato E., 1990, \textcolordarkblueApJ, 365, 539
- Matteucci & Romano (1999) Matteucci F., Romano D., 1999, \textcolordarkblueAp&SS, 265, 311
- McWilliam & Rich (1994) McWilliam A., Rich R. M., 1994, \textcolordarkblueApJS, 91, 749
- McWilliam & Rich (2004) McWilliam A., Rich R. M., 2004, Origin and Evolution of the Elements,
- McWilliam & Zoccali (2010) McWilliam A., Zoccali M., 2010, \textcolordarkblueApJ, 724, 1491
- Meléndez et al. (2008) Meléndez J., et al., 2008, \textcolordarkblueA&A, 484, L21
- Minchev et al. (2007) Minchev I., Nordhaus J., Quillen A. C., 2007, \textcolordarkblueApJ, 664, L31
- Minchev et al. (2011) Minchev I., Famaey B., Combes F., Di Matteo P., Mouhcine M., Wozniak H., 2011, \textcolordarkblueA&A, 527, A147
- Minchev et al. (2012) Minchev I., Famaey B., Quillen A. C., Dehnen W., Martig M., Siebert A., 2012, \textcolordarkblueA&A, 548, A127
- Minchev et al. (2013) Minchev I., Chiappini C., Martig M., 2013, \textcolordarkblueA&A, 558, A9
- Minchev et al. (2014) Minchev I., et al., 2014, \textcolordarkblueApJ, 781, L20
- Minchev et al. (2015) Minchev I., Martig M., Streich D., Scannapieco C., de Jong R. S., Steinmetz M., 2015, \textcolordarkblueApJ, 804, L9
- Minniti et al. (2010) Minniti D., et al., 2010, NewA, 15, 433
- Miranda et al. (2015) Miranda M. S., et al., 2015, preprint, (arXiv:1512.04559)
- Moster et al. (2010) Moster B. P., Macciò A. V., Somerville R. S., Johansson P. H., Naab T., 2010, \textcolordarkblueMNRAS, 403, 1009
- Moster et al. (2012) Moster B. P., Macciò A. V., Somerville R. S., Naab T., Cox T. J., 2012, \textcolordarkblueMNRAS, 423, 2045
- Nataf et al. (2010) Nataf D. M., Udalski A., Gould A., Fouqué P., Stanek K. Z., 2010, \textcolordarkblueApJ, 721, L28
- Ness & Freeman (2015) Ness M., Freeman K., 2015, preprint, (arXiv:1511.07438)
- Ness et al. (2012) Ness M., et al., 2012, \textcolordarkblueApJ, 756, 22
- Ness et al. (2013a) Ness M., et al., 2013a, \textcolordarkblueMNRAS, 430, 836
- Ness et al. (2013b) Ness M., et al., 2013b, \textcolordarkblueMNRAS, 432, 2092
- Ness et al. (2014) Ness M., Debattista V. P., Bensby T., Feltzing S., Roškar R., Cole D. R., Johnson J. A., Freeman K., 2014, \textcolordarkblueApJ, 787, L19
- Ness et al. (2015) Ness M., et al., 2015, preprint, (arXiv:1512.04948)
- Nishiyama et al. (2005) Nishiyama S., et al., 2005, \textcolordarkblueApJ, 621, L105
- Noguchi (1996) Noguchi M., 1996, \textcolordarkblueApJ, 469, 605
- Nordström et al. (2004) Nordström B., et al., 2004, \textcolordarkblueA&A, 418, 989
- Norris (1986) Norris J., 1986, \textcolordarkblueApJS, 61, 667
- Ojha (2001) Ojha D. K., 2001, \textcolordarkblueMNRAS, 322, 426
- Ojha et al. (1994) Ojha D. K., Bienayme O., Robin A. C., Mohan V., 1994, A&A, 290, 771
- Okuda et al. (1977) Okuda H., Maihara T., Oda N., Sugiyama T., 1977, \textcolordarkblueNature, 265, 515
- Ortolani et al. (1995) Ortolani S., Renzini A., Gilmozzi R., Marconi G., Barbuy B., Bica E., Rich R. M., 1995, \textcolordarkblueNature, 377, 701
- Pietrukowicz et al. (2012) Pietrukowicz P., et al., 2012, \textcolordarkblueApJ, 750, 169
- Purcell et al. (2009) Purcell C. W., Kazantzidis S., Bullock J. S., 2009, \textcolordarkblueApJ, 694, L98
- Qu et al. (2010) Qu Y., Di Matteo P., Lehnert M., van Driel W., Jog C. J., 2010, \textcolordarkblueA&A, 515, A11
- Qu et al. (2011) Qu Y., Di Matteo P., Lehnert M. D., van Driel W., 2011, \textcolordarkblueA&A, 530, A10
- Quillen & Garnett (2001) Quillen A. C., Garnett D. R., 2001, in Funes J. G., Corsini E. M., eds, Astronomical Society of the Pacific Conference Series Vol. 230, Galaxy Disks and Disk Galaxies. pp 87–88
- Quinn et al. (1993) Quinn P. J., Hernquist L., Fullagar D. P., 1993, \textcolordarkblueApJ, 403, 74
- Rattenbury et al. (2007) Rattenbury N. J., Mao S., Sumi T., Smith M. C., 2007, \textcolordarkblueMNRAS, 378, 1064
- Read et al. (2008) Read J. I., Lake G., Agertz O., Debattista V. P., 2008, \textcolordarkblueMNRAS, 389, 1041
- Reid (2005) Reid I. N., 2005, \textcolordarkblueARA&A, 43, 247
- Rich (1988) Rich R. M., 1988, \textcolordarkblueAJ, 95, 828
- Rich & Origlia (2005) Rich R. M., Origlia L., 2005, \textcolordarkblueApJ, 634, 1293
- Richard et al. (2010) Richard S., Brook C. B., Martel H., Kawata D., Gibson B. K., Sanchez-Blazquez P., 2010, \textcolordarkblueMNRAS, 402, 1489
- Robin et al. (2003) Robin A. C., Reylé C., Derrière S., Picaud S., 2003, \textcolordarkblueA&A, 409, 523
- Rojas-Arriagada et al. (2014) Rojas-Arriagada A., et al., 2014, \textcolordarkblueA&A, 569, A103
- Roškar et al. (2008) Roškar R., Debattista V. P., Stinson G. S., Quinn T. R., Kaufmann T., Wadsley J., 2008, \textcolordarkblueApJ, 675, L65
- Ryde et al. (2010) Ryde N., et al., 2010, \textcolordarkblueA&A, 509, A20
- Ryde et al. (2015) Ryde N., Schultheis M., Grieco V., Matteucci F., Rich R. M., Uttenthaler S., 2015, preprint, (arXiv:1510.02622)
- Saha & Gerhard (2013) Saha K., Gerhard O., 2013, \textcolordarkblueMNRAS, 430, 2039
- Saha et al. (2012) Saha K., Martinez-Valpuesta I., Gerhard O., 2012, \textcolordarkblueMNRAS, 421, 333
- Schönrich & Binney (2009a) Schönrich R., Binney J., 2009a, \textcolordarkblueMNRAS, 396, 203
- Schönrich & Binney (2009b) Schönrich R., Binney J., 2009b, \textcolordarkblueMNRAS, 399, 1145
- Seabroke & Gilmore (2007) Seabroke G. M., Gilmore G., 2007, \textcolordarkblueMNRAS, 380, 1348
- Sellwood & Binney (2002) Sellwood J. A., Binney J. J., 2002, \textcolordarkblueMNRAS, 336, 785
- Sellwood et al. (1998) Sellwood J. A., Nelson R. W., Tremaine S., 1998, \textcolordarkblueApJ, 506, 590
- Shen et al. (2010) Shen J., Rich R. M., Kormendy J., Howard C. D., De Propris R., Kunder A., 2010, \textcolordarkblueApJ, 720, L72
- Snaith et al. (2014) Snaith O. N., Haywood M., Di Matteo P., Lehnert M. D., Combes F., Katz D., Gómez A., 2014, \textcolordarkblueApJ, 781, L31
- Snaith et al. (2015) Snaith O., Haywood M., Di Matteo P., Lehnert M. D., Combes F., Katz D., Gómez A., 2015, \textcolordarkblueA&A, 578, A87
- Soto et al. (2007) Soto M., Rich R. M., Kuijken K., 2007, \textcolordarkblueApJ, 665, L31
- Soubiran et al. (2008) Soubiran C., Bienaymé O., Mishenina T. V., Kovtyukh V. V., 2008, \textcolordarkblueA&A, 480, 91
- Spitzer & Schwarzschild (1951) Spitzer Jr. L., Schwarzschild M., 1951, \textcolordarkblueApJ, 114, 385
- Stinson et al. (2013) Stinson G. S., et al., 2013, \textcolordarkblueMNRAS, 436, 625
- Terndrup (1988) Terndrup D. M., 1988, \textcolordarkblueAJ, 96, 884
- Tumlinson (2010) Tumlinson J., 2010, \textcolordarkblueApJ, 708, 1398
- Uttenthaler et al. (2012) Uttenthaler S., Schultheis M., Nataf D. M., Robin A. C., Lebzelter T., Chen B., 2012, \textcolordarkblueA&A, 546, A57
- Valenti et al. (2013) Valenti E., Zoccali M., Renzini A., Brown T. M., Gonzalez O. A., Minniti D., Debattista V. P., Mayer L., 2013, \textcolordarkblueA&A, 559, A98
- Van der Swaelmen et al. (2016) Van der Swaelmen M., Barbuy B., Hill V., Zoccali M., Minniti D., Ortolani S., Gómez A., 2016, \textcolordarkblueA&A, 586, A1
- Velazquez & White (1999) Velazquez H., White S. D. M., 1999, \textcolordarkblueMNRAS, 304, 254
- Vera-Ciro et al. (2014) Vera-Ciro C., D’Onghia E., Navarro J., Abadi M., 2014, \textcolordarkblueApJ, 794, 173
- Villalobos & Helmi (2008) Villalobos Á., Helmi A., 2008, \textcolordarkblueMNRAS, 391, 1806
- Villalobos & Helmi (2009) Villalobos Á., Helmi A., 2009, \textcolordarkblueMNRAS, 399, 166
- Walker et al. (1996) Walker I. R., Mihos J. C., Hernquist L., 1996, \textcolordarkblueApJ, 460, 121
- Wegg & Gerhard (2013) Wegg C., Gerhard O., 2013, \textcolordarkblueMNRAS, 435, 1874
- Wegg et al. (2015) Wegg C., Gerhard O., Portail M., 2015, \textcolordarkblueMNRAS, 450, 4050
- Weiland et al. (1994) Weiland J. L., et al., 1994, \textcolordarkblueApJ, 425, L81
- Wielen (1977) Wielen R., 1977, A&A, 60, 263
- Wyse & Gilmore (1986) Wyse R. F. G., Gilmore G., 1986, \textcolordarkblueAJ, 91, 855
- Zhao et al. (1994) Zhao H., Spergel D. N., Rich R. M., 1994, \textcolordarkblueAJ, 108, 2154
- Zoccali et al. (2003) Zoccali M., et al., 2003, \textcolordarkblueA&A, 399, 931
- Zoccali et al. (2006) Zoccali M., et al., 2006, \textcolordarkblueA&A, 457, L1
- Zoccali et al. (2008) Zoccali M., Hill V., Lecureur A., Barbuy B., Renzini A., Minniti D., Gómez A., Ortolani S., 2008, \textcolordarkblueA&A, 486, 177
- Zoccali et al. (2014) Zoccali M., et al., 2014, \textcolordarkblueA&A, 562, A66
- de Grijs (1998) de Grijs R., 1998, \textcolordarkblueMNRAS, 299, 595
- de Jong et al. (2010) de Jong J. T. A., Yanny B., Rix H.-W., Dolphin A. E., Martin N. F., Beers T. C., 2010, \textcolordarkblueApJ, 714, 663
- van der Kruit & Searle (1982) van der Kruit P. C., Searle L., 1982, A&A, 110, 61