11email: sabine.koenig@chalmers.se 22institutetext: Department of Astronomy, University of Wisconsin, 475 N. Charter Street, Madison, WI, 53706, USA33institutetext: University of Manchester, Jodrell Bank Centre for Astrophysics, Oxford Road, Manchester, M13 9PL, UK44institutetext: Infrared Processing and Analysis Center, MS 100-22, California Institute of Technology, Pasadena, CA, 91125, USA55institutetext: NRAO, 520 Edgemont Road, Charlottesville, VA, 22903, USA66institutetext: University of Virginia, Charlottesville, VA, 22904, USA
Deep ALMA imaging of the merger NGC 1614
Abstract
Aims. Observations of the molecular gas over scales of 0.5 to several kpc provide crucial information on how molecular gas moves through galaxies, especially in mergers and interacting systems, where it ultimately reaches the galaxy center, accumulates, and feeds nuclear activity. Studying the processes involved in the gas transport is one of the important steps forward to understand galaxy evolution.
Methods. 12CO, 13CO 10, and C18O high-sensitivity ALMA observations (4′′ 2′′) were used to assess the properties of the large-scale molecular gas reservoir and its connection to the circumnuclear molecular ring in the merger NGC 1614. Specifically, the role of excitation and abundances were studied in this context. We also observed the molecular gas high-density tracers CN and CS.
Results. The spatial distributions of the detected 12CO 10 and 13CO 10 emission show significant differences. 12CO traces the large-scale molecular gas reservoir, which is associated with a dust lane that harbors infalling gas, and extends into the southern tidal tails. 13CO emission is – for the first time – detected in the large-scale dust lane. In contrast to 12CO, its line emission peaks between the dust lane and the circumnuclear molecular ring. A 12CO-to-13CO 10 intensity ratio map shows high values in the ring region (30) typical for the centers of luminous galaxy mergers and even more extreme values in the dust lane (45). Surprisingly, we do not detect C18O emission in NGC 1614 – but we do observe gas emitting the high-density tracers CN and CS.
Conclusions. We find that the 12CO-to-13CO 10 line ratio in NGC 1614 changes from 45 in the 2 kpc dust lane to 30 in the starburst nucleus. This drop in ratio with decreasing radius is consistent with the molecular gas in the dust lane being kept in a diffuse, unbound state while it is being funneled towards the nucleus. This also explains why there are no (or very faint) signs of star formation in the dust lane, despite its high 12CO-luminosity. In the inner 1.5 kpc, the gas is compressed into denser and likely self-gravitating clouds (traced by CN and CS emission), allowing it to power the intense central starburst. We find a high 16O-to-18O abundance ratio in the starburst region (900), typical of quiescent disk gas. This is surprising since, by now, the starburst is expected to have enriched the nuclear interstellar medium in 18O relative to 16O. We suggest that the massive inflow of gas may be partially responsible for the low 18O/16O abundance since it will dilute the starburst enrichment with unprocessed gas from greater radial distances. The 12CO-to-13CO abundance of 90 we infer from the line ratio is consistent with this scenario. It suggests that the nucleus of NGC 1614 is in a transient phase of its evolution where the starburst and the nuclear growth is still being fuelled by returning gas from the minor merger event.
Key Words.:
galaxies: evolution – galaxies: individual: NGC 1614 – galaxies: starburst – galaxies: active – radio lines: galaxies – ISM: molecules1 Introduction
| observable | observing frequency | beam | channel width | sensitivity | integrated intensity | peak flux | |
|---|---|---|---|---|---|---|---|
| [GHz] | [km s-1] | [mJy beam-1] | [Jy] | ||||
| continuum | 105.0 | 4.′′46 1.′′68 | – | 0.06 | 12.90.8 mJy | – | |
| 12CO 10 | 113.5 | 4.′′38 1.′′84 | 10 | 1.6 | 2411.0 Jy km s-1 | 1.10.02 | |
| CN 10 = 3/21/2 | 111.4 | 4.′′06 1.′′61 | 10 | 1.3 | 3.81.0 Jy km s-1 | 0.0170.003 | |
| CN 10 = 1/21/2 | 111.7 | 4.′′06 1.′′61 | 10 | 1.3 | 7.21.0 Jy km s-1 | 0.0270.003 | |
| \hdashline 13CO 10 | 108.5 | 4.′′18 2.′′24 | 10 | 1.4 | 6.61.0 Jy km s-1 | 0.040.004 | |
| C18O 10 | 108.1 | 4.′′20 2.′′25 | 60 | 0.8 | 0.1 Jy km s-1 | – | |
| CS 21 | 96.4 | 4.′′65 2.′′55 | 30 | 0.8 | 1.31.0 Jy km s-1 | 0.0080.001 |
Minor mergers, which are close galaxy interactions where the partners have an unequal mass ratio, constitute the majority of interacting events in the Universe. The gas accretion and nuclear feeding mechanisms of these mergers are different from major mergers (equal-mass interactions, e.g., Naab et al. 2009). Minor mergers are important for our understanding of galaxy evolution. In particular, they provide insights into how high-redshift spheroidal galaxies evolve into systems at low-redshift, such as local elliptical galaxies, and the formation of galaxy bulges (e.g., Naab et al. 2009; Weinzirl et al. 2009). In minor mergers, gas introduced into the interacting system by the disturbing companion can generally be found at large radii from the center of the merger remnant (Bournaud et al. 2005). Stellar bars, causing gravitational torques to affect the gas, and/or tidal torques invoked by the disturbing companion, may lead to the transport of the molecular gas along the large-scale dust lanes to the mergers center, with this material acting to fuel both star formation and nuclear accretion (e.g., Simkin et al. 1980; Scoville et al. 1985; Jogee 2006; Weinzirl et al. 2009). There the gas may form polar rings that can appear as dust lanes when seen edge-on (e.g., Combes 1988; Shlosman et al. 1989). We have found evidence that gas is funneled along polar rings (Aalto & Hüttemeister 2000; Aalto et al. 2010; König et al. 2013, 2014). Tracing this gas is vital to understand the underlying galaxy-evolution and star-formation mechanisms in this class of mergers. Spectral lines of molecular isotopologs (isotopic variants) can be used to study the effect of infall, enrichment and gas physical conditions. Elevated line ratios between the 12C and 13C variants of CO have, for example, been proposed to indicate a replenishment of relatively unprocessed disk gas (e.g., Casoli et al. 1992; Henkel & Mauersberger 1993; Taniguchi et al. 1999). However, the ratio cannot be used to infer values on 12C/13C without taking effects of optical depth and line excitation (temperature, line width) into account. For example, 12CO/13CO line ratios may be low in quiescent disk gas and higher in hot nuclear gas without a change in 12C/13C abundances, or even with the opposite abundance gradient (e.g., Aalto et al. 1995, 1997; Davis et al. 2015). Dynamical effects are also found to have a strong influence on the observed 12CO/13CO line ratios (e.g., Tosaki et al. 2002; Meier & Turner 2004; Aalto et al. 2010). In addition, issues of selective photo destruction also need to be addressed (e.g., Aalto et al. 1995). Isotopic variants of oxygen, 16O and 18O, are used to trace enrichment by massive stars (e.g., Henkel & Mauersberger 1993; González-Alfonso et al. 2014; Falstad et al. 2015). González-Alfonso et al., for example, found very high 18O abundances in the nearby ULIRG quasar Mrk~231 which they attributed to an evolved nuclear starburst. NGC 1614 (D = 64 Mpc, 1′′ = 310 pc, L8-1000μm 4 1011 L, Sanders et al. 2003) is a minor merger that shows intense nuclear activity and a complex morphology, with a minor axis dust lane crossing the optical body close to the nucleus. The presence of a circumnuclear ring ( 300 pc) has been reported from different tracers, for example Pa (Alonso-Herrero et al. 2001), PAH (Väisänen et al. 2012), multiple transitions of CO at mm wavelengths (König et al. 2013; Sliwa et al. 2014; Xu et al. 2015), and in the radio continuum (e.g., Olsson et al. 2010; König et al. 2013). Most of the nuclear activity originates from a very young starburst residing in the ring itself (6–7 Myr, Puxley & Brand 1999; Kotilainen et al. 2001; Schwartz & Martin 2004) and an older starburst at its center ( 10 Myr, Alonso-Herrero et al. 2001). Two competing formation scenarios for the ring have been proposed: a “wildfire”scenario (Alonso-Herrero et al. 2001) where the ring is the result of an outward propagating starburst, or that the ring is formed at the location of a Lindblad resonance and is fueled by gas moving in along the dust lanes onto the ring (König et al. 2013). A number of emission lines tracing different physical conditions originate from the molecular gas in NGC 1614. A considerable fraction of the total molecular gas resides in the central dust lanes but is not involved in the nuclear activity (12CO 10, Olsson et al. 2010; Sliwa et al. 2014; García-Burillo et al. 2015). Further studies of the 12CO 10 have revealed a molecular outflow in NGC 1614 (García-Burillo et al. 2015). In our previous high-resolution CO studies of NGC 1614 we not only discovered molecular gas in the starburst ring traced by CO 21, but also that the majority of the CO emission of NGC 1614 is located in the dust lane and is apparently not star forming. We suggested that the gas here may be infalling and in a diffuse, unbound state. To investigate the nature of the large-scale molecular gas of the nearby merger NGC 1614 we obtained high-sensitivity ALMA 12CO, 13CO, and C18O 10 data. We also detected CN 10 and CS 21. In this paper we present the results of a study of the properties of the molecular gas within a radius of 3 kpc in NGC 1614. An analysis of our higher angular resolution ALMA data will be presented in a later paper.Throughout the paper, we are concerned with pure rotational transitions of the observed molecules between upper state = and lower state = that are labeled . Section 2 describes the observations and the data analysis, in Sect. 3 the results of the observations are presented, and we discuss their implications in Sect. 4.
2 Observations, data reduction and analysis


NGC~1614 was observed with the the Atacama Large Millimeter/submillimeter Array (ALMA) in band 3 (3 mm) as part of Cycle 2 observations of project 2013.1.00991.S (PI: S. König). Here we focus on the data obtained with the ALMA Compact Array (ACA) and the ALMA main array in compact configuration. The ACA observations took place on 2014 June 16 and 30, the ALMA compact configuration observations on 2014 December 4 and 5. The phase center of the observations was located at =04:34:00.02688 and =08.34.44.5692 (J2000). Two tunings were obtained centered on 113.5 GHz and 108.5 GHz, where the redshifted frequencies of the 12CO 10 and 13CO 10 lines are located. Other lines observed within the ALMA band are C18O 10, CN 10 and CS 21. The 3 mm continuum was reconstructed using line-free channels. We used four spectral windows of 1.875 GHz bandwidth (5000 km s-1) each, with a velocity resolution of 5 km s-1, after Hanning smoothing. During the observations, different sources were observed for calibration purposes: Uranus as flux calibrator, J0339-0146 as bandpass calibrator, and J0423-0120 as bandpass and phase calibrator. With baseline lengths of between 8.8 m and 49.0 m, the ACA data are sensitive to scales smaller than 38′′. The compact configuration main array ALMA data are sensitive to scales smaller than 22′′ (baselines: 15.0 m 390 m). For all emission lines, sets of visibilities from ACA and the compact configuration observations were combined by weighting the individual data sets in the uv plane to guarantee a continuous amplitude vs. uv-distance distribution. The combined data set was then deconvolved using the “clean” task in CASA, and individual data cubes were created for each observable (continuum and emission lines). The resulting beam sizes and sensitivities are shown in Table 1. After calibration and imaging within CASA111http://casa.nrao.edu/ (McMullin et al. 2007), both visibility sets were converted into FITS format and imported in the GILDAS/MAPPING222http://www.iram.fr/IRAMFR/GILDAS for further analysis. All integrated intensity maps in this paper are moment-zero maps. To obtain the 12CO-to-13CO 10 map in Fig. 6 we used the integrated intensity maps of the two emission line distributions without a-priori clipping. The resulting maps were smoothed to a common beam at 5′′ 5′′, and then the ratio map was obtained on a pixel-by-pixel basis. Only pixels with signal-to-noise ratios equal to or higher than 5 in the ratio map were taken into account and are depicted in the resulting image.
3 Results
3.1 3 mm continuum
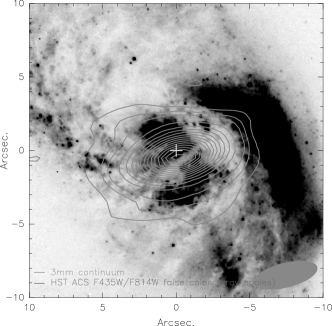
The 3 mm continuum (Fig. 1) is centrally peaked at the nucleus of NGC 1614. The total integrated flux recovered from the area enclosed by the the 3 contours in the uniformly weighted map is 12.9 mJy. The size and structure of the distribution, however, show more extended features as well. The emission seems to be elongated with a northeast-southwest direction similar to what was observed for 12CO 10 previously (Olsson et al. 2010; Sliwa et al. 2014). The continuum emission is clearly associated with the bulk of the 12CO emission, but also with the dust lanes in the center of NGC 1614. Previously published observations of the 1.3 mm continuum (Wilson et al. 2008; König et al. 2013) show a more compact distribution (6-7′′) of the emission, even with comparable spatial resolution. This might be partially due to the excellent continuum sensitivity in our observations compared to previous data sets, but it could also be that the continuum at higher frequencies is more associated with the gas in the molecular ring (König et al. 2013) than the larger-scale molecular gas reservoir (Olsson et al. 2010; Sliwa et al. 2014).
3.2 12CO 10
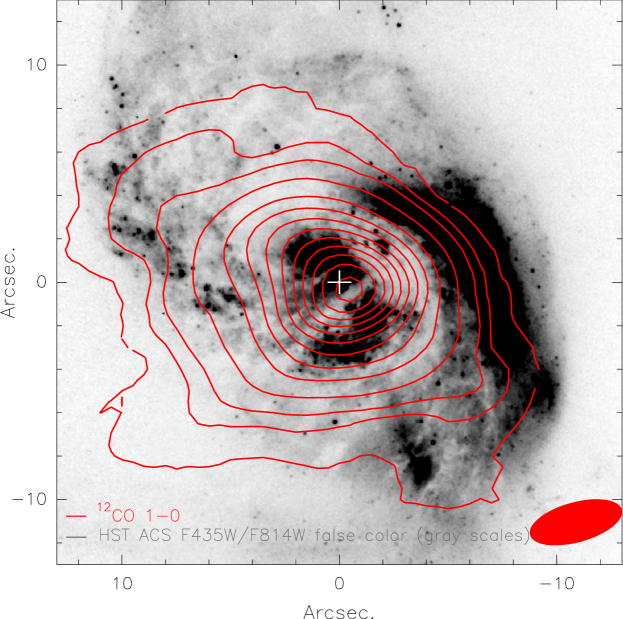
The 12CO 10 emission in NGC 1614 is more extended than the 3 mm continuum emission. In addition to the difference in size, the 12CO distribution also shows a significantly different structure than the 3 mm continuum (Fig. 2). Location and general morphology are in agreement with the results of Olsson et al. (2010), Sliwa et al. (2014), and García-Burillo et al. (2015): The gas distribution appears centrally peaked with a significant elongation along a northeast-southwest direction, associated with the dust lanes in the center of NGC 1614. Olsson et al. (2010) found an extent of about 11′′, Sliwa et al. (2014) about 14′′, García-Burillo et al. (2015) about 12′′. In our data the extension is roughly 25′′ in the northeast-southwest direction. This difference is due to the higher sensitivity and the integration of short-spacing observations in our data set. Additionally, the distribution in Fig. 2 shows features in the molecular gas that were previously unknown. The extension towards the south, for example, consists of low-surface brightness gas that extends into the tidal tails to the south-southwest of the main body of the galaxy. Hints for the feature extending toward the southeast, continuing the direction of the minor nuclear dust lane, can already be detected in Sliwa et al. (2014) and García-Burillo et al. (2015). Our higher-sensitivity, improved uv-coverage observations now clearly confirm their presence. The total interferometric integrated flux enclosed in the 3 contours is 241 Jy km s-1, which is about a factor of seven times more than in previous observations of Olsson et al. (2010), and a factor of two more than previously observed by Scoville et al. (1989). A comparison to single-dish observations shows that we recover approximately 115 of the flux that has recently been detected by Costagliola et al. (2011). The spectrum of the 12CO 10 emission (Fig. 2a) shows a double-peaked Gaussian with a FWHM line width of 250 km s-1. The peak flux is at about 1.1 Jy.
3.3 13CO 10
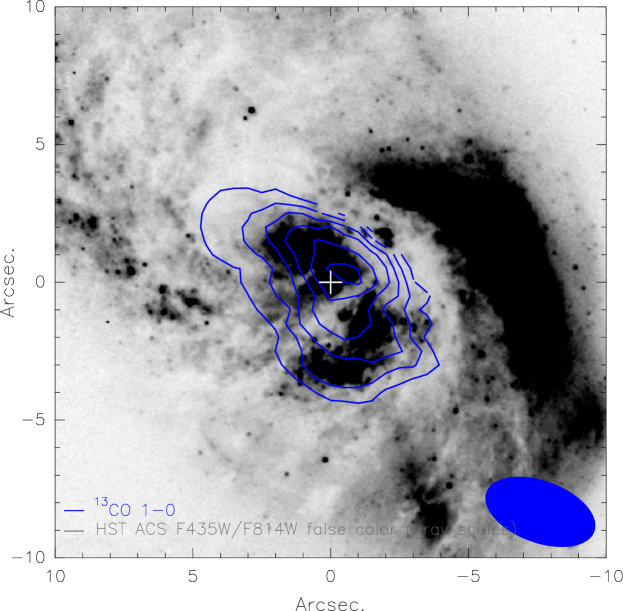
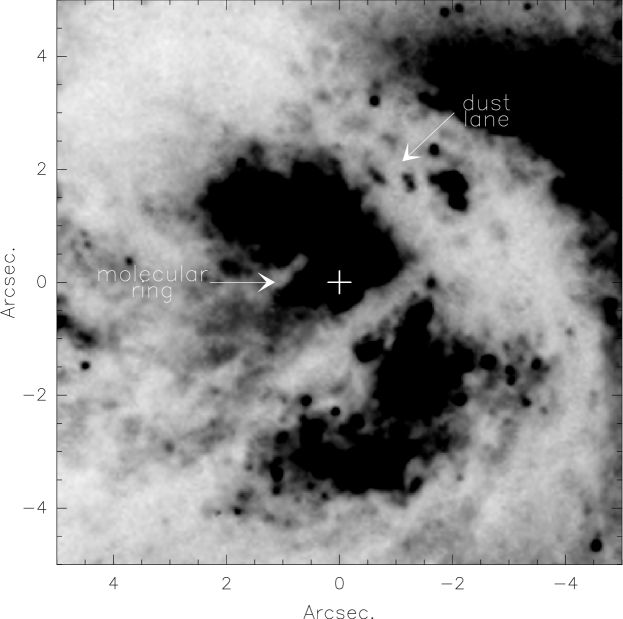
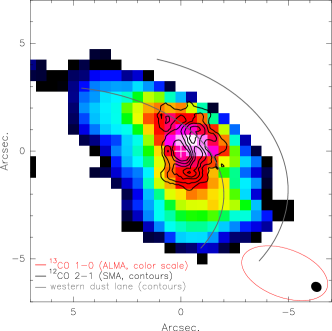
Figure 3 shows the spectrum and integrated intensity distribution of the 13CO 10 emission in NGC 1614. The emission line appears to be double peaked, with its highest flux being 0.04 Jy, and an integrated flux of 6.6 Jy km s-1 at a line width (FWHM) of about 250 km s-1. The recovered flux corresponds to 98 of the total flux detected with single-dish observations (Costagliola et al. 2011). Compared to previous interferometric observations, the sensitivity in our observations is increased by a factor of seven. As a result we recover an integrated flux that is twice as high as in these data (Sliwa et al. 2014). The integrated intensity distribution shows the 13CO 10 emission to be situated in an elongated structure of roughly 12′′ extending from the northeast of the nucleus of NGC 1614 to the southwest of it. The peak of the distribution, however, is located slightly northwest of the nucleus, where the 12CO 21 emission in the molecular ring connects to the dust lane (Fig. 8, König et al. 2013). A comparison with an Hubble Space Telescope (HST) image (Fig. 3b) shows that the 13CO emission appears to follow the main high brightness star forming structures at the center of NGC 1614. The image furthermore indicates that the extent of the 13CO emission does not cover the complete extent of the western dust lane. Instead, it seems that the bulk of the 13CO 10 emission is avoiding the dust lane, in contrast to the 12CO 10 emission (see also Fig. 9).
3.4 C18O 10CN 10, and CS 21
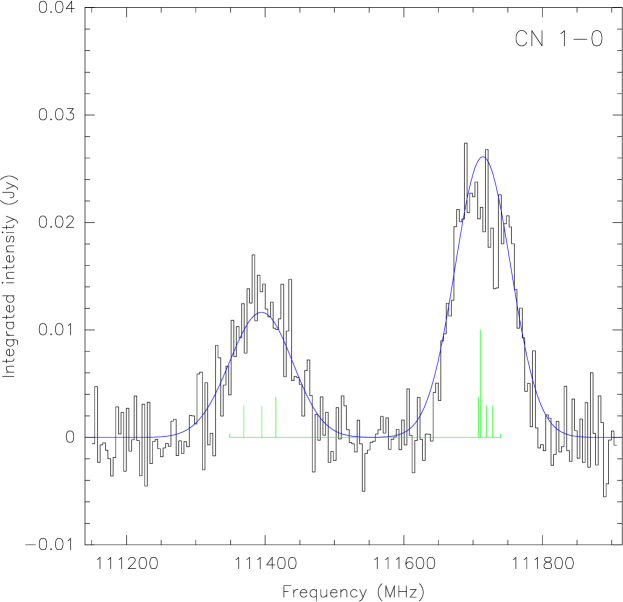
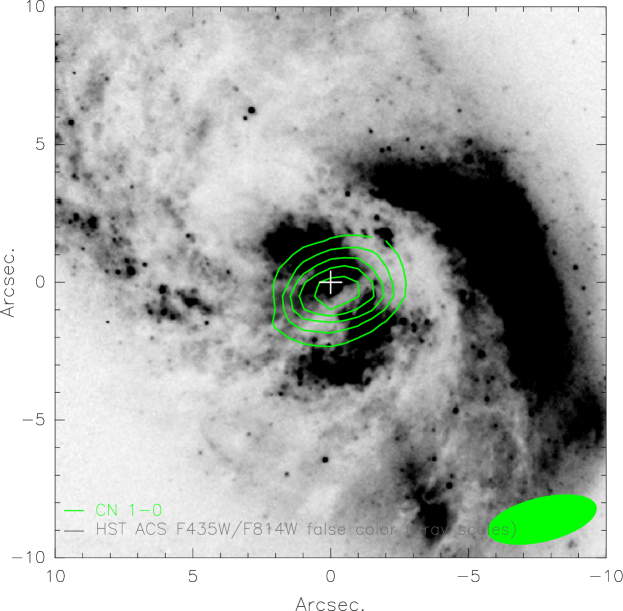
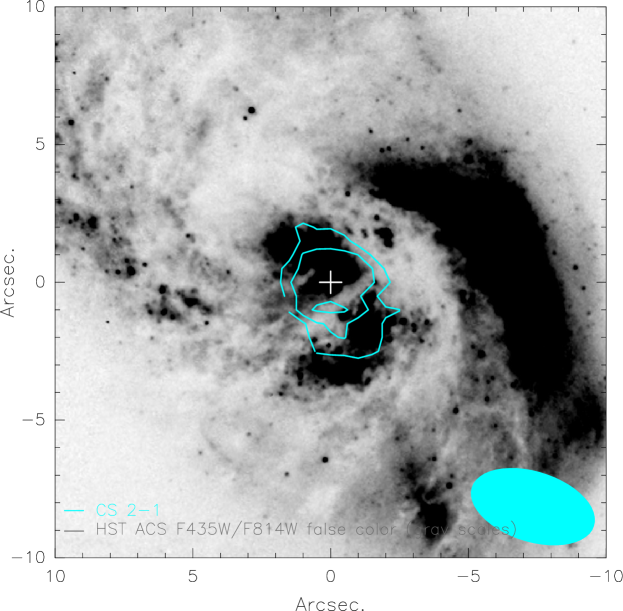
Other molecular emission lines contained in the observed bandwidths are C18O 10, CN 10, and CS 21. The C18O 10 emission line was not detected. An upper limit at 3 amounts to 0.1 Jy km s-1 within the central 4′′ 4′′. This flux limit is a factor of more than 8.5 lower than what has been obtained from previous single-dish observations (Costagliola et al. 2011). The CN =10 emission is located in a compact, unresolved distribution at the nucleus of NGC 1614 (Fig. 4bc). With a peak flux of 0.03 Jy and an integrated flux of 7.2 Jy km s-1, the = 3/21/2 component is stronger than the = 1/21/2 component (Fig. 4a; peak flux: 0.02 Jy, integrated flux: 3.8 Jy km s-1). The total integrated flux is 10.3 Jy km s-1. The average FWHM line width amounts to 250 km s-1. , the integrated line ratio between the CN = 10 = 3/21/2 and = 1/21/2 components amounts to 2, which indicates that the gas traced by the CN emission in NGC 1614 is optically thin. The CS 21 emission is clearly detected in NGC 1614 (Fig. 5). Its spatial distribution is compact and centered on the nucleus of the galaxy, following the main high-brightness starforming structures in the HST image (Fig. 5b). The peak flux in the spectrum is at 7.7 mJy. The integrated flux is found to be roughly 1.3 Jy km s-1, at a FWHM line width of 250 km s-1.
3.5 12CO-to-13CO 10 line ratio
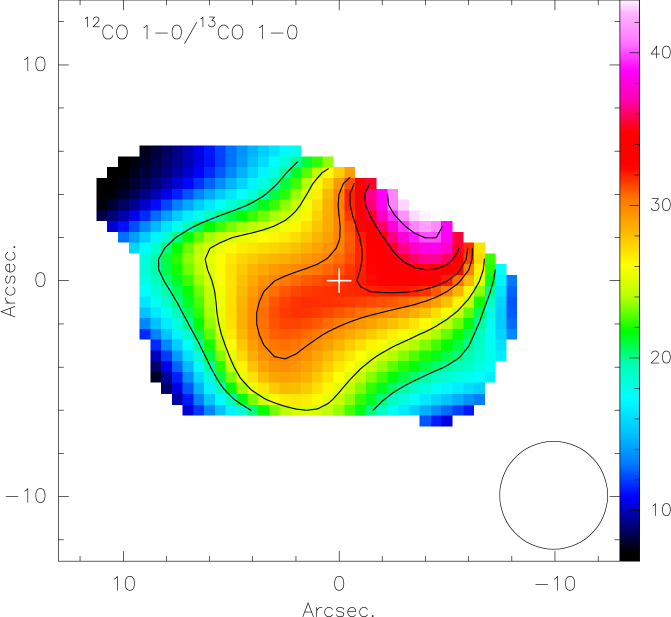
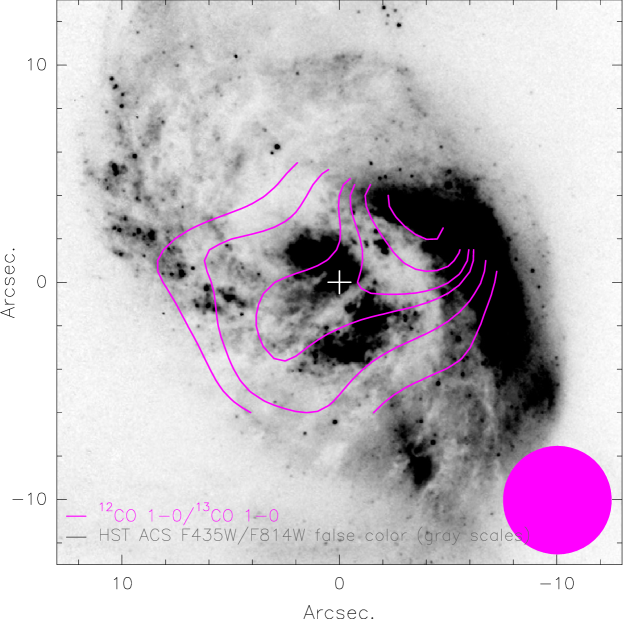
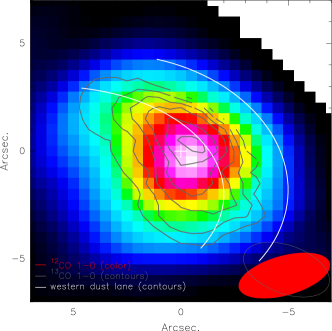
From a detailed comparison of the 12CO and 13CO 10 emission, the distributions indicate an offset in the emission peak location between the two tracers. The 12CO peaks exactly at the nucleus of NGC 1614, whereas 13CO peaks slightly to the northwest of it (an overlay image showing the central 14′′ can be found in the Appendix in Fig. 9). Furthermore, the two emission distributions are distinctly different in size and structure. A 12CO-to-13CO 10 () line ratio map (Fig. 6) shows compelling evidence for this. The distribution shows an elongated structure of constant value (30) that coincides with the location of the minor axis dust lane close to the nucleus (Fig. 6b). Moving along this direction toward the dust lane in the west of the nucleus, increases to its highest values of 40 to 45 at the outer edge of the western dust lane, where the 13CO 10 is largely absent. Toward the northeastern, eastern, and western edge of the map, the distribution shows more normal values ( = 1015) associated with the gas in the disk of starburst galaxies. Sliwa et al. (2014) reported similar to our findings. Their values range from about 25 to approximately 4045. Their line ratio map, however, shows a different distribution compared to our work (Fig. 6) at several locations in NGC 1614: the highest values for are found toward the southern part of the circumnuclear molecular ring. is slightly lower than that to the west (toward the dust lane). The reason might be that Sliwa et al. (2014) only recovered 50 of the total flux in their data set, while we essentially recovered 100% of the single dish flux. The authors found the same lower toward the northeast and east of the ring, however. Higher resolution observations are necessary to exactly locate the peak in the distribution (König et al., in prep.).
4 Discussion
4.1 Line ratio variations
For the first time we were able to measure the 12CO-to-13CO 10 line ratio in the central dust lanes in NGC 1614 (Sect. 3.5). We report an overall high , with increasing values toward the dust western lane. Studies have been published in other nearby minor merger systems, for example, the Medusa merger (Aalto et al. 2010), which show similarly elevated . It was suggested that the elevated line ratios are the result of two effects, either acting alone or combined: 1) changes in the physical conditions in the gas, or 2) abundance effects (e.g., Meier & Turner 2004; Aalto et al. 2010). These effects are discussed further below.
4.1.1 Excitation effects
Temperature
In the context of the discussion in this section, we assume that the abundances of 12CO and 13CO are constant over the central region of interest. High average gas temperatures, low average gas densities, or exceptionally high velocity dispersions in the molecular clouds could be responsible for elevated line ratios (e.g., Aalto et al. 1995; Meier & Turner 2004). In NGC 1614, the gas with the highest ratios is located in the dust lane, away from the bulk of the ongoing star formation. This most likely excludes the notion of high gas temperatures as the cause of the elevated line ratio. An alternative mechanism to elevate , and the absence of star formation in the dust lane, could be mechanical heating and shears caused by shocks. So far, no indications for shocks in the dust lane in NGC 1614 have been found: 13CO 21 observations at comparable spatial resolutions (Wilson et al. 2008) indicate an emission distribution similar to what we present for 13CO 10 in this work. Assuming that the elevated values are due to the presence of high-density gas, we expect densities of about 3 103 cm-3 or more. The result would be that the 13CO 21 flux is a factor of four or more higher than for 13CO 10. This would have been picked up by the observations of Wilson et al. (2008). Thus, the presence of high-density gas due to shocks can most likely be ruled out as the determining factor for the high line ratios in NGC 1614. Furthermore, observations of dense gas tracers like HCN, HCO+ 43 and CO 65 (Imanishi & Nakanishi 2013; Sliwa et al. 2014) have not yielded a detection of dense gas emission in the dust lane, their emission is solely found in the circumnuclear ring.
Density
Change in the gas density is a valid option to cause the observed change in in NGC 1614, however. A decrease in the gas density may cause an increase in the line ratio: If the gas in the dust lane is diffuse, that is, in the form of non-selfgravitating clouds, the lower critical density favors the emission of 12CO 10 photons. As a result of the so-called radiative trapping the 12CO line is still bright at critical densities of 200-300 cm-3, where 13CO 10 is faint (Meier & Turner 2004). Previous studies of nearby galaxies have suggested that the diffuse gas in the dust lane is due to the funneling of gas along the same, thus gas infall is involved (e.g., Aalto & Hüttemeister 2000). If the infalling gas is the only effect causing the increase of , the abundance ratio over the central region would need to be well mixed, that is, it should have values more corresponding to what is found for the inner Galactic disk (Meier & Turner 2004). around 30 at the center of NGC 1614 places the line ratios for the molecular gas there firmly above this (see also Sect. 3.5; e.g., Aalto et al. 1995; Meier & Turner 2004; Aalto et al. 2010). One possible candidate for a secondary line ratio enhancement mechanism could be a density wave in NGC 1614. The situation in M~51 seems to be a good analogy for what we find in NGC 1614. In M 51, Tosaki et al. (2002) found high 12CO-to-13CO 10 ratios in the central and interarm regions. Velocity dispersion observations led them to suggest the presence of streaming motions. The authors thus proposed that streaming motions, caused by density wave activity, led to the accumulation of dense gas located in self-gravitating clouds, as traced by 13CO 10, to be located downstream from the diffuse gas that is traced by 12CO 10. This is exactly what we find in NGC 1614: the is high in the dust lane where we suspect the gas to be diffuse. Downstream of this gas, traced by 12CO 10, lies the peak of the 13CO 10 distribution. This is also similar to what has been proposed for the Medusa merger (Aalto et al. 2010).
4.1.2 Abundance effects
12C/13C
The 12CO-to-13CO 10 intensity line ratio map shows values of about 30 toward the nucleus of NGC 1614 (see Sects. 3.5 and 4.1.1), which corresponds to line ratios found predominantly for warm, turbulent, high-pressure gas in the centers of luminous merging galaxies (e.g., Aalto et al. 1995; Glenn & Hunter 2001). From the discussion of the excitation effects on the line ratios in Sect. 4.1.1, we conclude that diffuse gas in the dust lane under the influence of density wave activity can partially explain elevated values for . To increase the 12CO-to-13CO 10 to a level as we find in NGC 1614 an additional factor has to be taken into account to explain the enrichment of 13CO, which also causes the relative deficiency of C18O. This is the effect of changing abundances. Casoli et al. (1992) suggested that could change depending on the 12CO/13CO abundance ratio, [12CO]/[13CO], when low-metallicity gas was transported from the outskirts of a merger to its center. The starburst would then contribute to enrich the infalling metal-poor gas in 13C (e.g., Rupke et al. 2008; Henkel et al. 2010). We assume the 12CO 10 line transition to be optically thick ( = 1), that the 12CO and 13CO emission trace the same gas and also that the excitation temperatures for the two are comparable333For more details see Sect. B. This would mean that [12CO]/[13CO] would be roughly 90, which is a typical value for gas farther out in the Galactic disk (e.g., Henkel et al. 1985; Wilson & Rood 1994; Wouterloot & Brand 1996; Henkel et al. 2014), and thus points to the presence of infalling, chemically less processed gas.
16O/18O
Using the C18O 10 integrated intensity upper limit in the central 4′′ 4′′, the 12C16O-to-12C18O 10 line ratio results in a lower limit of 325. The resulting abundance ratio is [12CO]/[C18O] 900. Values found for the Galactic center are 250, for the solar neighborhood typical values are about 500 (e.g. Wilson & Matteucci 1992). The [12CO]/[C18O] ratio is significantly higher in NGC 1614 than in the LIRG Zw~049.057 (Falstad et al. 2015), but comparable to what has been found for another LIRG, NGC~4418, (González-Alfonso et al. 2012). It is also comparable to values found in the merger Arp~299 (Falstad et al., in prep.). Interestingly, both Arp 299 and NGC 4418 have molecular gas inflows (Falstad et al. in prep., Costagliola et al. 2013) – Arp 299 also hosts an efficient starburst (e.g., Bondi et al. 2012, and references therein) – just like NGC 1614. Considering that this result for NGC 1614 is only a lower limit to [12CO]/[C18O], and also taking the high 13CO-to-C18O 10 integrated intensity line ratio in the central 4′′ 4′′into account (10.3), C18O 10 seems very deficient in comparison to 12CO 10, but especially with respect to 13CO 10. C18O is thought to come from short-lived massive stars early during a starburst event (e.g., Prantzos et al. 1996; Meier & Turner 2004), whereas 13CO 10 is predicted to be produced later on in intermediate-mass stars (e.g., Meier & Turner 2004, and references therein). An explanation for this deficiency in the center of NGC 1614 could be that the mixing of the infalling, chemically unprocessed gas with the prevailing gas is not efficient. Although this could also be an effect of the size of the beam in the observations - if the unprocessed infalling gas is located inside the same beam as the prevailing nuclear gas a dilution of the separate signals could occur. This dilemma will be solved by higher resolution observations of the same set of molecular tracers. Taking the findings in Sect. 4.1.1 and this section into account, we propose that the increase in the 12CO-to-13CO ratio in NGC 1614 is caused by the diffuse gas in the dust lane and density wave activity, in combination with enrichment of 13CO due to infalling metal-poor gas from farther out in the galactic disk. However, a definitive answer to whether a change in the temperature of the gas also has an influence can only be obtained together with sensitivity-matched observations of the 12CO and 13CO 21 lines.
4.2 NGC 1614 - the big picture?
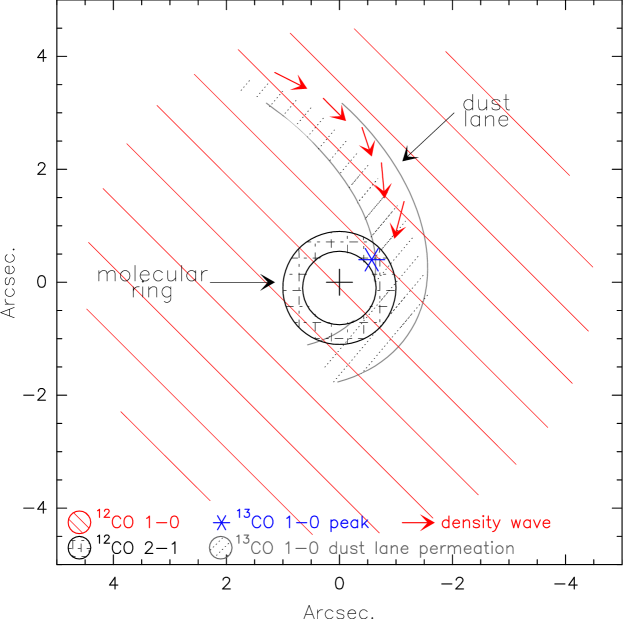
In this section, we now collocate our results together with what has been previously reported on what is going on in NGC 1614. A cartoon representation of the proposed scenario is depicted in Fig. 7. In 2001, a starburst ring was discovered at the nucleus of NGC 1614 by Alonso-Herrero et al.. Its presence was confirmed in a number of other tracers (e.g., Olsson et al. 2010; Väisänen et al. 2012). Alonso-Herrero et al. (2001) suggested that the ring was formed as the result of an outward progressing starburst event that has already consumed most of the gas at its center. The ring also has a molecular component (König et al. 2013; Sliwa et al. 2014; Xu et al. 2015). As a result, it was suggested that the ring is situated at the location of crowded orbits in the merger potential where it is replenished by gas coming in along the dust lane (König et al. 2013; Sliwa et al. 2014). The 12CO 10 (Olsson et al. 2010; Sliwa et al. 2014; García-Burillo et al. 2015), 21 (König et al. 2013) and 13CO 10 line transitions trace the low-to-intermediate surface brightness gas that shows how the starburst ring is connected to the large-scale molecular gas reservoir: diffuse gas in the form of unbound giant molecular clouds (GMCs) could be funneled along the dust lane from the molecular gas reservoir at larger scales (seen in 12CO 10) toward the nucleus. During this process, the gas may be hit by a density wave. The resulting shocks could cause the gas density to increase and the molecular clouds to become self-gravitating (as traced by 13CO 10). In this scenario, the molecular clouds are trapped at the connection between the dust lane and the ring, “the umbilical cord” (described by König et al. 2013), inside the mergers potential through crowding processes, for instance. This could lead to collisional coagulation of the GMCs into larger-sized giant molecular associations (GMAs, traced by, e.g., 12CO 21) that then possibly migrate onto the circumnuclear ring. In this way, the nuclear gas reservoir can be constantly replenished. The cloud-cloud interactions could also trigger the onset of star formation in the ring (Scoville et al. 1986; Tan 2000): the high-density gas, such as HCN and HCO+ (e.g., Imanishi & Nakanishi 2013; Sliwa et al. 2014; Xu et al. 2015), is exclusively associated with the star formation itself. Whether the ring is indeed caused by a wildfire expanding into the surrounding molecular medium or if is solely formed at the location of the resonance in the merger potential is still under discussion. Solving this argument will require further studies: Resolution- and sensitivity-matched 12CO and 13CO 21 observations will greatly improve our ability to determine whether the presence of non-selfgravitating gas in the dust lane or a change in the temperature of the gas is the cause of the extreme line ratios in NGC 1614. Higher resolution 12CO 10 observations at high sensitivity are needed to search for indicators of possible streaming motions between the large-scale and small-scale molecular gas reservoirs to verify the funneling of gas along the dust lanes toward the circumnuclear ring. They would also allow us to study the possible connection between the CO 10 and the CO 21 gas reservoirs in more detail, thus allowing to collect evidence in favor or against the competing scenarios proposed for the formation of the circumnuclear ring.
4.2.1 Implications for high-redshift studies of mergers
We would also like to stress that our results emphasize the need to be cautious which tracers of the molecular gas to best use to determine star formation capabilities, also for studies at high redshifts. We have especially shown in this paper that the 12CO 10 emission is not necessarily a tracer of the overall content of the molecular gas that is capable to partake in star formation because a high percentage of it might be in the form of diffuse molecular gas. Additional observations at higher- CO transitions are necessary to conclude on this. Furthermore, C18O should be used with caution to determine the age of the starburst activity in galaxies with proven gas infall. The mixing of the infalling gas with the prevailing gaseous materials might falsify the age determination to a large degree.
5 Summary
In summary, with the ALMA observations presented here, we showed that the nearby starburst galaxy NGC 1614 harbors large reservoirs of molecular gas traced by 12CO and 13CO 10. The 12CO emission is widely distributed throughout the galaxy and has a strong connection to the dust lanes, whereas the 13CO emission is much more compact and seems to avoid them. This possibly indicates non-selfgravitating, diffuse gas in the dust lane that originates from farther out in the galaxy disk. The 13CO 10 emission distribution is most likely a result of the effect of the progression of density waves on the galaxies molecular medium. In addition to 12CO and 13CO 10, other molecular gas tracers such as CN 10 and CS 21 are present in NGC 1614. For C18O only an upper limit was found.
Acknowledgements.
This paper makes use of the following ALMA data: ADS/JAO.ALMA#2013.1.00991.S. ALMA is a partnership of ESO (representing its member states), NSF (USA) and NINS (Japan), together with NRC (Canada), NSC and ASIAA (Taiwan), and KASI (Republic of Korea), in cooperation with the Republic of Chile. The Joint ALMA Observatory is operated by ESO, AUI/NRAO and NAOJ. This research has made use of the NASA/IPAC Extragalactic Database (NED) which is operated by the Jet Propulsion Laboratory, California Institute of Technology, under contract with the National Aeronautics and Space Administration.References
- Aalto et al. (2010) Aalto, S., Beswick, R., & Jütte, E. 2010, A&A, 522, A59
- Aalto et al. (1995) Aalto, S., Booth, R. S., Black, J. H., & Johansson, L. E. B. 1995, A&A, 300, 369
- Aalto & Hüttemeister (2000) Aalto, S. & Hüttemeister, S. 2000, A&A, 362, 42
- Aalto et al. (1997) Aalto, S., Radford, S. J. E., Scoville, N. Z., & Sargent, A. I. 1997, ApJ, 475, L107
- Alonso-Herrero et al. (2001) Alonso-Herrero, A., Engelbracht, C. W., Rieke, M. J., Rieke, G. H., & Quillen, A. C. 2001, ApJ, 546, 952
- Bondi et al. (2012) Bondi, M., Pérez-Torres, M. A., Herrero-Illana, R., & Alberdi, A. 2012, A&A, 539, A134
- Bournaud et al. (2005) Bournaud, F., Jog, C. J., & Combes, F. 2005, A&A, 437, 69
- Casoli et al. (1992) Casoli, F., Dupraz, C., & Combes, F. 1992, A&A, 264, 55
- Combes (1988) Combes, F. 1988, in NATO ASIC Proc. 232: Galactic and Extragalactic Star Formation, ed. R. E. Pudritz & M. Fich, 475
- Costagliola et al. (2011) Costagliola, F., Aalto, S., Rodriguez, M. I., et al. 2011, A&A, 528, A30
- Costagliola et al. (2013) Costagliola, F., Aalto, S., Sakamoto, K., et al. 2013, A&A, 556, A66
- Dahmen et al. (1998) Dahmen, G., Huttemeister, S., Wilson, T. L., & Mauersberger, R. 1998, A&A, 331, 959
- Davis et al. (2015) Davis, T. A., Rowlands, K., Allison, J. R., et al. 2015, MNRAS, 449, 3503
- Downes & Solomon (1998) Downes, D. & Solomon, P. M. 1998, ApJ, 507, 615
- Falstad et al. (2015) Falstad, N., González-Alfonso, E., Aalto, S., et al. 2015, A&A, 580, A52
- García-Burillo et al. (2015) García-Burillo, S., Combes, F., Usero, A., et al. 2015, A&A, 580, A35
- Glenn & Hunter (2001) Glenn, J. & Hunter, T. R. 2001, ApJS, 135, 177
- González-Alfonso et al. (2014) González-Alfonso, E., Fischer, J., Graciá-Carpio, J., et al. 2014, A&A, 561, A27
- González-Alfonso et al. (2012) González-Alfonso, E., Fischer, J., Graciá-Carpio, J., et al. 2012, A&A, 541, A4
- Henkel et al. (2014) Henkel, C., Asiri, H., Ao, Y., et al. 2014, A&A, 565, A3
- Henkel et al. (2010) Henkel, C., Downes, D., Weiß, A., Riechers, D., & Walter, F. 2010, A&A, 516, A111
- Henkel et al. (1985) Henkel, C., Guesten, R., & Gardner, F. F. 1985, A&A, 143, 148
- Henkel & Mauersberger (1993) Henkel, C. & Mauersberger, R. 1993, A&A, 274, 730
- Imanishi & Nakanishi (2013) Imanishi, M. & Nakanishi, K. 2013, AJ, 146, 47
- Israel (2009) Israel, F. P. 2009, A&A, 493, 525
- Jogee (2006) Jogee, S. 2006, in Lecture Notes in Physics, Berlin Springer Verlag, Vol. 693, Physics of Active Galactic Nuclei at all Scales, ed. D. Alloin, 143
- König et al. (2014) König, S., Aalto, S., Lindroos, L., et al. 2014, A&A, 569, A6
- König et al. (2013) König, S., Aalto, S., Muller, S., Beswick, R. J., & Gallagher, J. S. 2013, A&A, 553, A72
- Kotilainen et al. (2001) Kotilainen, J. K., Reunanen, J., Laine, S., & Ryder, S. D. 2001, A&A, 366, 439
- McMullin et al. (2007) McMullin, J. P., Waters, B., Schiebel, D., Young, W., & Golap, K. 2007, in Astronomical Society of the Pacific Conference Series, Vol. 376, Astronomical Data Analysis Software and Systems XVI, ed. R. A. Shaw, F. Hill, & D. J. Bell, 127
- Meier & Turner (2004) Meier, D. S. & Turner, J. L. 2004, AJ, 127, 2069
- Naab et al. (2009) Naab, T., Johansson, P. H., & Ostriker, J. P. 2009, ApJ, 699, L178
- Olsson et al. (2010) Olsson, E., Aalto, S., Thomasson, M., & Beswick, R. 2010, A&A, 513, A11
- Polk et al. (1988) Polk, K. S., Knapp, G. R., Stark, A. A., & Wilson, R. W. 1988, ApJ, 332, 432
- Prantzos et al. (1996) Prantzos, N., Aubert, O., & Audouze, J. 1996, A&A, 309, 760
- Puxley & Brand (1999) Puxley, P. J. & Brand, P. W. J. L. 1999, ApJ, 514, 675
- Rupke et al. (2008) Rupke, D. S. N., Veilleux, S., & Baker, A. J. 2008, ApJ, 674, 172
- Sanders et al. (2003) Sanders, D. B., Mazzarella, J. M., Kim, D.-C., Surace, J. A., & Soifer, B. T. 2003, AJ, 126, 1607
- Schwartz & Martin (2004) Schwartz, C. M. & Martin, C. L. 2004, ApJ, 610, 201
- Scoville et al. (1986) Scoville, N. Z., Sanders, D. B., & Clemens, D. P. 1986, ApJ, 310, L77
- Scoville et al. (1989) Scoville, N. Z., Sanders, D. B., Sargent, A. I., Soifer, B. T., & Tinney, C. G. 1989, ApJ, 345, L25
- Scoville et al. (1985) Scoville, N. Z., Soifer, B. T., Neugebauer, G., et al. 1985, ApJ, 289, 129
- Shlosman et al. (1989) Shlosman, I., Frank, J., & Begelman, M. C. 1989, Nature, 338, 45
- Simkin et al. (1980) Simkin, S. M., Su, H. J., & Schwarz, M. P. 1980, ApJ, 237, 404
- Sliwa et al. (2014) Sliwa, K., Wilson, C. D., Iono, D., Peck, A., & Matsushita, S. 2014, ApJ, 796, L15
- Tan (2000) Tan, J. C. 2000, ApJ, 536, 173
- Taniguchi et al. (1999) Taniguchi, Y., Ohyama, Y., & Sanders, D. B. 1999, ApJ, 522, 214
- Tosaki et al. (2002) Tosaki, T., Hasegawa, T., Shioya, Y., Kuno, N., & Matsushita, S. 2002, PASJ, 54, 209
- Väisänen et al. (2012) Väisänen, P., Rajpaul, V., Zijlstra, A. A., Reunanen, J., & Kotilainen, J. 2012, MNRAS, 420, 2209
- van Dishoeck & Black (1988) van Dishoeck, E. F. & Black, J. H. 1988, ApJ, 334, 771
- Visser et al. (2009) Visser, R., van Dishoeck, E. F., & Black, J. H. 2009, A&A, 503, 323
- Weinzirl et al. (2009) Weinzirl, T., Jogee, S., Khochfar, S., Burkert, A., & Kormendy, J. 2009, ApJ, 696, 411
- Wilson et al. (2008) Wilson, C. D., Petitpas, G. R., Iono, D., et al. 2008, ApJS, 178, 189
- Wilson & Matteucci (1992) Wilson, T. L. & Matteucci, F. 1992, A&A Rev., 4, 1
- Wilson & Rood (1994) Wilson, T. L. & Rood, R. 1994, ARA&A, 32, 191
- Wouterloot & Brand (1996) Wouterloot, J. G. A. & Brand, J. 1996, A&AS, 119, 439
- Xu et al. (2015) Xu, C. K., Cao, C., Lu, N., et al. 2015, ApJ, 799, 11
Appendix A Comparison overlays of 12CO 10, 21 and 13CO 10 emission distributions
Figures 8 and 9 show overlays of 12CO 10, 21, and 13CO 10 that might be useful for a closer look at the detailed structure of NGC 1614. The observations used here are presented in this work or have been previously published.
Appendix B Conversion of line ratios into abundance ratios
To study the effects of changes in abundance ratios vs. the effects of different excitation mechanisms, we used the 12CO-to-13CO 10 ratio distribution in NGC 1614 to derive the abundance ratio ([12CO]/[13CO]). While (12CO 10) in galaxy disks (i.e., an ensemble of GMCs) may well exceed unity, there is mounting evidence that the emitting CO surfaces in galaxy centers have moderate optical depths (e.g., Aalto et al. 1995; Downes & Solomon 1998; Israel 2009), this is also true for the Galactic center (e.g., Polk et al. 1988; Dahmen et al. 1998). Since a = 1 surface would have the optical combination of filling factor and brightness temperature it is a reasonable assumption that much of the CO emission would be emerging from these surfaces. Thus, we use as a first-order approximation of the optical depth of = 1 in our data as a starting point to study the physical gas properties and mechanisms with a simple model. This is justified for the molecular gas in NGC 1614 based on several pieces of evidence: 1) In the dust lane the gas density is low: Studies associate high-density gas tracers exclusively with the circumnuclear ring (e.g., Imanishi & Nakanishi 2013; Sliwa et al. 2014; Xu et al. 2015); thus, the brightness temperature measured in the dust lane suggests that the gas has a of 1. If the emission is optically thin in a cool, low-density environment, its brightness temperature is 1 K at this resolution. 2) In the dense and warmer gas in the center (e.g., Imanishi & Nakanishi 2013; Sliwa et al. 2014; Xu et al. 2015), even optically thin 12CO 10 may have TB 1 K. However, the 1 surfaces would contribute more to the total intensity and 12CO is bathed in an intense field in the starburst region and cannot self-shield until = 1 (e.g., van Dishoeck & Black 1988; Visser et al. 2009). The high 13CO-to-C18O ratio supports this. In NGC 1614, the gas with the highest ratios is located in the dust lane, away from the bulk of the ongoing star formation, and thus away from the most intense radiation. Therefore, the intense radiation field from the star formation in the ring and/or self-shielding of 12CO are unlikely to cause the high (and the high isotopic ratio) in the western dust lane. More higher resolution studies of the CO 10 isotopologs are necessary to set a tighter constraint on the optical depth structure of the molecular gas in NGC 1614.