Coexistence of superconductivity and antiferromagnetism in Ca0.74(1)La0.26(1)(Fe1-xCox)As2 single crystals
Abstract
We report the transport, thermodynamic, SR and neutron study of the Ca0.74(1)La0.26(1)(Fe1-xCox)As2 single crystals, mapping out the temperature-doping level phase diagram. Upon Co substitution on the Fe site, the structural/magnetic phase transitions in this 112 compound are suppressed and superconductivity up to 20 K occurs. Our measurements of the superconducting and magnetic volume fractions show that these two phases coexist microscopically in the underdoped region, in contrast to the related 10-3-8 Ca10(Pt3As8)((Fe1-xPtx)2As2)5 compound, where coexistence is absent. Supported by model calculations, we discuss the differences in the phase diagrams of the 112 and 10-3-8 compounds in terms of the FeAs interlayer coupling, whose strength is affected by the character of the spacer layer, which is metallic in the 112 and insulating in the 10-3-8.
Since the observation of 26 K superconductivity (SC) in LaFeAsO1-xFx 1111 , several families of Fe-based superconductors (FBS) have been discovered. Among them, Ca1-xLaxFeAs2 (CaLa112) with up to 42 K, crystalizes in a monoclinic lattice japan112b ; yakita . This crystal structure based on the FeAs-(Ca/La)-As-(Ca/La)-FeAs stacking contains the prototypical FeAs layers made of the edge-sharing FeAs4 tetrahedra, as well as As layers made of zig-zag chains. The presence of these As chains has made CaLa112 unique in many aspects. Our recent study shows the Ca0.73La0.27FeAs2 compound, which has an effectively electron overdoped FeAs layer, is the “parent” compound of the CaLa112 FBS, highlighting the dual nature of itinerant and localized magnetism in FBS shan . In this material, a monoclinic to triclinic structural phase transition occurs at 58 K and a paramagnetic to stripe antiferromagnetic (AFM) phase transition appears at 54 K. Furthermore, metallic spacer layers are observed via ARPES measurement ARPESli ; shan . Besides Ca doping, which adds hole-like carriers, Co substitution on the Fe sites, which adds electron-like carriers, can also stabilize SC in Ca0.73La0.27FeAs2 japan1 ; japan2 ; shan ; shi1 . Therefore, as a FBS series with metallic spacer layers and no rotational symmetry, the characterization of the Co doped CaLa112 is of particular interest. Here we report a systematic study of Co doped Ca0.73La0.27FeAs2 (Co-CaLa112). We show that upon Co doping, the structure/magnetic phase transitions in Ca0.73La0.27FeAs2 are suppressed and bulk SC up to 20 K emerges. Using the =0.046 sample as a representative, we present the superconducting properties of the Co-CaLa112 FBS. In particular, microscopic coexistence of AFM and SC in this system is revealed by combined SR, susceptibility and neutron scattering measurements. We contrast this behavior with the related 10-3-8 compound Ca10(Pt3As8)((Fe1-xPtx)2As2)5, which has similar FeAs interlayer spacing as Co-CaLa112, but displays no AFM-SC coexistence. We interpret this difference in terms of the nature of the spacer layer, which is metallic in the 112 compound but insulating in the 10-3-8 system.
Single crystals of Ca0.74(1)La0.26(1)(Fe1-xCox)As2 were grown out of self-flux at the ratio of CaAs : LaAs : FeAs : CoAs : As = 1.3 : 0.5 : 1- : : 0.7 shan . Zero field (ZF) and longitudinal field (LF) SR experiments on 200 mg of single crystals with random orientations were performed in a conventional Helium gas flow cryostat in TRIUMF, Canada. Single crystal neutron diffractions were collected on the sample using HB-1A triple-axis spectrometer located at the High Flux Isotope Reactor of the Oak Ridge National Laboratory.
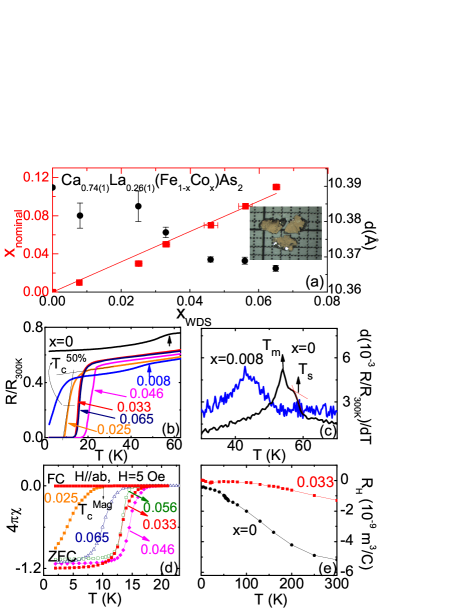
Since both La and Co concentrations can vary, wave-length dispersive spectroscopy (WDS) measurements were performed on at least 5 pieces in each batch to determine the concentration of the sample. The result is summarized in Fig. 1 (a), showing that the ratio of / is 0.63. Throughout the paper, we take to be the value. The maximum Co doping achieved is at while the growth with higher Co concentrations is unsuccessful. The concentration of La in each batch has a random variation as 0.270(4), 0.250(10), 0.269(3), 0.259(5), 0.249(7), 0.264(2) and 0.270(6) for , 0.008, 0.025, 0.033, 0.046, 0.056 and 0.065, respectively. Since La concentration shows some variation, we label it as 0.26(1) in the chemical formula for simplicity. In each batch, the FeAs interlayer distance is inferred by measuring the (0, 0, ) X-ray peaks diffracted from the planes of several single crystals. For , the interlayer distance is 10.36 , comparable to the value in the 10-3-8 FBS ni1038 . Upon Co doping, the interlayer distance shrinks, decreasing by at . This is comparable to the decrease of the interlayer distance at similar Co doping in BaFe2As2 nico .
Figure 1 (b) shows the representative temperature dependence of , highlighting the resistive anomalies in the and samples. The derivatives of the with temperature for these two samples are shown in Fig. 1(c). Two-kink features are observed in d/dT with the higher temperature kink associated with the monoclinic to triclinic phase transition and the lower temperature kink related to the paramagnetic to antiferromagnetic phase transition shan . The structural phase transition temperature and the magnetic phase transition temperature are inferred by the criterion shown in Fig. 1(c). The resistive anomaly in the “parent” compound is suppressed with Co doping and bulk SC shows up at 10 K in the sample. then increases to 20 K in the sample and finally is suppressed back to 16 K in the sample. Figure 1(d) shows the temperature dependent susceptibility data taken at 5 Oe. Except for the sample, the ZFC data show a relatively sharp drop below and saturate at low temperature with the magnitude of ZFC at 2 K spreading from -110% to -120%, which are comparable to the ones in the prototype Co doped Ba122 nico , suggesting 100% of SC shielding fraction here. Because of demagnetization effects, when a thin disk of radius and thickness of is placed in a field , its intrinsic susceptibility is given by , where and is the value in Fig. 1(d). For the batch, the average ratio of the four pieces measured is 0.10 and at 2 K is -90%, resulting in an average SC shielding fraction of 80% at 2 K without saturation. The small Meissner fraction inferred from the FC data indicates strong flux pinning, a common feature in FBS. The representative Hall coefficient data taken for the and samples are presented in Fig. 1(e). Their negative values indicate that electron carriers dominate the transport properties. Since , where is the carrier density, the decrease of accompanied with Co doping suggests larger , consistent with the fact that Co doping adds extra electron carriers into the system. Note that the SC sample with the chemical formula Ca0.82La0.18FeAs2 shows a positive Hall coefficient hall112 , indicating that the SC in Ca1-xLaxFeAs2 arises from the hole doping present in Ca0.74La0.26FeAs2.
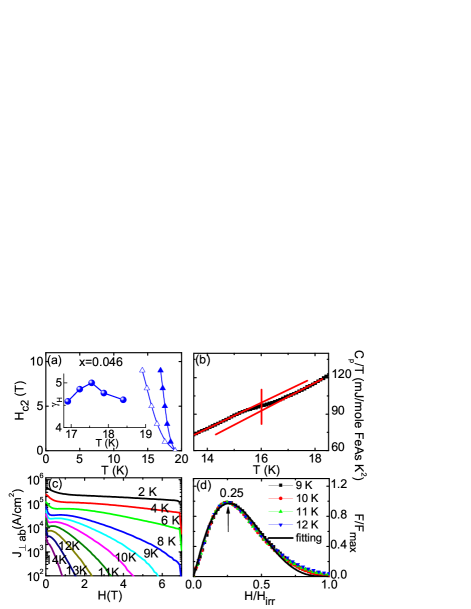
As a representative, the superconducting properties of the sample are shown in Fig. 2. Figure 2(a) presents the upper critical field , which is determined using the 50% criterion shown in Fig. 1(b). The anisotropy parameter of the upper critical field is around 4.7. Since the effective mass anisotropy is related to by , the mass anisotropy is around 22. Note that in 112 is smaller than in the 10-3-8 compound, which has similar FeAs interlayer distance but insulating spacer layers ni1038 ; chen1038 . This suggests a stronger FeAs interlayer coupling in 112 arising from the metallic spacer layers. Figure 2(b) presents the temperature dependent specific heat taken at H = 0 T. A bump in associated with the superconducting phase transition appears, confirming bulk superconductivity in this sample. By the equal entropy construction shown in Fig. 2(b), the heat capacity jump is 6.7 mJ/mole-Fe- at 16 K. This value follows the Budko-Ni-Canfield(BNC) log-log plot quite well BNC , suggesting that . Since most of the FBS superconductors follow this BNC scaling sergy , this may suggest an S pairing symmetry in CaLa112. The field dependent current density at various temperatures is shown in Fig. 2(c). We have calculated the critical current density based on the Bean model Bean , , where M = M+ - M-, and M+ (M-) is the magnetization associated with increasing (decreasing) field; , is the width and length of the sample separately. At 2 K, reaches 2.2105 A/cm2, comparable to FeTe0.5Se0.5 and LiFeAs but lower than BaKFe2As2 and SmFeAsO1-x T. Taen . To understand the mechanism of the vortex motion, the normalized pinning force as a function of reduced field () is plotted in Fig. 2(d), where dew . All curves can be scaled well and characterized by a maximum near = 0.25. This value is smaller than most FBS, but close to =0.28 for FeTe0.7Se0.3 bonura , suggesting that both surface pinning and small size normal core pinning contribute to the vortex motion.
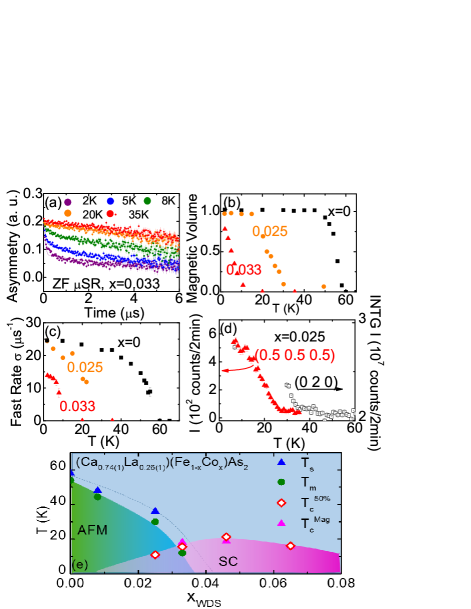
The interplay of structure, antiferromagnetism (AFM) and SC has been one of the most studied topics in FBS, especially because spin fluctuations are believed to play an important role in the pairing mechanism daice1111 ; ames122 ; dai122 . To determine the phase diagram, and particularly to resolve if microscopic coexistence between SC and AFM exists in the Co doped CaLa112, ZF SR measurements were performed to estimate the magnetic volume fraction of the superconducting samples. As a representative, the ZF asymmetry spectra of the sample at several temperatures are shown in Fig. 3(a). Although no feature associated with a structural/magnetic phase transition is observed in the resistivity measurements, upon decreasing the temperature from 35 K, a fast relaxing front end is absent at 20 K but clearly shows up at 8 K in Fig. 3(a), suggesting the development of magnetic order in this sample at low temperature. The ZF asymmetry spectra are fitted with the function
| (1) |
Here is the transverse function and denotes the fast relaxing component coming from the static magnetic order. is the fast transverse relaxation rate of . is the longitudinal fraction, representing the fraction of muons with spins parallel to the local magnetic field in the region with static magnetic order and/or muons in the paramagnetic volume. The longitudinal fraction only undergoes the spin lattice relaxation with the rate .
The Gaussian relaxation form arises from the magnetic field produced by randomly oriented magnetic moments, as expected in our Co-CaLa112 sample. For an ideally isotropic and fully ordered system, is expected to be 0.67 while the values at 2 K in , 0.025 and 0.033 samples are 0.75, 0.72 and 0.58, respectively. The slightly larger values in the and 0.025 samples likely arise from the field anisotropy in these randomly packed plate-like single crystals. By setting the magnetic volume in the sample to be 100% as proved reasonable in Ref. shan , we calculate the magnetic volume of the other samples, as shown in Fig. 3(b). For the sample, due to the sample inhomogeneity, around 6.4% of the sample is already magnetic at 50 K, but for the rest of the sample, AFM develops below 31 K and the magnetic volume fraction saturates below 20 K with 96% at 2 K. For the sample, AFM appears below 12 K and increases up to 76% at 2 K without saturation. The fast transverse relaxation rate is shown in Fig. 3(c). Since is proportional to the size of the magnetic moment, which is 1.0 /Fe in the sample as revealed by neutron diffraction shan , assuming that the sites remain similar in these measured samples, the magnetic moment in the sample is 0.6/Fe while it remains 1.0/Fe in the sample. The neutron diffraction data taken on a single crystal are presented in Fig. 3(d). The integrated (0 2 0) nuclear peak intensity sharply increases below 35 K, similar to the one in the sample shan , marking the occurrence of a structural phase transition. The intensity of the (0.5 0.5 0.5) magnetic peak abruptly increases below 28 K, indicating the development of long range magnetic ordering, which is consistent with the SR data shown in Fig. 3(b).
Based on the data we discussed above, a phase diagram is constructed in Fig. 3(e). Upon Co doping, the structural/magnetic phase transitions are suppressed and SC up to 20 K emerges. For the sample, the magnetic volume fraction determined from the SR data is 96%. The SC volume fraction determined from the susceptibility data is 80%. For the sample, the SC volume fraction is 100% while the magnetic volume fraction is at least 76% at 2 K, which has the trend to sharply increase further at even lower temperature. Therefore, there is clearly microscopic coexistence between SC and AFM in and samples, similar to most doped Ba122 compounds and the Ca1-xLaxFeAs2 coexist1 ; coexist2 ; coexist3 ; coexist4 ; coexist5 ; coexist6 ; coexist7 ; nmr112 .
It is instructive to compare these results for the 112 Ca1-xLaxFeAs2 compound with those for the 10-3-8 Ca10(Pt3As8)((Fe1-xPtx)2As2)5 system. Both of them have similar atomic constituents and very close values for the interlayer FeAs distance. However, in contrast to the 112, where an extended AFM-SC coexistence region emerges, the 10-3-8 shows no coexistence – or at best a very limited region of coexistence La1038 ; ruslan1038 . One of the most salient differences between these two classes of compounds is the fact that in the 10-3-8, the spacer layer is insulating, whereas in the 112 it is metallic. This difference is manifest, for instance, in the larger anisotropy of the former () over the latter (). Presumably, the existence of a metallic spacer layer enhances the FeAs interlayer coupling in the 112, making it more three-dimensional. Although several factors could be at play, it is tempting to attribute the presence of the AFM-SC coexistence region in these systems to the difference in their degree of three-dimensionality promoted by the distinct characters of the spacer layers.
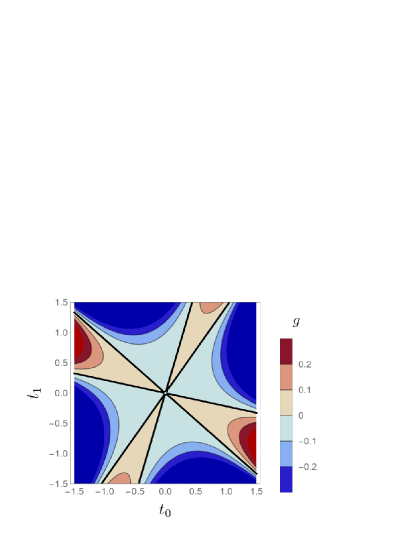
In order to investigate whether the more pronounced band dispersion of the 112 material favors the microscopic coexistence of AFM and SC, we consider a toy two-band model widely employed in the FBS to study the competition of AFM and SC vvc ; parker09 ; fs . This model is characterized by a hole-pocket with dispersion at the center of the Brillouin zone and an electron-pocket with dispersion at the corner of the Brillouin zone. The fate of the competing AFM-SC phases is determined by a single coefficient , which depends on the quartic coefficient of the microscopically-derived Ginzburg-Landau expansion supp : if , the competition between the phase is so strong that there is no coexistence, whereas if , their competition is weak enough to allow them to coexist microscopically. In the hypothetical perfect nesting limit, , SC and AFM are at the verge of coexistence or macroscopic phase separation, with . Deviations from perfect nesting then determine whether becomes positive or negative. Previously, deviations of perfect nesting arising from the in-plane band dispersions were studied fs ; vvc . Here, we consider deviations arising from the out-of-plane band dispersion, and write , with the general -dispersion:
| (2) |
To ensure that the system is nested at , the tight-binding coefficients are constrained to . In Fig. 4 supp , we compute the value of in the parameter space. Clearly, in a wide region of the parameter space, showing that in general the dispersion can promote microscopic coexistence between SC and AFM. Thus, this simple calculation lends support to the idea that the enhanced interlayer coupling in the 112 promoted by the metallic spacer contributes to the stabilization of a regime of microscopic AFM-SC coexistence in the phase diagram.
In summary, we have mapped out the phase diagram of the Ca0.74(1)La0.26(1)(Fe1-xCox)As2 superconductors. Microscopic coexistence between AFM and SC exists in this FBS. A phenomenological two-band model suggests the dispersion along direction may favors AFM-SC microscopic coexistence over phase separation.
Acknowledgments.Work at UCLA was supported by the NSF DMREF DMR-1435672. Work at ORNL′s High Flux Isotope Reactor was sponsored by the Scientific User Facilities Division, BES, DOE. Work at Columbia and TRIUMF was supported by the NSF DMREF DMR-1436095, PIRE project IIA 0968226, DMR-1105961 and JAEA REIMEI. M.S. acknowledges the support from the Humboldt Foundation. R.M.F. is supported by the U.S. Department of Energy, Office of Science, Basic Energy Sciences, under Award No. DE-SC0012336.
References
- (1) K. Y, Watanabe. T, Hirano. M and Hosono. H, J. Am. Chem. Soc., 130, 3296 (2008)
- (2) Katayama, N. et al., J. Phys. Soc. Jpn., 82, 123702 (2013)
- (3) H. Yakita, et al., J. Am. Chem. Soc., 136 846 (2014)
- (4) S. jiang, et al., Phys. Rev. B 93, 054522 (2016)
- (5) Li, M. Y. et al., Phys. Rev. B, 91, 045112 (2015)
- (6) H. Yakita, H. Ogino, A. Sala, T. Okada, A. Yamamoto, K. Kishio, A. Iyo, H. Eisaki and J. Shimoyama, Supercond. Sci. Technol. 28, 065001 (2015).
- (7) H. Yakita, H. Ogino, A. Sala, T. Okada, A. Yamamoto, K. Kishio, A. Iyo, H. Eisaki and J. Shimoyama, Physica C, 518, 14 (2015)
- (8) X. Xing, W. Zhou, B. Xu, N. Li, Y. Sun, Y. Zhang and Z. Shi, J. Phys. Soc, Jpn 84, 075001 (2015).
- (9) Ni Ni, et al., Proc. Natl. Acad. Sci, 108, E1019(2011)
- (10) N. Ni, et al., Phys, Rev. B 78, 214515 (2008)
- (11) W. Zhou, et al., Unpublished, arxiv: 1312.7731 (2013)
- (12) Z. J. Xiang, et al., Phys. Rew. 85, 224527 (2012)
- (13) J. S. Kim, B. D. Faeth, and G. R. Stewart, Phys. Rev. B 86, 054509 (2012).
- (14) S. L. Bud’ko, et al., Phys. Rev. B 89, 014510 (2014)
- (15) C. P. Bean, Rev. Mod. Phys., 36, 31 (1964)
- (16) T. Taen et al, Phys. Rev. B, 80, 092502 (2009)
- (17) D. Dew-Hughes, Philos. Mag., 30, 293 (1974)
- (18) M. Bonura, et al., Phys. Rev. B, 85, 134532 (2012)
- (19) J. Zhao, et al., Nat. mat 7, 953 (2008)
- (20) S. Nandi, et al., Phys. Rew. Lett., 104, 057006 (2010)
- (21) X. Lu, et al., Phys. Rev. Lett. 110, 257001 (2013)
- (22) D. K. Pratt, W. Tian, A. Kreyssig, J. L. Zarestky, S. Nandi, N. Ni, S. L. Bud’ko, P. C. Canfield, A. I. Goldman, and R. J. McQueeney, Phys. Rev. Lett. 103, 087001 (2009).
- (23) S. Avci, O. Chmaissem, E. A. Goremychkin, S. Rosenkranz, J.-P. Castellan, D. Y. Chung, I. S. Todorov, J. A. Schlueter, H. Claus, M. G. Kanatzidis, A. Daoud-Aladine, D. Khalyavin, and R. Osborn Phys. Rev. B. 83, 172503 (2011).
- (24) M.-H. Julien, H. Mayaffre, M. Horvatic, C. Berthier, X. D. Zhang, W. Wu, G. F. Chen, N. L. Wang and J. L. Luo, Eur. Phys. Lett. 87 37001 (2009).
- (25) E. Wiesenmayer, H. Luetkens, G. Pascua, R. Khasanov, A. Amato, H. Potts, B. Banusch, H.-H. Klauss, and D. Johrendt, Phys. Rev. Lett. 107, 237001 (2011).
- (26) P. Marsik, K. W. Kim, A. Dubroka, M. Roessle, V. K. Malik, L. Schulz, C. N. Wang, Ch. Niedermayer, A. J. Drew, M. Willis, T. Wolf, and C. Bernhard, Phys. Rev. Lett. 105, 057001 (2010).
- (27) L. Ma, G. F. Ji, J. Dai, X. R. Lu, M. J. Eom, J. S. Kim, B. Normand, and W. Yu, Phys. Rev. Lett. 109, 197002 (2012)
- (28) M. Yi, Y. Zhang, Z.-K. Liu, X. Ding, J.-H. Chu, A. F. Kemper, N. Plonka, B. Moritz, M. Hashimoto, S.-K. Mo, Z. Hussain, T. P. Devereaux, I. R. Fisher, H. H. Wen, Z.-X. Shen, and D. H. Lu, Nature Comm. 5, 3711 (2014).
- (29) Kawasaki, S. et al. Doping-enhanced antiferromagnetism in Ca1-xLaxFeAs2. Phys. Rev. B 92, 180508 (2015).
- (30) N. Ni, et al., Phys. Rev. B 87, 060507(R) (2013)
- (31) K. Cho, et al., Phys. Rev. B 85, 020504(R) (2012).
- (32) A. B. Vorontsov, M. G. Vavilov, and A. V. Chubukov, Phys. Rev. B 79, 060508 (2009); ibid Phys. Rev. B 81, 174538 (2010).
- (33) D. Parker, M. G. Vavilov, A. V. Chubukov, and I. I. Mazin, Phys. Rev. B 80, 100508 (2009).
- (34) R. M. Fernandes, D. K. Pratt, W. Tian, J. Zarestky, A. Kreyssig, S. Nandi, M. G. Kim, A. Thaler, N. Ni, P. C. Canfield, R. J. McQueeney, J. Schmalian, and A. I. Goldman, Phys. Rev. B 81, 140501 (2010); R. M. Fernandes and J. Schmalian, Phys. Rev. B 82, 014520 (2010).
- (35) supplimentary materials.