Optical and UV Spectra of the Remnant of SN 1885 (S And) in M3111affiliation: Based on observations with the NASA/ESA Hubble Space Telescope, obtained at the Space Telescope Science Institute, which is operated by the Association of Universities for Research in Astronomy, Inc. under NASA contract No. NAS5-26555.
Abstract
We present multi-slit, 1D and 2D optical and ultraviolet spectra of the remnant of Supernova 1885 (SN 1885; S And) taken using the Hubble Space Telescope’s Imaging Spectrograph (HST/STIS). These spectra of this probable subluminous Type Ia remnant, seen in silhouette against the central bulge of the Andromeda Galaxy (M31), show strong and broad absorptions from neutral and singly-ionized species of calcium, magnesium and iron, but with strikingly different distributions. Calcium H & K absorption indicates spherically distributed Ca-rich ejecta, densest in a lumpy shell expanding at to km s-1. Equally broad but weaker Ca I 4227 Å absorption is seen to extend out to velocities of km s-1. Magnesium-rich ejecta in the remnant is detected for the first time through Mg I 2852 Å and Mg II 2796, 2803 Å absorptions concentrated in a shell with expansion velocities from to at least 10,000 km s-1. Fe I 3720 Å absorption is detected as two discrete blueshifted and redshifted absorptions suggestive of an Fe I shell with expansion velocities of km s-1. Weak Fe II resonance absorptions in the wavelength region 2300 – 2700 Å are consistent with prior HST UV images showing Fe II rich ejecta confined to a small number of optically thick plumes. The presence of such iron plumes extending out from the remnant’s core plus layered shells of calcium and magnesium point to a delayed-detonation explosion. The spectra also suggest a roughly spherical explosion, contrary to that expected by a merger or collision of two white dwarfs. We conclude that SN 1885 likely was an off-center, delayed-detonation explosion leading to a subluminous SN Ia similar to SN 1986G.
Subject headings:
supernovae: general - supernovae: individual (SN 1885, S And) - ISM: kinematics and dynamics - ISM: abundances - supernova remnants1. Introduction
The apparition of this star in the center of so conspicuous a nebula will long afford matter for reflection, and a theme for discussion by savants. It raises the question whether, after all, there is, even in the heavens, such a thing as stability.
Lewis Swift 1886
Type Ia supernovae (SNe Ia) are thought to be the explosions of degenerate carbon-oxygen white dwarfs that undergo a thermonuclear runaway when they reach the Chandrasekhar limit (Hoyle & Fowler, 1960; Colgate & McKee, 1969; Nomoto et al., 1984; Hillebrandt & Niemeyer, 2000; Li et al., 2003). Possible SN Ia progenitor systems have been discussed by Howell (2011), Nugent et al. (2011), Bloom et al. (2012), Di Stefano & Kilic (2012), Höflich et al. (2013), and Maeda & Terada (2016).
Observed SN Ia spectra and light curves suggest a layered structure with intermediate-mass elements on the outside and nickel-iron material on the inside. Khokhlov (1991) proposed that this structure could be explained empirically by a “delayed-detonation” scenario, in which the explosion starts in the core as a subsonic burning deflagration wave that at some point transitions into a supersonic detonation. The initial deflagration preheats and expands the star’s outer layers, so that when the deflagration transitions to detonation, the burning of the outer layers does not continue to completion and a layered structure of intermediate-mass elements is produced.
SN Ia explosions involve a complex interplay of turbulent hydrodynamics, nuclear burning, conduction, radiative transfer in iron-group rich material, and perhaps magnetic fields (Khokhlov, 1995; Niemeyer & Hillebrandt, 1995; Livne, 1999; Reinecke et al., 1999; Gamezo et al., 2004; Röpke et al., 2012). This complexity means that there is substantial uncertainty in modeling SN Ia explosions. Several basic questions about the details of SN Ia explosions could be answered by direct observations of the distribution and kinematics of supernova ejecta in young SN Ia remnants.
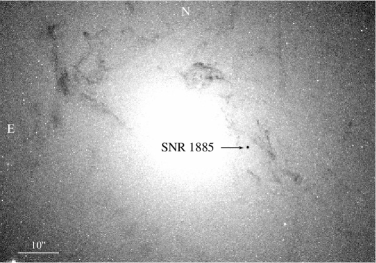
The bright historical nova seen in 1885 known as S Andromeda (S And; SN 1885), located away from the Andromeda galaxy’s (M31) nucleus, offers an opportunity to study the expanding debris of a SN Ia. Because of its central location in M31, the remnant’s expanding ejecta are detectable through resonance-line absorption against the background of M31’s bulge stars (Fesen et al. 1989, 2015; see Fig. 1).
The reported optical spectrum of SN 1885 lacked hydrogen lines, defining it as Type I (de Vaucouleurs & Corwin, 1985). Its orange appearance, maximum brightness, and fast light curve are also consistent with a subluminous Type Ia event (e.g., see Maunder 1885, 1886; Huggins 1886). However, this classification has been questioned (Chevalier & Plait, 1988; Pastorello et al., 2008; Perets et al., 2011).
Images taken with the Hubble Space Telescope (HST) in 1995 revealed a circular diameter dark spot produced by a blend of Ca II H & K line absorption (Fesen et al., 1999). Subsequent ultraviolet imaging of the remnant with HST detected a low signal-to-noise diameter absorption spot attributed to UV Fe II resonance lines (Hamilton & Fesen, 2000).
Spectra taken with Faint Object Spectrograph (FOS) on HST established that absorption over – was produced principally by Ca II K & H , , with additional contributions from Ca I and Fe I and (Fesen et al., 1999). The remnant’s Ca II absorption was found to extend to a velocity of . The strength of the Fe I 3720 Å absorption line, the relative strengths of Ca I and Ca II lines, and the depth of the imaged Fe II absorption spot were used to estimate an iron mass in the form of Fe II at between 0.1–1.0 M⊙.
Subsequent high-resolution HST Advanced Camera for Surveys (ACS) images taken in 2004 showed that the Ca II absorption is roughly spherical, with a maximum diameter of (Fesen et al., 2007). At the estimated distance of for M31 (McConnachie et al., 2005; Dalcanton et al., 2012), this angular diameter corresponds to a mean expansion velocity of over the 119 yr age of SN 1885 in 2004.
The agreement between the remnant’s size and its expansion velocity as measured in the Ca II absorption implies that the SN 1885 remnant is still largely in free expansion. Possible detections of the remnant in radio (Sjouwerman & Dickel, 2001) and X-ray (Hofmann et al., 2013) emission have been reported, but the faintness of these possible detections is consistent with the evidence that the bulk of the ejecta remain in free expansion.
More recent HST images obtained in 2010 and 2012 with the ACS and the Wide Field Planetary Camera (WFC3) show extended low velocity Fe I absorption offset to the east from the remnant’s center defined by Ca II images (Fesen et al., 2015). Most striking is the appearance of the remnant in Fe II absorption, which appears to be concentrated in four plumes extending from the remnant’s center to at least , in sharp contrast to the approximately spherical distribution of Ca II.
Because its ejecta are in near-free expansion, the distribution of elements in the remnant of SN 1885 (hereafter SNR 1885) is essentially the same as that shortly after the explosion. The dominant element near the center of the remnant at the present time is expected to be iron, with Fe+ the dominant iron ionization species (Hamilton & Fesen, 2000).
SNR 1885’s UV absorption spectrum is predicted to be especially rich between – which contains several resonance lines of Fe I and Fe II (Fesen et al., 1999). However, the M31 bulge is faint in this wavelength region, thus requiring long exposures to achieve adequate signal-to-noise.
Here we present optical and UV HST spectra of SNR 1885 taken as part of a spectral campaign in Cycle 21 of HST observations. The data were obtained to investigate the velocity distribution of neutral and singly ionized species of magnesium, calcium, and iron. The observations are described in §2 with the results presented in §3, discussed in §4, and implications for SN Ia presented in §5.
| Detector | Observation Date | Slit Position | Exposure |
|---|---|---|---|
| CCD | 2013 October 27 | 1B | |
| CCD | 2013 October 21 | 2B | |
| CCD | 2013 October 26 | 3B | |
| CCD | 2013 December 23 | 1A | |
| CCD | 2013 December 09 | 2A | |
| CCD | 2013 December 10 | 3A | |
| MAMA | 2013 December 26 | ||
| MAMA1 | 2013 December 26 | ||
| MAMA | 2013 December 30 | ||
| MAMA | 2014 January 02 |
2. Observations and Data Reduction
Both optical and UV spectra of SNR 1885 and adjacent M31 bulge were obtained using the Space Telescope Imaging Spectrograph (STIS) in late 2013 and early 2014 as shown in Table 1. Optical spectra were obtained using the STIS CCD detector (STIS/CCD) which employs a pixel CCD covering a field-of-view with an imaging scale of per pixel. Because the M31 bulge is faint in the near UV, on-chip binning was performed with pixel binning, resulting in a final image scale of per pixel. STIS/CCD spectra of SNR 1885 used a slit and the G430L grating covering – Å with a spectral resolution of per pixel.
UV spectra of SNR 1885 covering the wavelength range of – Å were obtained with the STIS Multi-Anode Microchannel Array (MAMA) detector. The MAMA detector has pixels covering a field-of-view with a pixel scale of . The spectra were taken using a slit and the G230L grating covering – Å at per pixel.
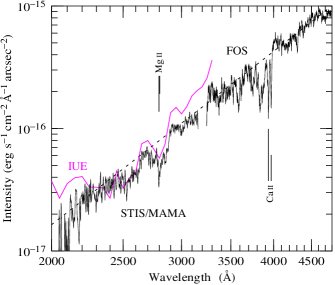
Before discussing in detail the optical and UV spectral observations and data reduction, Figure 2 shows a comparison of the reduced STIS/MAMA UV spectral data for the M31 bulge at the location of SNR 1885 compared to previous observations; namely, UV spectra taken with the International Ultraviolet Explorer (IUE) reported by Burstein et al. (1988), and optical spectra of the bulge obtained with the HST FOS by Fesen et al. (1999). As can be seen in this figure, our STIS UV spectra of the M31 bulge agrees reasonably well with previous reported data in terms of flux and gross spectral energy distribution, giving us confidence in our data reduction procedures.
2.1. Optical Spectra
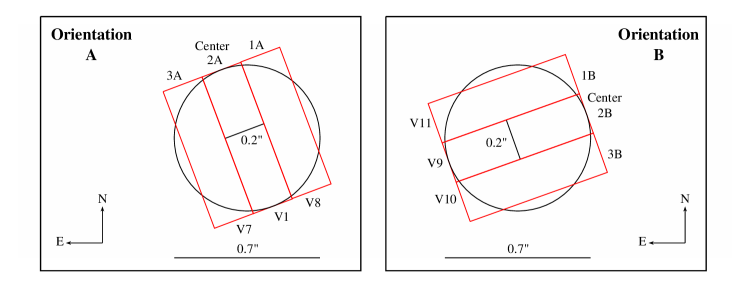
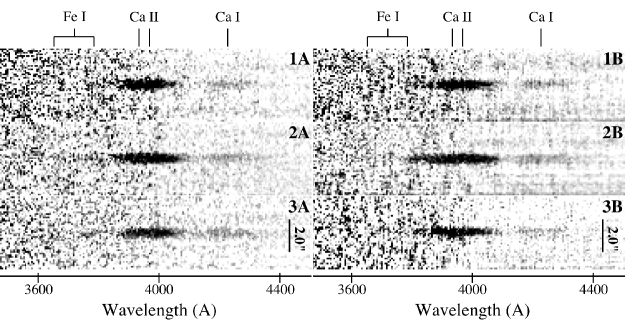
SNR 1885 was observed with the STIS/CCD spectrograph during 24 HST orbits. These data were obtained during six visits, with each visit consisting of four HST orbits. At each visit, spectra at a different slit position across the remnant were taken as illustrated in Figure 3. Slit spectra were obtained at three abutting locations orientated in one direction (Slits 1A, 2A, & 3A), and then in the orthogonal direction (Slits 1B, 2B, & 3B).
The net signal-to-noise of the STIS/CCD 2D spectrum of the M31 bulge in the vicinity of SNR 1885 attained in each visit is 12 – 20 per binned pixel at – Å. However, due to the steep drop in the background M31 bulge flux intensity below , the signal-to-noise falls to 2 – 6 per pixel at – Å.
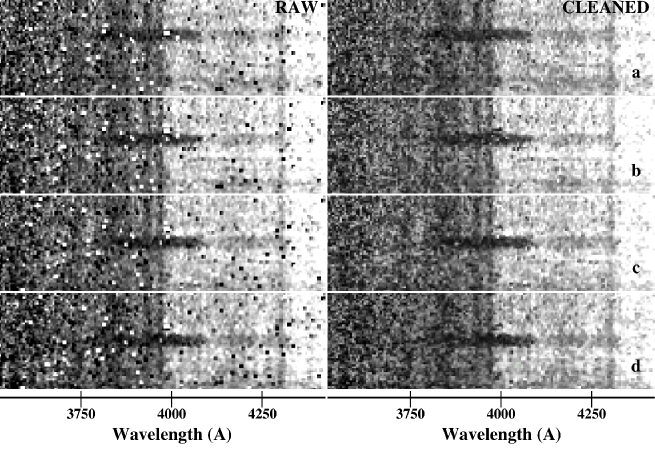
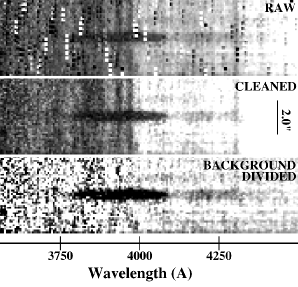
Due to radiation damage of the STIS/CCD over the course of its lifetime in low Earth orbit, a significant number of detector pixels are no longer functioning, recording either an extremely high (‘hot pixel’) or low (‘cold pixel’) flux value. To facilitate removal of these pixels and to mitigate variations in the sensitivity of individual pixels, the spectrum of SNR 1885 was dithered along the slit between successive orbits. The first two orbits of each visit were taken in the same position, while the next two orbits of each visit were dithered by respectively 7 or 14 pixels (A visits) and 3 or 6 pixels (B visits) (see Fig. 4).
To correct for hot and cold pixels that remained despite spectral dithering, we set a range of acceptable flux values and then generated a mask of bad pixels that exceeded this range. Because the flux of the bulge and the sensitivity of the CCD varied significantly between the red and blue wavelengths ends of the spectra, acceptable ranges were varied in narrow wavelength bins across each spectrum.
The IRAF task IMEXPR was used to create a mask of bad pixels, and the IRAF task FIXPIX was used to replace bad pixels using linear interpolation over neighboring pixels. An example of this procedure for Slit 2B is shown in Figure 4, where the left side corresponds to the raw images and the right side corresponds to the cleaned images after pixel corrections.
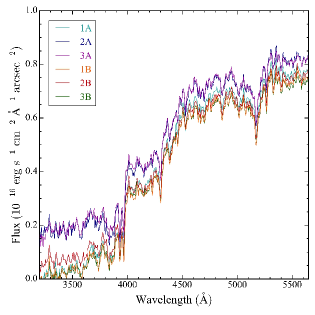
Following these corrections, a 1D background spectrum for each visit was generated using the spectra immediately surrounding the remnant. To do this, we extracted a background bulge spectrum using 11 nine pixel wide regions both above and below the remnant for each orbit in a given visit. The individual 1D spectra from each of the regions were averaged together to form a single 1D spectrum for each visit (see left panel of Figure 5).
As Figure 5 shows, we found that there are systematic large-scale variations between the STIS/CCD spectra for different visits. Empirically, the differences appear to consist primarily of a constant offset in the intensity from each visit. We corrected for these offsets by adjusting the STIS/CCD background spectra by , where the six constant offsets were calculated such that the mean intensity over – for each visit were in agreement.
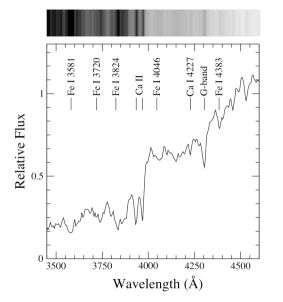
The results of these corrections are shown in the right panel of Figure 5. As shown in the figure, following these flux corrections, the background M31 spectra are consistent with each other at wavelengths above . The left panel of Figure 6 shows the average 1D M31 bulge spectrum with major stellar absorption features marked.
Next, the individual orbit images for each visit were co-aligned and averaged to form a single 2D spectrum at each slit position. The 2D spectrum was then flux scaled by the same constant offset as the background for the given visit. We then divided the 2D spectrum of SNR 1885 by the 1D background spectrum.
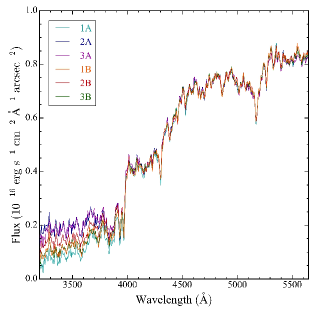
However, as shown in Figure 5, there were still residual background spectral differences between visits below 3900 Å. These differences are likely due to an uneven stellar distribution in the near UV. To correct for these differences, we highly smoothed the residual M31 background spectra from above and below the remnant and then divided this into the remnant’s spectrum for each visit.
The right hand panel in Figure 6 shows an example of the three major stages of data reduction for slit position 2B. The final reduced STIS/CCD spectra for the six individual slit positions are shown in Figure 7.
2.2. UV Spectra
UV spectra of SNR 1885 were obtained with the STIS/MAMA in 15 orbits split into four visits. Three of the four visits consisted of four orbits, while the remaining visit was only three orbits. All spectra were taken at a single slit position with the slit orientation the same as the A configuration of the STIS/CCD observations (see Fig. 3). The placement of SNR 1885 during successive orbits within a visit was dithered by along the slit.
The three four-orbit visits yielded data consistent with each other, but the shorter three-orbit visit yielded negative mean fluxes suggestive of a calibration problem; consequently, we discarded those data. The total exposure time used in our study was . We note that during each visit, the flux from later orbits was systematically lower than that from earlier orbits, with the mean flux becoming negative at shorter wavelengths. Moreover, measured fluxes were found to be negative below and thus untrustworthy below about .
As was done for the STIS/CCD data, M31’s bulge spectrum was found using the spectra surrounding the remnant in the coaligned, summed 2D spectrum. Eleven regions were extracted from above and below the remnant and averaged together. The individual pixels of this 2D image were then averaged to form a single 1D bulge spectrum for M31. The spectrum of SNR 1885 was then divided by M31’s bulge spectrum.
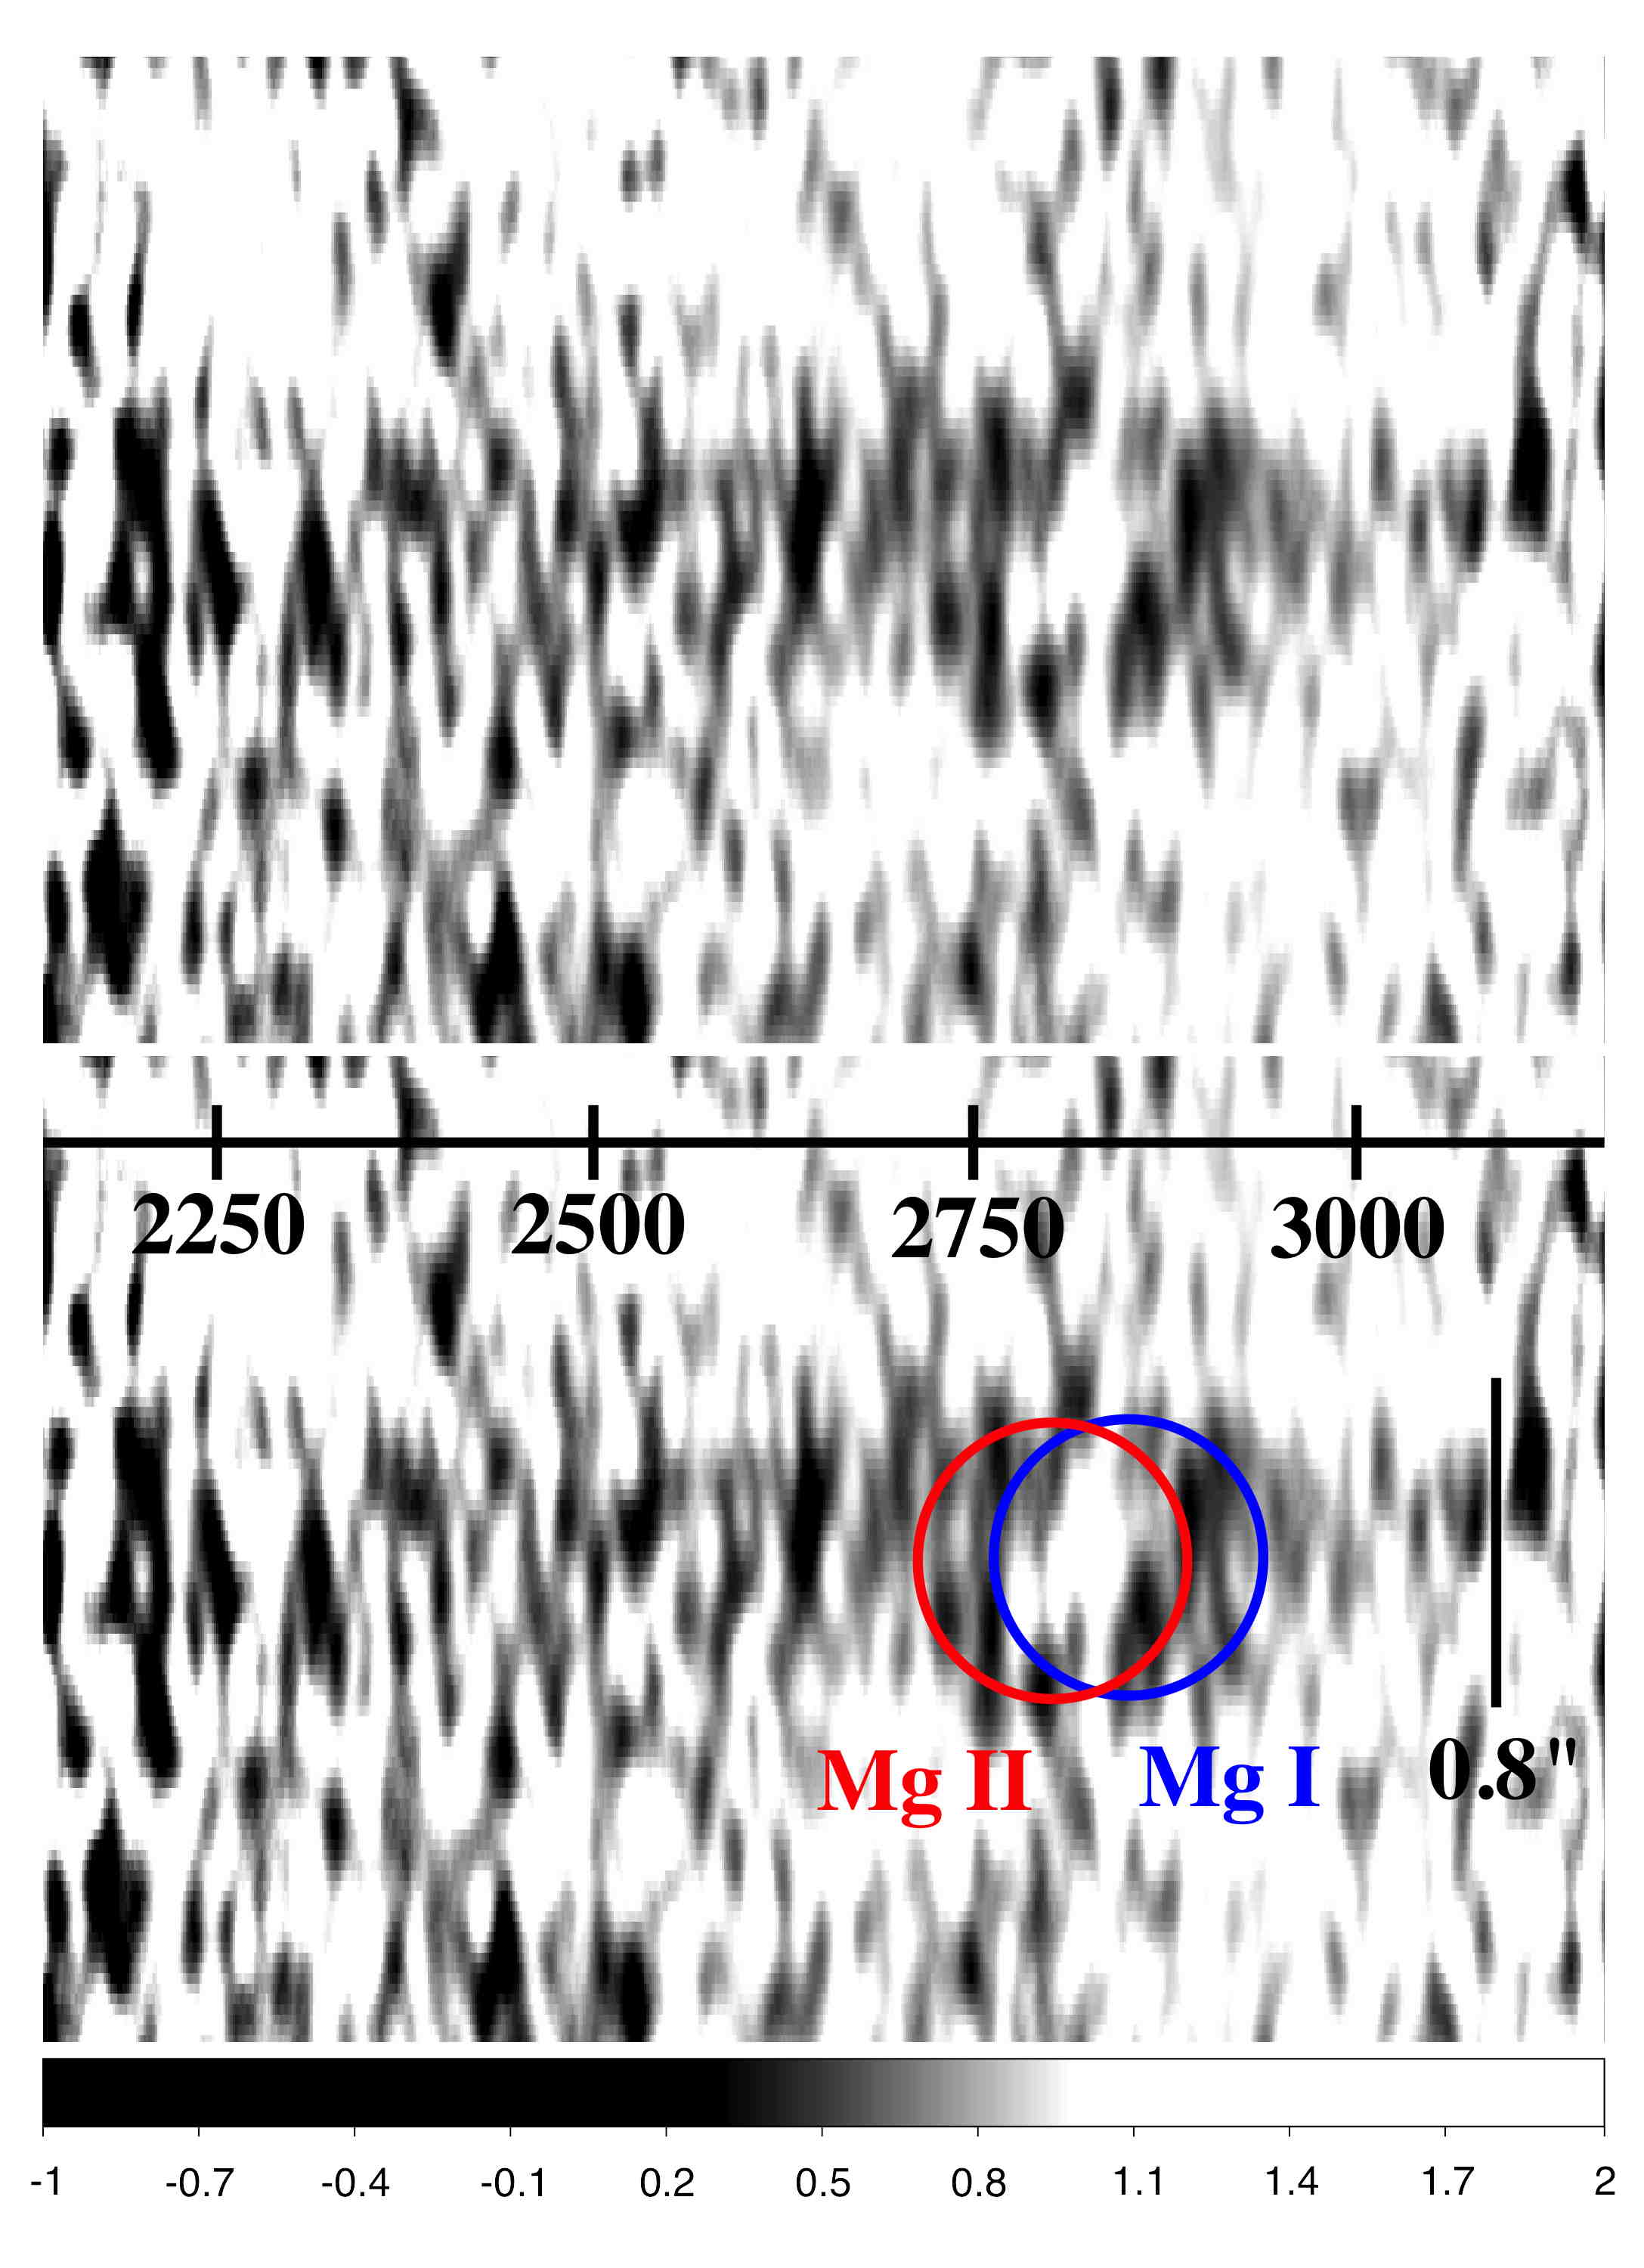
The resulting M31 bulge background-corrected UV spectrum of SNR 1885 is shown in Figure 8. The spectrum has been stretched vertically by a factor of 4.38 so that a spherically symmetric absorbing shell appears spherical. Although there is a small uncertainty in the precise positioning of the slit with respect to the center of SNR 1885, we attribute the horizontal band of absorption near the nominal slit center to be due to absorption from SNR 1885.
| Slit | Ca II | Ca I | Fe I (Blue) | Fe I (Red) | ||||
|---|---|---|---|---|---|---|---|---|
| Position | Wavelength | Velocity | Wavelength | Velocity | Wavelength | Velocity | Wavelength | Velocity |
| (1) | (2) | (3) | (4) | (5) | (6) | (7) | (8) | (9) |
| 1A | , | , | , | , | ||||
| 2A | , | , | , | , | ||||
| 3A | , | , | , | |||||
| 1B | , | , | , | , | ||||
| 2B | , | , | , | , | ||||
| 3B | , | , | , | , | ||||
Note. — Columns: (1) – Slit positions. (2 & 3) – Wavelength and velocity of Ca II absorption features. Note: Velocities are underestimates due to the overlap between the Ca I and Fe I absorption features. (4 & 5) – Wavelength and velocity of the Ca I absorption features. The blueshifted velocities are underestimates due to overlap with redshifted Ca II absorption. The red wavelengths should be a truer measure of the maximum radial velocity. (6 & 7) – Wavelength and velocity of the blue side of the shell of Fe I . (8 & 9) – Wavelength and velocity of the red side of the shell of Fe I . The wavelengths and velocities on the red side of this feature may be underestimates due to the overlap with blueshifted Ca II absorption.
3. Results
The goal of taking these STIS spectra was to investigate the three dimensional structure of Ca, Fe, and Mg rich ejecta in SNR 1885. For example, variations in Ca II absorption might indicate regions of increased or decreased Ca+ concentrations much like those seen in narrow-passband HST Ca II images (Fesen et al., 2007, 2015). These spectra also allow a comparison with a 1996 FOS spectrum of SNR 1885 (Fesen et al., 1999) to look for changes in absorption in the intervening 17 year period.
Below we describe the observed optical and UV absorption features for SNR 1885, limited by the signal-to-noise for the weaker Ca I and Fe I features and the highly saturated nature of the Ca II H & K line absorption blend. In addition, due to the high velocities observed in the remnant, there is significant overlap between these absorption features, which limits measurements of the maximum velocities observed for Ca II, the maximum blueshifted velocity for Ca I, and the maximum redshifted velocity for Fe I.
3.1. Ca II
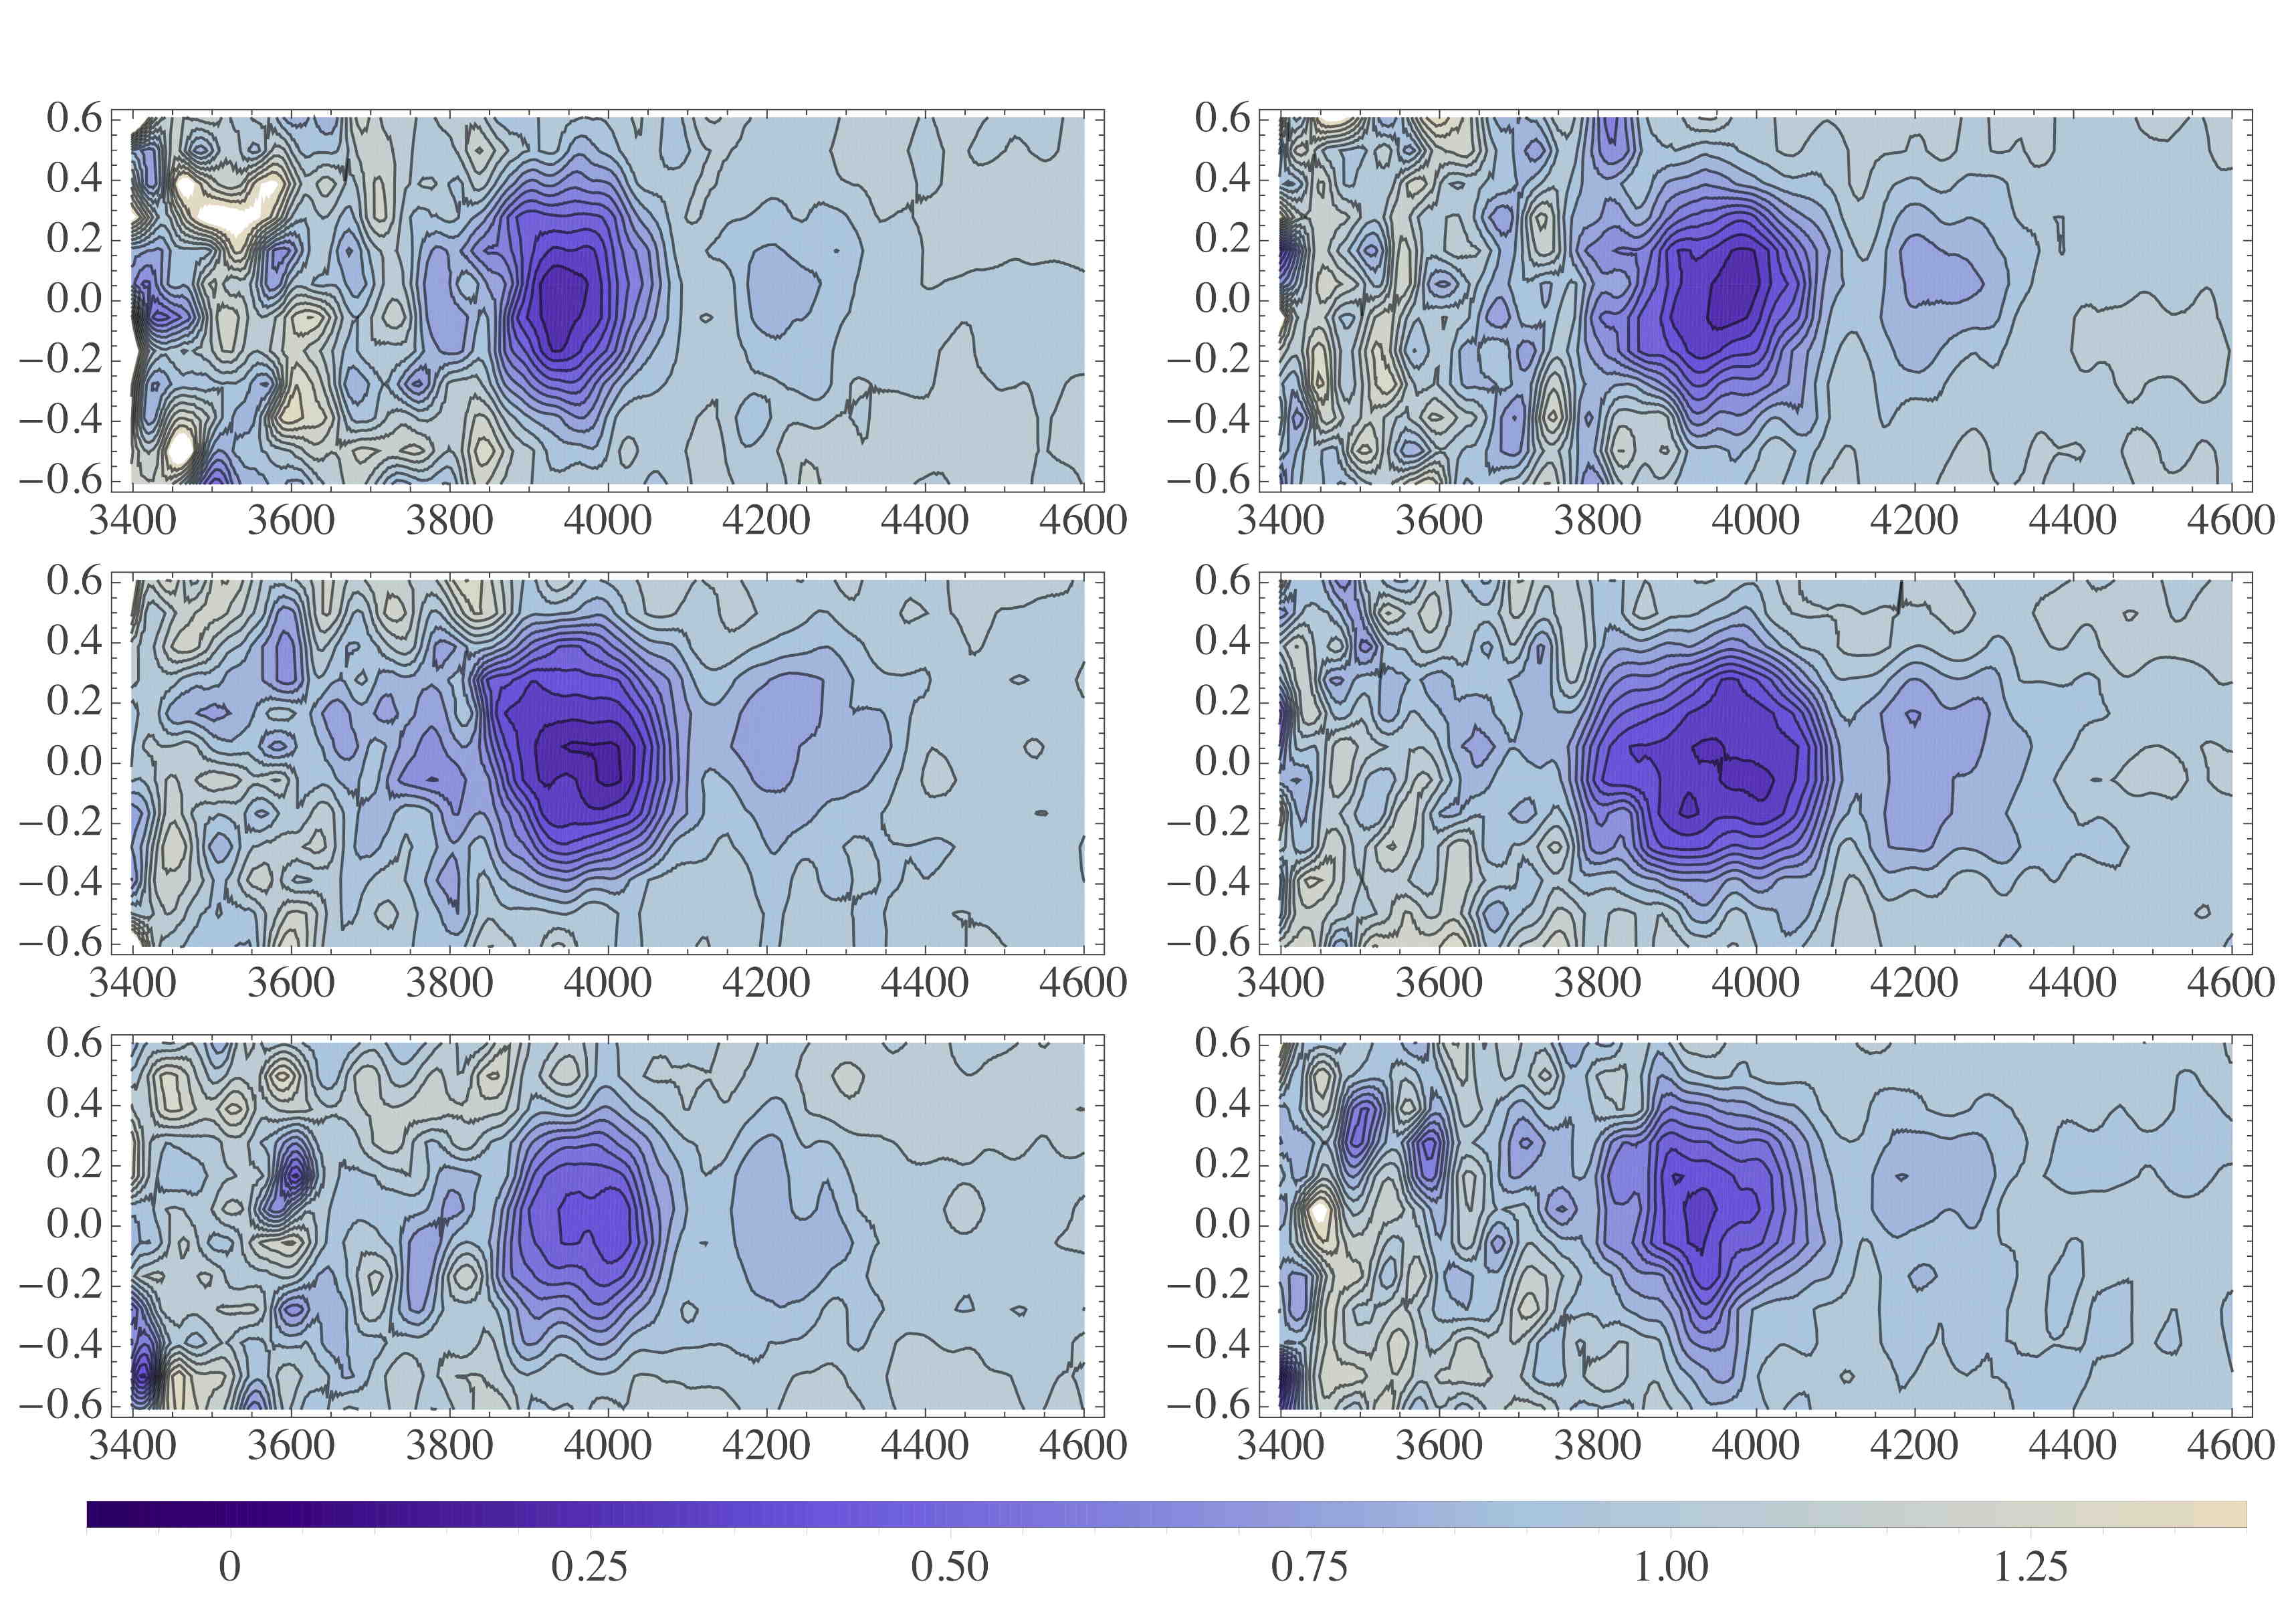
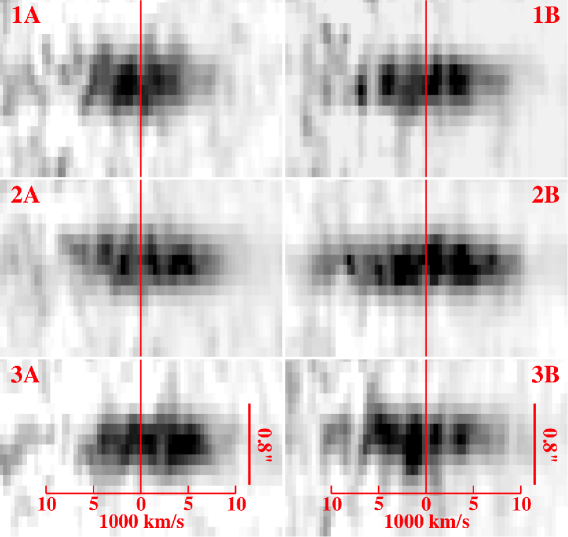
While there are variations in the remnant’s Ca II absorption among the slit spectra, they indicate a fairly spherical remnant. Figure 9 shows 2D intensity contour plots of the six background-corrected STIS/CCD spectra covering the remnant’s Fe I 3720 Å, Ca II 3934, 3968 Å, and Ca I 4227 Å resonance line absorptions. The contours have been stretched vertically by a factor of seven so that a spherical distribution of absorbing ejecta appears spherical in these images. The spectra have also been smoothed with a Gaussian with 1- width of 3 pixels in the horizontal (wavelength) direction, and 1/2 pixel in the vertical (angle along the slit) direction, so that the image resolution is comparable in both directions. As expected, the two central spectra, Slits 2A and 2B, appear the most spherical, with the Ca II absorption at Slit 2B affected by some redshifted Fe I 3720 Å absorption.
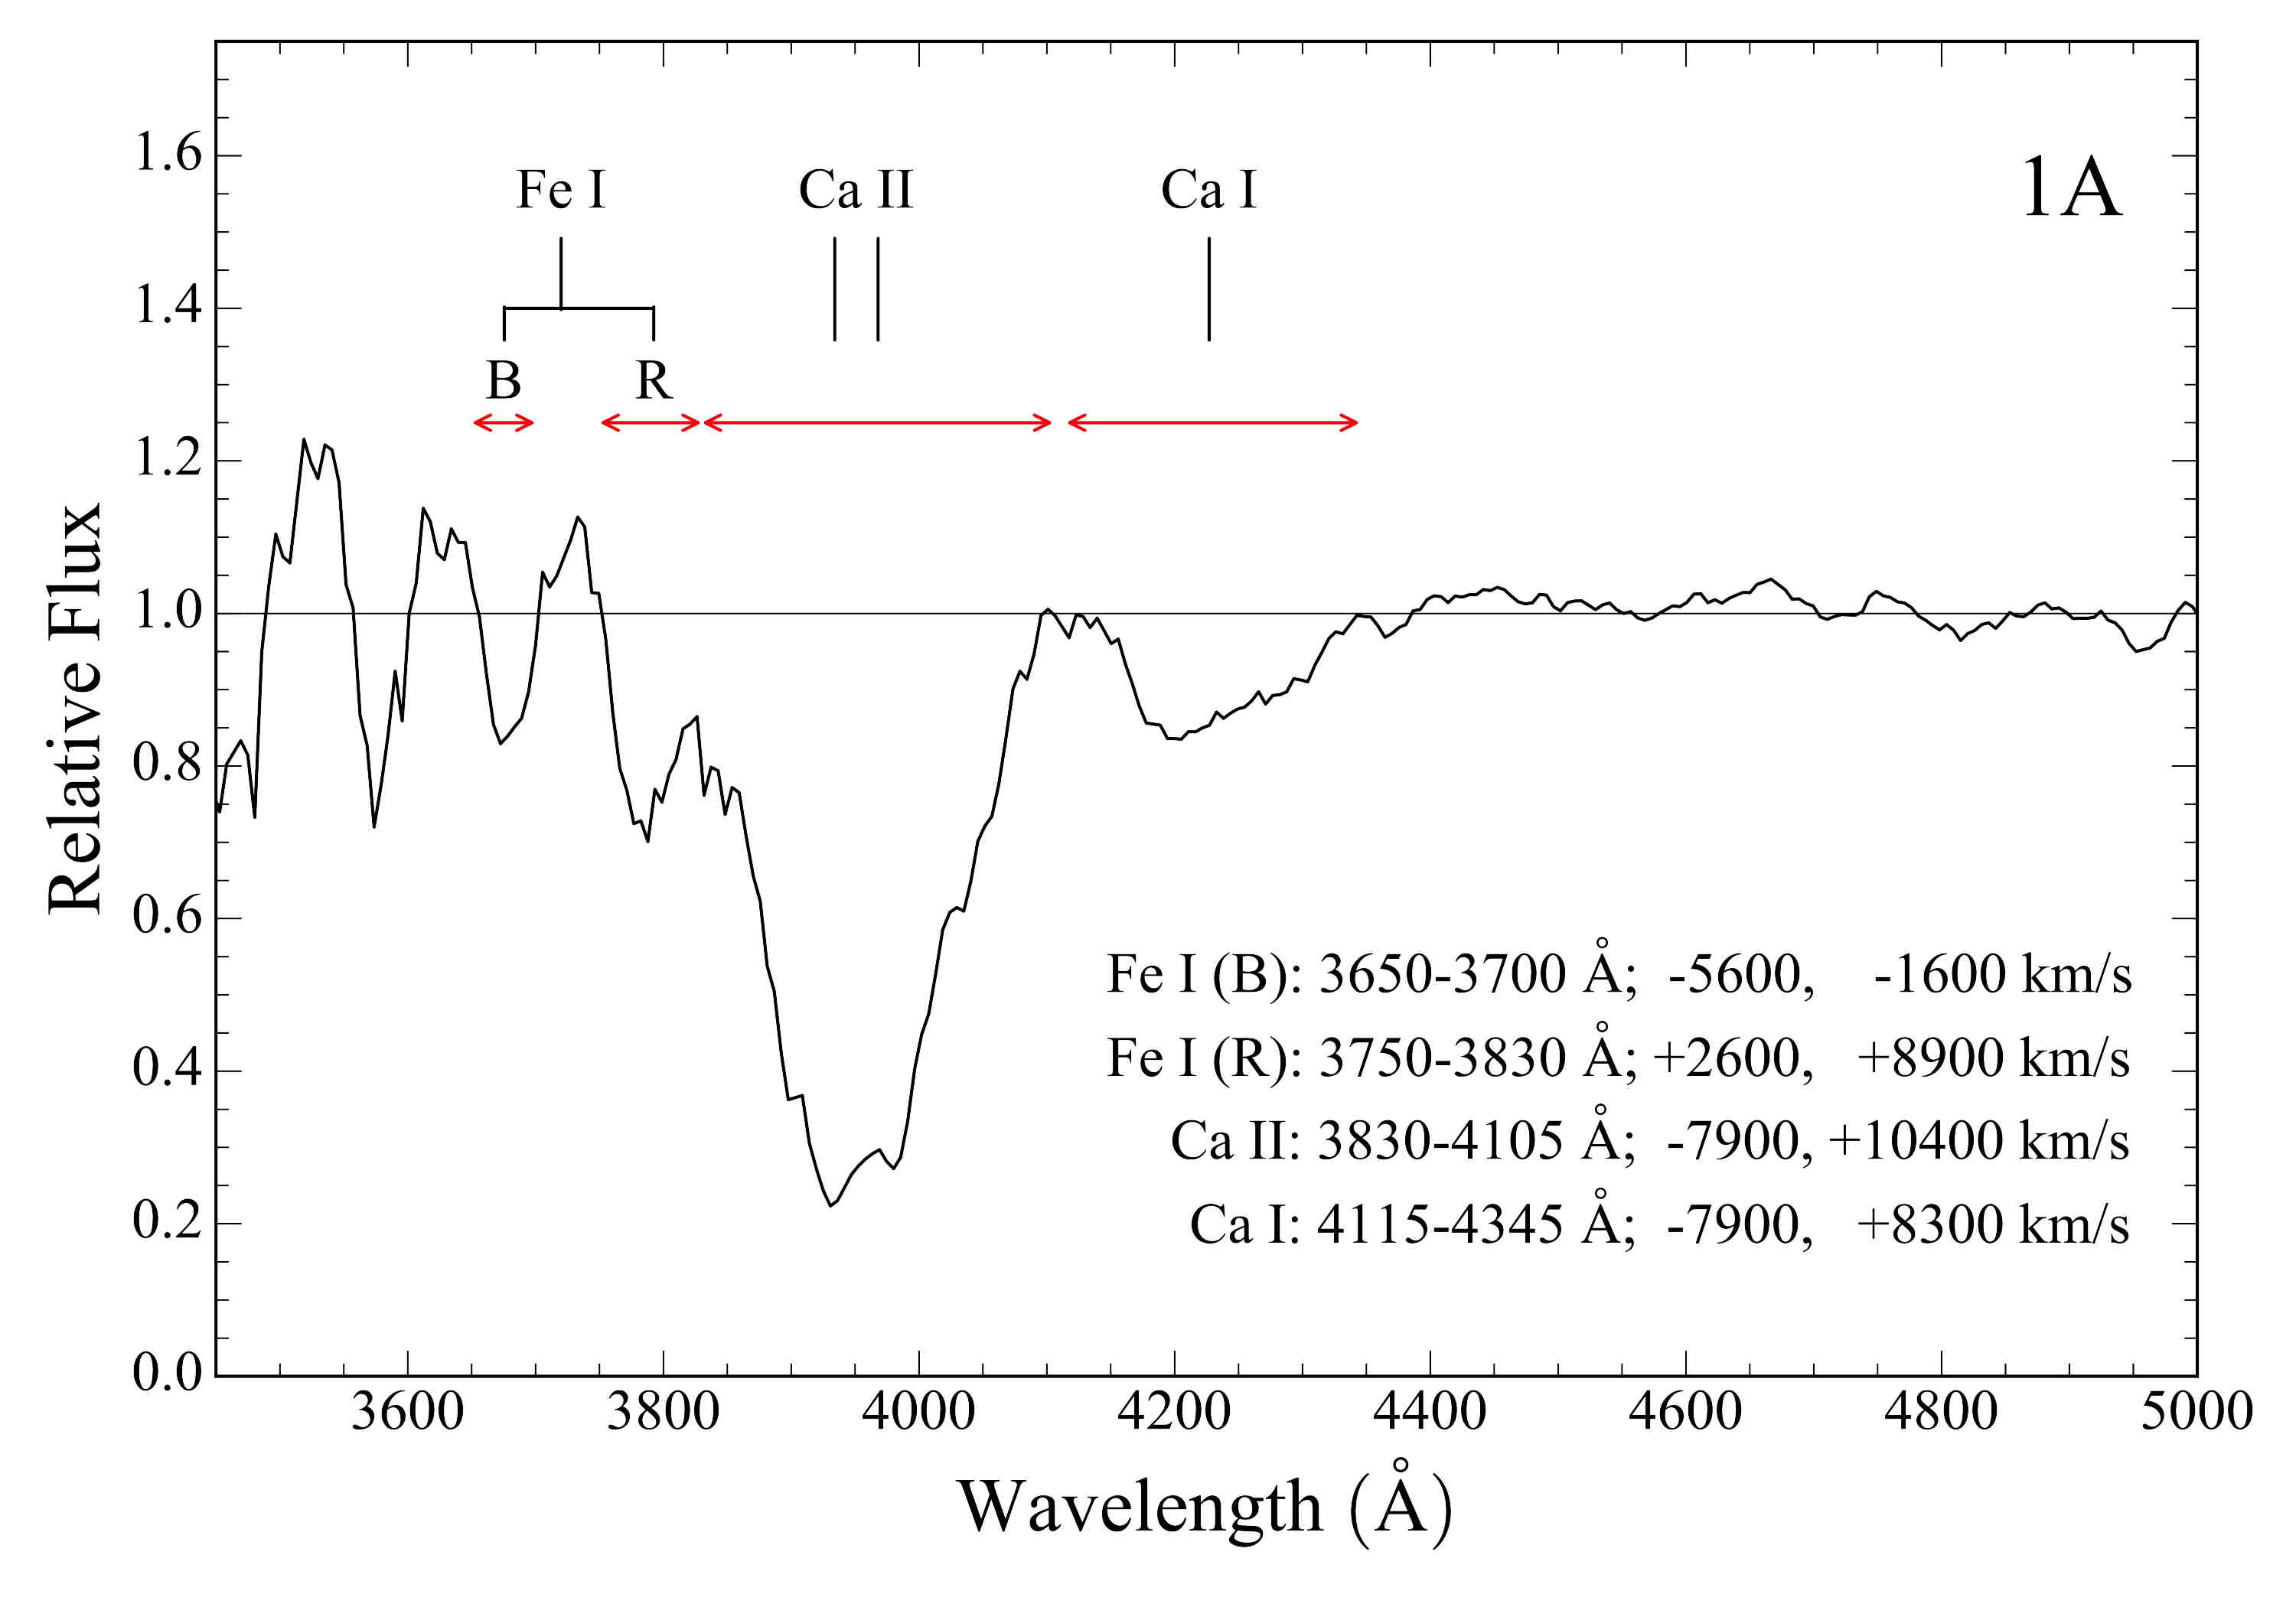
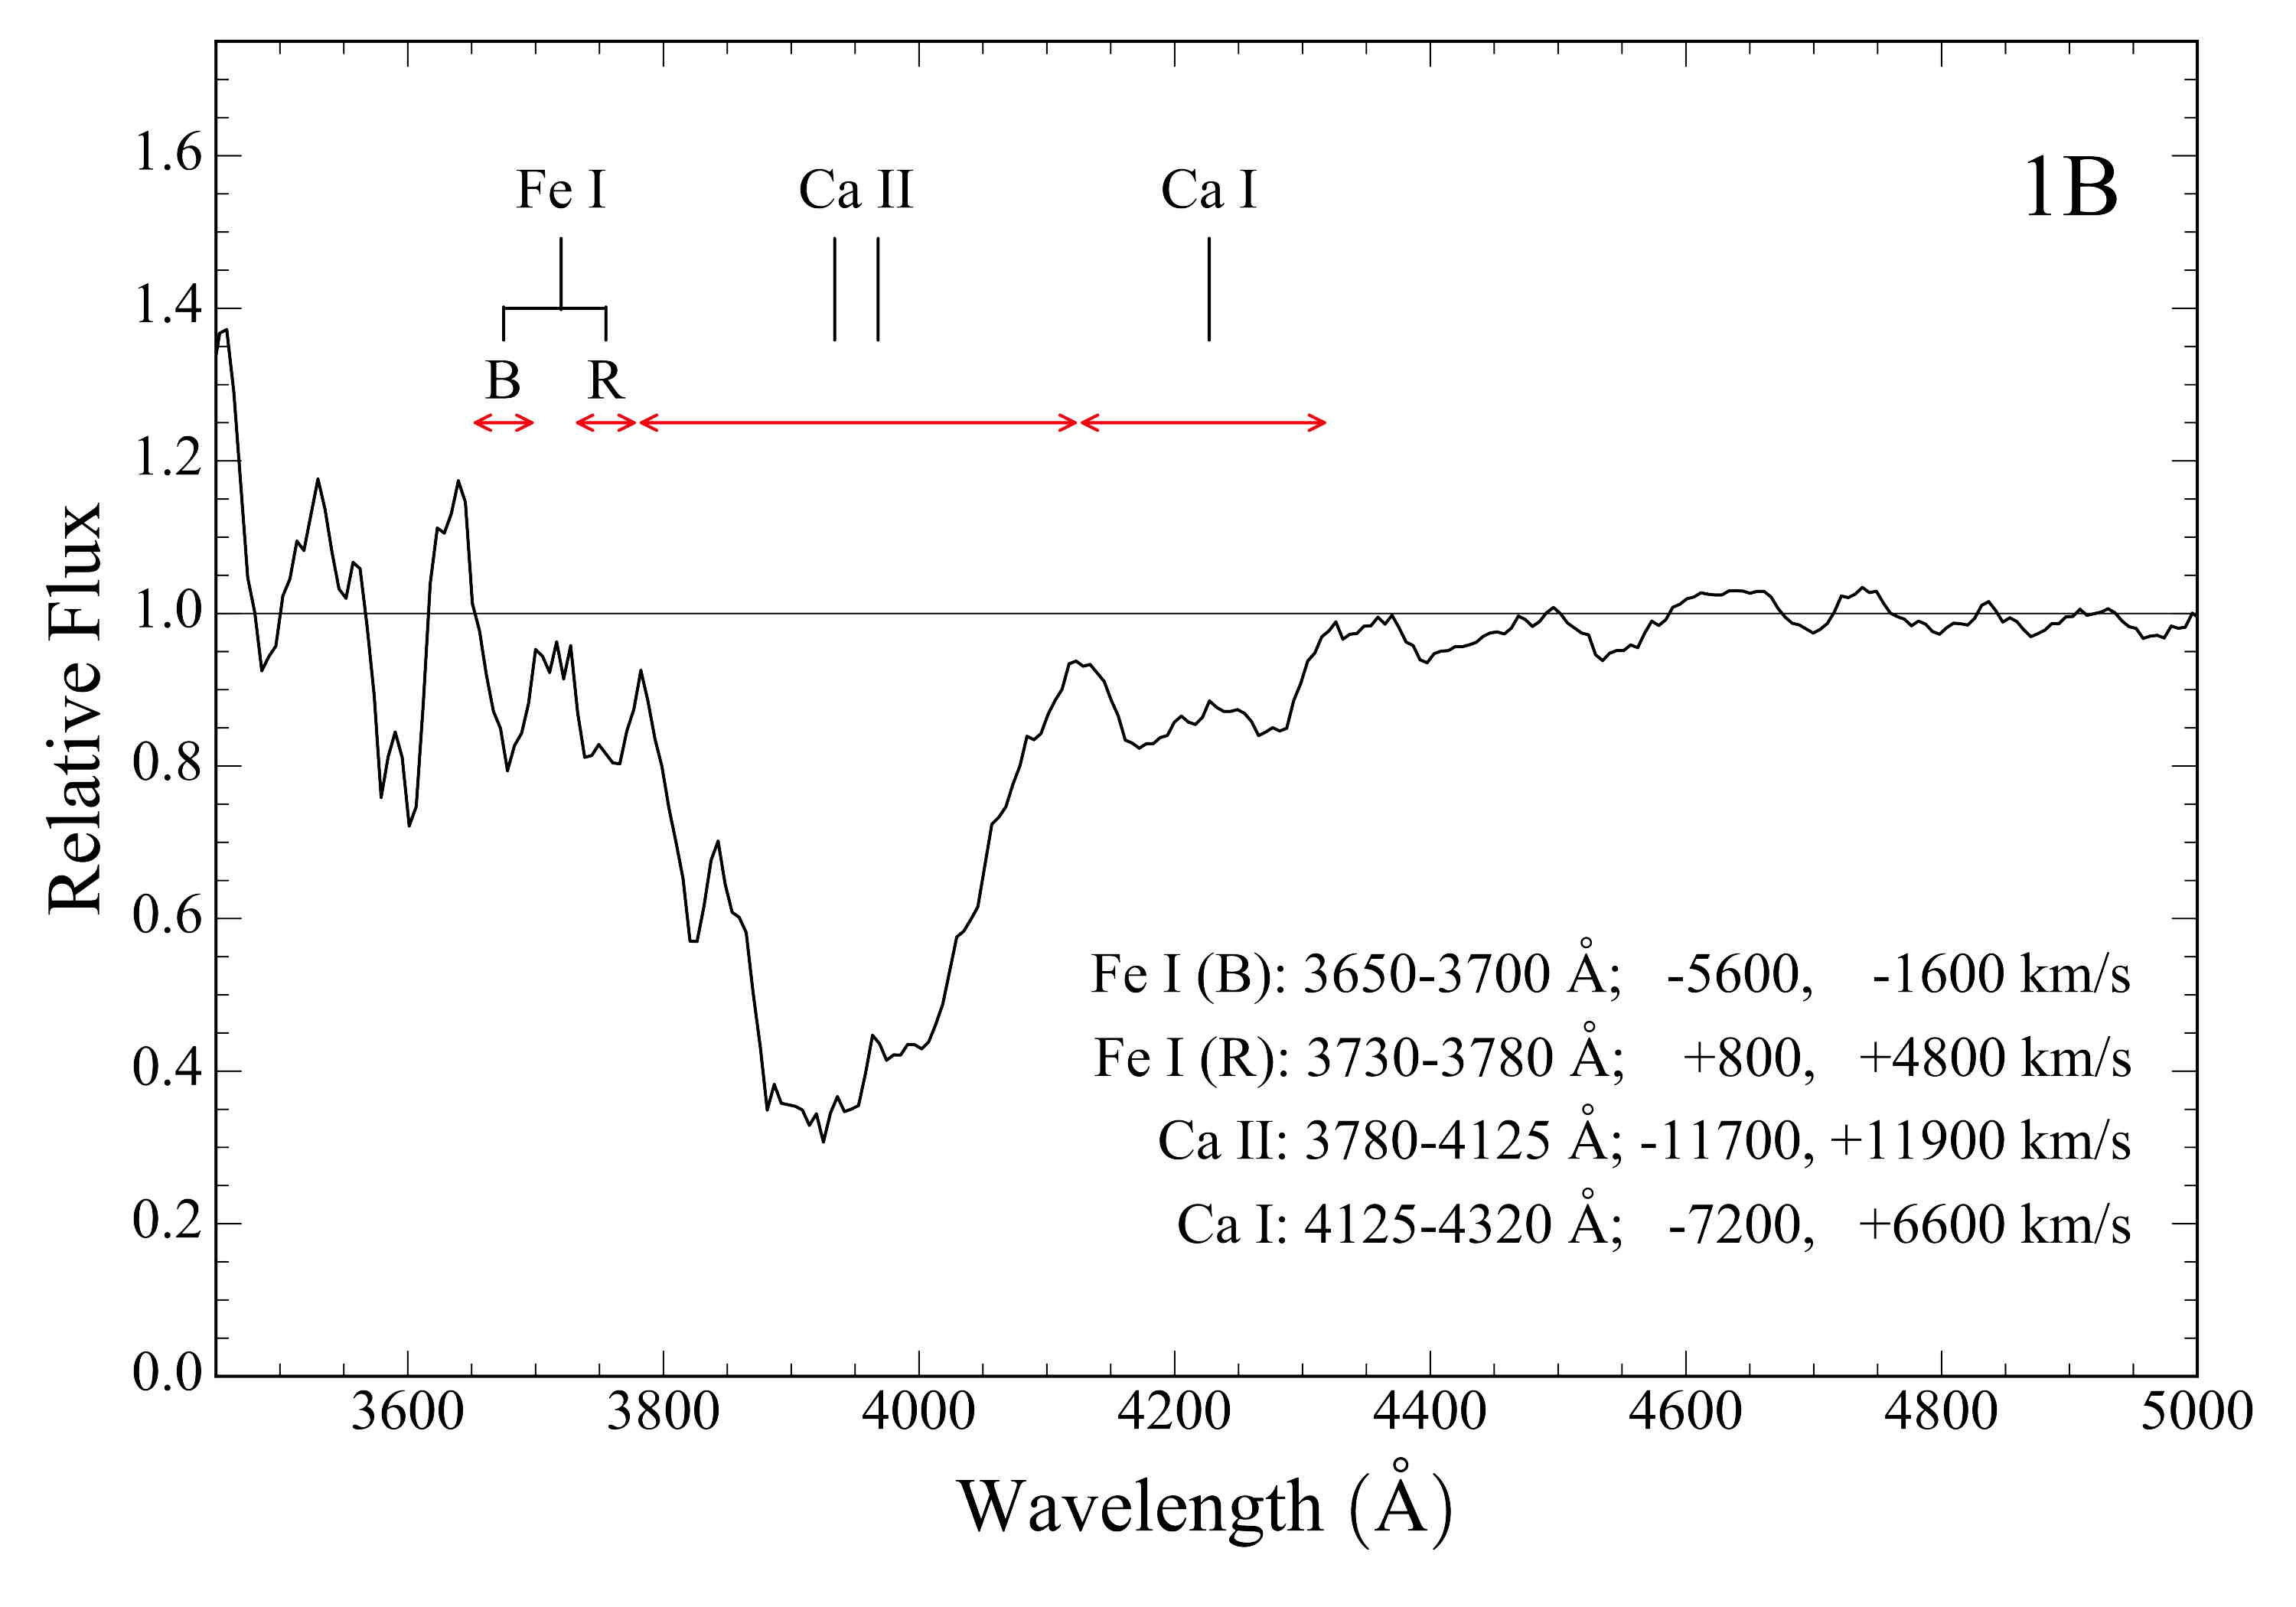
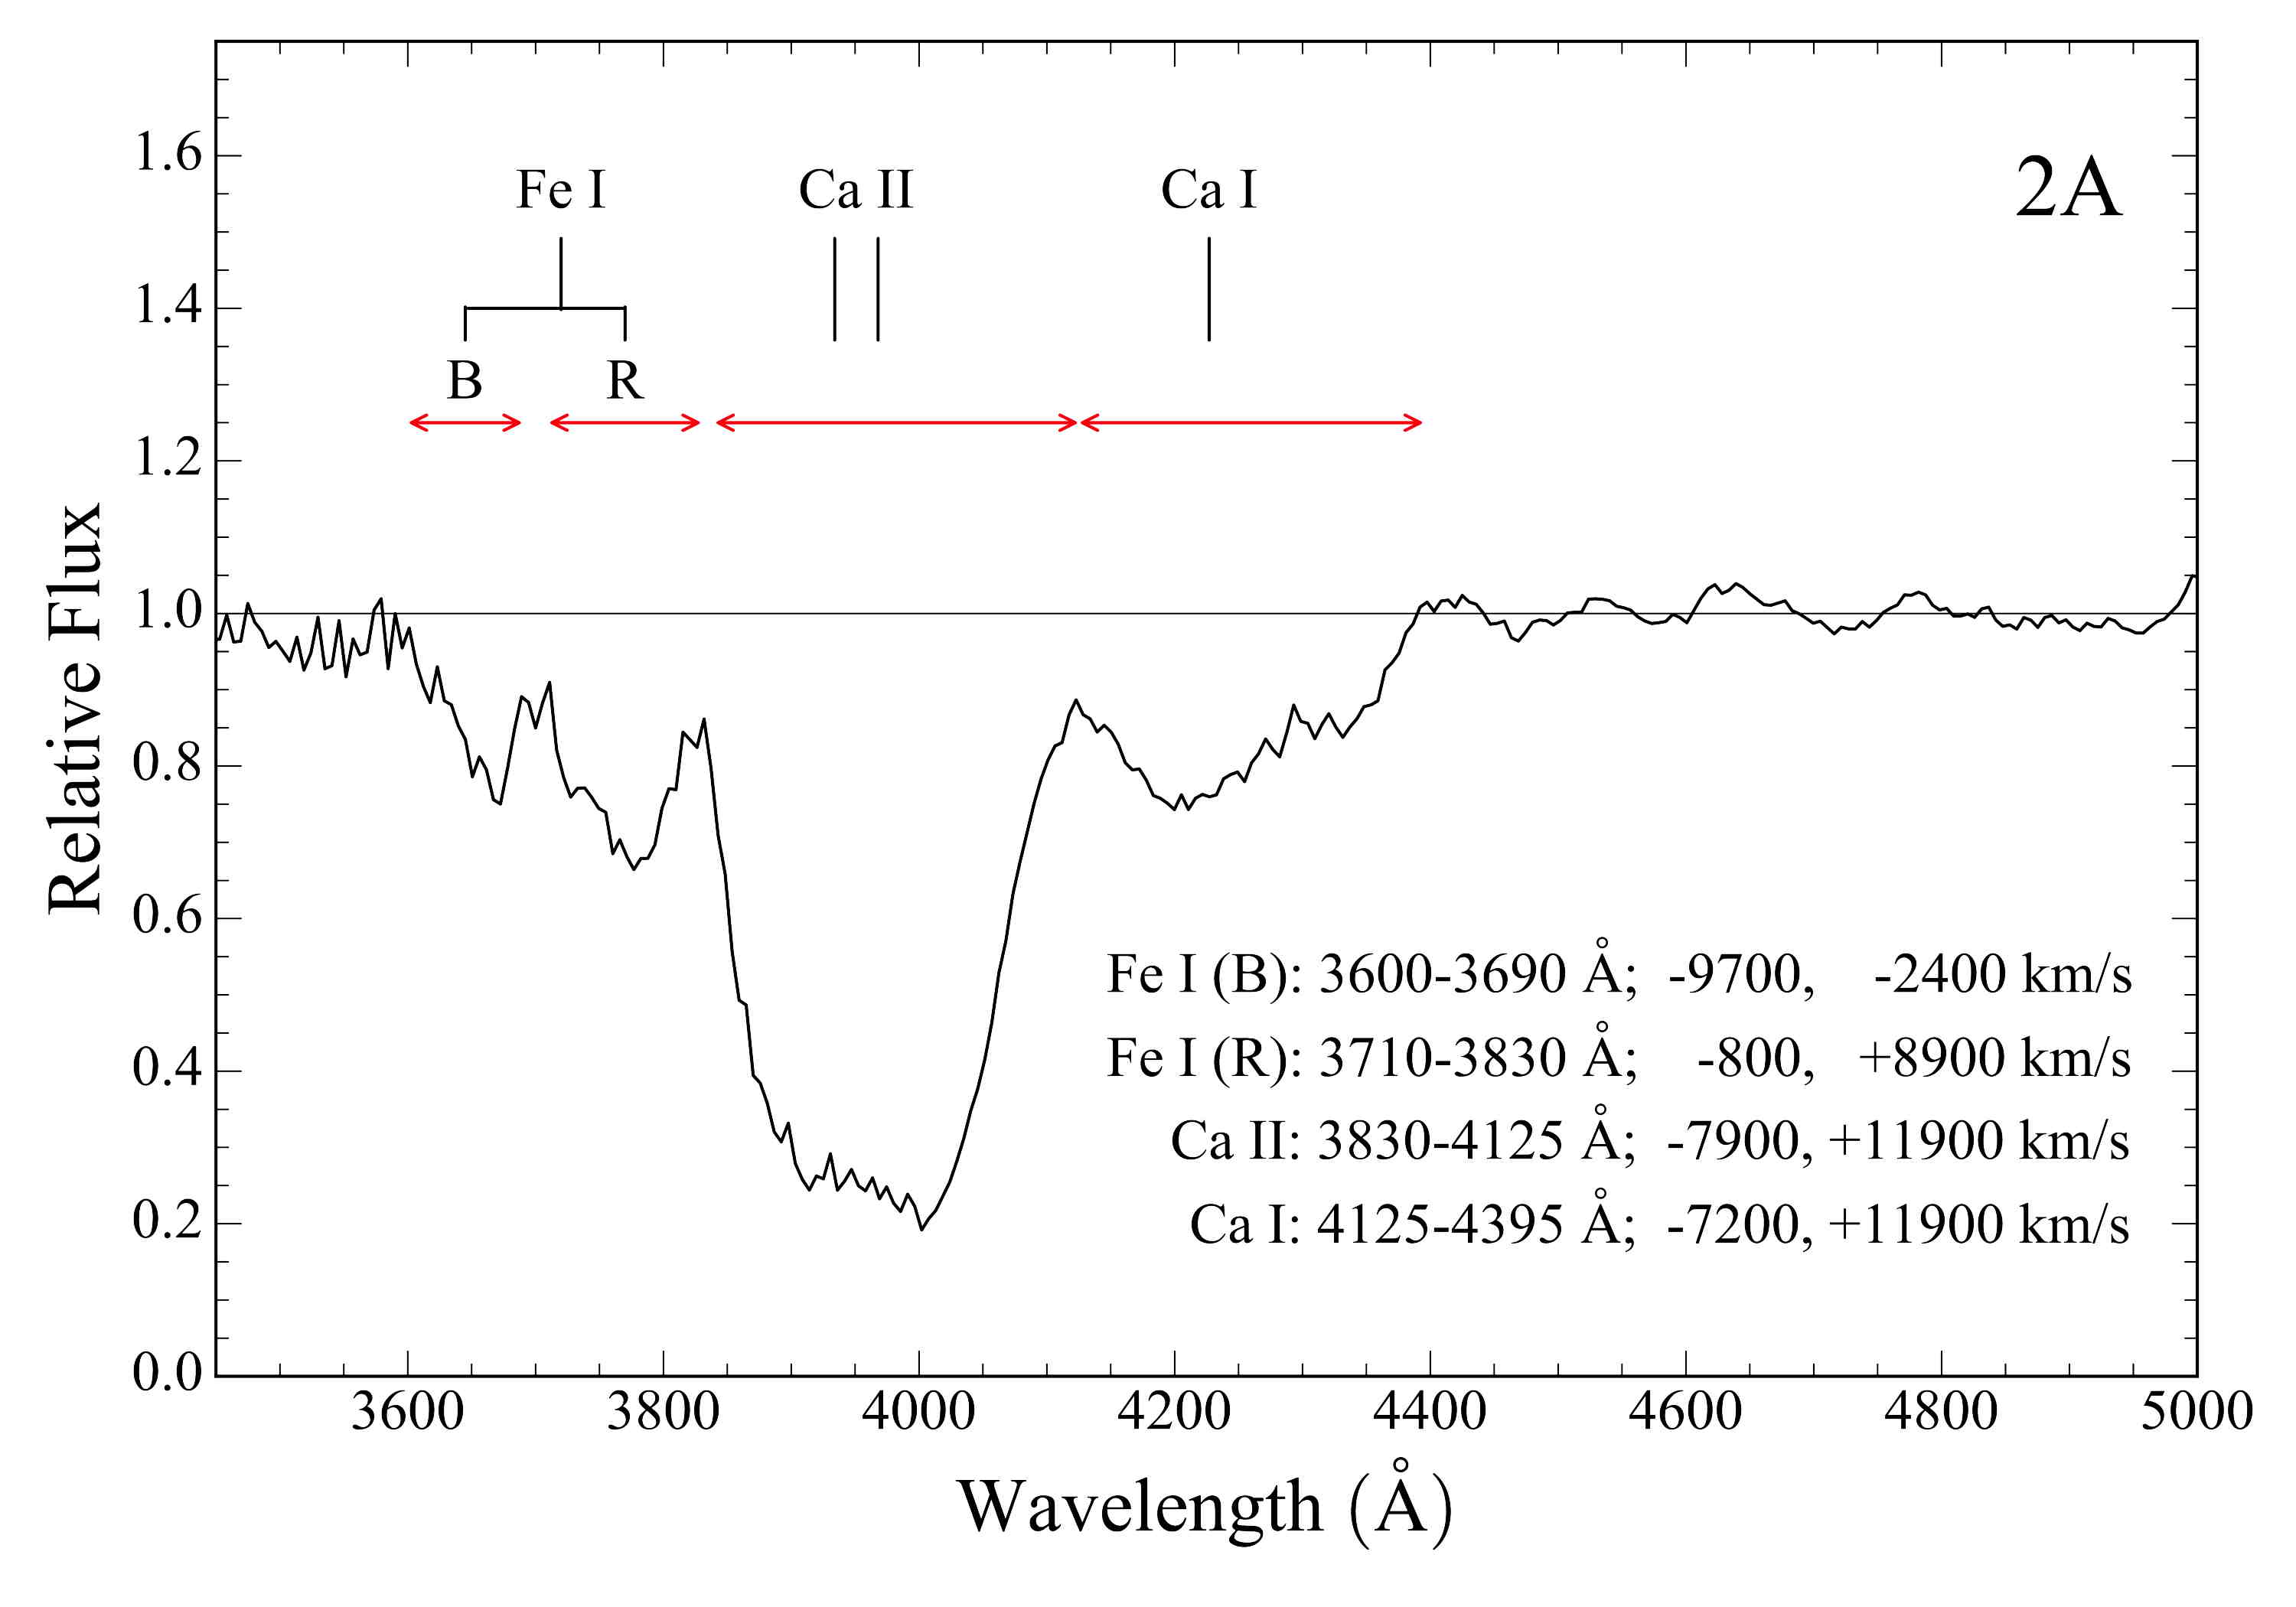
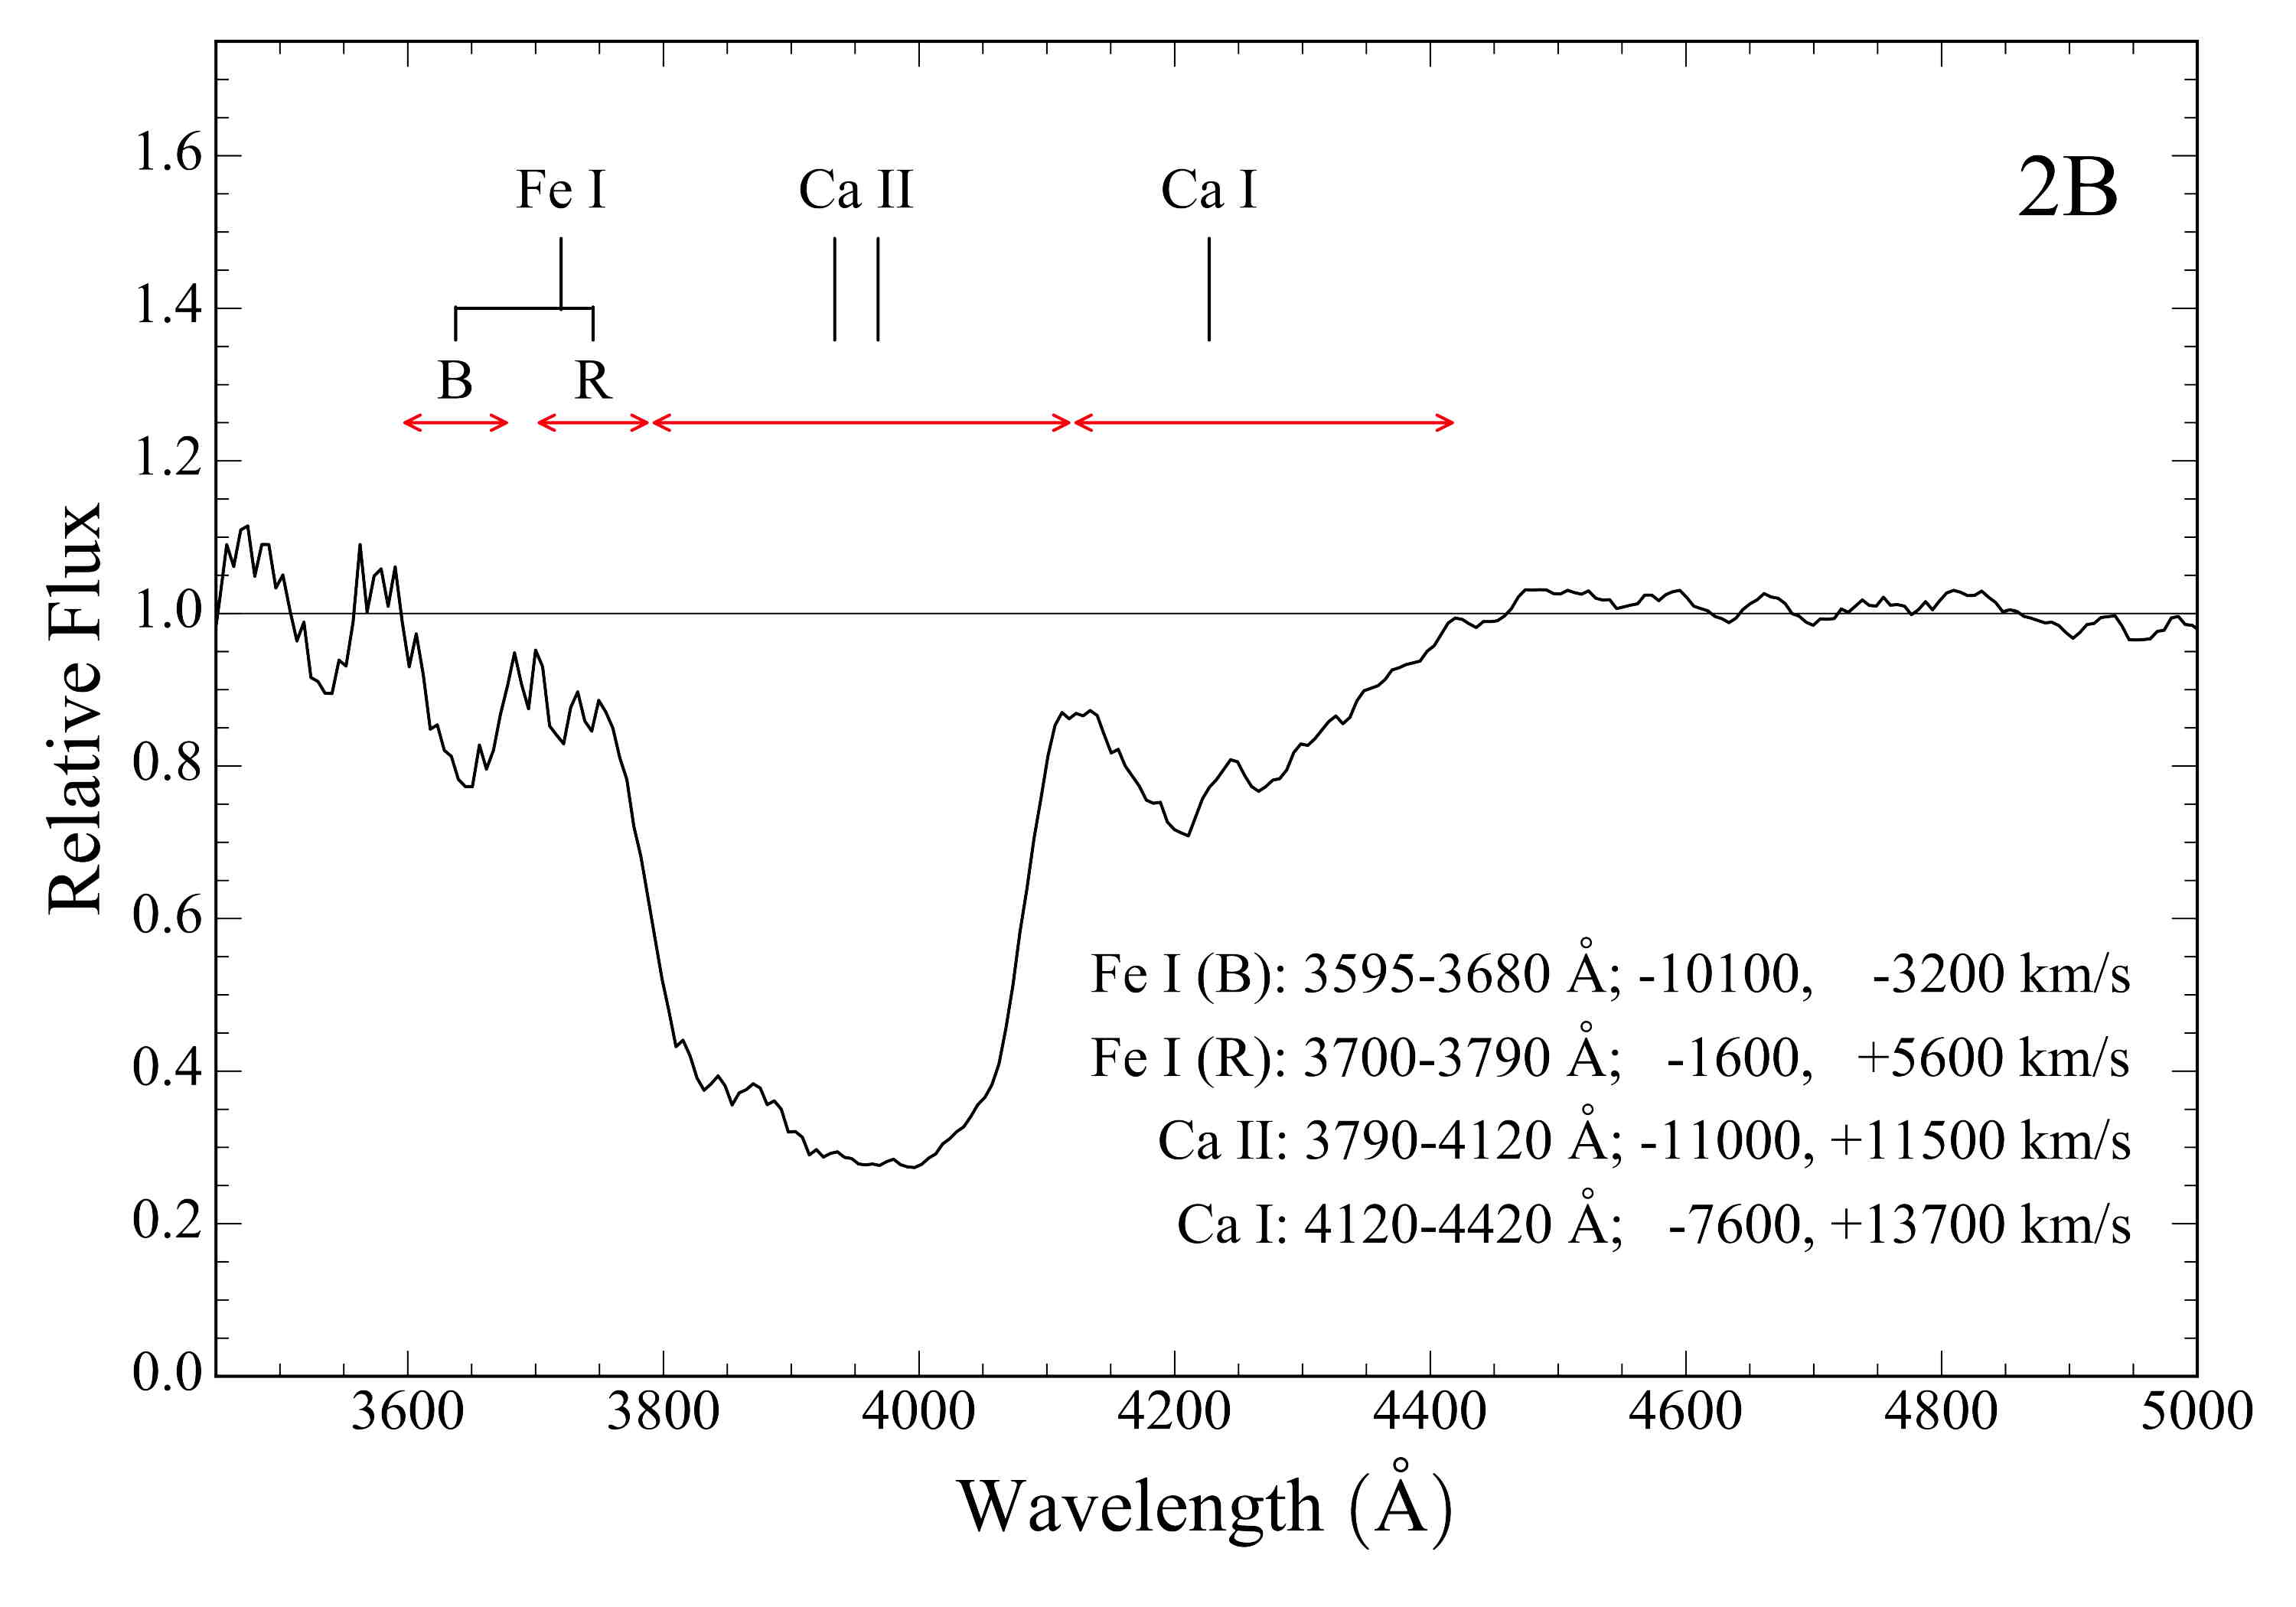
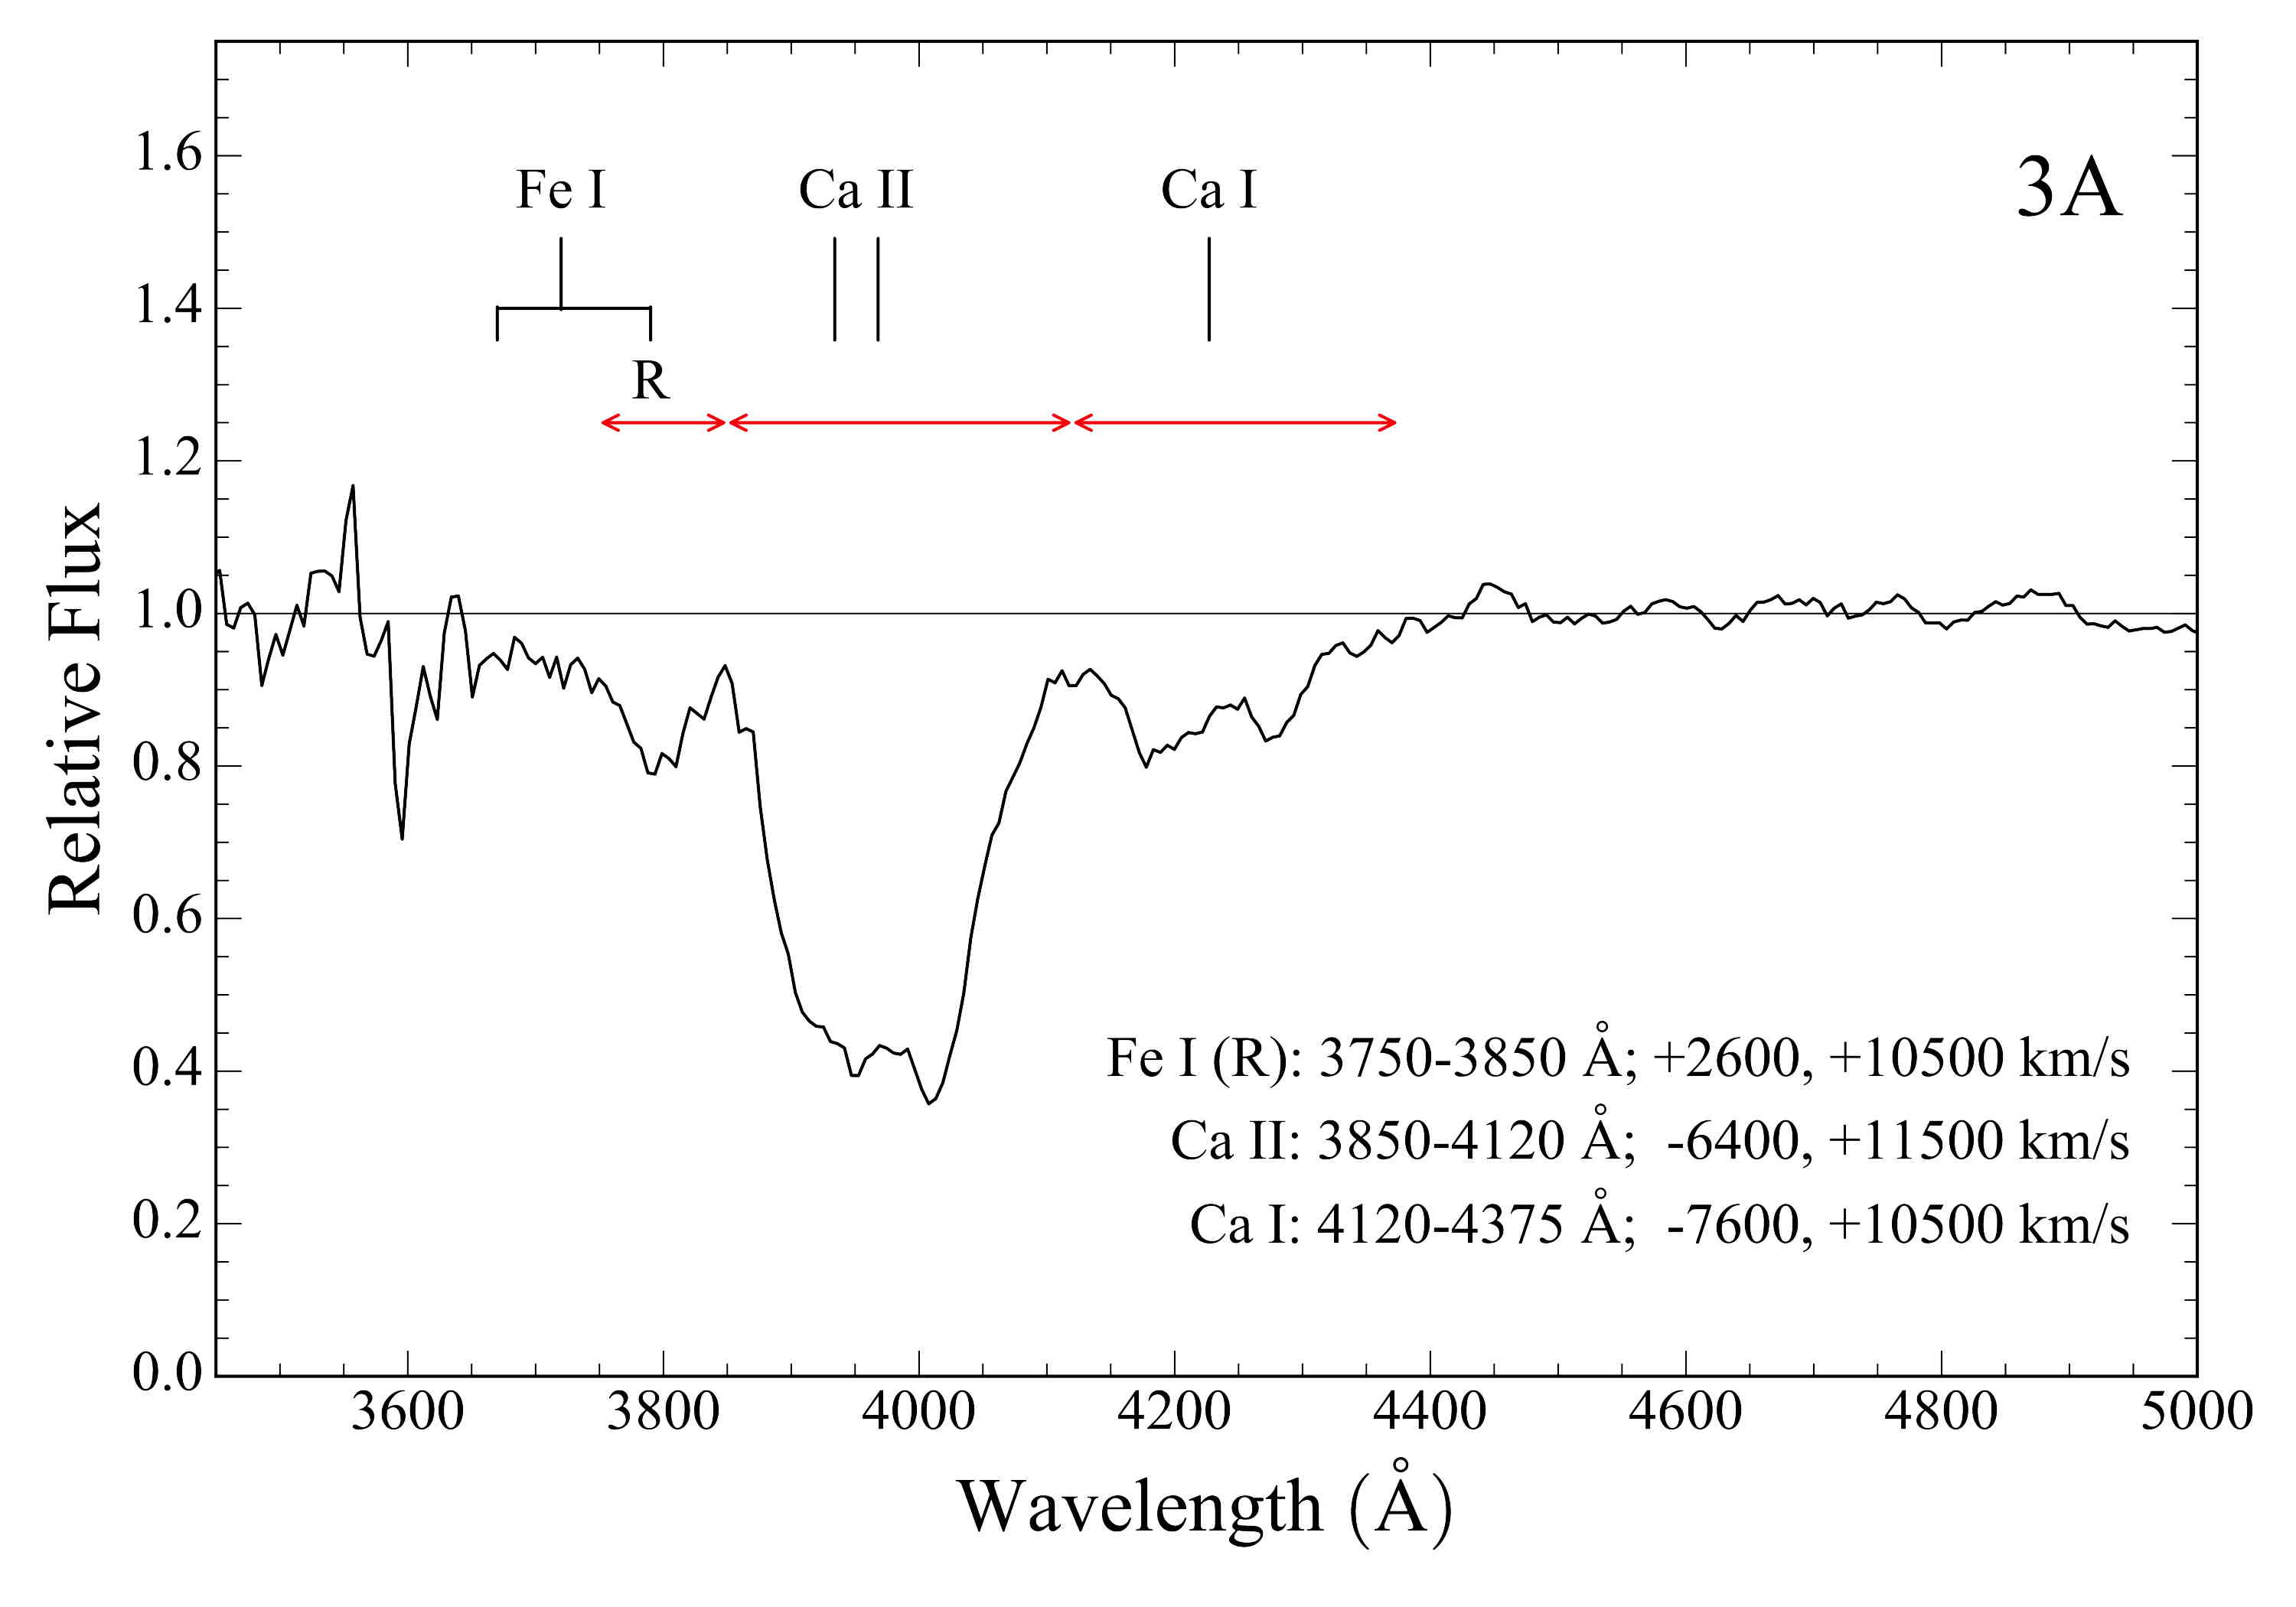
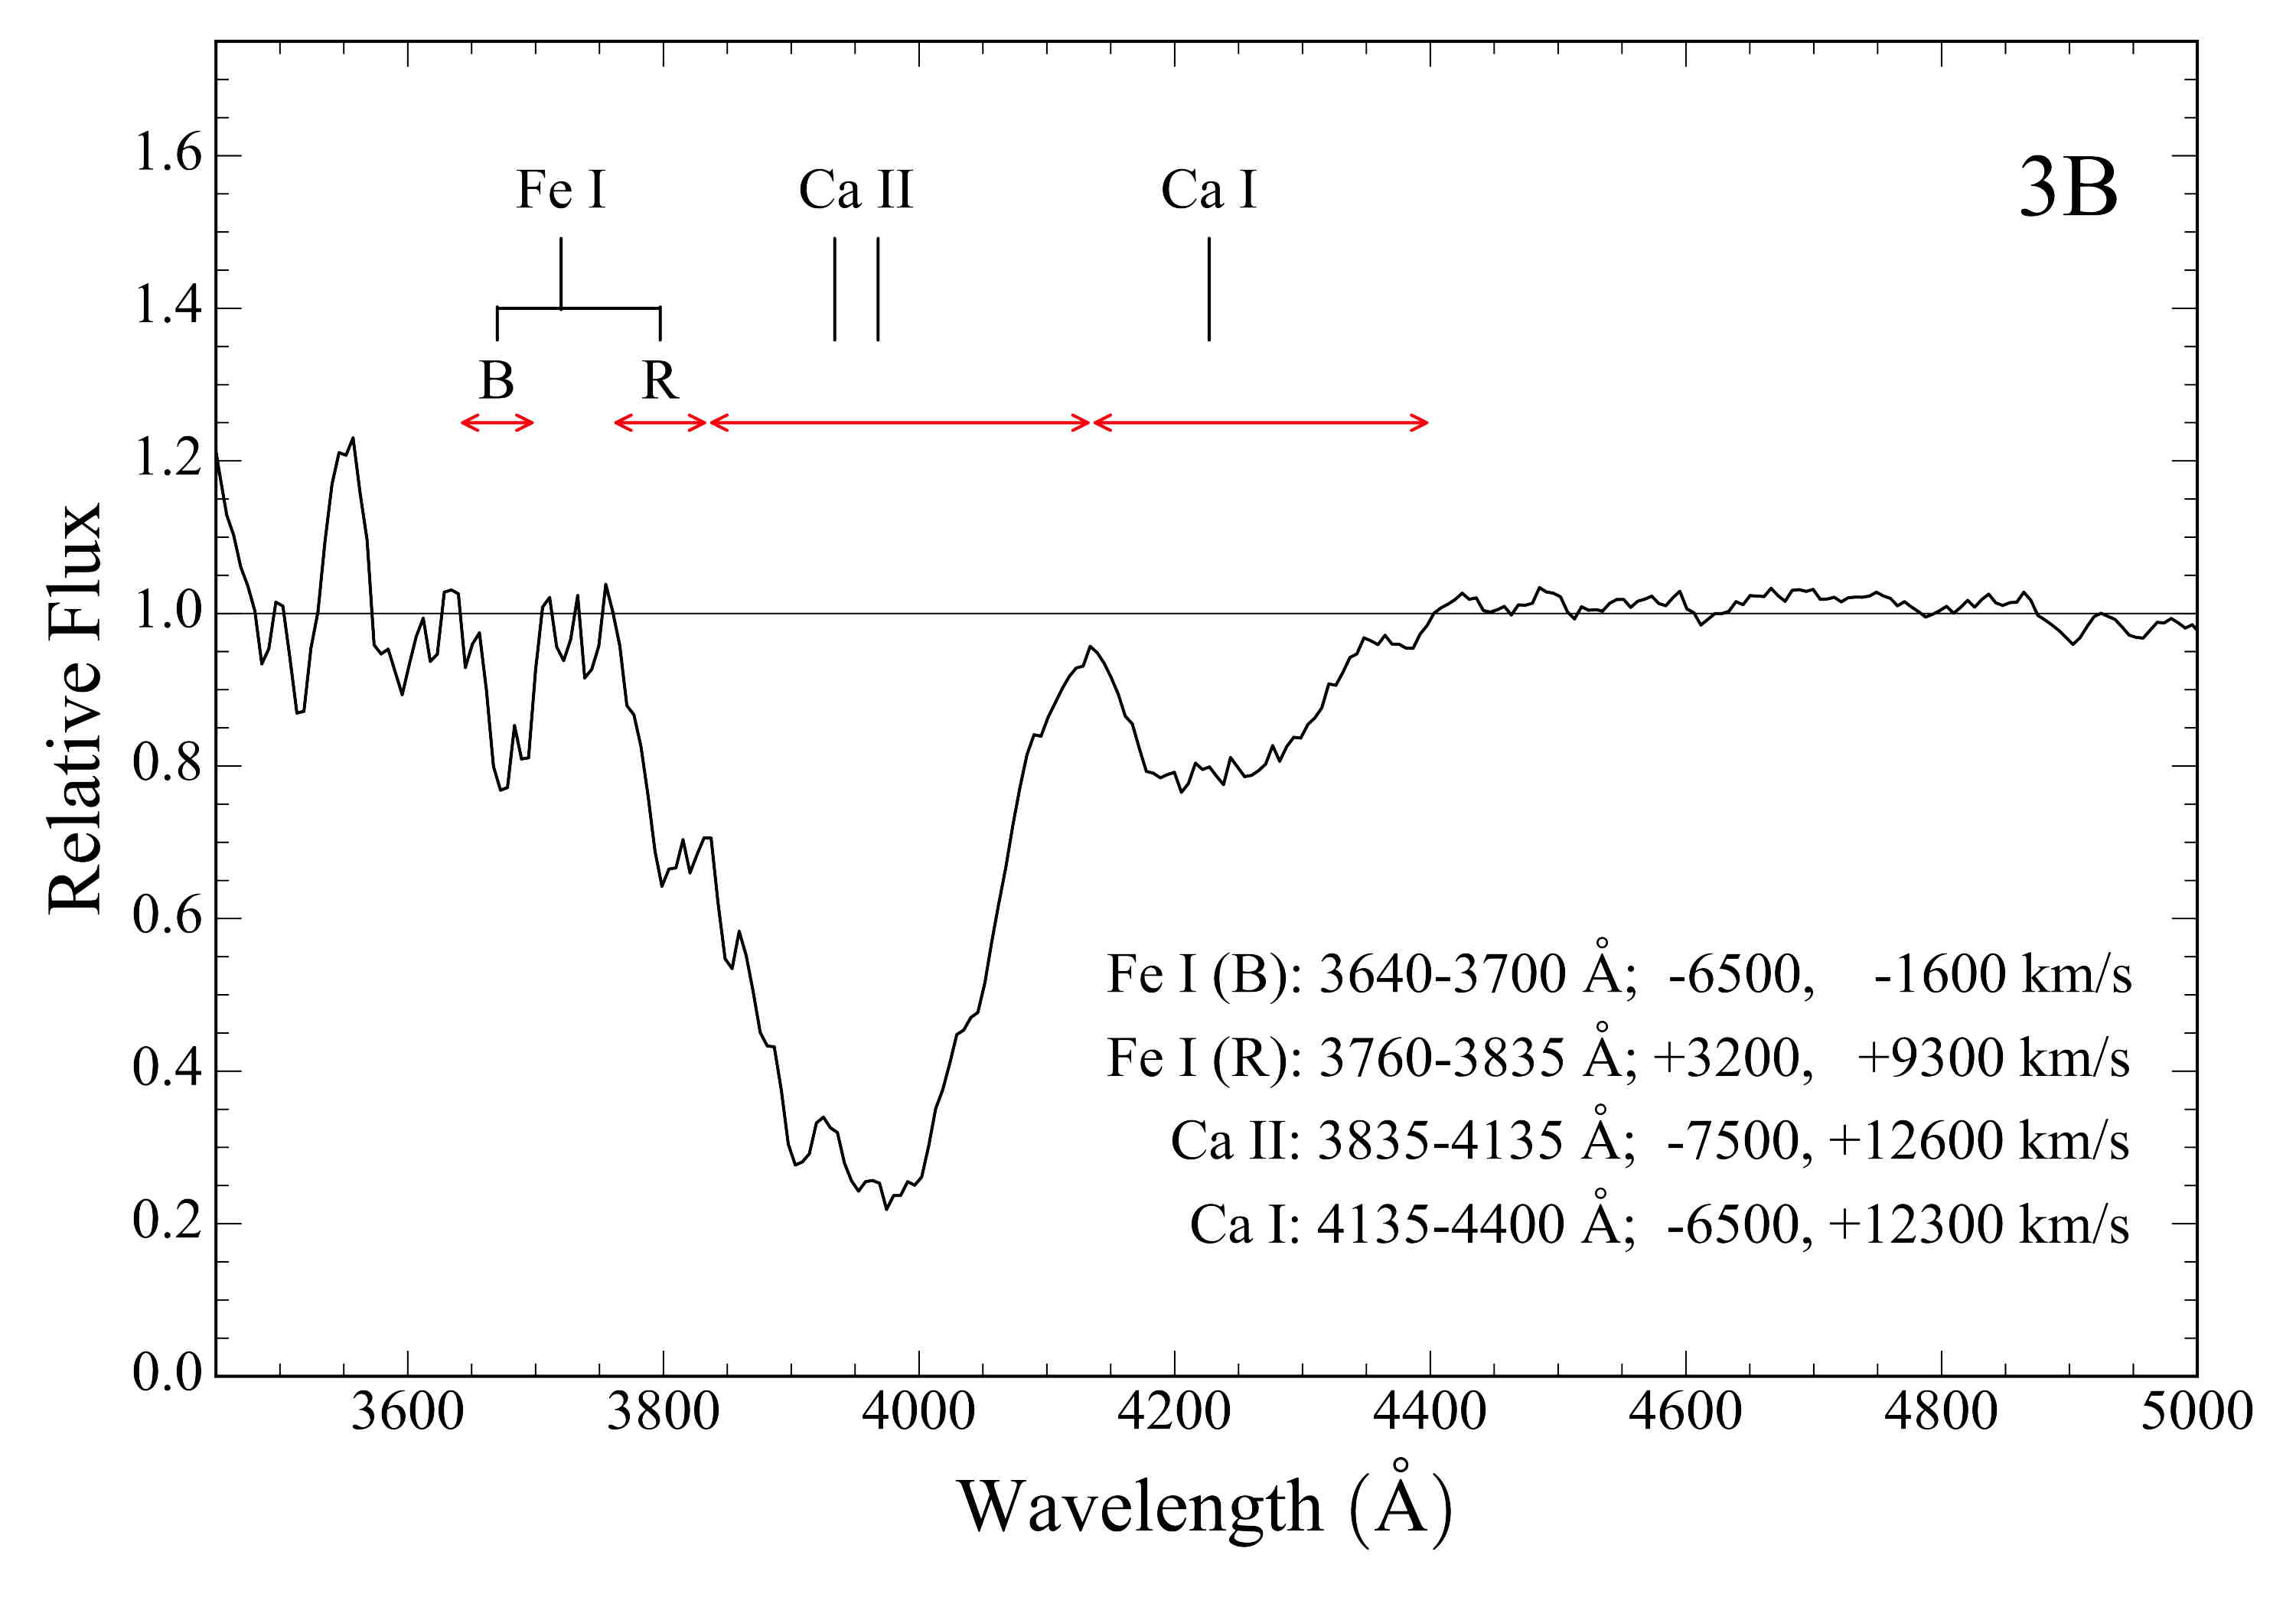
The overlap of the remnant’s broad Ca I and Ca II absorptions is illustrated in Figure 10 where we present smoothed 1D spectral plots of all six slit positions. The plots were made using background-corrected spectra averaged over the central 3 pixels () since they contain the highest signal-to-noise data and avoid contamination from the surrounding M31 background. In these plots, we mark rough estimates for the maximum and minimum wavelengths for Ca I, Ca II, blueshifted and redshifted Fe I absorptions along with implied velocities (cf. Table 2).
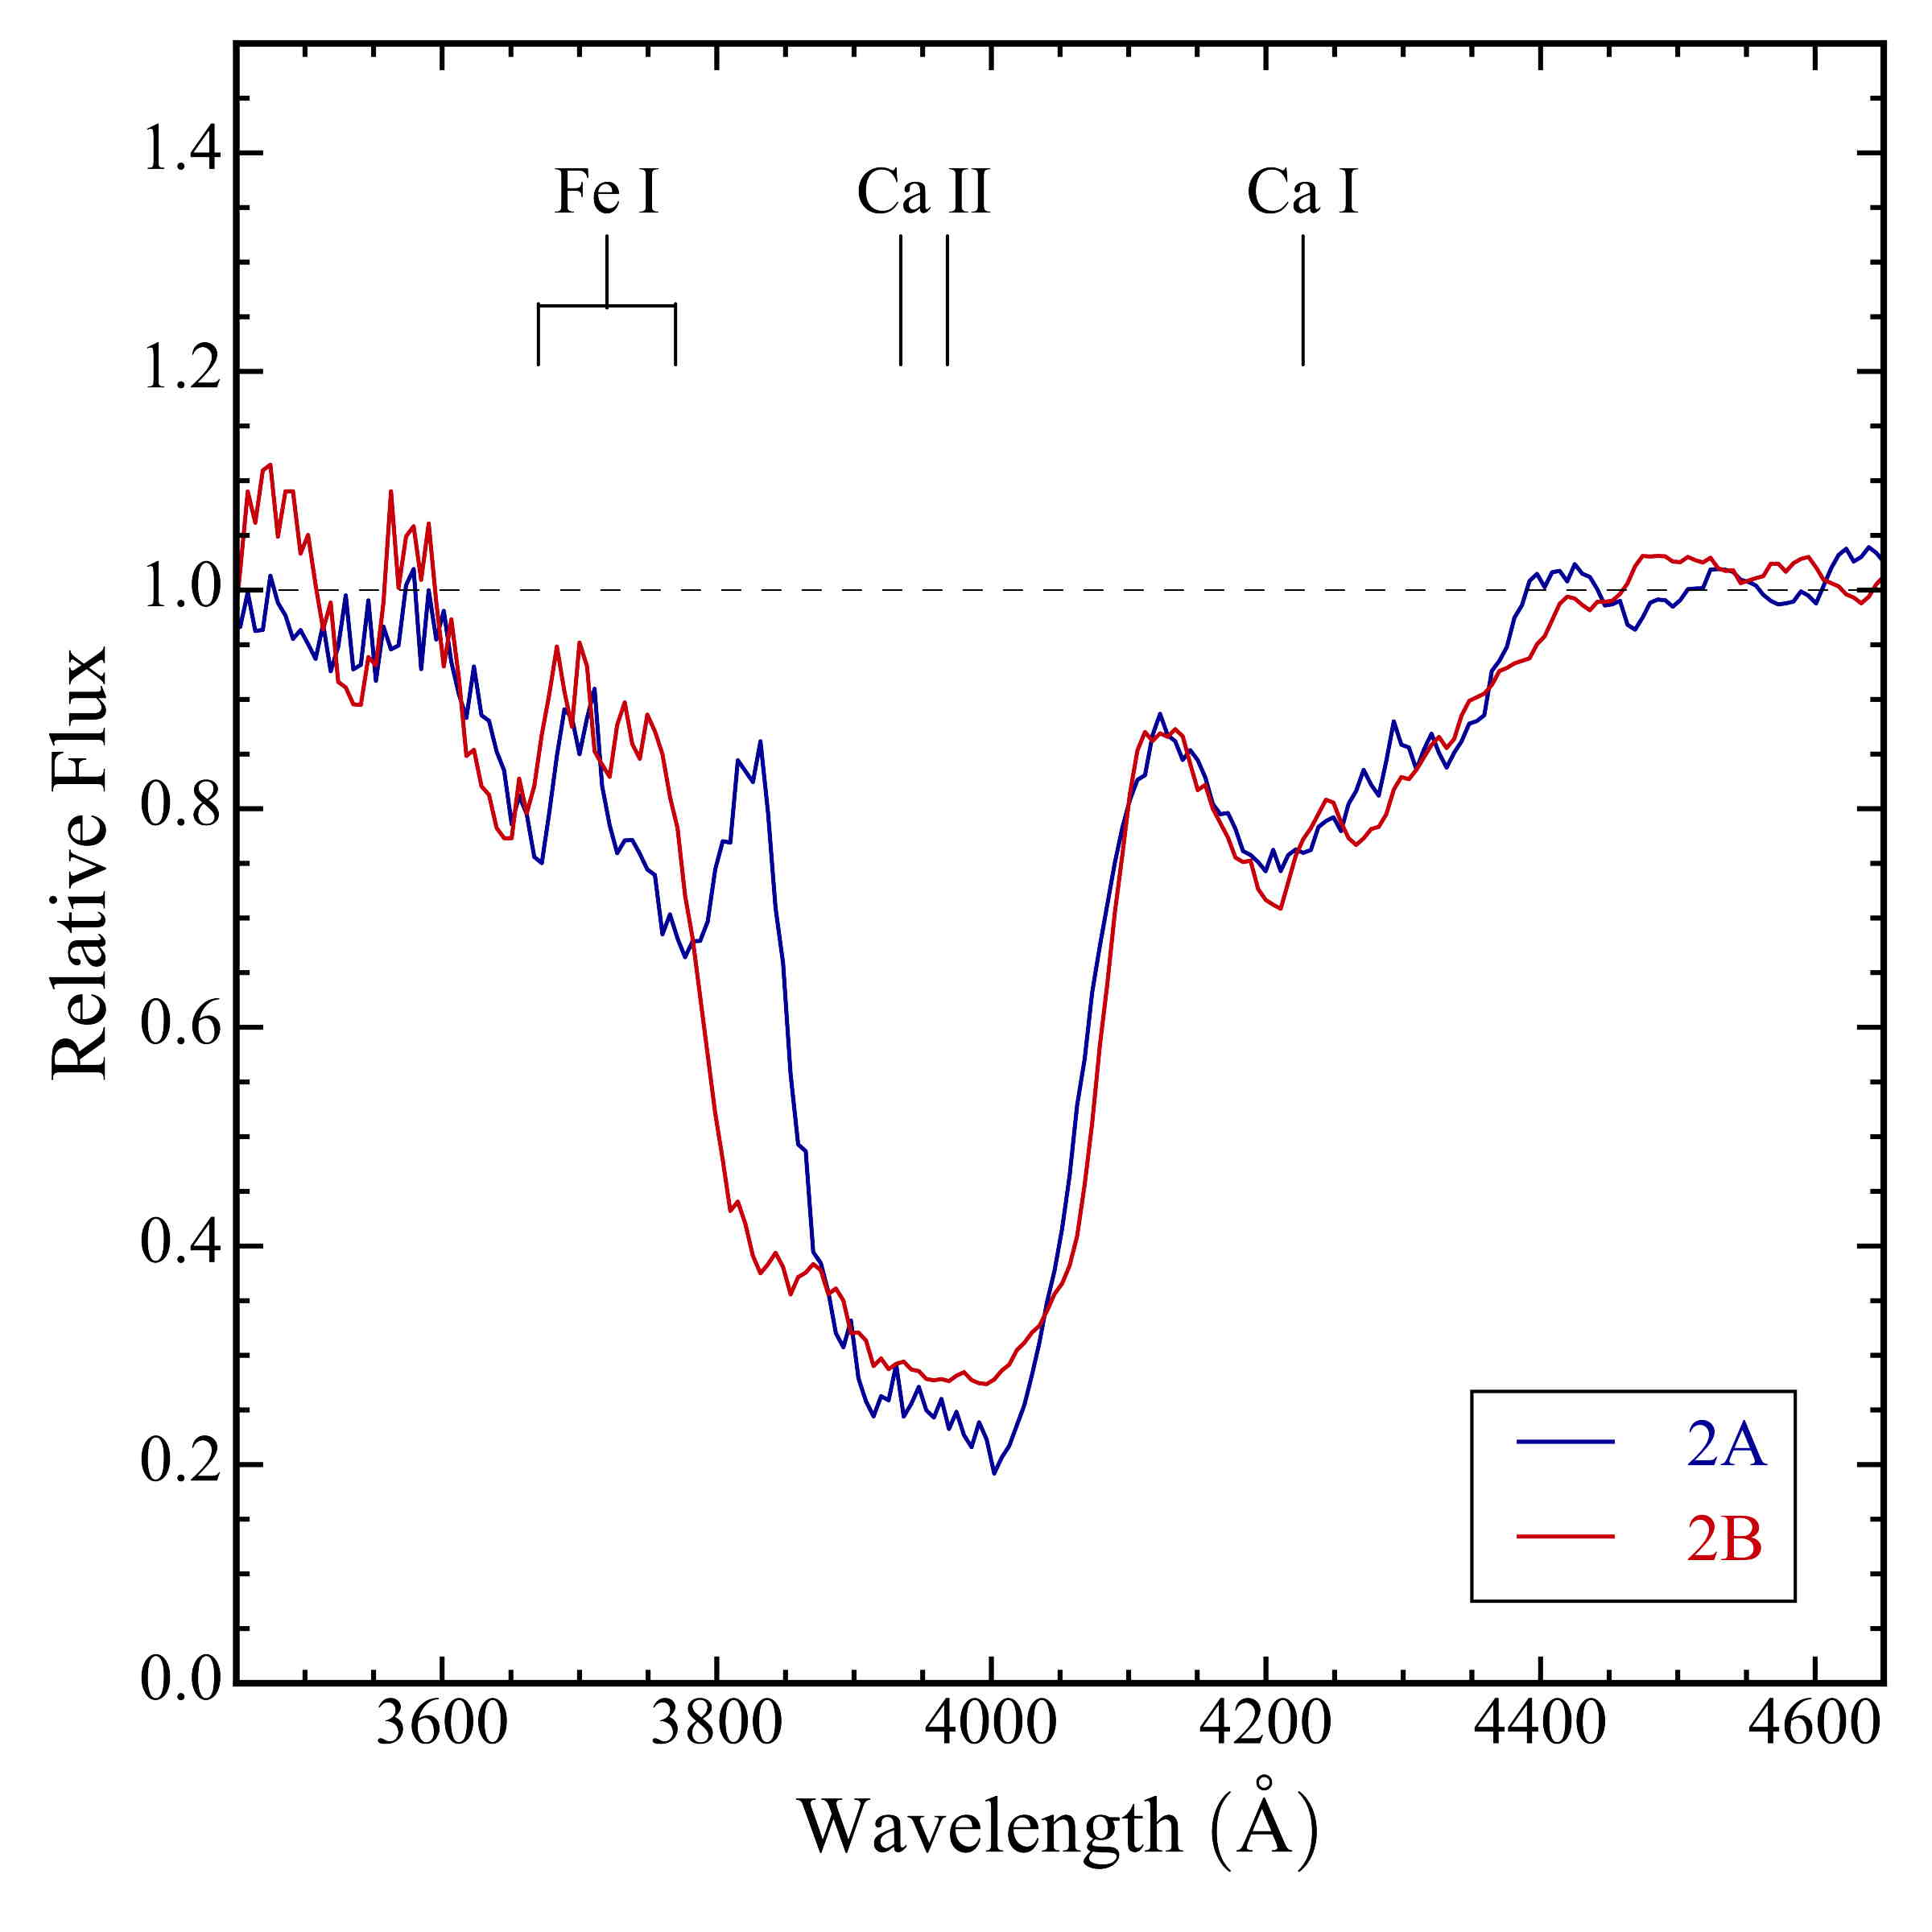
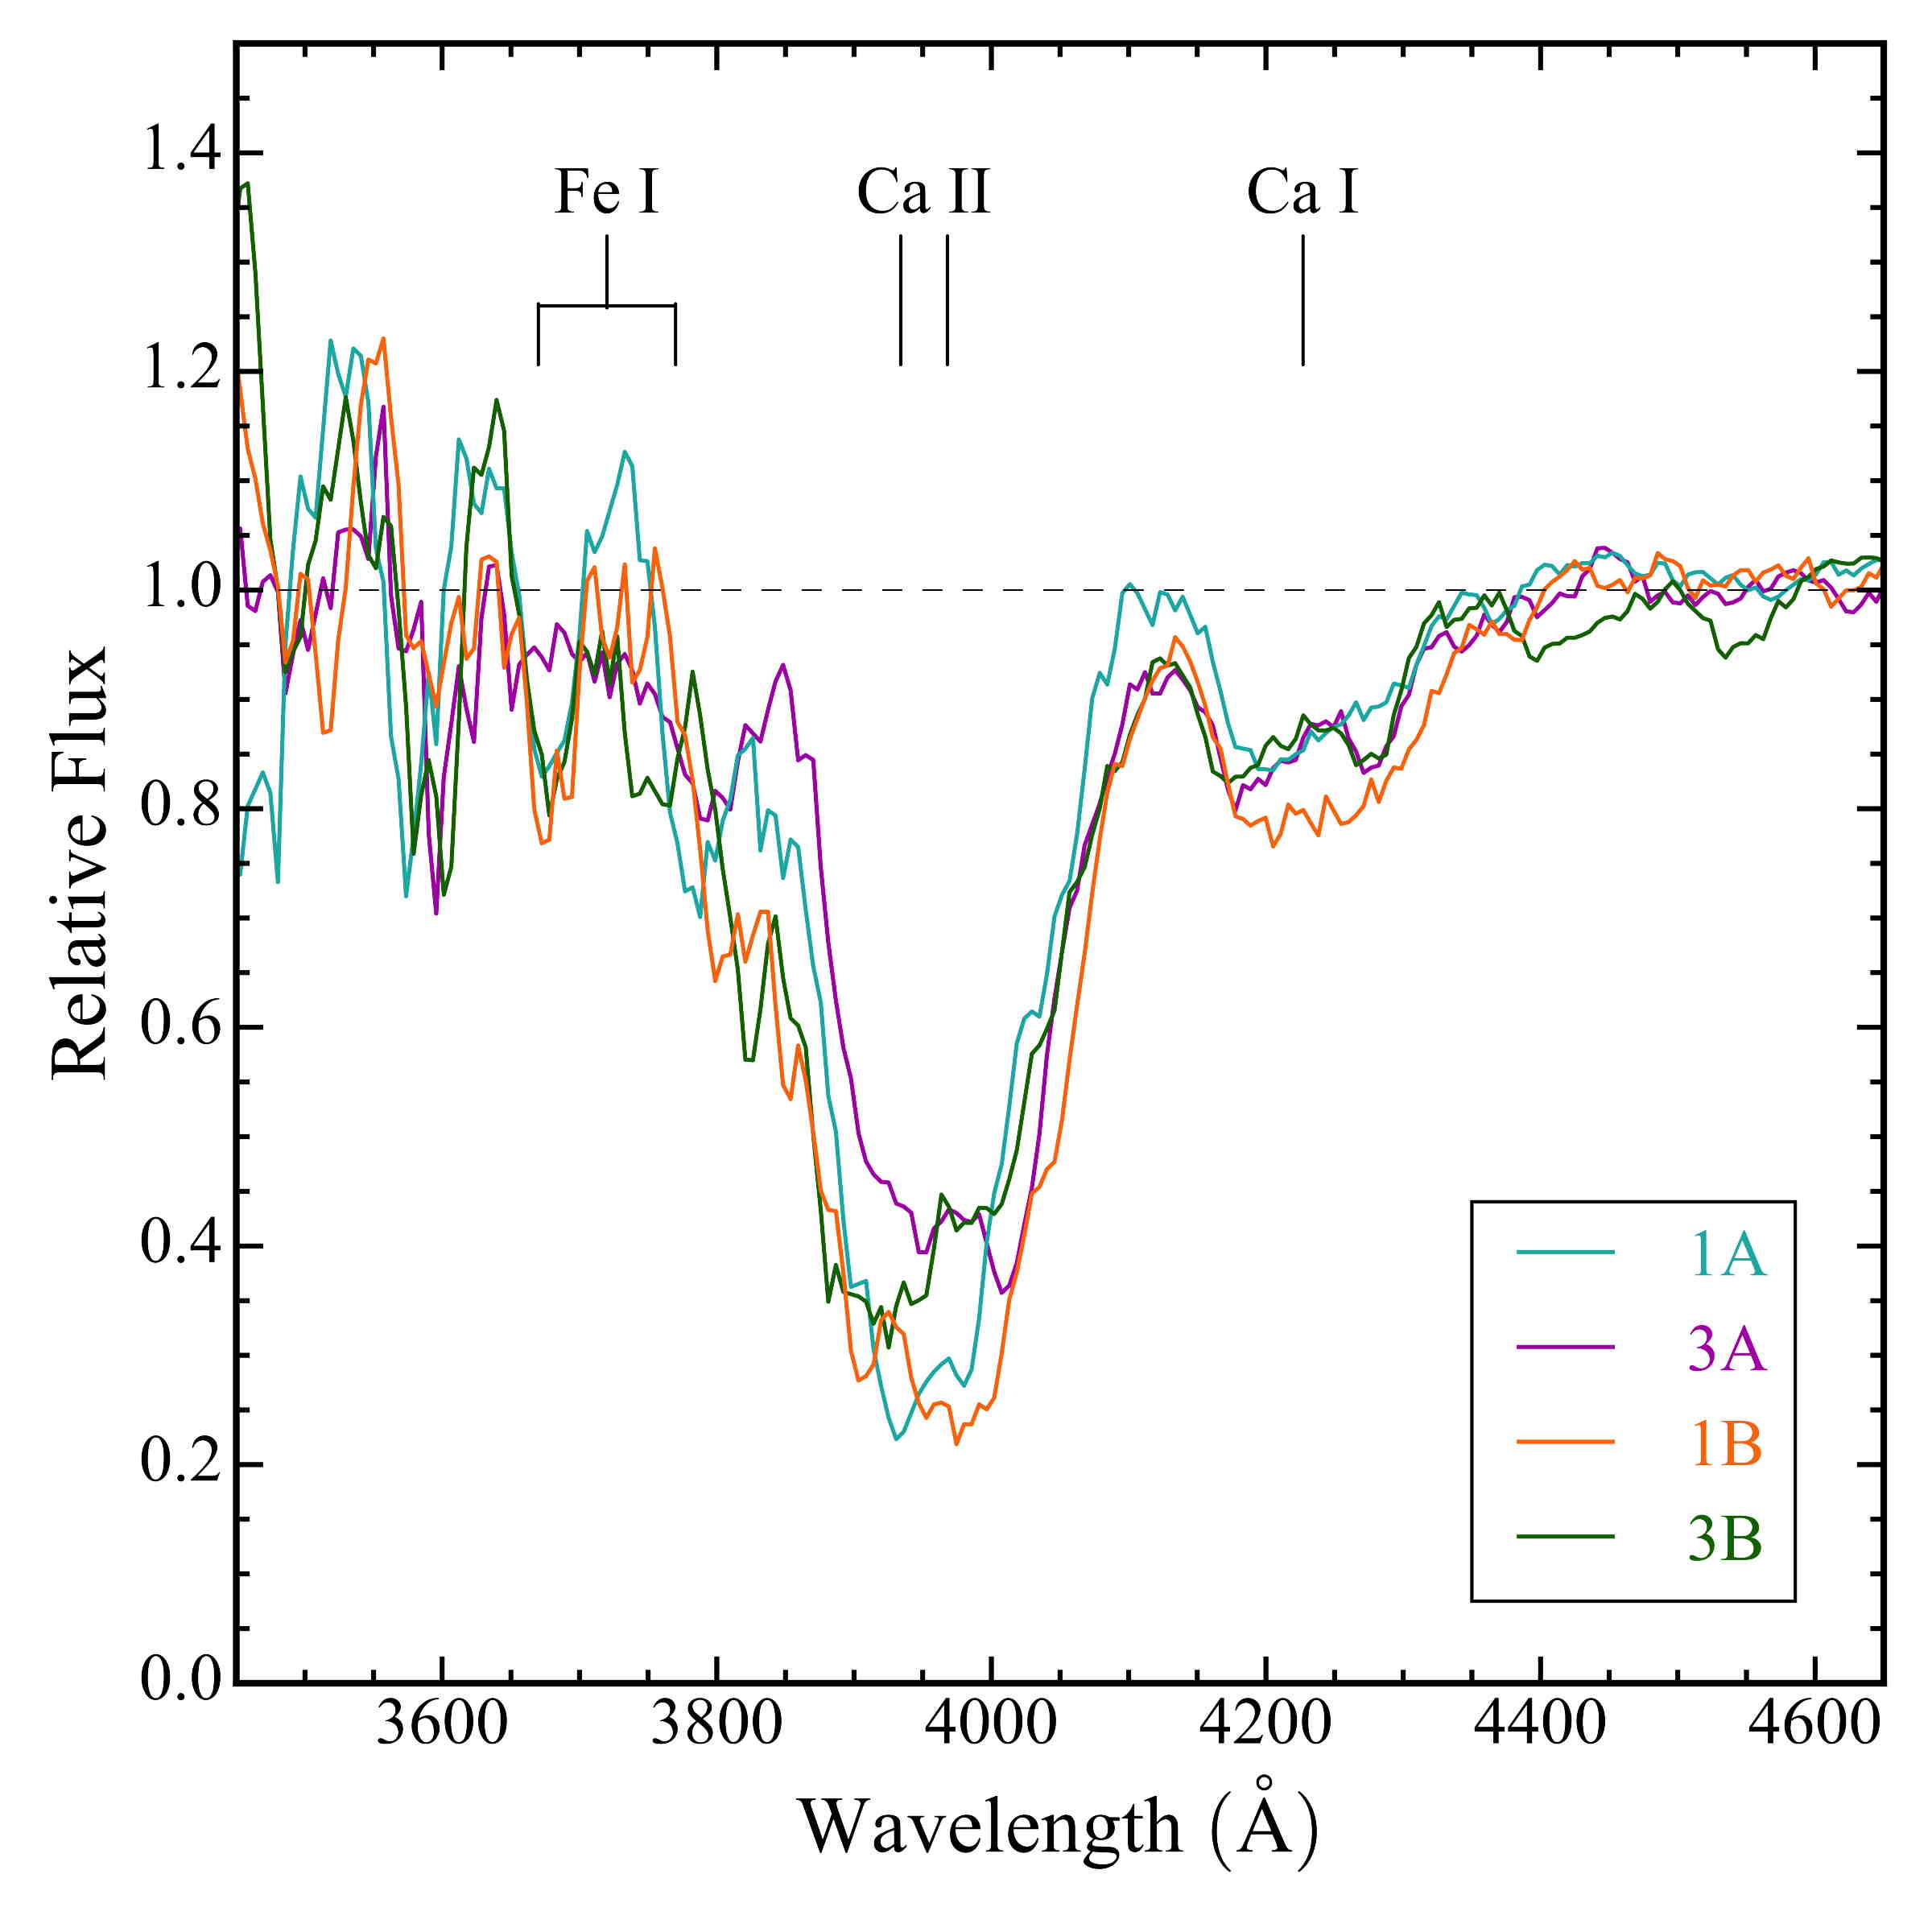
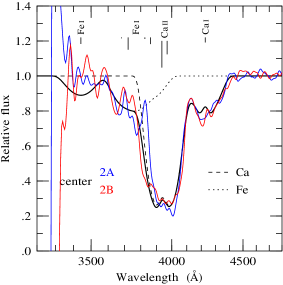
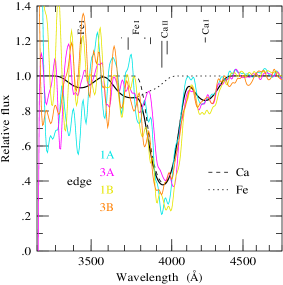
The left panel of Figure 11 shows a comparison of the 1D spectra of SNR 1885 for the two center slit positions, while the right panel shows a comparison of the spectra from the edge slit positions. The depth of the Ca II absorption is approximately equal for the central slits, and similar but somewhat weaker for the four edge slits, which is consistent with a spherically symmetric explosion. However, the detailed shapes of the Ca II absorption feature differ between slits.
Differences between the two central slit spectra (Slits 2A and 2B) is especially notable for Ca II absorption and we highlight this in the left panel of Figure 11. Slit 2B shows deep blueshifted absorption of Ca II 3934, 3968 Å extending to ( km s-1), whereas for Slit 2A Ca II absorption extends only to ( km s-1). This suggests that the remnant, although roughly spherical, is not isotropic in terms of absorption line strengths, a fact also evident in the 2D spectra shown in Figure 7.
Examining the 2D spectra for Slits 2A and 2B in detail gives a more nuanced picture. In the case of Slit 2B, the most extended Ca II absorption appears in the central region of the remnant, whereas in the spectrum of Slit 2A, the blueshifted side of Ca II is most extended near the top of the remnant while the red side appears to be more extended on the bottom (see Fig. 7). Determining the outermost extent of the remnant’s Ca II absorption is made difficult due to the overlap with the Ca I absorption on its red side and Fe I 3720 Å absorption on its blue side.
3.2. A Clumpy Shell of Ca II
The presence of Ca II clumps is shown in Figure 12 where we present enlargements of the six spectra presented in Figure 7 stretched to reveal Ca II absorption variations. Enhanced absorption at both blueshifted and redshifted velocities appears present at all slit positions. The strongest Ca II absorptions are seen to lie within an expansion velocity of 6000 km s-1 for most spectra, with few clumps centered zero velocity (the vertical line shown in Fig. 12).
A clumpy shell of Ca II absorption out to roughly 6000 km s-1 with less absorption at low velocities is in qualitative agreement with high-resolution HST images of the remnant. Narrow-passband Ca II images of SNR 1885 show that the Ca II absorption is strongest in a broad shell with expansion velocities of km s-1 (Fesen et al., 2007, 2015). Moreover, the reported size of the Ca II clumps on these narrow Ca II passband images corresponding to km s-1 are consistent with the velocity dispersion of the Ca II clumps seen in the STIS/CCD spectra. Below in §4, we discuss a model of SNR 1885’s Ca II absorption.
3.3. Ca I
Weak absorption longward of Ca II absorption was detected for all slits which we attribute to Ca I in accord with Fesen et al. (1999). The central Slit 2B shows the broadest Ca I absorption spanning from to ( to km s while the full range of blueshifted and redshifted Ca I absorption velocities in all six slits spans to and to km s-1 (see Figs. 10 & 11 and Table 2). It is important to note again that the blueshifted velocities may be underestimates of the true radial velocity because of the overlap between the Ca I and Ca II absorptions.
The remnant’s Ca I absorption is asymmetric, with stronger absorption on the blue side of the line center compared to the red (Figs. 7 & 9) and 1D (Figs. 10 & 11). The weakest Ca I absorption appears in the southern (Slit 3B) and western (Slit 1A) portions of the remnant, consistent with Ca I images of the remnant (Fesen et al., 2007).
Except for Slit 3B, the line center of Ca I feature appeared redshifted by km s-1. Based on a 1996 FOS spectrum, Fesen et al. (1999) also reported a redshift of for Ca I absorption. Fesen et al. (2007) argued that the redshifted Ca I absorption could not be accounted for by an anisotropic photoionization model because there would be more ionization on the side closer to the bulge, resulting in a blueshifted Ca I line profile.
3.4. Fe I
A 1996 FOS spectrum of SNR 1885 showed Fe I absorption on the blue wing of the Ca II absorption blend (Fesen et al., 1999). Due to increased noise shortward of caused by the lower background bulge flux and the CCD’s lower efficiency at blue wavelengths, the presence of Fe I is not immediately obvious from the 2D STIS/CCD spectra shown in Figure 7.
However, despite the increased noise in the spectra below 4000 Å, Fe I absorption appears present in the 2D STIS spectra of 2A and 3A (Fig. 7). In fact, discrete blueshifted and redshifted Fe I 3720 Å absorption features can be seen in several of the 1D spectral plots shown in Figure 10 and for the two center Slits 2A and 2B (Fig. 11, left panel). In Table 2, we list the estimated wavelengths and velocities of the Fe I absorption features where present.
Despite the increased noise level below 4000 Å, the appearance of matching blueshifted and redshifted absorption features in the spectra for Slits 2A and 2B gives added weight to the reality of distinct Fe I 3720 Å absorption features. For example, in the case of Slit 2A, blueshifted Fe I absorption appears present between and , and redshifted absorption between and . For Slit 2B, the blueshifted Fe I absorption also appears around and , and there is additional absorption at extending redward to at least where it overlaps with the blue wing of Ca II absorption (see Table 2).
The detection of separate blueshifted and redshifted Fe I absorption features suggests the presence of an Fe I shell, an arrangement quite different from that suggested from inspection of the 1996 FOS data, which indicated a fairly symmetric absorption profile (right panel of Fig. 13). Such a significant difference in the Fe I absorption profile between spectra taken nearly two decades apart may indicate progressive ionization of Fe I into Fe II much like that predicted and discussed by Fesen et al. (1999). Other potential Fe I absorption features lie further into the UV, and we discuss those in §4.
3.5. Mg I and Mg II
Despite a low S/N, the UV spectrum of SNR 1885 shows depressed flux near the wavelengths of Mg I and Mg II 2796, 2803 Å. The circles in the lower panel of Figure 8 mark absorption rings centered on these wavelengths. The size and thickness of these absorption features, if attributed to a shell of Mg-rich ejecta, suggest material expanding at velocities 7000 to 10,000 . We note that if the observed absorption is associated only with Mg II lines, then they are blueshifted by relative to the Earth rest frame.
A detection of a Mg-rich shell adds more to the study of SNR 1885 than just the addition of Mg to the already detected Fe and Ca. The remnant’s Mg absorption shell exhibits a higher minimum velocity compared to the broad shell of Ca-rich ejecta and the sparse finger-like structure seen for the remnant’s Fe II material (Fesen et al., 2015).
4. Discussion
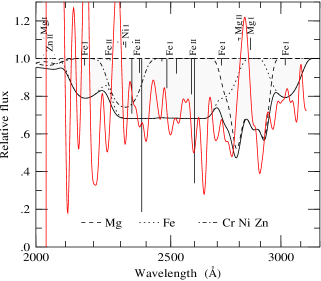
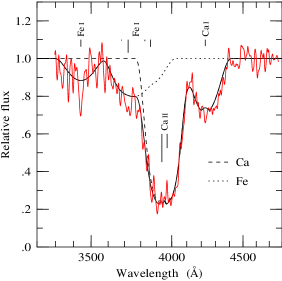
Figure 13 shows the observed 1D UV spectrum of SNR 1885 compared to the model spectrum (left panel) used to fit the 1996 optical FOS spectrum (right panel) discussed by Fesen et al. (1999). The model shown here for the UV spectrum differs from that in Fesen et al. (1999) in a number of details.
As before, we assume spherical symmetry given the approximate spherical symmetry seen both in the images (Fesen et al., 2015) and in the 2D spectra (e.g., see Figure 9). However, the remnant cannot be exactly spherically symmetric; if it were, then the two spectra for the central slices in the left panel of Figure 11 would appear the same, as would the four spectra for the edge slices. Moreover, the remnant’s spherical structure is further complicated by ejecta clumping as noted above.
Before discussing the model results, we note that the observed level of absorption over the – Å wavelength region is much weaker than anticipated by the model described by Fesen et al. (1999). The predicted level of absorption in that work was based on the expectation that Fe II should be substantially more abundant than Ca II in this Type Ia remnant, which was seen to be both broad and deep in the FOS spectrum (Fesen et al., 1999). Indeed, the flattish bottom of the Ca II absorption profile (right panel of Fig. 13) suggested that Ca II absorption was saturated, with the residual level of flux arising from starlight in the bulge of M31 to the foreground of SNR 1885.
If Fe were distributed similarly to that of Ca, and if Fe II were at least as abundant as Ca II, then the remnant should show similarly saturated absorption in the resonance-line complexes of Fe II at and 2600 Å. However, the observed UV spectrum of SNR 1885, shows absorption levels less than half as deep as expected.
| Parameter | This paper | Fesen et al. (1999) |
|---|---|---|
| Fe I mass | ||
| Fe II mass | ||
| Ca I mass | ||
| Ca II mass | ||
| Mg I + Mg II mass | ||
| Maximum expansion velocity | ||
| Covering fraction of Fe | 0.38 | 1 |
| Minimum Ca expansion velocity | ||
| Minimum Mg expansion velocity | ||
| Foreground starlight fraction |
4.1. Calcium
The flat-bottomed profile of the observed Ca II H & K absorption seen both in the FOS and STIS spectra suggests that Ca II is nearly saturated. Based on a narrow-passband Ca II image of the remnant, Fesen et al. (2015) argued that Ca II is densest in a lumpy shell over – km s-1. This is consistent with the clumpy Ca II absorption seen in the STIS/CCD spectra (Fig. 12).
We therefore adopted a model similar to that described in Fesen et al. (1999), in which the intrinsic density profile of all elements is taken to be the same as that inferred from the line profile of Ca II,
| (1) |
but with a hole defined by a sharp minimum velocity . Since the data are not high enough quality to say otherwise, we also assume that Ca I has the same density distribution as Ca II.
This model assumes the Sobolev optical depth approximation (see Eq. 54 in Jeffery 1993 where v/c). Use of this approximation is valid since the change of the physical conditions over the coupling region between the line and the photons is small, meaning the scale of the change is roughly the intrinsic line width compared to the expansion velocity. The relevant regions of SNR 1885 are still in free expansion with typical velocities of 1000 km s-1 or more that are larger than the intrinsic line widths by many orders of magnitude.
If there is no hole in the Ca distribution, then the flat-bottomed Ca II profile points to Ca II being saturated. The non-zero flux at line bottom would then be attributed to foreground starlight from the bulge of M31, with the foreground starlight fraction being . However, the case with no foreground starlight is only 3- from the best fit.
With a central hole, Ca II can be less saturated, meaning less Ca II, and the foreground starlight fraction can be lower. A lesser amount of Ca II also translates into relatively less absorption in the spectra of edge slices compared to central slices. Less absorption in edge versus central slices is in fact what is observed with STIS/CCD.
Figure 14 shows the observed optical spectrum of SNR 1885 compared to the model spectrum used to fit the 1996 optical FOS spectrum for both the two center slits (left panel) and the four edge slits (right panel). The model shown in both Figures 13 and 14 adopts a foreground starlight fraction of , the 1- low end of the value measured from the FOS.
Allowing for a hole in the calcium distribution also leads to slight changes in other parameters from those cited in Fesen et al. (1999). One effect concerns the degree of ionization of calcium. The original fit to the FOS data suggested Ca II/Ca I , however our new model fit suggests a lower value of 13. However, the degree of ionization measured from the STIS/CCD spectra is 16. Although the absolute level of ionization is model dependent, the conclusion that the degree of ionization is higher in the STIS/CCD spectrum than in FOS is robust, since it depends only on the fact that Ca I absorption is somewhat weaker in STIS/CCD than in FOS.
This degree of ionization of calcium is consistent with theoretical expectations. As discussed by Fesen et al. (1999), the ionization timescale of Ca I exposed to ultraviolet light from the bulge of M31 is only . Such a short ionization time would imply that a value of Ca II/Ca I at the epoch of the FOS observation would translate to a predicted Ca II/Ca I at the epoch of the STIS/CCD observations.
Table 3 lists the parameters of the model of the present paper, along with the parameters of the model in Fesen et al. (1999). We note that in order for sufficient Ca I survive to the present time, it must be at least partially self-shielded by its own continuum photoionization cross-section, thus slowing the rate of photoionization.
4.2. Iron
The model fit for the STIS/MAMA spectrum shown in Figure 13 takes into account the expected reduction in time of the column density of a freely-expanding supernova. That is, column densities in the STIS/MAMA and STIS/CCD spectra, taken when the remnant was 128.3 years old, have been reduced by compared to the model for the FOS spectrum at an age of 111.4 years.
A puzzle concerns the observed level of Fe absorption relative to Ca II H & K. To address this, it is useful to first address the strength of Fe I absorption.
The strength and distribution of Fe I absorption in the FOS spectrum, shown in the right panel of Figure 13, is different from that seen in the STIS/CCD spectra, where it appears to be in the form of a shell. In addition, a few other Fe I absorption lines lie within the wavelength range of STIS/MAMA (see Fig. 13, left panel).
The strongest resonance line of Fe I over the STIS/MAMA range is the four line complex around 2500 Å, consisting of 2463, 2483, 2501, 2522 Å, with a combined oscillator strength of (Morton, 1991). By comparison, the Fe I blend (3679 & 3720 Å) has a combined oscillator strength of just . Since optical depths in the Sobolev approximation are proportional to oscillator strength times wavelength, the optical depth in Fe I should be more than 10 times that of Fe I .
Given that the optical depth of Fe I observed with FOS was at line center, the expectation is that UV Fe I absorption around 2500 Å would be saturated, reaching a depth of , similar to that seen for Ca II (i.e., the observed intensity is of continuum coming from foreground M31 bulge starlight).
However, the observed level of Fe I absorption is just , in conflict with expectations by a factor of 2 – 3. The problem is made worse since there are strong resonance lines of Fe II in the UV STIS/MAMA spectrum that lie at 2343, 2374, 2382, 2586, 2599 Å, with a combined oscillator strength of .
The ionization fraction of iron adopted in the model of Figure 13 is Fe II/Fe I , the same as that adopted by Fesen et al. (1999). This was chosen to be consistent with the ionization fraction of calcium, Ca II/Ca I , measured from the STIS/CCD spectra. The model predicts that the Fe II absorption lines in the STIS/MAMA spectrum would be completely saturated. However, as can be seen in Figure 13, the observed level of absorption is far from being saturated.
One might question the validity of the STIS UV data. However, the fact that there is good consistency between the individual spectra indicates there is no significant problem with the observations. Consequently, we conclude that the weakness of Fe I and Fe II absorption observed with STIS/MAMA requires a covering fraction less than 1, that we assumed for Ca II.
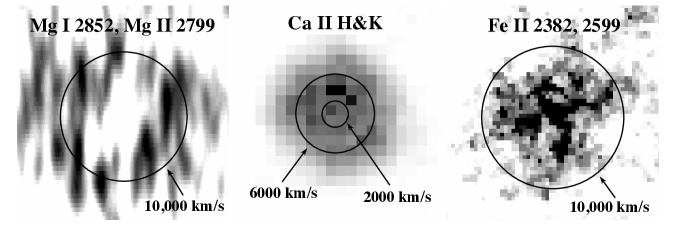
The idea that Fe II has a covering fraction less than 1 would be consistent with the Fe II F225W image reported by Fesen et al. (2015, Fig. 7). This image shows Fe II concentrated in 4 plumes extending out from the center, with implied velocities (see Fig. 16). This is in sharp contrast to the more spherical appearance of Ca II.
The remnant’s Fe I distribution likewise appears nonspherical. Narrow-passband Fe I images (Fesen et al., 2015, Fig. 5) sensitive to 5000 km s-1 expansion velocities show an off-center (hence nonzero) blob of absorption. This arrangement is consistent with the STIS/CCD spectra that show the remnant’s Fe I absorption largely confined to nonzero velocities, ranging from to 8000 km s-1.
With the foreground starlight fraction fixed at , the UV STIS/MAMA spectrum, coupled with the level of Fe I 3720 Å observed by FOS and STIS/CCD, requires that iron, in the forms of Fe I and Fe II, has a covering factor of . The model shown in Figure 13 assumes this covering fraction for Fe and other iron-group elements, including Cr, Ni, and Zn.
This means 62% of light from behind the remnant is leaking through iron-group elements unimpeded. While the exact iron covering factor is correlated with the foreground starlight fraction, the STIS/MAMA spectrum constrains the net level of Fe absorption to be .
To compensate for the decreased covering fraction for iron while still reproducing the level of Fe I absorption seen in the FOS spectrum (right panel of Figure 13), the abundances of iron-group elements have been increased by a factor of 3 compared to the model of Fesen et al. (1999). The abundance of Mn, which has a strong resonance line complex Mn I for which there is no evidence in the observed STIS/MAMA spectrum, has been set to zero.
The fit of our new model to the Fe I FOS profile is not quite as good as that found by Fesen et al. (1999) who assumed the same covering fraction for Fe as Ca, but it is acceptable. The mass of Fe I in the model is (1- statistical uncertainty), a factor 3 increase over that in Fesen et al. (1999).
At an Fe II/Fe I ionization fraction of 10, the mass of Fe II is . However, this estimate is highly uncertain, because the model predicts that the Fe II absorption lines in the STIS/MAMA spectrum would be completely saturated, preventing a direct measurement of Fe II/Fe I.
Finally, Fesen et al. (1999) estimated that the continuum optical depth of Fe I through the center of the remnant is at wavelengths shorter than the ionization threshold of Fe I. The increase of a factor of 3 in Fe in the present analysis implies a continuum optical depth of . This modest optical depth suggests that the remnant should currently be undergoing a transition from being optically thick to being optically thin in Fe I. A corollary of this conclusion is that Fe II should also be present in regions where there is Fe I.
4.3. A Magnesium-Rich Shell
The new and most striking feature of the STIS/MAMA spectrum, besides the unexpected weakness of Fe absorption, is the apparent shell of absorption near evident in the 2D spectrum in Figure 8. This appears as a W-shaped absorption feature in the 1D spectrum in Figure 13. While the spectrum is quite noisy, this absorption is present in all visits.
The model spectrum plotted in Figure 13 attempts to fit the feature with a spherically symmetric shell of Mg I and Mg II absorption. The Mg shell is assumed to have the same density profile , equation (1), as Ca, but with a sharp minimum velocity taken to be .
The ionization time of Mg I exposed to photoionizing light from the bulge of M31 is , as compared to the photoionization time of Ca I (Hamilton & Fesen, 2000). Consequently, Mg I is more robust than Ca I and hence less ionized.
If the time of photoionization of Mg I is the same as that of Ca I, then the ionization fraction of Mg II/Mg I is . This means that there are almost equal abundances of neutral and singly-ionized magnesium. The center of the observed Mg absorption shell appears to lie about halfway between Mg I and Mg II . Having no theoretical or observational reason to prefer Mg I or Mg II, we allow both in the model, setting Mg II/Mg I consistent with the degree of ionization of Ca.
However, the model’s shell of Mg fails to fit the observed hole at the shell’s center, showing scarcely a central dip in absorption, let alone a gaping hole. The flaw in the model is probably due the assumption of spherical symmetry. In fact, the 2D spectrum in Figure 8 indicates that the shell is most prominent on the near and far sides of SNR 1885, and weaker at central velocities. Thus, we conclude that there is evidence for a Mg shell but that is may well be incomplete and lumpy.
5. SN Ia Models and the Remnant of SN 1885
5.1. Delayed-Detonation Models
The details of SNe Ia explosions are complicated and the subject of much debate. Numerical calculations indicate that the thermonuclear runaway of a near Chandrasekhar-mass white dwarf is preceded by a century-long, highly turbulent, convective, carbon-burning, “smoldering” phase (Sugimoto & Nomoto, 1980; Nomoto, 1982; Hillebrandt & Niemeyer, 2000). Ignition, which occurs at around , is highly sensitive to temperature and density, and may occur off-center and proceed along paths of least resistance determined by the fluctuating conditions around the ignition point (Timmes & Woosley, 1992; Garcia-Senz & Woosley, 1995; Niemeyer et al., 1996; Höflich & Stein, 2002; Livne et al., 2005).
Burned regions expand and are Rayleigh-Taylor unstable against overturn with denser overlying matter. Three-dimensional calculations show that the subsonic deflagration proceeds mainly along Rayleigh-Taylor unstable radial fingers, leaving behind connected regions of unburned matter (Gamezo et al., 2005).
The initial deflagration heats the white dwarf, causing it to expand quasi-hydrostatically over a period of about a second. At that point, the deflagration somehow turns into a supersonic detonation that propagates through the white dwarf, consuming unburned material. Near the center of the white dwarf, densities and temperatures are high enough that the burning reaches nuclear statistical equilibrium. But farther out, the expansion of the white dwarf prevents nuclear burning from continuing to completion, so that intermediate-mass elements are produced, with less-massive elements being produced farther out.
During both the initial deflagration phase and the subsequent detonation phase, Rayleigh-Taylor instabilities lead to radial mixing. Mixing proceeds at a rate that depends on the sound speed and continues until the white dwarf reaches homologous expansion, which occurs about 10 – 20 seconds after the explosion. Three-dimensional hydrodynamic calculations suggest that the Rayleigh-Taylor instabilities are strong enough to mix the remnant’s entire central region (Gamezo et al., 2003; Reinecke et al., 2002; Röpke et al., 2012).
However, full radial mixing is inconsistent with the layered structure of intermediate-mass elements that is seen both in SN Ia spectra and in the observations of SNR 1885. Somehow mixing must be suppressed. A possible mechanism to suppress Rayleigh-Taylor mixing is high magnetic fields (Höflich et al., 2013; Penney et al., 2014; Diamond et al., 2015).
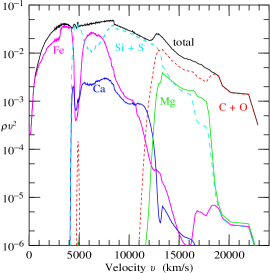
A simple, albeit artificial, way to suppress mixing is to impose spherical symmetry. Figure 15 shows an example calculation from a suite of spherically symmetric computations of delayed-detonation explosions by Höflich et al. (2002). The model, 5p02822.16, is subluminous compared to normal SN Ia. The models have two free parameters, the central density at which the explosion begins and the density at which the deflagration transitions into a detonation. The central density is determined essentially by the accretion rate, and it determines the amount of nickel-iron synthesized in the explosion. A higher accretion rate leads to a higher central density and greater production of nickel-iron (Höflich, Wheeler & Thielemann, 1998).
5.2. The Remnant of SN 1885
Figure 16 shows a comparison of the elemental distribution of Mg-rich ejecta based on the STIS/MAMA spectrum and Ca II and Fe II based on direct images (Fesen et al., 2015). The full extent of the remnant’s Ca-rich ejecta as seen in HST images reaches a radius of (13,400 km s-1). The striking appearance of Fe II plumes in SNR 1885 in Figure 16, would seem to support the presence of Rayleigh-Taylor fingers.
The angular size of the remnant’s Ca absorption is consistent with the observed velocity of Ca absorption. This implies that SNR 1885’s ejecta are nearly in free expansion. Consequently, the distribution of its elements is essentially the same as that established a few seconds after the supernova explosion. Thus SNR 1885’s elemental structure is a powerful tool for investigating the internal structure of a SN Ia.
The key salient features of the observed density distribution are as follows.
1) The UV STIS/MAMA spectrum of SNR 1885, §3.4, requires that iron, both in the form of Fe I and Fe II, has a covering fraction of only . This suggests that iron is mainly confined to dense, optically thick regions that cover only a fraction of the remnant. This is consistent with iron being concentrated in a few plumes, as seen in WFC3/F225W images (Fig. 16; Fesen et al. 2015). The STIS/CCD spectra suggests that Fe I has a shell-like structure extending roughly from 2000 to 8000 km s-1.
2) Although Ca II absorption is present from zero velocity to , Ca II appears to be densest in a broad shell expanding at – . This shell of Ca II is evident both in narrowband imaging of Ca II reported by Fesen et al. (2015), reproduced in Figure 16, and in the STIS/CCD spectral data shown in Figure 12. Some SN Ia models show a destruction of Ca in the progenitor’s densest inner region (Höflich et al., 2002; Höflich, Wheeler & Thielemann, 1998), which could lead to a Ca-rich shell like that observed.
Ca I absorption extends over the same range of velocities as Ca II (see Table 2). The total observed mass of calcium, mostly in the form of Ca II, is . The mass of calcium could possibly be larger than this if, like iron, some calcium is hiding in optically thick lumps.
3) The UV STIS/MAMA spectrum of SNR 1885 indicates that magnesium, either in the form of Mg I, Mg II or both, is concentrated in a shell that starts at about and extends out to at least 10,000 km s-1. The total observed mass of magnesium is roughly .
5.3. Implications of SNR 1885 for SN Ia Models
Our spectral results, together with the recent imaging data of Fesen et al. (2015), are largely consistent with the implications of SN Ia models discussed by Fesen et al. (2007). What is new is the observational evidence for a few extended plumes of iron (Fesen et al., 2015), and the detection of a shell of magnesium at velocities km s-1.
| 5p02822.16 | 5p02822.25 | |
|---|---|---|
| Element | () | () |
| He | ||
| C | ||
| O | ||
| Mg | ||
| Si | ||
| S | ||
| 20Ne | ||
| 24Mg | ||
| 36Ar | ||
| 40Ca | ||
| 56Ni | ||
| Fe |
Figure 15 shows the density of the subluminous SN Ia model, 5p02822.16, as a function of velocity for the principal elements synthesized in the model explosion. The density is shown multiplied by velocity squared, in part to compensate for the steep decline in density with velocity and in part because mass is proportional to the integral under the curve. A higher central density results in greater production of stable Ni.
The model in Figure 15 shows Ca over – , and Mg over – . Notice that the shell of Mg starts where the shell of Ca stops.
In contrast, the observations of SNR 1885 show Ca extending down to zero velocity (albeit concentrated over – ), with Mg extending down to . There appears to be a region – in SNR 1885 where Ca and Mg mix and/or overlap. This indicates some radial mixing of these elements, but not as much as 3D hydrodynamic calculations would suggest.
However, the model shows Mg at velocities up to . While there are possible hints of Mg in SNR 1885 at velocities exceeding the maximum velocity of Ca, there is no clear sign of Mg at velocities as high as in the model.
The model in Figure 15 also shows substantial Si and S over – , approximately the same velocity range as Ca. Si and S have strong UV absorption lines over – (Fesen et al., 1999), where the STIS/MAMA data are too noisy.
Table 4 shows the masses of principal elements synthesized in the subluminous model 5p02822.16 of Figure 15. For comparison, the Table also shows masses synthesized in 5p02822.25, a normal SN Ia. Whereas the subluminous model yields of iron, a normal SN Ia has of iron.
The mass of Mg produced in the subluminous model is the same as our Mg mass estimated for SNR 1885 (Table 3), which is higher than the for a normal SN Ia model. On the other hand, a Ca mass of in subluminous or normal models is a factor of 10 higher than the Ca mass we estimate in SNR 1885. This discrepancy seems to be a serious one, as there is no natural way to dial down the mass of Ca synthesized in the models.
It is possible that SNR 1885 contains more Ca than our empirical model fit to the observed Ca II blend. It could be more optically thick than we have estimated. Another possibility is that most of the remnant’s Ca has been ionized to Ca III or higher.
Ca II is the only singly ionized species among abundant elements to have an ionization potential, , below the Lyman limit of . A calculation similar to that reported by Hamilton & Fesen (2000) shows that the photoionization timescale of Ca II against photoionization by UV light from the bulge of M31, as observed with IUE (Burstein et al., 1988) and down to the Lyman limit with HUT (Ferguson & Davidsen, 1993), is . This is too long to produce substantial Ca III. While it is possible that reverse shock-generated ultraviolet and X-ray emission could be photoionizing Ca-rich ejecta to higher ionization stages (Hamilton & Fesen, 1988), the presence of high-velocity Ca I absorption would seem to make this unlikely.
6. Conclusions
This paper has presented optical and UV imaging spectroscopy of the remnant of SN 1885 taken during 2013 and 2014 with STIS on HST. These observations clarify the distribution of the ejecta in this subluminous Type Ia supernova remnant. Key findings are as follows.
– Optical spectra taken at several different slit positions in the remnant lend supporting evidence for calcium to be present at all velocities from zero to but densest in a clumpy shell with expansion velocities mainly between 2000 and 6000 km s-1.
– Compared to a 1996 FOS spectrum, variations in the remnant’s Fe I and Ca I absorption strengths and line profiles are seen, in line with predictions of ionization rates.
– The remnant’s overall UV spectrum shows absorption over – consistent with the expectation of absorption dominated by Fe I and Fe II but at a level some 2 to 3 times weaker than previously predicted (Fesen et al., 1999). This suggests that the remnant’s Fe-rich ejecta is confined primarily to dense, optically thick regions with a covering factor of just , which is consistent with recent HST images showing Fe II concentrated in 4 narrow plumes extending from the remnant’s center out to (Fesen et al., 2015).
– UV spectra reveal the presence of a shell of magnesium-rich ejecta expanding at between and and possibly higher.
– The presence of a few iron-rich plumes (Fesen et al., 2015) surrounded by shells of calcium and magnesium rich ejecta seen in the STIS spectra is in line with delayed-detonation SNe Ia models. The roughly spherical distribution of Ca and Mg argues against a highly asymmetric explosion like that from the merger of two white dwarfs. HST images and the new spectral data, coupled with historical data on SN 1885, point to a subluminous, delayed-detonation SN Ia event similar to SN 1986G.
These spectra, along with previous HST images of SNR 1885, provide guideposts for future modeling of SN Ia explosions, especially subluminous Type Ia events.
Less certain is the meaning of SN 1885’s properties to other relatively young SNe Ia remnants. In the case of the Galactic Type Ia supernova of 1006 AD, optical and UV spectra of background sources show strong UV Fe II absorption but no Ca II H & K absorption (Winkler et al., 2005). SNR 1885, in contrast, exhibits nearly saturated Ca II. Absorption studies of other young SN Ia remnants could investigate elemental distributions across a wider range of SNe Ia events, leading to a better understanding of these important stellar explosions.
References
- Bloom et al. (2012) Bloom, J. S., Kasen, D., Shen, K. J., et al. 2012, ApJ, 744, L17
- Burstein et al. (1988) Burstein, D., Bertola, F., Buson, L. M., Faber, S. M., & Lauer, T. R. 1988, ApJ, 328, 440
- Chevalier & Plait (1988) Chevalier, R. A., & Plait, P. C. 1988, ApJ, 331, L109
- Colgate & McKee (1969) Colgate, S. A., & McKee, C. 1969, ApJ, 157, 623
- Dalcanton et al. (2012) Dalcanton, J. J., Williams, B. F., Lang, D., et al. 2012, ApJS, 200, 18
- de Vaucouleurs & Corwin (1985) de Vaucouleurs, G., & Corwin, H. G., Jr. 1985, ApJ, 295, 287
- Di Stefano & Kilic (2012) Di Stefano, R., & Kilic, M. 2012, ApJ, 759, 56
- Diamond et al. (2015) Diamond, T. R., Hoeflich, P., & Gerardy, C. L. 2015, ApJ, 806, 107
- Ferguson & Davidsen (1993) Ferguson, H. C., & Davidsen, A. F. 1993, ApJ, 408, 92
- Fesen et al. (1999) Fesen, R. A., Gerardy, C. L., McLin, K. M., & Hamilton, A. J. S. 1999, ApJ, 514, 195
- Fesen et al. (2015) Fesen, R. A., Höflich, P. A., & Hamilton, A. J. S. 2015, ApJ, 804, 140
- Fesen et al. (2007) Fesen, R. A., Höflich, P. A., Hamilton, A. J. S., Hammell, M. C., Gerardy, C. L., Khokhlov, A. M., & Wheeler, J. C. 2007, ApJ, 658, 396
- Fesen et al. (1989) Fesen, R. A., Saken, J. M., & Hamilton, A. J. S. 1989, ApJ, 341, L55
- Gamezo et al. (2003) Gamezo, V. N., Khokhlov, A. M., Oran, E. S., Chtchelkanova, A. Y., & Rosenberg, R. O. 2003, Science, 299, 77
- Gamezo et al. (2004) Gamezo, V. N., Khokhlov, A. M., & Oran, E. S. 2004, Physical Review Letters, 92, 211102
- Gamezo et al. (2005) Gamezo, V. N., Khokhlov, A. M., & Oran, E. S. 2005, ApJ, 623, 337
- Garcia-Senz & Woosley (1995) Garcia-Senz, D., & Woosley, S. E. 1995, ApJ, 454, 895
- Hamilton & Fesen (1988) Hamilton, A. J. S., & Fesen, R. A. 1988, ApJ, 327, 178
- Hamilton & Fesen (1991) Hamilton, A. J. S., & Fesen, R. A. 1991, in Supernovae, 10th Santa Cruz Summer Workshop in Astronomy and Astrophysics, ed. S. E. Woosley (Berlin: Springer-Verlag), 656
- Hamilton & Fesen (2000) Hamilton, A. J. S., & Fesen, R. A. 2000, ApJ, 542, 779
- Hillebrandt & Niemeyer (2000) Hillebrandt, W., & Niemeyer, J. C. 2000, ARA&A, 38, 191
- Höflich et al. (2013) Höflich, P., Dragulin, P., Mitchell, J., Penney, B., Sadler, B., Diamond, T., Gerardy, C. 2013, Frontiers of Physics, 8, 144
- Höflich et al. (2002) Höflich, P., Gerardy, C. L., Fesen, R. A., & Sakai, S. 2002, ApJ, 568, 791
- Höflich et al. (2004) Höflich, P., Gerardy, C. L., Nomoto, K., Motohara, K., Fesen, R. A., Maeda, K., Ohkubo, T., & Tominaga, N. 2004, ApJ, 617, 1258
- Höflich & Khokhlov (1996) Höflich, P., Khokhlov, A. 1996, ApJ, 457, 500
- Höflich & Stein (2002) Höflich P., & Stein J. 2002, ApJ, 568, 771
- Höflich, Wheeler & Thielemann (1998) Höflich, P., Wheeler, J. C., and Thielemann, F.K. 1998, ApJ, 495, 617
- Hofmann et al. (2013) Hofmann, F., Pietsch, W., Henze, M., et al. 2013, A&A, 555, A65
- Howell (2011) Howell, D. A. 2011, Nature Communications, 2, 350
- Hoyle & Fowler (1960) Hoyle, F., & Fowler, W. A. 1960, ApJ, 132, 565
- Huggins (1886) Huggins, W. 1886, Nature, 32, 465
- Jeffery (1993) Jeffery, D. J. 1993, ApJ, 415, 734
- Khokhlov (1991) Khokhlov, A. M. 1991, A&A, 245, L25
- Khokhlov (1995) Khokhlov, A. M. 1995, ApJ, 449, 695
- Li et al. (2003) Li, W., Filippenko, A. V., Chornock, R., et al. 2003, PASP, 115, 453L
- Livne (1999) Livne, E. 1999, ApJ, 527, L97
- Livne et al. (2005) Livne, E., Asida, S. M., Höflich, P. 2005, ApJ, 632, 443
- Maeda & Terada (2016) Maeda, K., & Terada, Y. 2016, International Journal of Modern Physics D, 25, 1630024
- Maunder (1885) Maunder, E. W. 1885, The Observatory, 8, 321
- Maunder (1886) Maunder, E. W. 1886, Memorie della Societa Degli Spettroscopisti Italiani, 14, 144
- McConnachie et al. (2005) McConnachie, A. W., Irwin, M. J., Ferguson, A. M. N., et al. 2005, MNRAS, 356, 979
- Morton (1991) Morton, D. C. 1991, ApJS, 77, 119
- Niemeyer & Hillebrandt (1995) Niemeyer, J. C., & Hillebrandt, W. 1995, ApJ, 452, 779
- Niemeyer et al. (1996) Niemeyer, J. C., Hillebrandt, W., & Woosley, S. E. 1996, ApJ, 471, 903
- Nomoto (1982) Nomoto, K. 1982, ApJ, 253, 798
- Nomoto et al. (1984) Nomoto, K., Thielemann, F.-K., & Yokoi, K. 1984, ApJ, 286, 644
- Nugent et al. (2011) Nugent, P. E., Sullivan, M., Cenko, S. B., et al. 2011, Nature, 480, 344
- Pastorello et al. (2008) Pastorello, A., et al. 2008, MNRAS, 389, 113
- Penney et al. (2014) Penney, R., Höflich, P., 2014, ApJ795, 84
- Perets et al. (2011) Perets, H. B., Badenes, C., Arcavi, I., Simon, J. D., & Gal-yam, A. 2011, ApJ, 730, 89
- Reinecke et al. (1999) Reinecke, M., Hillebrandt, W., & Niemeyer, J. C. 1999, A&A, 347, 739
- Reinecke et al. (2002) Reinecke, M., Hillebrandt, W., & Niemeyer, J. C. 2002, A&A, 391, 1167
- Röpke et al. (2012) Röpke, F.K., Kromer, D., Seitenzahl, I.R. et al. 2012, ApJLet 750, L19
- Sjouwerman & Dickel (2001) Sjouwerman, L. O., & Dickel, J. R. 2001, Young Supernova Remnants, 565, 433
- Sugimoto & Nomoto (1980) Sugimoto, D., & Nomoto, K. 1980, Space Sci. Rev., 25, 155
- Timmes & Woosley (1992) Timmes, F. X., & Woosley, S. E. 1992, ApJ, 396, 649
- Winkler et al. (2005) Winkler, P. F., Long, K. S., Hamilton, A. J. S., & Fesen, R. A. 2005, ApJ, 624, 189