SN 2015U: A Rapidly Evolving and Luminous Type Ibn Supernova
Abstract
Supernova (SN) 2015U (also known as PSN J07285387+3349106) was discovered in NGC 2388 on 2015 Feb. 11. A rapidly evolving and luminous event, it showed effectively hydrogen-free spectra dominated by relatively narrow helium P-Cygni spectral features and it was classified as a SN Ibn. In this paper we present photometric, spectroscopic, and spectropolarimetric observations of SN 2015U, including a Keck/DEIMOS spectrum (resolution ) which fully resolves the optical emission and absorption features. We find that SN 2015U is best understood via models of shock breakout from extended and dense circumstellar material (CSM), likely created by a history of mass loss from the progenitor with an extreme outburst within –2 yr of core collapse (but we do not detect any outburst in our archival imaging of NGC 2388). We argue that the high luminosity of SN 2015U was powered not through 56Ni decay but via the deposition of kinetic energy into the ejecta/CSM shock interface. Though our analysis is hampered by strong host-galaxy dust obscuration (which likely exhibits multiple components), our dataset makes SN 2015U one of the best-studied Type Ibn supernovae and provides a bridge of understanding to other rapidly fading transients, both luminous and relatively faint.
keywords:
supernovae: individual: SN 2015U – stars: mass loss1 Introduction
Core-collapse supernovae (SNe) are luminous explosions that mark the end of a massive star’s life. These SNe are differentiated from their thermonuclear counterparts (Type Ia SNe) and are grouped into classes via spectral and photometric analyses (e.g., Filippenko, 1997). The major core-collapse subclasses include SNe IIP and IIL, events which show strong hydrogen throughout their evolution and respectively do or do not exhibit a hydrogen-recombination plateau in their light curves (though the distinction between SNe IIP and IIL may be less clear than previously thought; e.g., Arcavi et al., 2012; Anderson et al., 2014; Sanders et al., 2015). SNe Ib and Ic (often called stripped-envelope SNe) are core-collapse events that show no hydrogen in their spectra and (for SNe Ic and broad-lined SNe Ic) no helium; they (along with the intermediate SNe IIb, which exhibit very little hydrogen) are commonly understood to arise from progenitor stars that have lost all or most of their hydrogen (and perhaps helium) envelopes prior to core collapse, though the detailed connections between progenitors and SN observables remain somewhat uncertain (e.g., Matheson et al., 2001; Drout et al., 2011; Bianco et al., 2014; Modjaz et al., 2014; Liu et al., 2015; Dessart et al., 2015).
A subset of SNe reveal signatures of a dense shroud of circumstellar material (CSM) surrounding their progenitors at the time of explosion. For hydrogen-rich events, relatively narrow lines (full width at half-maximum intensity [FWHM] km s-1) from this interaction with the CSM are often detected; these objects have been dubbed SNe IIn (e.g., Schlegel, 1990; Filippenko, 1991). This interaction can provide a significant luminosity boost (as has been observed for superluminous SNe IIn; e.g., Gal-Yam, 2012). CSM interaction occurs in some hydrogen-poor SNe as well. SNe Ia-CSM are thermonuclear events that exhibit relatively narrow features (usually H emission) caused by interaction with hydrogen-rich CSM (though the underlying SN ejecta are hydrogen-poor; e.g., Silverman et al., 2013b, a). A small number of stripped-envelope SNe have been found to exhibit the spectral signatures of CSM interaction. SNe Ibn (e.g., Foley et al., 2007; Pastorello et al., 2008a) show relatively narrow helium lines in their spectra but no hydrogen, and they can be quite heterogeneous in their photometric evolution (e.g., Pastorello et al., 2016), while the remarkable SN 2014C appeared to be a normal SN Ib at peak brightness but then began interacting with hydrogen-rich CSM only a few months later (Milisavljevic et al., 2015).
In addition to the examples of interaction with dense CSM described above, indications of very short-lived interaction with CSM have been discovered through “flash spectroscopy” of very young SNe of various types (e.g., Gal-Yam et al., 2014; Shivvers et al., 2015; Khazov et al., 2016). These examples exist on a continuum of CSM densities with the strongly interacting events described above; they require much less CSM and their observables at peak brightness generally align with those of “normal” events.
Here we present the results of our observational campaign to study SN 2015U, a remarkable and very well-monitored SN Ibn. It was discovered in NGC 2388 by the Lick Observatory Supernova Search (LOSS) with the 0.76 m Katzman Automatic Imaging Telescope (KAIT; Filippenko et al., 2001) on 2015 Feb. 11 (all dates and times reported herein are UTC). Note that, because the official International Astronomical Union name was not assigned until November 2015 (Kumar et al., 2015), this event has also been discussed in the literature under the name PSN J07285387+3349106. Ochner et al. (2015) classified it as a young SN Ibn based upon spectra obtained on Feb. 18, which showed a blue continuum and relatively narrow He I emission features (see also Kumar et al., 2015). Tsvetkov et al. (2015) present BVRI photometry of SN 2015U starting Feb. 17, showing that it has one of the fastest decline rates known (similar to those of SNe 2002bj, 2005ek, and 2010X) and is remarkably luminous (though SN 2015U is significantly obscured by an uncertain amount of dust in the host galaxy). Pastorello et al. (2015c) present additional photometry and low-resolution spectra of this event and describe SN 2015U within the context of SNe Ibn (e.g., Foley et al., 2007; Pastorello et al., 2008a, 2016).
In this paper we present photometric, spectroscopic, and spectropolarimetric observations of SN 2015U, including one epoch of relatively high-resolution Keck DEIMOS spectroscopy (), enabling us to study the narrow-line features in detail. We show that SN 2015U is similar to several other SNe from the heterogeneous SN Ibn class, and that it shares many features with the rapid and luminous transients discovered in the Pan-STARRS1 (PS1) archives (Drout et al., 2014), those found in the SuperNova Legacy Survey (SNLS) archives (Arcavi et al., 2016), and a few other rapidly fading SNe from the literature. SN 2015U offers valuable insights into the physics of the poorly observed class of rapidly fading SNe.
2 Observations
2.1 Photometry
SN 2015U was first detected by KAIT on Feb. 11.24 at mag in an unfiltered image.111The KAIT clear passband is similar to the band but broader. For more details and transformations to standard passbands, see Riess et al. (1999) and Li et al. (2003). An unfiltered image taken the night before (Feb. 10.30) shows no source to a limit of mag. We began acquiring multiband photometry (BVRI and clear) starting Feb. 14 with KAIT and the 1 m Nickel telescope at Lick Observatory. We used a set of 50 Nickel and KAIT images with strong detections of SN 2015U and with good astrometric solutions for the field to calculate an updated position: , (J2000), offset from the centre of the galaxy by . We believe this position to be accurate within or better — the positions we measured for the SN exhibit a scatter of in both right ascension and declination across 50 images.
Ganeshalingam et al. (2010) describe our photometric observing program at Lick in detail, along with our KAIT and Nickel image-reduction pipeline. Point-spread-function (PSF) photometry was performed using DAOPHOT (Stetson, 1987) from the IDL Astronomy User’s Library.222http://idlastro.gsfc.nasa.gov/ Instrumental magnitudes were calibrated to several nearby stars from the Sloan Digital Sky Survey, transformed into the Landolt system using the empirical prescription presented by Robert Lupton.333http://www.sdss.org/dr7/algorithms/sdssUBVRITransform.html
We measure SN 2015U’s date of peak of brightness in each passband of our Nickel+KAIT photometry by fitting a low-order polynomial to the light curve within the first week (first 10 days for the band) and use Monte Carlo Markov Chain (MCMC) methods to estimate our uncertainties. In Modified Julian Day (MJD), we find , , and (our data do not constrain the -band peak well). Throughout our analysis we present phases relative to the -band peak. NGC 2388 is at a redshift of (NED; de Vaucouleurs et al., 1991), which (assuming cosmological parameters H km s-1 Mpc-1, , and ) translates into a luminosity distance of 58.9 Mpc (Wright, 2006) and a distance modulus of mag that we adopt for all absolute-magnitude corrections.
NGC 2388 and the SN site (pre-explosion) were imaged on 2004 Sep. 10 with the Hubble Space Telescope (HST) and the Near-Infrared Camera and Multi-Object Spectrometer (NICMOS) with the NIC2 aperture (scale pixel-1) in bands F110W, F160W, F187N, and F190N. We determined the SN position in each band’s mosaic data products based on the absolute SN position and the world coordinate system of the image — no stellar object was detected at this position in any of the mosaics. We quantified these nondetections in the F110W and F160W mosaics using DAOPHOT by assuming a PSF constructed from the brightest isolated star in the mosaics and inserting an artificial star at the SN position. The artificial star was measured with ALLSTAR within DAOPHOT using photometric calibrations established from the online cookbook444www.stsci.edu/hst/nicmos/performance/photometry/cookbook.html; corrections to infinite aperture and zeropoints at zero magnitude were obtained from www.stsci.edu/hst/nicmos/performance/photometry/postncs_keywords.html. and with parameters appropriate for NIC2, and then reduced in luminosity until it was detected at a signal-to-noise ratio (S/N) of . The corresponding upper limits are and mag in F110W and F160W, respectively.
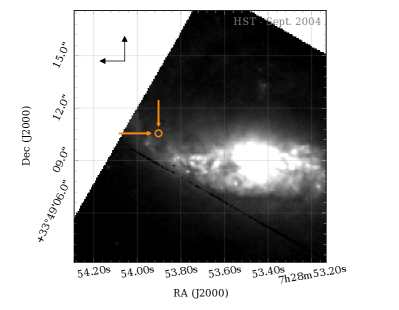
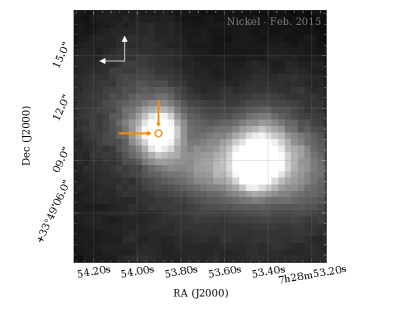
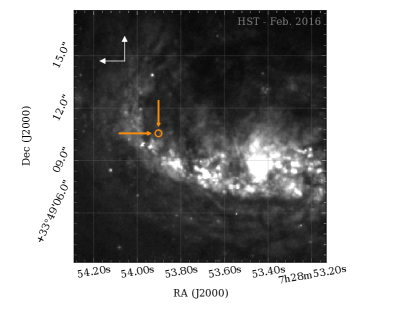
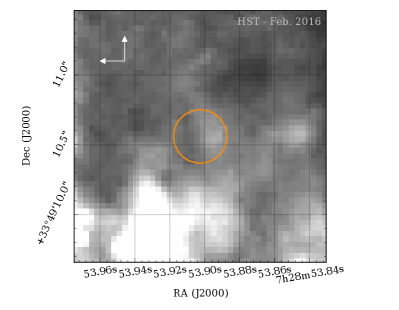
Under our Cycle 23 Snapshot program with HST’s Wide Field Camera 3 (WFC3; GO-14149, PI Filippenko), we obtained images of the SN location on 2016 Feb. 14 (1 yr post explosion) through the F555W (710 s) and F814W (780 s) filters (scale pixel-1). Figure 1 shows a Nickel detection of SN 2015U alongside the pre-explosion NICMOS F110W image and the 1 yr WFC3 F555W image of the SN location. We find that SN 2015U exploded on the trailing edge of NGC 2388’s spiral arm, in a region with several probable dust lanes and a generally clumpy appearance. One of those clumps falls within the 3 position error circle in both the F555W and F814W images and is not detected in the pre-explosion NICMOS images. However, this clump appears to be extended and smoothly connected with other bright regions, not point-like, and we therefore attribute it to the host galaxy and not to SN 2015U.
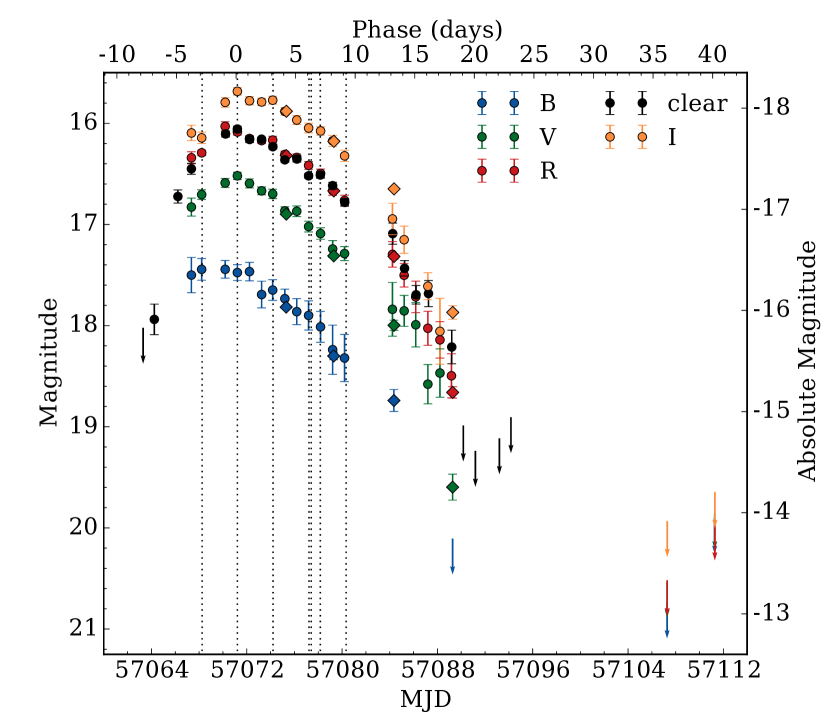
Table 1 presents our photometry of SN 2015U before applying any dust reddening corrections, and Figure 2 shows the light curves after correcting for Milky Way (MW) dust absorption. The data are also available for download from the Berkeley SuperNova DataBase (SNDB; Silverman et al., 2012).555http://heracles.astro.berkeley.edu/sndb/
| UT Date | MJD | B (1) | V (1) | R (1) | I (1) | clear (1) | Instrument |
|---|---|---|---|---|---|---|---|
| 2015-02-10 | 57063.30 | - | - | - | - | 18.4 | KAIT |
| 2015-02-11 | 57064.24 | - | - | - | - | 18.06 (0.15) | KAIT |
| 2015-02-13 | 57066.22 | - | - | - | - | 16.85 (0.06) | KAIT |
| 2015-02-14 | 57067.35 | 17.71 (0.17) | 16.98 (0.09) | 16.46 (0.06) | 16.18 (0.08) | 16.57 (0.05) | KAIT |
| 2015-02-15 | 57068.22 | 17.65 (0.11) | 16.86 (0.05) | 16.41 (0.03) | 16.23 (0.06) | - | KAIT |
| 2015-02-17 | 57070.19 | 17.65 (0.09) | 16.74 (0.04) | 16.15 (0.05) | 15.88 (0.05) | 16.23 (0.03) | KAIT |
| 2015-02-18 | 57071.21 | 17.69 (0.08) | 16.67 (0.04) | 16.21 (0.03) | 15.77 (0.04) | 16.18 (0.03) | KAIT |
| 2015-02-19 | 57072.23 | 17.68 (0.09) | 16.75 (0.04) | 16.27 (0.03) | 15.87 (0.04) | 16.28 (0.03) | KAIT |
| 2015-02-20 | 57073.24 | 17.90 (0.13) | 16.82 (0.04) | 16.29 (0.03) | 15.88 (0.04) | 16.28 (0.02) | KAIT |
| 2015-02-21 | 57074.18 | 17.86 (0.10) | 16.85 (0.05) | 16.29 (0.04) | 15.86 (0.04) | 16.35 (0.02) | KAIT |
| 2015-02-22 | 57075.20 | 17.94 (0.09) | 17.02 (0.04) | 16.43 (0.03) | 15.97 (0.04) | 16.48 (0.02) | KAIT |
| 2015-02-22 | 57075.32 | 18.03 (0.02) | 17.05 (0.01) | 16.44 (0.01) | 15.97 (0.01) | - | Nickel |
| 2015-02-23 | 57076.20 | 18.07 (0.13) | 17.02 (0.05) | 16.46 (0.04) | 16.06 (0.04) | 16.48 (0.03) | KAIT |
| 2015-02-24 | 57077.19 | 18.11 (0.14) | 17.18 (0.05) | 16.54 (0.04) | 16.13 (0.05) | 16.64 (0.02) | KAIT |
| 2015-02-25 | 57078.19 | 18.22 (0.15) | 17.24 (0.06) | 16.62 (0.04) | 16.16 (0.04) | 16.63 (0.03) | KAIT |
| 2015-02-26 | 57079.21 | 18.45 (0.24) | 17.40 (0.08) | 16.79 (0.05) | 16.26 (0.06) | 16.74 (0.03) | KAIT |
| 2015-02-26 | 57079.30 | 18.51 (0.04) | 17.47 (0.02) | 16.79 (0.01) | 16.27 (0.02) | - | Nickel |
| 2015-02-27 | 57080.21 | 18.53 (0.23) | 17.44 (0.07) | 16.89 (0.05) | 16.41 (0.06) | 16.91 (0.04) | KAIT |
| 2015-03-03 | 57084.23 | - | 17.99 (0.27) | 17.42 (0.13) | 17.03 (0.16) | 17.21 (0.10) | KAIT |
| 2015-03-03 | 57084.35 | 18.95 (0.11) | 18.15 (0.05) | 17.44 (0.03) | 16.74 (0.02) | - | Nickel |
| 2015-03-04 | 57085.22 | - | 18.01 (0.15) | 17.63 (0.12) | 17.24 (0.13) | 17.56 (0.08) | KAIT |
| 2015-03-05 | 57086.19 | - | 18.15 (0.22) | 17.84 (0.16) | - | 17.82 (0.09) | KAIT |
| 2015-03-06 | 57087.20 | - | 18.73 (0.19) | 18.15 (0.17) | 17.70 (0.13) | - | KAIT |
| 2015-03-06 | 57087.25 | - | - | - | - | 17.81 (0.13) | KAIT |
| 2015-03-07 | 57088.21 | - | 18.62 (0.24) | 18.26 (0.18) | 18.14 (0.33) | - | KAIT |
| 2015-03-08 | 57089.19 | - | - | 18.62 (0.22) | - | 18.33 (0.17) | KAIT |
| 2015-03-08 | 57089.28 | 20.5 | 19.75 (0.13) | 18.78 (0.06) | 17.96 (0.07) | - | Nickel |
| 2015-03-09 | 57090.17 | - | - | - | - | 19.3 | KAIT |
| 2015-03-10 | 57091.19 | - | - | - | - | 19.6 | KAIT |
| 2015-03-12 | 57093.20 | - | - | - | - | 19.5 | KAIT |
| 2015-03-13 | 57094.17 | - | - | - | - | 19.3 | KAIT |
| 2015-03-26 | 57107.28 | 21.1 | 20.9 | 20.9 | 20.3 | - | Nickel |
| 2015-03-30 | 57111.28 | 20.3 | 20.2 | 20.3 | 20.0 | - | Nickel |
2.2 Spectroscopy
We began a spectral monitoring campaign of SN 2015U on 2015 Feb. 15, obtaining six spectra with the Kast double spectrograph (Miller & Stone, 1993) on the Shane 3 m telescope at Lick Observatory and one spectrum with the DEIMOS spectrograph (Faber et al., 2003) on the Keck-II 10 m telescope. Details of our spectral observations are listed in Table 2, and all reductions and calibrations were performed with standard tools and methods, including IRAF routines and custom Python and IDL codes666https://github.com/ishivvers/TheKastShiv (e.g., Matheson et al., 2000; Pérez & Granger, 2007; Silverman et al., 2012).
All spectra were taken at or near the parallactic angle (Filippenko, 1982), and the amount of galaxy flux falling into the slit varied as a function of seeing and the slit orientation on the sky. For the spectra which included a large amount of host-galaxy flux (Feb. 18, 21, and 24), we extract a spectrum from a region of the galaxy that does not include any SN 2015U flux, perform a median-filter smoothing to obtain the galaxy continuum, and then subtract it from our spectra, after determining a best-fit galaxy scaling coefficient by comparing synthetic photometry to the multiband photometry observed the same night. We do not attempt to remove the narrow (unresolved) galaxy emission features, so our spectra show varying degrees of narrow-line contamination from the host (including H, H, and [S II]).
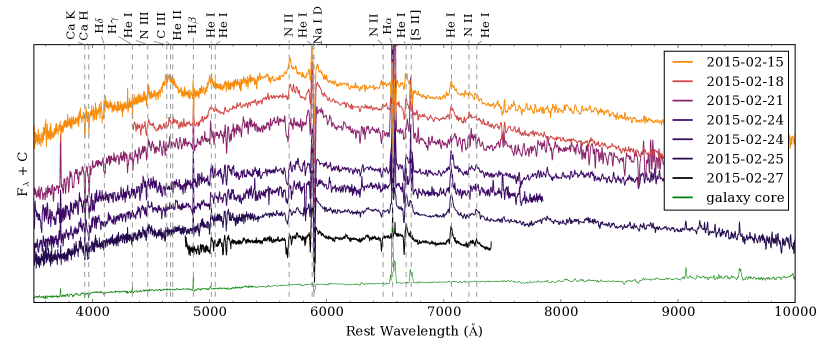
We renormalise each spectrum to match our template-subtracted or -band photometry (depending on the spectral wavelength coverage) after linearly interpolating the photometry to the time of spectral observation. Figure 3 shows our total-flux spectra of SN 2015U. All spectra are available to download from the Berkeley SNDB and the Weizmann Interactive Supernova Data REPository (WiseREP; Yaron & Gal-Yam, 2012).777http://wiserep.weizmann.ac.il/
Using narrow H host-galaxy emission in our DEIMOS spectrum, we measure a line-of-sight redshift at the SN’s location: , a difference of km s-1 from the published redshift of the host galaxy — consistent with the SN’s position on the approaching arm of this spiral galaxy.
2.3 Spectropolarimetry
Three epochs of spectropolarimetry were obtained of SN 2015U near peak brightness utilising the dual-beam polarimetry mode of the Lick 3 m Kast spectrograph. The orientation of the slit on the sky was always set to a position angle of (i.e., aligned north-south), and exposures of 900 s were obtained at each of four waveplate positions (, , , and ). On each night, several waveplate sequences were performed and coadded. Flatfield and arc-lamp spectra were obtained immediately after each sequence without moving the telescope.
For polarimetric calibrations, the low-polarization standard stars BD+32∘3739 and BD+05∘2618 were observed to verify the low instrumental polarization of the Kast spectrograph. We constrained the average fractional Stokes and values to %. By observing the above unpolarized standard stars through a 100% polarizing filter we determined that the polarimetric response is so close to 100% that no correction was necessary. Finally, we obtained the instrumental polarization position-angle curve and used it to correct the data. We observed the high-polarization stars HD 19820, BD +59∘389, and V1Cyg12 to obtain the zeropoint of the polarization position angle on the sky () and to determine the accuracy of polarimetric measurements, which were generally consistent with previously published values within % and . All spectropolarimetric reductions and calculations were performed using the methods described by Mauerhan et al. (2015, and references therein), and we define the polarimetric parameters in the same manner as those authors (Stokes parameters and , debiased polarization , and sky position angle ).
To probe the Galactic component of interstellar polarization (ISP) along the line of sight toward SN 2015U, we used the method of spectroscopic parallax to select three stars within of separation from the source and measured their integrated -band polarization () and position angle (). For HD 58221 we obtained 0.01%, ; for HD 58726, 0.01%, ; and for HD 59291, 0.01%, (uncertainties are statistical). We interpret the significantly higher value of for HD 58726 (A0 V spectral type) as being caused by some intrinsic polarization for that star, so we used the average values of the other two stars (0.25%, 14.3∘) to calculate the associated Serkowski-Whittet form (Serkowski et al., 1975; Whittet et al., 1992), assuming a total-to-selective extinction ratio of and that the polarization peaks at 5500 Å, values appropriate for the MW. The resulting curve was subtracted from the SN 2015U data to remove the small but nonnegligible Galactic component of ISP. The above observations (along with calibration observations of the low-polarization standard star HD 14069 and the high-polarization standards HD 245310 and HD 25443) were taken with the Kast spectrograph on 2015 Sep. 21.
| UT Date | Type888F: total flux; S: spectropolarimetry. | Tel./Instr. | Wavelength | Resolution | Exp. | Observer999Observers and data reducers are indicated with their initials. IS: Isaac Shivvers; WZ: WeiKang Zheng; JM: Jon Mauerhan; MG: Melissa Graham; PK: Patrick Kelly; IK: Io Kleiser; JS: Jeffrey Silveman. | Reducer9 |
|---|---|---|---|---|---|---|---|
| (Å) | (Å) | (s) | |||||
| 2015-02-15.256 | F | Shane/Kast | 3440–10,870 | 2 | 1200 | IS | IS |
| 2015-02-18.211 | F | Shane/Kast | 4400–9880 | 2 | 2400 | WZ | IS |
| 2015-02-21.207 | F | Shane/Kast | 3500–10,500 | 2 | 1200 | WZ | IS |
| 2015-02-21.313 | S | Shane/Kast | 4500–10,000 | 16 | 101010All spectropolarimetry was obtained by rotating multiple times through four waveplate positions; see §2.3. | WZ | JM |
| 2015-02-24.224 | F | Shane/Kast | 3500–10,500 | 2 | 1200 | WZ | IS |
| 2015-02-24.322 | S | Shane/Kast | 4500–10,000 | 16 | WZ | JM | |
| 2015-02-24.414 | F | Shane/Kast | 3500–7875 | 1 | 1800 | WZ | IS |
| 2015-02-25.171 | F | Shane/Kast | 3500–10,500 | 2 | 1200 | MG | MG |
| 2015-02-25.301 | S | Shane/Kast | 4500–10,000 | 16 | MG | JM | |
| 2015-02-27.34 | F | Keck/DEIMOS | 4850–7510 | 0.3 | 1200 | PK | IS |
| 2010-03-022.17111111A previously unpublished observation of SN 2010al; see Figure 13. | F | Shane/Kast | 3450–10,790 | 3 | 2100 | IK | JS |
3 Analysis
3.1 Dust Corrections
All observations of SN 2015U are heavily affected by an obscuring screen of dust present in the host galaxy, NGC 2388. Because the treatment of dust corrections affects much of the following discussion, we start by describing our efforts to understand, characterise, and correct for the effects of the host-galaxy dust. First, however, we correct for MW dust along the line of sight using the dust maps of Schlafly & Finkbeiner ( mag; 2011) and assuming (Cardelli et al., 1989).
Ochner et al. (2015) note that a significant amount of host-galaxy reddening is apparent in their classification spectrum, with an estimated mag based upon the Na I D feature. Our higher-resolution DEIMOS spectrum from Feb. 27 reveals complex Na I D absorption near the host redshift (we examine the structure of this feature in §3.2.4). We measure the equivalent width (EW) of the entire absorption complex to be Å — well outside the empirical relations of Poznanski et al. (2012) and similar previous efforts, which show that the Na I D lines saturate and lose their predictive power above a total EW of Å and mag. This indicates that the reddening toward SN 2015U likely exhibits mag, if the dust in NGC 2388 is similar to that in our MW.
Pastorello et al. (2015c) measure an Na I D EW of Å from their spectra; we tentatively suggest that the discrepancy between their value and ours is caused by different choices made when defining the local continuum. Figure 6 shows that the Na I D components fall on the red wing of the He I emission line, even at early times. However, if one instead defines the local continuum based upon the overall flux-density level (a reasonable choice if the emission-line wings were not detected), one obtains Na I D EW values similar to those of Pastorello et al. (2015c).
We next examined the 5780.5 Å diffuse interstellar band (DIB). This feature is one of the strongest DIBs; it has long been known to correlate with extinction in the MW when the Na I D feature is saturated (e.g., Herbig, 1995; Friedman et al., 2011; Lan et al., 2015; Baron et al., 2015), and Phillips et al. (2013) show a clear correlation between this feature and the reddening toward SNe Ia produced by host-galaxy dust. We do not detect this feature, and our spectra have insufficient S/N to place strong constraints on the dust using our nondetection. We also examined modeled estimates for the amount of dust obscuring the bulk of stars in the host galaxy NGC 2388 (Pereira-Santaella et al., 2015), and we determined the same value at the location of the SN (within on the sky) by measuring the Balmer ratio implied by the H and H galaxy lines present in our DEIMOS spectrum (e.g., Brocklehurst, 1971). We estimate and mag, respectively, toward the average star in NGC 2388’s core and the average star near the explosion site of SN 2015U. Although this does not provide a measure of the line-of-sight reddening toward SN 2015U specifically, it does provide valuable context about the dust content of NGC 2388.
Additional information is available to us through the spectropolarimetry: as we describe in §3.2.5, the peak of the polarization spectrum () of NGC 2388’s ISM is blueward of 4600 Å. The shapes of the polarization law and the dust-extinction law are related within the MW (e.g., Serkowski et al., 1975; Clayton & Mathis, 1988). Using from Clayton & Mathis (1988, with in m), our measurement of m implies . However, note that Patat et al. (2015) show the polarization properties of the host-galaxy dust obscuring several well-studied and reddened SNe Ia to be remarkably different from those of the dust in our MW.
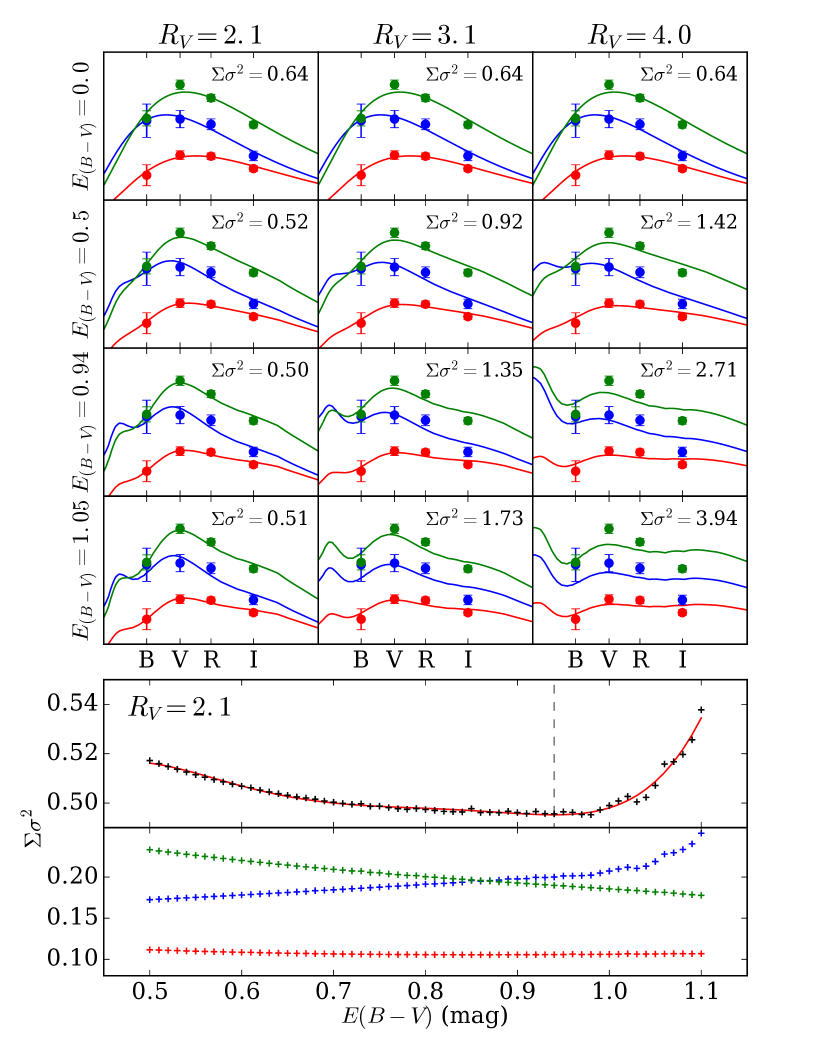
Finally, we model SN 2015U as a blackbody emitter obscured behind a simple screen of dust in the host galaxy and fit for the parameters of that dust via comparisons with our multiband photometry at three epochs (pre-maximum, maximum, and post-maximum brightness). Our spectra show that the emission from SN 2015U is roughly that of a blackbody obscured by dust, at least at optical wavelengths (unlike most SNe, which display spectra consisting of prominent and overlapping features with sometimes strong line blanketing), and in §3.5 we discuss why one would expect roughly blackbody emission from SN 2015U. We use PySynphot121212http://ssb.stsci.edu/pysynphot/docs/ and assume the dust is described by the empirical extinction law of Cardelli et al. (1989) — by varying the parameters and we are able to explore a wide variety of dust populations and search for the parameters that produce the best blackbody fits to our photometric data.
Figure 4 shows a comparison between synthetic photometry from PySynphot and the photometry assuming four different values for ranging from 0.0 mag to 1.0 mag and three different reddening laws parameterised by from 2.1 to 4.0 (note that PySynphot only includes a few built-in options for ; we explore the most relevant of them here). For every combination of and , we perform a weighted least-squares fit to determine the best-fit temperature and luminosity of the source blackbody and we list the weighted sum of squared differences () for each. Figure 4 shows that a nonzero amount of host-galaxy reddening correction makes the fits worse for and 4.0 — in those cases the photometric data prefer a blackbody with no dust. However, the spectra clearly show a nonthermal rolloff at blue wavelengths (see Figure 3), and so there must be a significant amount of dust absorption within NGC 2388. If we instead adopt , a grid search over values indicates a best fit at mag. As Figure 5 shows, dereddening the spectra for this reddening law appears to correct the blue rolloff. Figure 4 shows that increases above and below mag, but between those values is only weakly dependent upon . We therefore use Figure 4 to estimate our error bars: mag. A similar approach was taken by Pastorello et al. (2015c), who compared the colour curves of SN 2015U to the intrinsic colour curves of other SNe Ibn to obtain mag (assuming ). However, as they note, the SN Ibn subclass is remarkably heterogeneous, and it is not clear whether the physics governing those colour curves is the same for all members.
Given the above discussion, we adopt and mag. The large EWs measured from the Na I D and the odd absorption-feature complex indicate that a simple analysis of those features cannot be trusted. Studies of the integrated galaxy flux and the Balmer decrement measured from our spectrum show that the bulk of NGC 2388’s stellar mass is strongly obscured, and our spectropolarimetric data indicate that SN 2015U itself exploded behind a significant dust screen. The low value in the polarization spectrum and our blackbody fits to the light curves together prefer a relatively wavelength-dependent dust extinction law for NGC 2388 (i.e., ) and mag — we find this line of reasoning most convincing. The above result is consistent with the mag adopted by Pastorello et al. (2015c), though they assume . Our determination of the dust properties toward SN 2015U remains uncertain, so we consider a range of plausible reddening corrections throughout the rest of this paper. We find that the extinction toward §3.2.4 does not appear to change over the course of our observations, and we discuss and reject the possibility that a significant fraction of the extinction toward SN 2015U arises from the SN’s CSM rather than the host galaxy’s ISM.
3.2 Spectra
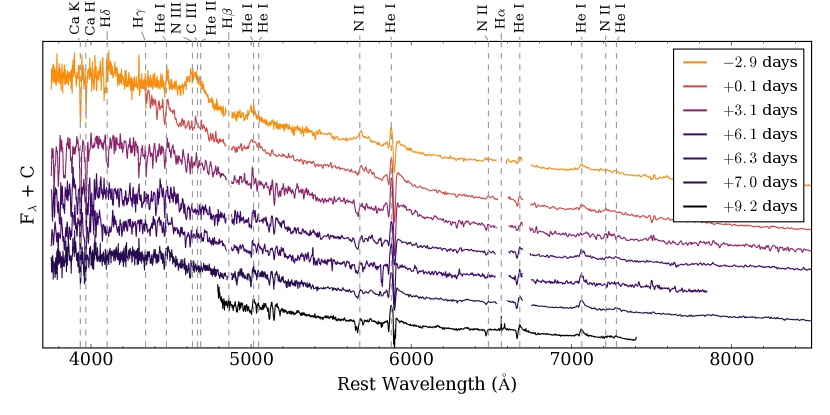
The optical spectra of SN 2015U show a strong continuum overlain with narrow and intermediate-width emission features. Though our data cover only 12 days of SN 2015U’s evolution, they range from a pre-maximum spectrum to one taken after the SN had faded from peak by mag (see Figure 2). No broad ejecta features became apparent in our spectra throughout that timespan — markedly different behaviour from that of the well-observed, rapidly fading SNe 2002bj, 2005ek, and 2010X (Poznanski et al., 2010; Drout et al., 2013; Kasliwal et al., 2010) and similar to that of the interacting SN 2010jl (e.g., Fransson et al., 2014). Though broad features do not emerge, the continuum temperature shows significant evolution, the narrow emission and absorption features evolve, and the relative ionisation states of the detected elements change. While there are no strong H lines, multiple ionisation levels of helium, nitrogen, iron, and perhaps oxygen and carbon are detected, some in both emission and absorption and some in absorption only. Pastorello et al. (2015c) also present a series of spectral observations of SN 2015U. Their data are in good agreement with ours and extend to later epochs, while our (higher-resolution) spectra illustrate new details not apparent previously.
3.2.1 Evolving Line Profiles
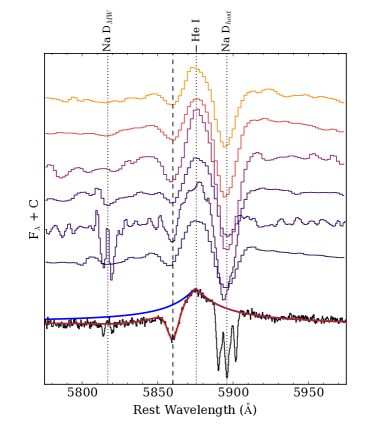
The most obvious features in our spectra are emission lines of He I. These lines are centred at the rest wavelength, exhibit a relatively broad base with a full width near zero intensity (FWZI) of –10,000 km s-1, and are overlain with P-Cygni absorption features blueshifted by km s-1 and with widths of 400–500 km s-1. The wavelengths and widths of these features do not significantly change during the days covered by our spectra. We find that the He I line profiles can be parameterised by a “modified Lorentzian” emission component (where the exponent is allowed to vary) with a suppressed blue wing and an overlain Gaussian absorption component, indicative of recombination lines broadened via electron scattering within the CSM. SN 2015U’s line profiles are very similar to those observed in many SNe IIn but with a faster inferred CSM velocity (see, e.g., the spectra of SN 1998S; Leonard et al., 2000; Anupama et al., 2001; Fassia et al., 2001; Chugai, 2001; Shivvers et al., 2015). Figure 6 shows our best fit to the He I 5876 line using this parameterisation. We also show the unsuppressed Lorentzian feature to emphasise the asymmetry, which arises from the effects of Compton scattering within a wind-like CSM (e.g., Auer & van Blerkom, 1972; Hillier, 1991; Chugai, 2001). The magnitude of the effect scales with the expansion velocity, explaining the strongly asymmetric emission lines of SN 2015U compared to those observed in most SNe IIn.
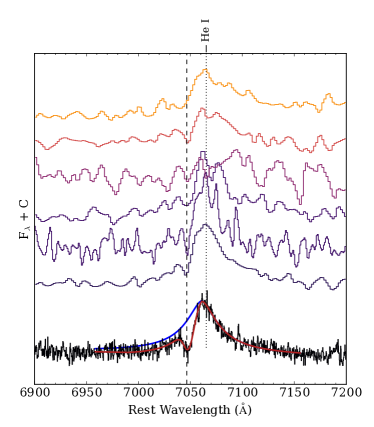
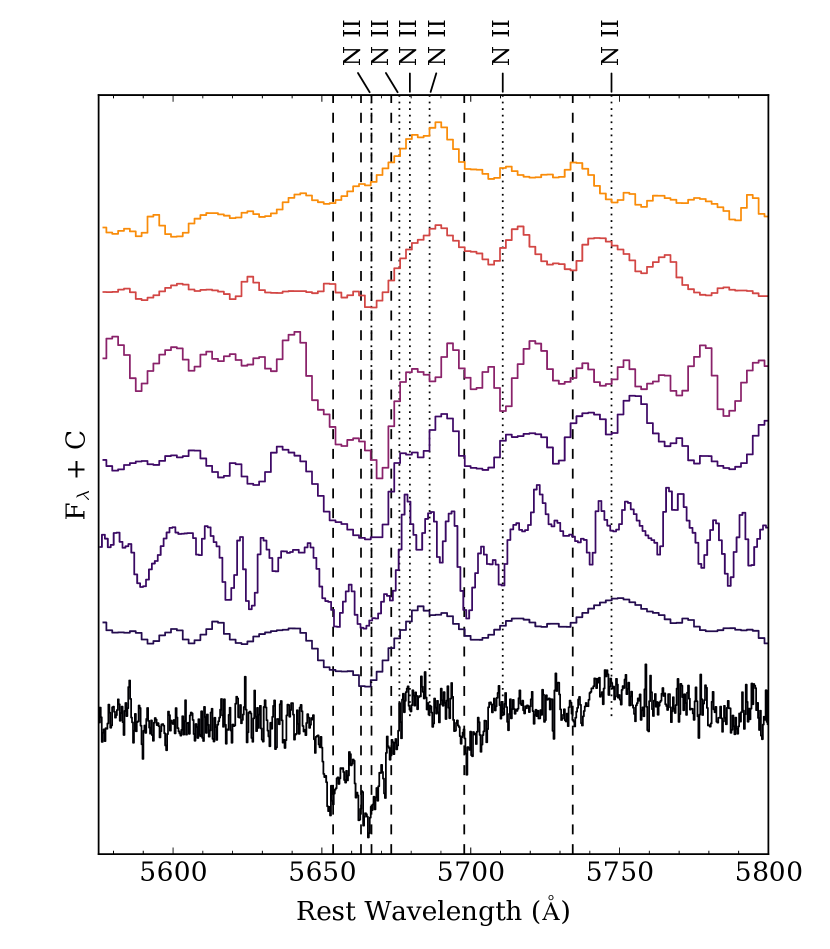
After He I (and host-galaxy H and [N II]), the most clearly detected features in our spectra are the N II lines. As Pastorello et al. (2015c) note, SN 2015U appears to be the first SN Ibn to show these features, though they are commonly found in the spectra of hot stars. In our DEIMOS spectrum we are able to identify nine N II absorption lines (see §3.2.3), and for the strongest of these we track their evolution throughout our spectral series. In our and +0.1 d spectra, the 5667 Å and 5676 Å features are apparent in emission around km s-1, but they transition into absorption at km s-1 after maximum light — see Figure 7. The same trend is apparent in the N II features at 6482 Å and 7215 Å (Figure 3).
We find a strong emission feature centred around 4650 Å in our earliest spectrum. In Figure 3 we label it as a blend of N III, C III, and He II, a blend that has been observed and modeled in the spectra of a few other young, interacting SNe (e.g., Gal-Yam et al., 2014; Shivvers et al., 2015; Pastorello et al., 2015a). The 4650 Å emission feature fades rapidly. Given the clear detection of N II at all epochs we believe the identification of N III to be very robust, but whether the blue wing of that emission feature is caused by C III or He II is more difficult to determine. The He II 5411 line is extremely weak in SN 2015U, which argues that C III must be contributing to the 4650 Å feature, but discerning between these ions likely requires detailed modeling and is beyond the scope of this paper.
3.2.2 A Trace of Hydrogen?
Inspection of our two-dimensional (2D) spectral images reveals host-galaxy emission features at H, H, and H, and there is no indication of either absorption or emission features intrinsic to SN 2015U for any of those lines. However, our spectra at d and +3.1 d do show an absorption feature near the expected wavelength of H, decelerating over those 5 days from km s-1 (blueshifted) to km s-1 (redshifted relative to the rest frame of SN 2015U, consistent with the rest frame of NGC 2388) and then disappearing by +6.1 d. Though this feature is difficult to disentangle from the significant noise at these wavelengths, it appears to show weak P-Cygni emission in our first observation.
NGC 2388 shows some H absorption, and the feature from +3.1 d is probably associated with the galaxy (this spectrum has undergone host-galaxy subtraction as described in §2.2). However, in our d spectrum SN 2015U was well-separated from the host and we performed no galaxy subtraction. Along with the 1000 km s-1 Doppler shift and faint P-Cygni feature, this indicates that the weak H feature in the earliest spectrum of SN 2015U arose within the same CSM as the He I and other features described above.
Several SNe have been found to exist between the IIn and Ibn subclasses, exhibiting weak hydrogen features (e.g., SNe 2005la, 2010al, and 2011hw; Pastorello et al., 2008b, 2015a). Remarkably, SN 2010al had an H feature of comparable strength to its H emission while showing only faint traces of H and H emission — perhaps similar physics governs the hydrogen emission lines in SN 2015U. Regardless of this putative H feature, the amount of hydrogen in the CSM surrounding SN 2015U must be vanishingly small.
3.2.3 Higher Resolution
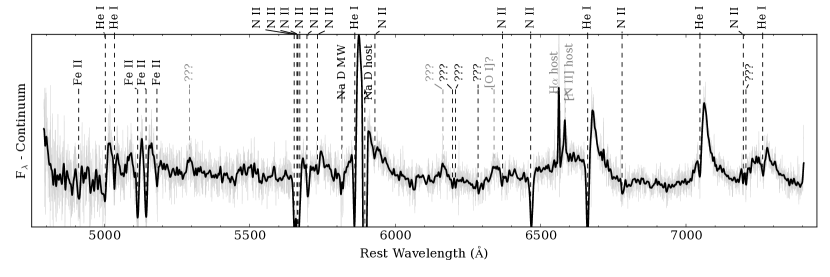
Our DEIMOS spectrum from Feb. 27 () reveals fully resolved absorption and emission lines from a host of ions in the spectra of SN 2015U; see Figure 8 and Table 3. We include measured positions and widths for several lines for which we have no good identification; it is especially difficult to differentiate between Fe III ( eV) and Fe II ( eV).131313All ionisation energies and line wavelengths were found through the NIST Atomic Spectra Database (ASD): http://www.nist.gov/pml/data/asd.cfm. In our spectrum we find at least four Fe absorption lines between 4900 and 5200 Å (in the SN rest frame). The strongest two were identified as Fe III by Pastorello et al. (2015c), but several known Fe II lines occur at very similar wavelengths, and we also identify weak features at 4912.5 and 5180.3 Å which are most plausibly interpreted as Fe II 4924 and Fe II 5195. However, these identifications are tentative at best, given the nondetection of other expected Fe II lines and the odd relative strengths of these features, and so we caution the reader against overinterpreting the Doppler velocities presented in Table 3.
| Ion | Rest | Observed | Offset | FWHM |
|---|---|---|---|---|
| (Å) | (Å) | (km s-1) | (km s-1) | |
| He I | 5015.7 | 5002.6 | 778.8 | 586.4 |
| He I | 5047.7 | 5034.6 | 783.2 | 267.8 |
| He I | 5875.6 | 5860.2 | 789.2 | 488.7 |
| He I | 6678.2 | 6661.7 | 737.2 | 470.1 |
| He I | 7065.2 | 7047.9 | 733.7 | 432.9 |
| He I | 7281.3 | 7265.4 | 655.9 | 404.0 |
| N II | 5666.6 | 5653.0 | 721.4 | 232.5 |
| N II | 5676.0 | 5665.4 | 559.2 | 433.1 |
| N II | 5710.8 | 5699.9 | 570.4 | 407.2 |
| N II | 5747.3 | 5734.8 | 651.6 | 367.5 |
| N II | 6482.1 | 6468.1 | 643.4 | 428.1 |
| N II | 5941.6 | 5927.5 | 711.5 | 600.7 |
| N II | 6796.6 | 6781.8 | 654.2 | 337.9 |
| N II | 7214.7 | 7195.9 | 783.5 | 173.7 |
| N II | 6384.3 | 6366.7 | 829.6 | 253.7 |
| Fe II141414It is difficult to determine exactly which Fe II or Fe III transition is responsible for these lines, and so the listed Doppler offsets are only tentative. | 4923.9 | 4912.5 | 698.0 | 677.2 |
| Fe II14 | 5126.2 | 5114.9 | 658.1 | 514.5 |
| Fe II14 | 5157.3 | 5143.2 | 819.4 | 584.9 |
| Fe II14 | 5195.5 | 5180.3 | 873.2 | 545.7 |
| ? | — | 6197.2 | — | 166.9 |
| ? | — | 6207.3 | — | 152.7 |
| ? | — | 6285.9 | — | 153.8 |
| ? | — | 7206.5 | — | 190.5 |
Identifications and properties of the absorption lines identified in our DEIMOS spectrum (after correcting for ). All lines were fit by a Gaussian with a linear approximation to the nearby continuum, and rest wavelengths were downloaded from the NIST ASD. Characteristic error bars are Å (30 km s-1) for the observed wavelengths and Å for the Gaussian FWHM (85 km s-1), as estimated by calculating the 95% confidence intervals for the N II 5711 line using MCMC techniques.
We also find three unidentified emission features in our DEIMOS spectrum that are not from host-galaxy contamination, falling near 5290, 6165, and 6340 Å and exhibiting widths similar to those of the He I lines. None of these is clearly detected in our other spectra or the spectra published by Pastorello et al. (2015c, though generally they exhibit a S/N too low to rule them out). The feature at 6340 Å is suggestive of the [O I] 6300, 6364 doublet that regularly arises in nebular spectra of stripped-envelope SNe (Types Ib/c; e.g., Filippenko, 1997; Matheson, 2001), but this identification is only tentative.
3.2.4 The Na D Lines
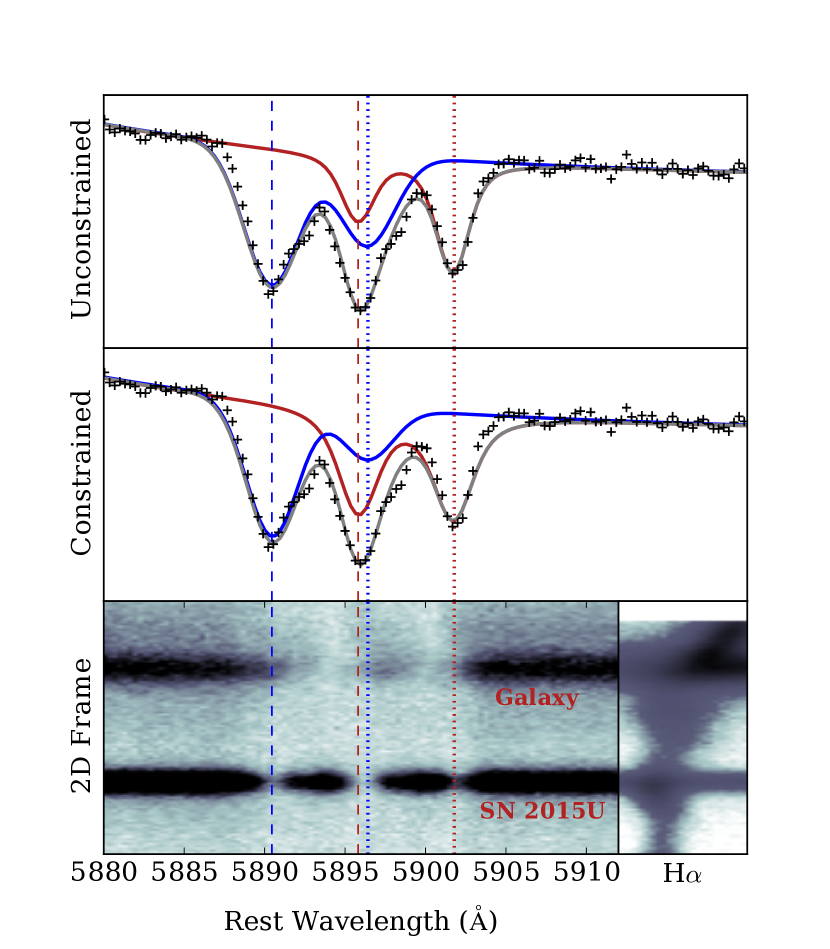
Our DEIMOS spectrum of SN 2015U reveals a remarkable set of Na D absorption lines — see Figure 9. In addition to the MW doublet we find several overlapping lines from NGC 2388 along our sight line, though as we show below, there is no evidence that any of these lines originate within the CSM immediately surrounding SN 2015U. The astronomical Na D doublet has been studied in great detail (it was one of the original Fraunhofer lines) and the relative strength of the doublet has long been used to measure the interstellar abundance of neutral sodium: the Na D2 line is generally observed to be stronger than the D1 line by a factor ranging from 1.0 to 2.0, for high and low column densities of Na I, respectively (e.g., Strömgren, 1948; Nachman & Hobbs, 1973; Somerville, 1988). The MW Na D doublet in our spectra exhibits the expected behaviour, with an EW ratio of D2/D1 , but the host-galaxy lines do not.
There are at least two distinct and overlapping Na D absorption doublets near the host-galaxy’s rest frame in the spectrum of SN 2015U. Figure 9 shows them (as well as model fits) in detail. We model the absorption complex by overlaying the modified Lorentzian emission-line profile (see §3.2.1) with two doublets of Voigt absorption profiles (though we note that some of these lines may be unresolved and saturated). D1 and D2 lines from a single doublet are forced to have the same velocity properties and to be separated by 5.97 Å, but they are allowed independent strengths.
In the top panel of Figure 9 we show the result when we allow the relative strengths of the doublet (i.e., D2/D1) to vary freely. In the rest frame of the SN, the bluest doublet falls at 5890.45, 5896.35 Å. This is a blueshift of only km s-1 from the SN rest frame, and so this doublet is likely to arise from the ISM of NGC 2388 along our sight line to SN 2015U. The second (redder) doublet, however, falls at 5895.80, 5901.69 0.063 Å — redshifted from the SN by almost 300 km s-1, and even redshifted from the galaxy core by more than 100 km s-1. This is within the velocity range of NGC 2388’s rotation curve, but SN 2015U is located well away from the receding spiral arm and the bulk of the galaxy’s receding material (see Figure 1). In addition, the second Na D doublet shows a strength ratio of D2/D1 , well outside the commonly observed values of –2.0 (in contrast, the blue doublet exhibits a reasonable D2/D1 ).
If, instead, we constrain the doublet ratio to D2/D1 , we can also obtain a reasonable fit, though this introduces noticeable discrepancies in the reddest part of the feature — see the middle panel of Figure 9. In addition, this forces the doublet ratio of the bluer doublet outside of the range of normal values: D2/D1 . Adding more components to our model fit will not solve this quandary (though the data do show a shoulder on the bluer doublet, suggesting a third absorption component). The implications for the Na I gas (and the dust) in NGC 2388 are not clear.
Given the spectral signatures of dense CSM surrounding SN 2015U, it is natural to wonder whether some of the Na D absorption arises within the local CSM. Variation in the Na D features over the timescale of the SN evolution would be a clear signature of local absorption (e.g., Patat et al., 2007); however, as Figure 6 shows, no such variation is apparent in our data.
The bottom panel of Figure 9 displays a cutout of the 2D DEIMOS spectrum around the Na D feature. Both SN 2015U and NGC 2388 are clearly visible, and we also show the rotation curve of the galaxy via a cutout of the H emission line. The Na D absorption of NGC 2388’s own ISM is seen against the stellar light of the galaxy, and this galactic self-absorption roughly covers the velocity range of the two components observed along the line of sight toward SN 2015U. It appears that the anomalous red component described above obscures the host galaxy as well as the SN, providing further evidence that this component is unlikely to arise within the CSM of SN 2015U.
3.2.5 Spectropolarimetry
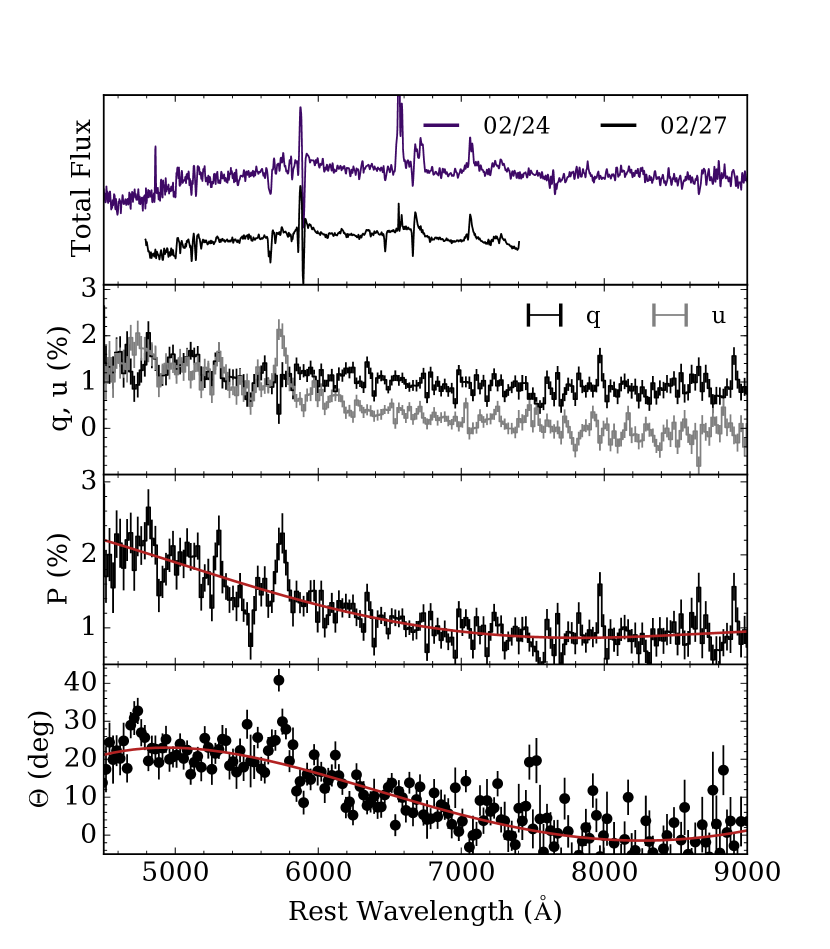
We did not observe significant evolution in the polarization of SN 2015U between our three epochs, so we coadded all of the data to increase the S/N; the results are illustrated in Figure 10. The polarization spectrum of SN 2015U appears to be dominated by ISP associated with the host galaxy NGC 2388, showing a strong increase in continuum polarization toward shorter wavelengths with a value of % at 4600 Å and decreasing to % near 7000 Å. This behaviour is dissimilar to what is typically observed for the MW ISP, which exhibits a peak and turnover near 5500 Å. Instead, the observed behaviour is reminiscent of the ISP produced by the host galaxies of several SNe Ia, including SNe 1986G, 2006X, 2008fp, and 2014J (Patat et al., 2015, see their Figure 2). The continuous rise in beyond the and photometric passbands has previously been interpreted as evidence for scattering by dust grains smaller than those characteristic of the MW disk ISM.
Interestingly, we observe a significant wavelength dependence for the position angle (), which has a value of at 4600 Å and monotonically trends toward near 7000 Å. In the MW, the ISP’s position angle is generally flat. However, a wavelength dependence in has been observed along particular lines of sight toward star-forming regions at distances greater than 0.6 kpc (e.g., Gehrels & Silvester, 1965; Coyne & Gehrels, 1966), and has been explained as the result of photons traversing multiple clouds or scattering media that exhibit various sizes for the scattering particles as well as various orientations for the interstellar magnetic field.
A similar interpretation is plausible here: along the line of sight within NGC 2388 toward SN 2015U there are likely to be multiple separate components of dusty scattering media having different grain sizes and/or different magnetic field orientations. This possibility is particularly interesting considering the complex superposition of multiple Na I D absorption doublets that we see in our high-resolution DEIMOS spectrum. If the continuum flux spectrum of SN 2015U is devoid of broad SN features because of high optical-depth CSM, then one might suspect there also to be a separate and distinct scattering component associated with this CSM, if it is dusty. The subsequent re-scattering of this light as it traverses the dusty ISM of the host could provide a means for producing the observed wavelength dependence of , if there is a difference in grain sizes between these multiple scattering media. Although this scenario is physically plausible, the spectropolarimetric data cannot discriminate between a CSMISM scattering combination and multiple components of host ISM, and our analysis of the total-flux Na I D features indicates that they are likely associated with ISM (see §3.2.4).
Finally, there is a line-like feature near 5820 Å which might naively be interpreted as a signature of intrinsic polarization associated with SN 2015U and with the He I / Na I transition. However, the MW Na I D doublet falls at the same wavelength. Although relatively weak compared to the redshifted host-galaxy Na D absorption, the results of our spectral arithmetic in the vicinity of this poorly resolved doublet profile might have created a spurious artifact in the final coadded dataset mimicking the shape of a polarized line feature. Indeed, in each individual epoch, the polarized spectra near this feature appear to suffer from systematic noise, so we are reluctant to attribute this feature to the SN itself.
3.3 Photometry
The optical light curves of SN 2015U show that it was a remarkably luminous and rapidly evolving event — Figure 11 shows our photometry corrected for host-galaxy dust reddening. With a peak absolute magnitude of mag at optical wavelengths, a rise time of d, a time above half-maximum of d, and a decline rate of nearly 0.2 mag day-1 after peak, SN 2015U was more than a magnitude brighter than most stripped-envelope SNe and evolved much more rapidly (e.g., Drout et al., 2011; Bianco et al., 2014).
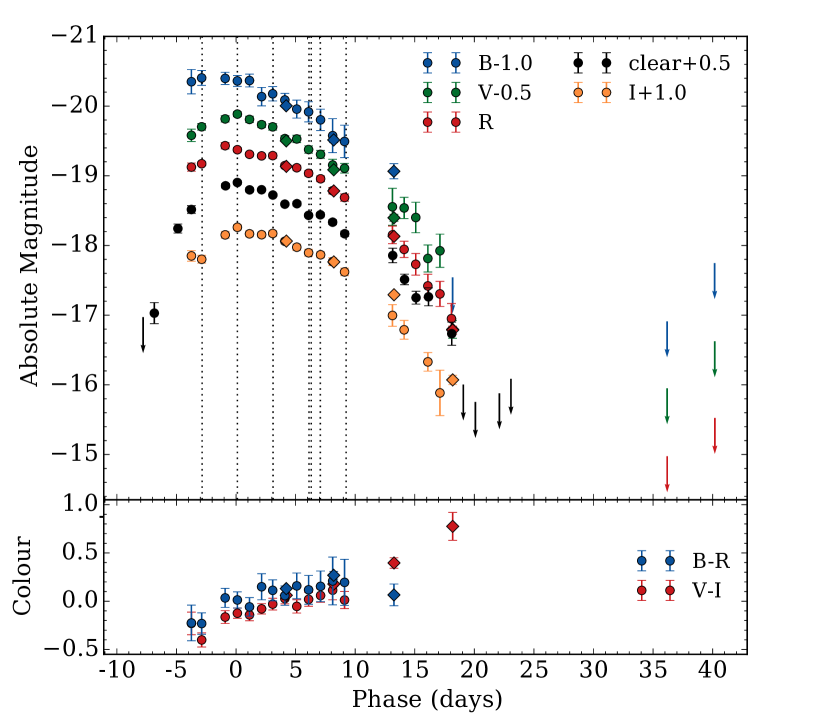
Though the first unfiltered () KAIT detection of SN 2015U was on Feb. 11, and it went undetected by KAIT on Feb. 10 ( mag), Pastorello et al. (2015c) present detections from Feb. 9 and 10 at and mag, respectively. Unfortunately, the location does not appear to have been observed in the days prior and there are not deep upper limits constraining the explosion date further. SN 2015U rose quite rapidly, so we adopt a tentative explosion date one day before the first detection published by Pastorello et al. (2015c): MJD (Feb. 8). This provides us with a rise time for SN 2015U of days. Tsvetkov et al. (2015) note that SN 2015U is among the most rapidly evolving SNe known, with a decline rate similar to those of SNe 2002bj, 2005ek, and 2010X. We measure mag in the band, but note that the decline rate increases ever more steeply after days post-peak, and at all times the bluer passbands decline more rapidly than the red. Simple linear fits indicate the following decline rates before and after d (in mag day-1): , , , , , , and (uncertainties are statistical, and our data do not constrain the late -band decline).
SN 2015U is one of the nearest SNe Ibn to date (Pastorello et al., 2016), but it is still relatively distant for direct progenitor studies (and is obscured by the dust in NGC 2388). Regardless, the HST nondetections presented in §2.1 can be used to place interesting constraints on the SN’s progenitor. We compared these limits to the MIST stellar evolutionary tracks (Choi et al., 2016) at solar metallicity generated in the WFC3/infrared bandpasses (negligible photometric differences exist between NICMOS/NIC2 and WFC3/IR for F110W and F160W). Based on these tracks we can eliminate single-star progenitors with initial masses and . That is, the progenitor would have been either a low-mass star near the core-collapse limit or a highly massive evolved star, possibly in a luminous blue variable (LBV) or Wolf-Rayet phase at the time of explosion. We did not interpret our upper limits with respect to existing binary evolution models, and we caution that these results are somewhat dependent upon the uncertain properties of NGC 2388’s dust population.
The structure near SN 2015U’s position in the 1 yr HST images (Figure 1) may be due to clumpy star-forming regions, perhaps associated with SN 2015U. NGC 2388 is a strongly star-forming and massive galaxy — Pereira-Santaella et al. (2015) calculate an ongoing star-formation rate of M⊙ yr-1 and a total stellar mass of 1011.0±0.1 M⊙ — and though SN 2015U is not obviously associated with the brightest star-forming regions of the galaxy, our spectra do show emission lines from nearby H II regions. The clump may also be an artifact of the intervening dust lanes in NGC 2388; unfortunately there is essentially no colour information available from our images as the host-galaxy background dominates.
3.4 Comparisons with Other Supernovae
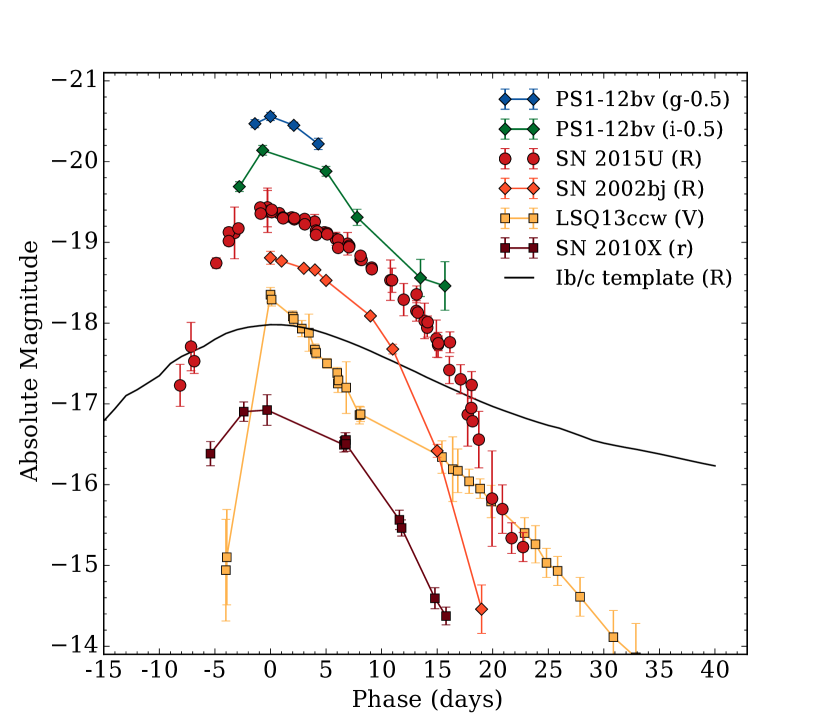
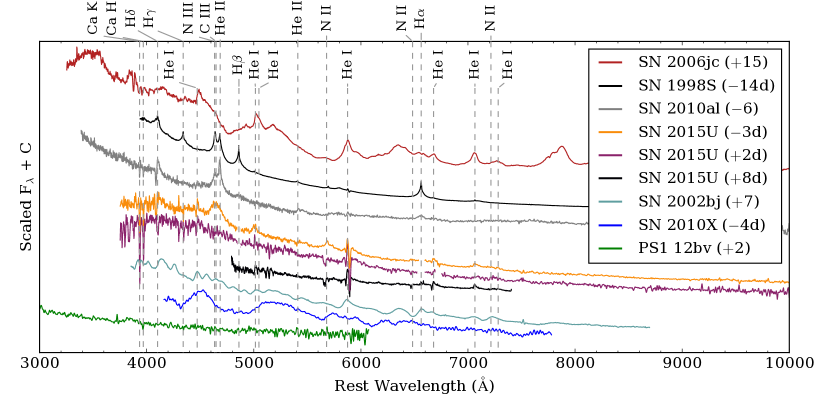
In Figure 12 we compare the light curves of SN 2015U to the -band light curves of SN 2002bj (Poznanski et al., 2010), which was very similar though mag fainter, and SN 2010X (Kasliwal et al., 2010), which also matches well but was mag fainter. SNLS04D4ec and SNLS06D1hc, two of the rapidly rising transients discovered by the Supernova Legacy Survey (SNLS) and presented by Arcavi et al. (2016), also show similar light-curve behaviour but mag brighter than SN 2015U (see their Figure 2). In Figure 13 we compare the spectra of these events: SN 2002bj was hydrogen deficient (SN IIb-like, though not a good spectroscopic match to normal SNe IIb) with a strong blue continuum and P-Cygni features at higher velocities than observed in SN 2015U, while SN 2010X showed no hydrogen (SN Ib/c-like, though again not a good spectroscopic match to normal SNe Ib/c) with broad absorption features. (Unfortunately, no spectra were obtained of the SNLS events.)
The light curves and spectra of SN 2015U are quite similar to those of the rapidly evolving and luminous transients discovered in the PS1 dataset and presented by Drout et al. (2014). Figure 11 includes the and -band light curves of the relatively well-observed PS1-12bv from that sample; it was discovered at , so the and passbands probe rest wavelengths around 3500 Å (about 100 Å shortward of ) and 5350 Å (similar to ), respectively. Without the mag offset used in Figure 11, the -band light curve of PS1-12bv would overlie the band of SN 2015U almost exactly, and the -band curve would be somewhat brighter than the band of SN 2015U. There are no clear detections of any emission features in the spectrum of PS1-12bv, but it and the other events from the PS1 sample were discovered at very large distances, and high-S/N spectra do not exist for those events. It is plausible that narrow emission lines of helium (and/or hydrogen) were present but went undetected.
Figure 13 shows that SN 2015U shares the blue colour and prominent He I emission features of the canonical SN Ibn 2006jc (e.g., Foley et al., 2007; Pastorello et al., 2008a). However, SN 2006jc was discovered post-peak and evolved more slowly than SN 2015U: the earliest extant spectrum of SN 2006jc was taken after the event had faded mag from peak and the spectrum had already transitioned into a nearly nebular phase, though a blue pseudocontinuum was apparent owing to ongoing interaction with the CSM (Foley et al., 2007). At later times, a second red continuum arose in SN 2006jc and the emission features became progressively more asymmetric and blueshifted, evidence for dust formation with the SN system. Increased absorption in the optical passbands by this dust, with re-emission in the infrared, provided an explanation for the rapid increase in the optical decline rate observed for SN 2006jc after 50 days (Mattila et al., 2008; Smith et al., 2008; Pastorello et al., 2008a).
In contrast, SN 2015U presented a spectrum dominated by a single blue continuum through our last epoch of spectroscopy, also taken after the event had faded mag from peak. The and colour curves of SN 2015U smoothly trend redward from a few days before (optical) maximum brightness to 2 mag out onto the rapidly fading tail (at which point the SN fades below our detection threshold) — see Figure 11. The accelerating decline rate observed in the SN 2015U light curves does not appear to be due to dust formation: one would expect a redward knee in the colour curves if it were. On the contrary, there is some evidence that the curve of SN 2015U was beginning to flatten in our last few epochs, though note that -band data become sparse.
We also show the light curve of the peculiar and rapidly fading SN Ibn LSQ13ccw in Figure 12 (Pastorello et al., 2015b). LSQ13ccw rose to peak extremely quickly ( d) and then faded rapidly for 10 days, similar to SN 2015U’s behaviour. However, it thereafter slowed in its decline, and the spectra of LSQ13ccw (not shown) exhibited both broad and narrow features (as do many, but not all, SNe Ibn). The knee in the light curve of LSQ13ccw is plausibly interpreted as evidence for ongoing energy injection from ejecta/CSM interaction in the system — no such knee is observed in the light curve of SN 2015U, which instead appears to be consistent with a single shock-breakout/diffusion event.
The early-time spectrum of SN 2015U is similar to the very early spectra of the Type IIn SN 1998S and the transitional Type IIn/Ibn SN 2010al, excepting the absence of hydrogen (though see §3.2.2 for a discussion of the tentative H feature in SN 2015U). All three events show a smooth, blue, and (approximately) blackbody continuum. The implied CSM velocity of SN 2015U is higher than in SN 1998S and SN 2010al, and SN 2015U shows strong He I lines while the other two events exhibit stronger He II. The N III/C III complex near 4500 Å is clearly detected in all three events — this feature dominates at very early times and disappears by peak (though that evolution took place over different timescales for these SNe).
Despite the spectral similarities, these three SNe displayed diverse light-curve behaviour. SN 1998S had a SN IIL-like light curve with a long-lasting tail (e.g., Fassia et al., 2000), while the evolution of SN 2010al was more similar to that of SN 2015U though less rapid (Pastorello et al., 2015a, 2016). The colour curve of SN 2015U (as shown in Figure 12) is also notably similar to that of SN 2010al, with a slow trend toward redder colours for most of the SN’s evolution and then either leveling off or perhaps even becoming more blue again beyond +10 d and +20 d for SNe 2015U and 2010al, respectively (Pastorello et al., 2015a, see their Figure 4).
The -day timescale for SN 2015U’s evolution and the increasing decline rate are reminiscent of the light curves expected for low-56Ni explosions in helium-dominated or oxygen-dominated envelopes — see, for example, the models of Dessart et al. (2011) and Kleiser & Kasen (2014). In these models, the recombination of helium or oxygen produces a dramatic and rapid drop in opacity within the ejecta and an inward-moving recombination front. SN 2015U was much more luminous than the objects in these models, but perhaps it was an analogous event wherein a recombination wave in the extended CSM produced a rapid fade from maximum luminosity as the CSM cooled after shock breakout. Similar situations have been observed in hydrogen-rich SNe: there exists a subclass of SNe IIn that shows light curves with a plateau likely produced via hydrogen recombination within their extended CSM (SNe 1994W, 2009kn, and 2011ht; e.g., Chugai et al., 2004; Kankare et al., 2012; Mauerhan et al., 2013).
The narrow P-Cygni profiles and strong continuua of SN 2015U’s spectra are clear indications of dense CSM. The diversity of ways in which such CSM can affect the light curves of SNe has been explored in detail by several authors motivated by observations of SNe IIn/Ibn, superluminous SNe, and rapidly fading SNe (e.g., Ofek et al., 2010; Chevalier & Irwin, 2011; Kleiser & Kasen, 2014), and comparisons of SN 2015U’s light curve to these models implies that SN 2015U was a shock-breakout event. The high luminosity indicates that shock breakout occurred at a large radius and that a significant fraction of the SN’s kinetic energy was converted into light, while the lack of a long-lasting light-curve tail shows that the CSM surrounding SN 2015U was more shell-like than wind-like (there is no interaction-powered tail) and that relatively little 56Ni was produced (there is no radioactively powered tail).
The rapidly fading light curves of SNe 2002bj and 2010X are remarkably similar to those of SN 2015U, and we argue that their spectral differences do not exclude the possibility that these three events were fundamentally quite similar. By varying the radius of a putative opaque CSM shell in a simple model, we can understand events spanning a range of luminosities and timespans for which the opaque CSM reprocesses the SN flux. Under the assumption that their light curves are all shock cooling curves without significant contribution from radioactive nickel, the peak luminosities and timescales of these three SNe should be governed roughly by
following Kleiser & Kasen (2014), adapted from Kasen & Woosley (2009) for hydrogen-free SNe and based on the analytic framework of Popov (1993). is the energy of the SN explosion, is the mass ejected, and is the effective radius (in this case, the radius reached by a significant amount of mass ejected prior to the final explosion).
In particular, consider the peak-luminosity equation, assuming these explosions are similar in all their properties except for the effective pre-SN radius , which would be determined by the time before explosion and the speed at which any pre-SN material was ejected. Inverting the equation, the pre-SN effective radius . If we assume that the ejecta velocities of all three objects are similar, this means that the ejecta from the SN itself will pass through the surrounding CSM in a time , and the length of time after explosion we expect to see narrow lines from this interaction is proportional to . Comparing the relative peak luminosities, we find that, since SN 2015U exhibited narrow lines at least up to days after explosion, SN 2002bj should have shown narrow lines at least until days after explosion and the even dimmer SN 2010X would have shown narrow lines at least until days. These times are well before the first spectra were taken of either SN 2002bj or SN 2010X. Typically, we expect that to discover narrow lines in these rapidly fading SNe, we will either need to look at the brightest among them or catch them very early. The luminosity (and timescale) may also depend on the explosion energies, ejected masses, and other properties of the SN, but these must be disentangled with more sophisticated numerical approaches.
3.5 Temperature and Luminosity Evolution
The extreme and uncertain degree of host-galaxy dust reddening toward SN 2015U makes estimating bolometric properties quite difficult. In §3.1 we assume that the emission from SN 2015U is roughly blackbody in spectral shape; here we further discuss this assumption. It has long been known that the continua of young SNe II exhibit “diluted blackbody” spectral energy distributions (SEDs), which (at optical wavelengths) are similar to the Planck function at a lower temperature (e.g., Hershkowitz et al., 1986; Eastman et al., 1996). Though SN 2015U is certainly not a SN II, it is continuum-dominated, and in the sections above we present evidence that SN 2015U was shrouded in an optically thick CSM. In addition, Moriya et al. (2011) show that modeled shock breakouts from the hydrogen-dominated CSM around red supergiants exhibit roughly blackbody SEDs. Rabinak & Waxman (2011) explore shock breakouts from He or He/CO stellar envelopes in detail; for He-dominated stellar envelopes, they show that the colour temperature of the system deviates from the photosphere’s temperature by a (time-dependent) factor of only %, largely owing to diffusion effects as a helium recombination wave moves through the material.
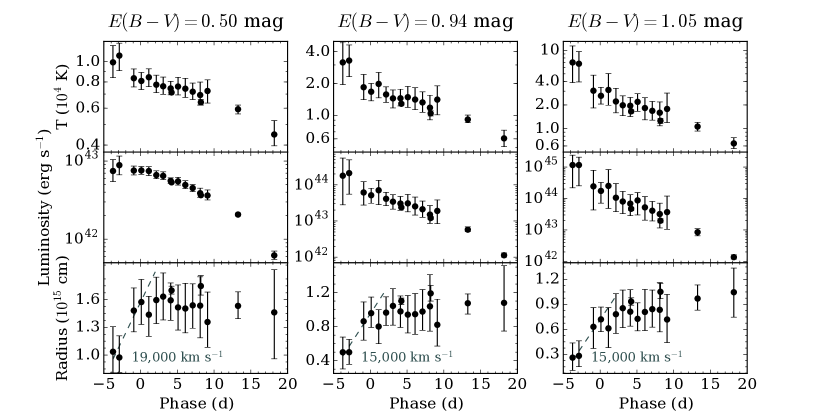
Given the above discussion, we assume that SN 2015U’s emission was roughly blackbody and we estimate the bolometric properties by fitting a dust-reddened Planck spectrum to our multiband photometry. Using our almost nightly observations of SN 2015U in the BVRI passbands, we assembled the observed optical SEDs from d to +20 d and find the best-fit blackbody temperature, radius, and luminosity using MCMC maximum-likelihood methods. As described in §3.1, there are large uncertainties in the properties of the host galaxy’s dust, and these uncertainties produce similarly large uncertainties in the absolute value of the temperature at any given time. In addition, our optical photometry largely probes the Rayleigh-Jeans tail of SN 2015U’s SED, so the implied bolometric corrections are large and uncertain. Our MCMC-produced error bars include these effects, and our photometric data do indicate significant temperature evolution (assuming and do not change). Because our data constrain the evolution of SN 2015U more strongly than they constrain the absolute values of any given parameter, it is useful to consider the implications for a few assumed values of .
Figure 14 shows the blackbody temperature, bolometric luminosity, and radius evolution of SN 2015U for three different assumed values of , adopting . In all cases, the best-fit temperature decreases over time, with the temperature falling rapidly before (optical) peak and then decreasing slowly thereafter. The effective blackbody radius increases with a photospheric velocity of km s-1 until peak, leveling off thereafter. Though this value of is similar to the characteristic velocities of ejecta in stripped-envelope SNe, our spectra do not show any material moving that quickly and, given our interpretation of SN 2015U as a cooling shock-breakout event, we expect the photospheric radius to be approximately constant throughout these observations. In addition, Figure 14 may surprise the reader by indicating that the peak bolometric luminosity occurred several days before the optical peak. Though the bolometric corrections are at their largest and most uncertain at early times, and we unfortunately do not know of any observations constraining the ultraviolet emission of SN 2015U, similar behaviour was observed from SN Ibn 2010al with ultraviolet to near-infrared wavelength coverage (Pastorello et al., 2015a).
In addition, we can constrain the temperature evolution of SN 2015U independently of the continuum shape through the relative line strengths of detected emission lines in our spectra. Though detailed modeling is beyond the scope of this paper, the pre-maximum detection and rapid fading of the N III/C III/He II 4500 Å complex in our spectra of SN 2015U brings to mind the spectral evolution of SN 1998S (see Figure 13). Detailed CMFGEN models of SN 1998S while the 4500 Å feature was strong were presented by Shivvers et al. (2015), indicating a temperature of 30,000 K throughout most of the line-forming region. The agreement between this value and the pre-maximum temperatures found for SN 2015U assuming mag are heartening.
In Table 4 we present the integrated energy released and various values at -band peak for three assumed values of . Our uncertainty about the host galaxy’s dust properties is the dominant source of error in this analysis, and the spread over these three values of indicates the range. All values are estimated through simple polynomial fits to the curves shown in Figure 14. To calculate , we integrated from day to day +20 (the timespan of our almost nightly multiband photometric coverage), and for the other parameters we list the value at -band peak. Note that the bolometric luminosity peaks before the optical maximum; again, see Figure 14.
| (mag) | (erg s-1) | (erg) | (K) | (cm) |
|---|---|---|---|---|
| 0.5 | 8400 | |||
| 0.94 | 19,000 | |||
| 1.05 | 30,000 |
Bolometric luminosity, radiated energy, blackbody temperature, and blackbody radius for the three assumed values of shown in Figure 14.
3.6 Nickel Content
A slowly declining light-curve tail, powered either via CSM interaction or 56Ni decay, has been detected in some SNe Ibn, but many members of this subclass (including SN 2015U) do not show one (e.g., Foley et al., 2007; Gorbikov et al., 2014; Pastorello et al., 2016). For most SNe I, Arnett’s law can be used to estimate the total 56Ni synthesized by the explosion (Arnett, 1982) based upon observed properties near the time of peak luminosity; however, that approach is not applicable for shock-breakout events. If the opacity of the ejecta is well understood, the luminosity at late times can be used instead. For example, Hamuy (2003) analyzed Type IIP supernovae and, given a luminosity at time and an explosion time , estimated the 56Ni mass to be
This equation assumes that -rays produced via radioactive decay are fully trapped and thermalized by the ejecta, an assumption which (though reasonable for SNe IIP) has been shown not to be true for most stripped-envelope SNe (which fade faster than expected for complete trapping; e.g., Wheeler et al., 2015).
The extreme CSM surrounding SN 2015U further complicates the issue, as it may be contributing luminosity via ongoing interaction at late times and perhaps even trapping a higher fraction of the -rays than is normal for CSM-free SNe Ib/c. Though a robust measure of the amount of nickel created by SN 2015U would require more sophisticated treatment, we place a rough upper limit on the value by assuming that the ejecta+CSM system of SN 2015U completely traps any radioactively produced -rays and that there is no luminosity contribution from ongoing interaction beyond our last detection at days.
Our most constraining observation of a putative radioactively powered tail is a nondetection in the band at +36 d. Our last multiband photometric measurement of the temperature yields K at +18 d (see §3.5). We adopt that temperature to calculate the blackbody luminosity for a source at our nondetection threshold, but we note that the temperature is still changing at this time, possibly affecting our results. This calculation yields an upper limit of M⊙ — quite low for SNe I ( M⊙, M⊙; Contardo et al., 2000; Drout et al., 2011), but within the range of values observed for SNe II (–0.26 M⊙; Hamuy, 2003).
3.7 Progenitor Mass-Loss Rate
We adopt the simple shock-wind interaction model of Chevalier & Irwin (2011) to estimate the properties of the CSM surrounding SN 2015U. We assume that the CSM is spherically symmetric and follows a wind-like density profile (), and we use the opacity of helium-dominated material in our calculations ( cm2 g-1). Margutti et al. (2014) solve the Chevalier & Irwin (2011) model in terms of three observables: break-out radius (the radius at which radiation diffuses forward ahead of the shock), total radiated energy , and light-curve rise time . We use days and, assuming mag, we adopt erg from Table 4. For we take the first measured blackbody radius from Figure 14: cm. The resultant mass-loss estimate is very large, M⊙ yr-1. However, in this model , and there is reason to believe that our measurement of the blackbody radius before peak brightness does not reflect the true (see §3.5). If we instead use cm, the blackbody radius at -band peak, we calculate M⊙ yr-1.
Both of these values are several orders of magnitude above the most extreme mass-loss rates produced by steady winds from stars, but they are not far from the time-averaged eruptive mass-loss rates from LBVs (which may well exhibit much higher instantaneous mass-loss rates; Smith, 2014). Observations of iPTF13beo, a recent SN Ibn discovered by the intermediate Palomar Transient Factory (iPTF), implied an even higher (but short-lived) mass-loss rate of M⊙ yr-1 immediately before the progenitor underwent core collapse (estimated via similar methods; Gorbikov et al., 2014).
If the CSM around SN 2015U was launched from the surface explosively rather than through a steady wind, the assumption that is suspect. In fact, the lack of an interaction-powered tail in the light curve of SN 2015U indicates that the density profile cannot be wind-like: Chevalier & Irwin (2011) show that ongoing interaction with a wind-like CSM powers a tail with , and SN 2015U fades more rapidly than that throughout its post-peak evolution. The lack of any high-velocity features in our spectra argues that this outer CSM must be optically thick at least out to the radius of the shock at the time of our last spectrum. Assuming km s-1, the velocity of the fastest material in unshrouded stripped-envelope SNe, this produces an estimate for the CSM extent of cm. Adopting the average He I velocity measured from our spectra (745 km s-1), material at that radius was launched 1–2 yr before core collapse. However, it is likely that the SN ejecta are slowed by its collision with the CSM, and so it may be more physically relevant to assume the CSM extent to be cm (the blackbody radius at -band peak); material at that radius was launched yr before collapse.
It is not clear whether the extreme mass loss from SN 2015U’s progenitor was episodic and brief or sustained over a year or more, nor is it known whether the assumption of spherical symmetry is appropriate. We leave a more thorough examination of these questions to future work.
3.8 Constraints on Progenitor Variability
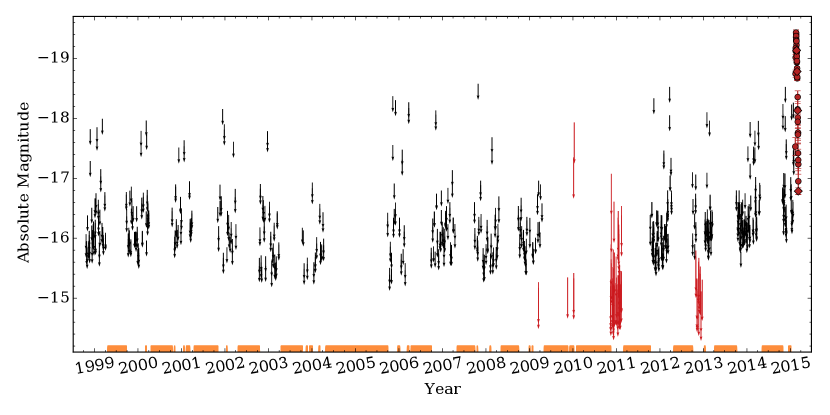
The presence of dense CSM suggests a recent history of extreme mass loss and perhaps variability of the progenitor star. SN Ibn 2006jc, for example, underwent a bright outburst ( mag) about 2 yr before becoming a genuine SN (Nakano et al., 2006; Foley et al., 2007; Pastorello et al., 2007), and there are multiple cases where SN IIn progenitors have been detected in outburst in the years prior to core collapse (e.g., Ofek et al., 2014), though such outbursts do not appear to be ubiquitous (e.g., Bilinski et al., 2015). KAIT has been monitoring NGC 2388 for almost 20 yr and we searched this extensive dataset for evidence of pre-explosion variability. We augment our unfiltered KAIT data with the publicly available PTF/iPTF images of the field in the passband.151515http://irsa.ipac.caltech.edu/applications/ptf/
Examining 758 images with observed upper limits fainter than 17.0 mag from 1998 Oct. through 2015 Feb. 10, we find no evidence for previous outbursts of the progenitor based upon difference imaging (using one of our deepest single exposures as a template). We stacked our images into rolling-window time bins 20 d wide and subtracted templates to search for evidence of previous outbursts of that timescale, but found none. We also stacked all images together and searched for evidence of a progenitor, but found none. (Note that we stacked the KAIT and PTF/iPTF images separately, and we did not perform difference imaging on these very deep stacks, as we had no templates with which to compare.) Figure 15 plots our 1 single-image nondetections and the observed light curve of SN 2015U.
Though we have regular imaging of NGC 2388 most years since 1998, the field was inaccessible to our telescopes for several months every year, so there are significant gaps, especially compared to the timescale of SN 2015U’s light curve ( d). The orange bars along the bottom of Figure 15 mark every night at which more than 20 days had passed since the previous upper limit, indicating timespans when a previous SN 2015U-like event could have occurred undetected.
Unfortunately, even the epochs that were covered by our monitoring campaigns do not yield stringent constraints on the luminosity of a previous outburst, partially owing to the estimated mag of host-galaxy dust extinction along the line of sight toward SN 2015U. The detected outburst of SN 2006jc’s precursor reached a peak of mag (Pastorello et al., 2007), and such an outburst in SN 2015U’s precursor would have probably remained undetected by our monitoring campaign.
4 Conclusion
In this paper we presented observations of SN 2015U, a highly extinguished, low-velocity, rapidly evolving, luminous, apparently hydrogen-free SN which exploded in the strongly star-forming galaxy NGC 2388. Though detailed modeling has yet to be performed, and the degree of host-galaxy dust interference is uncertain, our data indicate that SN 2015U was a core-collapse SN with a peak powered by shock breakout from a dense CSM rather than radioactive decay. We suggest that this CSM was not wind-like but was instead created by at least one extreme episode of mass loss (–1.2 M⊙ yr-1) within a few years of core collapse. The CSM that surrounded SN 2015U was effectively hydrogen-free but was helium-rich; we also detect features from nitrogen, iron, and probably carbon in our spectra. No long-lasting light-curve tail was observed from radioactivity or from ongoing CSM interaction, implying that SN 2015U produced a relatively small amount of 56Ni compared to normal SNe Ib/c.
SN 2015U is a remarkably well-observed SN Ibn, especially among the rapidly fading subset of these events, and we find many similarities between it and other SNe in the literature. Modern surveys indicate the existence of a class of blue, continuum-dominated, hydrogen-deficient, luminous, and rapidly evolving SNe including those found by Drout et al. (2014) and Arcavi et al. (2016); our analysis of SN 2015U implies fundamental similarities between these events, a subset of the SNe Ibn (e.g., Pastorello et al., 2016), and other rapidly fading SNe of lower luminosity (i.e., SN 2002bj and SN 2010X). While the exact progenitors of these events are quite uncertain, it is clear that they demand extreme mass-loss rates from their stripped-envelope progenitor stars.
Acknowledgements
The authors thank M. Drout, R. Foley, P. Nugent, D. Kasen, E. Quataert, D. Poznanski, and O. Fox for useful comments and discussions. We are grateful to our referee, A. Pastorello, for comments that have greatly improved this effort. We thank the HST, Keck Observatory, and Lick Observatory staffs for their expert assistance with the observations. We also acknowledge the following Nickel 1 m observers and KAIT checkers for their valuable assistance with this work: A. Bigley, C. Gould, G. Halevi, K. Hayakawa, A. Hughes, H.J. Kim, M. Kim, P. Lu, K. Pina, T. Ross, S. Stegman, and H. Yuk.
A.V.F.’s supernova research group at U. C. Berkeley is supported by NSF grant AST-1211916, the TABASGO Foundation, Gary and Cynthia Bengier, and the Christopher R. Redlich Fund. Additional assistance is provided by NASA/HST grants AR-14295 and GO-14149 from the Space Telescope Science Institute, which is operated by the Association of Universities for Research in Astronomy, Inc., under NASA contract NAS5-26555. J.M.S. is supported by an NSF Astronomy and Astrophysics Postdoctoral Fellowship under award AST-1302771.
Some of the data presented herein were obtained at the W. M. Keck Observatory, which is operated as a scientific partnership among the California Institute of Technology, the University of California, and NASA; the observatory was made possible by the generous financial support of the W. M. Keck Foundation.
KAIT and its ongoing operation were supported by donations from Sun Microsystems, Inc., the Hewlett-Packard Company, AutoScope Corporation, Lick Observatory, the NSF, the University of California, the Sylvia and Jim Katzman Foundation, and the TABASGO Foundation. Research at Lick Observatory is partially supported by a very generous gift from Google, as well as by contributions from numerous individuals including Eliza Brown and Hal Candee, Kathy Burck and Gilbert Montoya, David and Linda Cornfield, William and Phyllis Draper, Luke Ellis and Laura Sawczuk, Alan and Gladys Hoefer, DuBose and Nancy Montgomery, Jeanne and Sanford Robertson, Stanley and Miriam Schiffman, Thomas and Alison Schneider, the Hugh Stuart Center Charitable Trust, Mary-Lou Smulders and Nicholas Hodson, Clark and Sharon Winslow, Weldon and Ruth Wood, and many others.
This research was based in part on data taken with the NASA/ESA Hubble Space Telescope, and obtained from the Hubble Legacy Archive, which is a collaboration between the Space Telescope Science Institute (STScI/NASA), the Space Telescope European Coordinating Facility (ST-ECF/ESA), and the Canadian Astronomy Data Centre (CADC/NRC/CSA). We also made use of the NASA/IPAC Extragalactic Database (NED) which is operated by the Jet Propulsion Laboratory, California Institute of Technology, under contract with NASA.
References
- Anderson et al. (2014) Anderson J. P., et al., 2014, ApJ, 786, 67
- Anupama et al. (2001) Anupama G. C., Sivarani T., Pandey G., 2001, A&A, 367, 506
- Arcavi et al. (2012) Arcavi I., et al., 2012, ApJ, 756, L30
- Arcavi et al. (2016) Arcavi I., et al., 2016, ApJ, 819, 35
- Arnett (1982) Arnett W. D., 1982, ApJ, 253, 785
- Auer & van Blerkom (1972) Auer L. H., van Blerkom D., 1972, ApJ, 178, 175
- Baron et al. (2015) Baron D., Poznanski D., Watson D., Yao Y., Prochaska J. X., 2015, MNRAS, 447, 545
- Bianco et al. (2014) Bianco F. B., et al., 2014, ApJS, 213, 19
- Bilinski et al. (2015) Bilinski C., Smith N., Li W., Williams G. G., Zheng W., Filippenko A. V., 2015, MNRAS, 450, 246
- Brocklehurst (1971) Brocklehurst M., 1971, MNRAS, 153, 471
- Cardelli et al. (1989) Cardelli J. A., Clayton G. C., Mathis J. S., 1989, ApJ, 345, 245
- Chevalier & Irwin (2011) Chevalier R. A., Irwin C. M., 2011, ApJ, 729, L6
- Choi et al. (2016) Choi J., Dotter A., Conroy C., Cantiello M., Paxton B., Johnson B. D., 2016, ApJ, 823, 102
- Chugai (2001) Chugai N. N., 2001, MNRAS, 326, 1448
- Chugai et al. (2004) Chugai N. N., et al., 2004, MNRAS, 352, 1213
- Clayton & Mathis (1988) Clayton G. C., Mathis J. S., 1988, ApJ, 327, 911
- Contardo et al. (2000) Contardo G., Leibundgut B., Vacca W. D., 2000, A&A, 359, 876
- Coyne & Gehrels (1966) Coyne G. V., Gehrels T., 1966, AJ, 71, 355
- Dessart et al. (2011) Dessart L., Hillier D. J., Livne E., Yoon S.-C., Woosley S., Waldman R., Langer N., 2011, MNRAS, 414, 2985
- Dessart et al. (2015) Dessart L., Hillier D. J., Woosley S., Livne E., Waldman R., Yoon S.-C., Langer N., 2015, MNRAS, 453, 2189
- Drout et al. (2011) Drout M. R., et al., 2011, ApJ, 741, 97
- Drout et al. (2013) Drout M. R., et al., 2013, ApJ, 774, 58
- Drout et al. (2014) Drout M. R., et al., 2014, ApJ, 794, 23
- Eastman et al. (1996) Eastman R. G., Schmidt B. P., Kirshner R., 1996, ApJ, 466, 911
- Faber et al. (2003) Faber S. M., et al., 2003, in Iye M., Moorwood A. F. M., eds, Society of Photo-Optical Instrumentation Engineers (SPIE) Conference Series Vol. 4841, Instrument Design and Performance for Optical/Infrared Ground-based Telescopes. pp 1657–1669, doi:10.1117/12.460346
- Fassia et al. (2000) Fassia A., et al., 2000, MNRAS, 318, 1093
- Fassia et al. (2001) Fassia A., et al., 2001, MNRAS, 325, 907
- Filippenko (1982) Filippenko A. V., 1982, PASP, 94, 715
- Filippenko (1991) Filippenko A. V., 1991, in Danziger I. J., Kjaer K., eds, European Southern Observatory Conference and Workshop Proceedings Vol. 37, European Southern Observatory Conference and Workshop Proceedings. p. 343
- Filippenko (1997) Filippenko A. V., 1997, ARA&A, 35, 309
- Filippenko et al. (2001) Filippenko A. V., Li W. D., Treffers R. R., Modjaz M., 2001, in Paczynski B., Chen W.-P., Lemme C., eds, Astronomical Society of the Pacific Conference Series Vol. 246, IAU Colloq. 183: Small Telescope Astronomy on Global Scales. p. 121
- Foley et al. (2007) Foley R. J., Smith N., Ganeshalingam M., Li W., Chornock R., Filippenko A. V., 2007, ApJ, 657, L105
- Fransson et al. (2014) Fransson C., et al., 2014, ApJ, 797, 118
- Friedman et al. (2011) Friedman S. D., et al., 2011, ApJ, 727, 33
- Gal-Yam (2012) Gal-Yam A., 2012, Science, 337, 927
- Gal-Yam et al. (2014) Gal-Yam A., et al., 2014, Nature, 509, 471
- Ganeshalingam et al. (2010) Ganeshalingam M., et al., 2010, ApJS, 190, 418
- Gehrels & Silvester (1965) Gehrels T., Silvester A. B., 1965, AJ, 70, 579
- Gorbikov et al. (2014) Gorbikov E., et al., 2014, MNRAS, 443, 671
- Hamuy (2003) Hamuy M., 2003, ApJ, 582, 905
- Herbig (1995) Herbig G. H., 1995, ARA&A, 33, 19
- Hershkowitz et al. (1986) Hershkowitz S., Linder E., Wagoner R. V., 1986, ApJ, 301, 220
- Hillier (1991) Hillier D. J., 1991, A&A, 247, 455
- Kankare et al. (2012) Kankare E., et al., 2012, MNRAS, 424, 855
- Kasen & Woosley (2009) Kasen D., Woosley S. E., 2009, ApJ, 703, 2205
- Kasliwal et al. (2010) Kasliwal M. M., et al., 2010, ApJ, 723, L98
- Khazov et al. (2016) Khazov D., et al., 2016, ApJ, 818, 3
- Kleiser & Kasen (2014) Kleiser I. K. W., Kasen D., 2014, MNRAS, 438, 318
- Kumar et al. (2015) Kumar S., Yuk H., Zheng W., Filippenko A. V., 2015, Central Bureau Electronic Telegrams, 4164, 1
- Lan et al. (2015) Lan T.-W., Ménard B., Zhu G., 2015, MNRAS, 452, 3629
- Leonard et al. (2000) Leonard D. C., Filippenko A. V., Barth A. J., Matheson T., 2000, ApJ, 536, 239
- Li et al. (2003) Li W., Filippenko A. V., Chornock R., Jha S., 2003, PASP, 115, 844
- Liu et al. (2015) Liu Y.-Q., Modjaz M., Bianco F. B., Graur O., 2015, preprint, (arXiv:1510.08049)
- Margutti et al. (2014) Margutti R., et al., 2014, ApJ, 780, 21
- Matheson (2001) Matheson T., 2001, PASP, 113, 1155
- Matheson et al. (2000) Matheson T., et al., 2000, AJ, 120, 1487
- Matheson et al. (2001) Matheson T., Filippenko A. V., Li W., Leonard D. C., Shields J. C., 2001, AJ, 121, 1648
- Mattila et al. (2008) Mattila S., et al., 2008, MNRAS, 389, 141
- Mauerhan et al. (2013) Mauerhan J. C., et al., 2013, MNRAS, 431, 2599
- Mauerhan et al. (2015) Mauerhan J. C., et al., 2015, MNRAS, 453, 4467
- Milisavljevic et al. (2015) Milisavljevic D., et al., 2015, ApJ, 815, 120
- Miller & Stone (1993) Miller J., Stone R., 1993, Lick Observatory Techical Reports, 66
- Modjaz et al. (2014) Modjaz M., et al., 2014, AJ, 147, 99
- Moriya et al. (2011) Moriya T., Tominaga N., Blinnikov S. I., Baklanov P. V., Sorokina E. I., 2011, MNRAS, 415, 199
- Nachman & Hobbs (1973) Nachman P., Hobbs L. M., 1973, ApJ, 182, 481
- Nakano et al. (2006) Nakano S., Itagaki K., Puckett T., Gorelli R., 2006, Central Bureau Electronic Telegrams, 666, 1
- Ochner et al. (2015) Ochner P., et al., 2015, The Astronomer’s Telegram, 7105, 1
- Ofek et al. (2010) Ofek E. O., et al., 2010, ApJ, 724, 1396
- Ofek et al. (2014) Ofek E. O., et al., 2014, ApJ, 789, 104
- Pastorello et al. (2007) Pastorello A., et al., 2007, Nature, 447, 829
- Pastorello et al. (2008a) Pastorello A., et al., 2008a, MNRAS, 389, 113
- Pastorello et al. (2008b) Pastorello A., et al., 2008b, MNRAS, 389, 131
- Pastorello et al. (2015a) Pastorello A., et al., 2015a, MNRAS, 449, 1921
- Pastorello et al. (2015b) Pastorello A., et al., 2015b, MNRAS, 449, 1954
- Pastorello et al. (2015c) Pastorello A., et al., 2015c, MNRAS, 454, 4293
- Pastorello et al. (2016) Pastorello A., et al., 2016, MNRAS, 456, 853
- Patat et al. (2007) Patat F., et al., 2007, Science, 317, 924
- Patat et al. (2015) Patat F., et al., 2015, A&A, 577, A53
- Pereira-Santaella et al. (2015) Pereira-Santaella M., et al., 2015, A&A, 577, A78
- Pérez & Granger (2007) Pérez F., Granger B. E., 2007, Computing in Science and Engineering, 9, 21
- Phillips et al. (2013) Phillips M. M., et al., 2013, ApJ, 779, 38
- Popov (1993) Popov D. V., 1993, ApJ, 414, 712
- Poznanski et al. (2010) Poznanski D., et al., 2010, Science, 327, 58
- Poznanski et al. (2012) Poznanski D., Prochaska J. X., Bloom J. S., 2012, MNRAS, 426, 1465
- Rabinak & Waxman (2011) Rabinak I., Waxman E., 2011, ApJ, 728, 63
- Riess et al. (1999) Riess A. G., et al., 1999, AJ, 118, 2675
- Sanders et al. (2015) Sanders N. E., et al., 2015, ApJ, 799, 208
- Schlafly & Finkbeiner (2011) Schlafly E. F., Finkbeiner D. P., 2011, ApJ, 737, 103
- Schlegel (1990) Schlegel E. M., 1990, MNRAS, 244, 269
- Serkowski et al. (1975) Serkowski K., Mathewson D. S., Ford V. L., 1975, ApJ, 196, 261
- Shivvers et al. (2015) Shivvers I., Groh J. H., Mauerhan J. C., Fox O. D., Leonard D. C., Filippenko A. V., 2015, ApJ, 806, 213
- Silverman et al. (2010) Silverman J. M., Kleiser I. K. W., Morton A. J. L., Filippenko A. V., 2010, Central Bureau Electronic Telegrams, 2223
- Silverman et al. (2012) Silverman J. M., et al., 2012, MNRAS, 425, 1789
- Silverman et al. (2013a) Silverman J. M., et al., 2013a, ApJS, 207, 3
- Silverman et al. (2013b) Silverman J. M., et al., 2013b, ApJ, 772, 125
- Smith (2014) Smith N., 2014, ARA&A, 52, 487
- Smith et al. (2008) Smith N., Foley R. J., Filippenko A. V., 2008, ApJ, 680, 568
- Somerville (1988) Somerville W. B., 1988, The Observatory, 108, 44
- Stetson (1987) Stetson P. B., 1987, PASP, 99, 191
- Strömgren (1948) Strömgren B., 1948, ApJ, 108, 242
- Tsvetkov et al. (2015) Tsvetkov D. Y., Volkov I. M., Pavlyuk N. N., 2015, Information Bulletin on Variable Stars, 6140, 1
- Wheeler et al. (2015) Wheeler J. C., Johnson V., Clocchiatti A., 2015, MNRAS, 450, 1295
- Whittet et al. (1992) Whittet D. C. B., Martin P. G., Hough J. H., Rouse M. F., Bailey J. A., Axon D. J., 1992, ApJ, 386, 562
- Wright (2006) Wright E. L., 2006, PASP, 118, 1711
- Yaron & Gal-Yam (2012) Yaron O., Gal-Yam A., 2012, PASP, 124, 668
- de Vaucouleurs et al. (1991) de Vaucouleurs G., de Vaucouleurs A., Corwin Jr. H. G., Buta R. J., Paturel G., Fouqué P., 1991, Third Reference Catalogue of Bright Galaxies. Volume I: Explanations and references. Volume II: Data for galaxies between 0h and 12h. Volume III: Data for galaxies between 12h and 24h.