A coronagraphic search for wide sub-stellar companions among members of the Ursa Major moving group††thanks: Based on observations collected at the European Southern Observatory, Chile, in programmes 72.C-0485, 73.C-0225, 76.C-0777, 77.C-0268, 384.C-0245A
Abstract
Context. We present the results of a survey to detect low-mass companions of UMa group members, carried out in 2003-2006 with NACO at the ESO VLT. While many extra-solar planets and planetary candidates have been found in close orbits around stars by the radial velocity and the transit method, direct detections at wider orbits are rare. The Ursa Major (UMa) group, a young stellar association at an age of about 200-600 Myr and an average distance of 25 pc, has not yet been addressed as a whole although its members represent a very interesting sample to search for and characterize sub-stellar companions by direct imaging.
Aims. Our goal was to find or to provide detection limits on wide sub-stellar companions around nearby UMa group members using high-resolution imaging.
Methods. We searched for faint companions around 20 UMa group members within 30 pc. The primaries were placed below a semi-transparent coronagraph, a rather rarely used mode of NACO, to increase the dynamic range of the images. In most cases, second epoch images of companion candidates were taken to check whether they share common proper motion with the primary.
Results. Our coronagraphic images rule out sub-stellar companions around the stars of the sample. A dynamical range of typically 13-15 mag in the band was achieved at separations beyond 3” from the star. Candidates as faint as were securely identified and measured. The survey is most sensitive between separations of 100 and 200 au but only on average because of the very different target distance. Field coverage reaches about 650 au for the most distant targets. Most of the 200 candidates are visible in two epochs. All of those were rejected being distant background objects.
Key Words.:
Stars: binaries: visual – Stars: imaging – Stars: brown dwarfs – Galaxy: open clusters and associations: individual: UMa group – Galaxy: solar neighborhood1 Introduction
By now almost 1,300 brown dwarfs have been found, classified with spectral types L, T, and Y (Kirkpatrick, 2008; Cushing et al., 2011)111See http://www.DwarfArchives.org for a full account.. This number has been surpassed by indirect detections in the planetary regime – by now more than 600 by radial velocity variations and more than 1,200 by the transit method.222See http://www.exoplanet.eu for further details and updates.
While indirect methods are most sensitive to objects in very close orbits around the targets, direct imaging detects objects in wider orbits and thus is complementary. Ideally, direct imaging is combined with simultaneous measurement of the radial velocity variation (Guenther et al., 2005). Young sub-stellar objects still contract and are self-luminous (Burrows et al., 1997) so that their direct detection is less difficult up to ages of a few hundred Myr (Malkov et al., 1998; Neuhäuser & Schmidt, 2012). In contrast to high-resolution imaging in space (e.g. Marengo et al., 2006), ground-based observations need to encompass the seeing which can be done with adaptive optics (e.g. Neuhäuser et al., 2003; Duchêne et al., 2007). Coronagraphy with intransparent (e.g. McCarthy & Zuckerman, 2004, Chauvin et al., 2005) or semi-transparent coronagraphs (e.g. Biller et al., 2010; Boccaletti et al., 2013, Guenther et al., 2005; Itoh et al., 2006, 2008a; Neuhäuser et al., 2007, Wahhaj et al., 2011) shade the bright star so that the exposure time and thus the sensitivity of the images can be increased. A number of very sophisticated techniques have been developed recently (see the review by Fischer et al., 2014).
The frequency of low-mass companions to stars gives important clues regarding our understanding of the formation of brown dwarfs and planets (Ida & Lin, 2004; Alibert et al., 2005; Broeg, 2007). At wide orbits, where direct imaging surveys are sensitive, the frequency of brown dwarfs is of the order of several percent for host stars with spectral types A-M and is less constrained for giant planets (Rameau et al., 2013; Bowler et al., 2015). In young nearby associations Neuhäuser & Guenther (2004) measure a frequency of of sub-stellar companions which is not very different from the value of obtained for isolated late-type stars (McCarthy & Zuckerman, 2004). The frequency of brown dwarfs around Hyades members does not turn out very different from the latter (Guenther et al., 2005; Bouvier et al., 2008, Lodieu et al., 2014) although the Hyades are still young with an age of 600 Myr. In the younger Pleiades (125 Myr), Yamamoto et al. (2013) confirmed two brown dwarf companions in a sample of 20 stars.
Young moving groups of an age intermediate between the Pleiades and the Hyades offer interesting opportunities to study homogeneous samples of common age and origin. No sub-stellar companions have been found in the Her-Lyr assiociation (Eisenbeiss et al., 2007, Biller et al., 2013) which has an age of 250 Myr, similar to the UMa group (Eisenbeiss et al., 2013). Although a systematic survey of the UMa group at high resolution has been missing, low-mass companions have been detected: GJ 569 Ba, Bb (Martín et al., 2000; Zapatero Osorio et al., 2004), HD 130948 B & C, (Potter et al., 2002), and Ori B (König et al., 2002)333It is worth noting that Bannister & Jameson (2007) identified one T dwarf and three L dwarfs in the UMa group using the moving cluster method.. The only known planet around a probable UMa group member, Eri, was found by radial velocity variations (Hatzes et al., 2000; Benedict et al., 2006). Although there are still doubts about its existence (Zechmeister et al., 2013), there are even suspections of a second planet (Quillen & Thorndike, 2002; Deller & Maddison, 2005). The planet(s) of Eri have been subject to many, yet unsuccessful, attempts of direct detection (Itoh et al., 2006; Janson et al., 2007; Marengo et al., 2006; Neuhäuser & Schmidt, 2012, and the present work).

The goal of the present work is to find additional sub-stellar companions in the UMa group by direct imaging. The search for close and faint companions in the UMa group benefits from a relatively young age of 200-600 Myrs 444The Ursa Major (UMa) has been studied extensively under various aspects (e.g. Eggen, 1994; Montes et al., 2001; King et al., 2003; Fuhrmann, 2004; Ammler, 2006) but the precise age and the list of members are still a matter of debate. Age estimates range from 200 to 600 Myrs (König et al., 2002; King et al., 2003; Fuhrmann, 2004; King & Schuler, 2005; Brandt & Huang, 2015). , the small distance of members (50 pc on average; Fig. 1), and thus the availability of precise Hipparcos astrometry (Perryman et al., 1997; van Leeuwen, 2007). Furthermore, the proper motion of UMa group members is high on average (50 mas/yr) because of their proximity (Fig. 1) and their peculiar space motion (Ammler, 2006). Hence, co-moving companions can be identified already after a short epoch difference. Preliminary results of the present study have been published earlier (Ammler-von Eiff et al., 2009).
2 Coronagraphic observations and data reduction
As the definition of the UMa group and the list of members is controversial, we compiled the targets in the following way to get a meaningful number of reliable UMa group members closer than pc and observable with NACO at the ESO VLT:
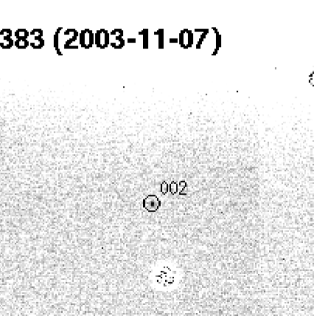
One system, GJ 569 (=HIP 72944), we did not observe since it has been extensively studied before (e.g. Simon et al., 2006). Some objects were excluded because of known bright secondaries in the field of view (HD 24916, HD 29875, HD 98712, and HD 134083). HIP 104383 A is a close binary, too, but fully fits below the coronagraph so that we did observe it (Fig. 10), i.e. 20 targets in total (Tables A and A).
The targets have been observed with NACO, the adaptive optics imager at the Nasmyth platform of the ESO VLT UT4 (Yepun)555NACO consists of the adaptive optics system NAOS (Lenzen et al., 2003) and the camera CONICA (Rousset et al., 2003). The instrument was decommissioned in August 2013 and recommissioned on UT1 in January 2015.. The stars themselves were used as adaptive optics reference stars for the visual wavefront sensor of NAOS (VIS). First epoch images were taken in 2003/2004 (programmes 072.C-0485, 073.C-0225) and second epoch imaging followed in 2005/2006 (programmes 076.C-777, 077.C-0268) for those stars with faint companion candidates identified.
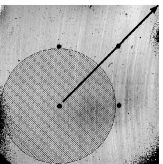
The semi-transparent coronagraph is a rarely used NACO mode. It has a diameter of and dims the incoming stellar light by about 6 magnitudes in the band (see Fig. 1). Hence, it blocks most light of the star but still allows one to do precise astrometry with the stellar point spread function (PSF).


The observations have been obtained in the band (Persson et al., 1998; Tokunaga et al., 2002) further reducing the brightness difference of stars and any low-mass companions. The sensitivity of the observations has been further improved by not using the S13 camera with the smallest pixel scale but instead observing with the S27 camera (27.15 mas/pix, FOV 28”x28”). This way, a larger field is covered (Fig. 1) and more light is collected in a single pixel. The astrometric precision using the S27 camera is sufficient since the average proper motion of the UMa group of 150 mas (Fig. 1) per year corresponds to 5.5 pixels on the detector.
The data reduction follows the usual steps of sky subtraction, flat-field correction, bad pixel correction, shift and add666using own scripts and tools provided by ESO, including ESO-eclipse v5.0.0, the jitter recipe (Devillard, 1997, 2011), and esorex using the recipe naco_img_twflat to derive bad pixel frames.. The sky has been subtracted using jittered exposures of nearby sky positions free of bright stars. The flat-field correction is based on coronagraphic night-time flat-field exposures to correct for the variable transmittance of the coronagraphic substrate and standard day-time exposures to correct for pixel-to-pixel variations of the detector below the coronagraph used. Bad pixel frames have been taken from standard calibrations or derived individually with ESO tools and standard twilight flat-field exposures.
3 Identification and characterisation of candidates
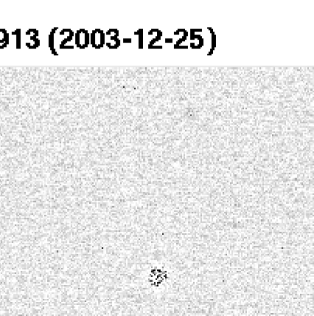
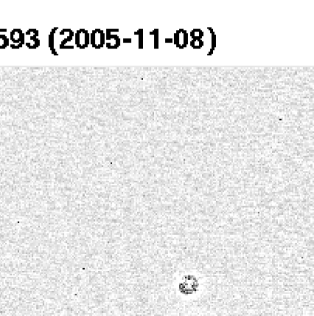
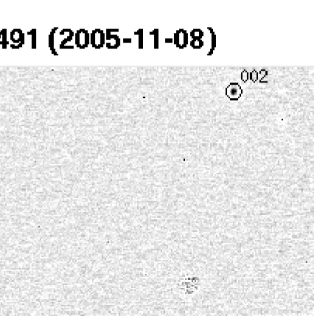
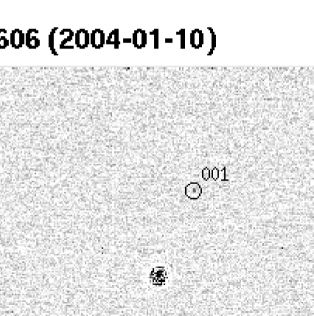
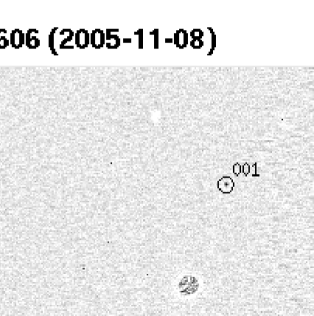
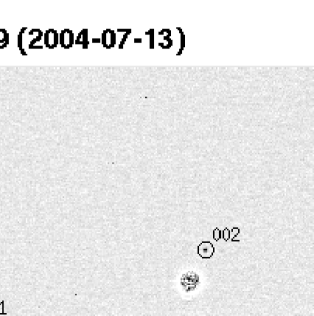
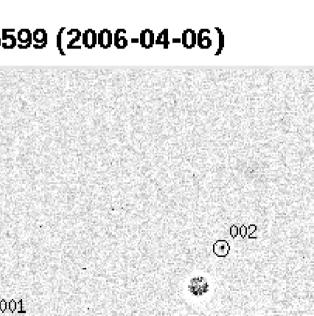
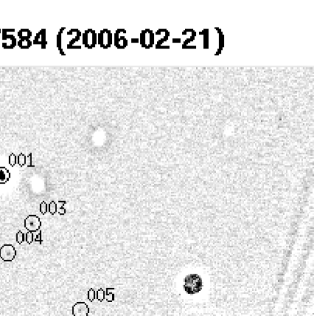
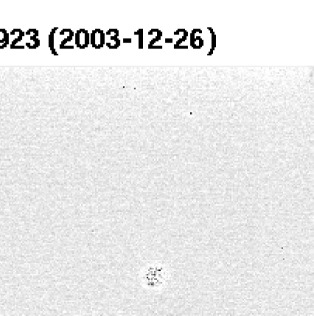
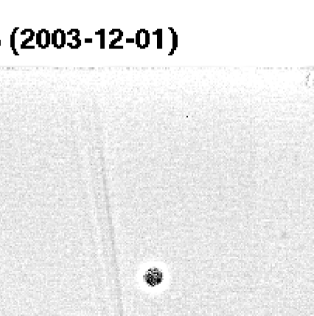
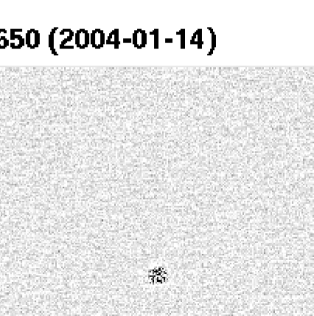
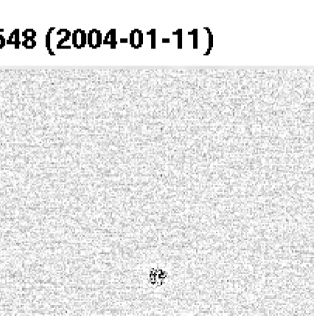
The stellar PSF has been subtracted in a box of 500x500 pixels centred on the star to facilitate the visual identification of faint companion candidates. The PSF has been derived by calculating the average of a set of rotated frames (in steps of 2∘) and using sigma-clipping to get rid of bright features, in particular the diffraction spikes. A smoothed image has been subtracted to further facilitate detection (Figs 5-9)777Smoothing has been done by the application of a Gaussian filter (FILTER/GAUSS in ESO MIDAS version 13SEP; Banse et al., 1983; Warmels, 1992) using all adjacent pixels within a radius of 18 pixels weighted by a Gaussian with a width of pixels..
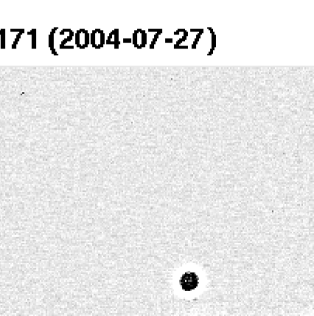
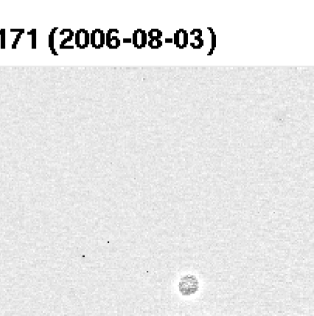
We noticed that artefacts due to dust particles on the coronagraphic substrate can be mistaken for companion candidates. The flat-field correction fails in removing those since occasional displacements of the coronagraphic substrate can occur between calibration and target exposures. We removed those artefacts from the list of companion candidates guided by a visual cross-match of the scientific exposures with the flat-field exposures. In the most extreme cases (exposures of HD 11171 and HD 22049), several tens of artefacts had to be removed.
A wide comoving companion will not change its position relative to the star while a distant and thus non-moving background object will reflect the stellar parallactic and proper motion (Fig. 2). Our assessment of astrometric measurement uncertainties is based on Chauvin et al. (2010) who give a long-term average of the S27 pixel scale of mas/pix and of the detector position angle (true North) of . In the present work, we corrected the position angles of all candidates for the mean deviation of from the true North. From the measurements obtained by Chauvin et al. (2010), we expect uncertainties of 0.016 mas/pix on separation and on position angle. We neglected the errors in fitting Gaussian profiles to measure the positions of the stars and the candidates. It is as precise as a few milliarcseconds and of the order of the Hipparcos errors (Table E).
The instrumental magnitudes of the target stars and the candidates have all been measured in apertures of 13 pixels across which is more than double the typical FWHM of the PSF. Then, the band magnitude of the candidates has been derived from the measured flux ratios taking into account the brightness of the target star (Table A) and the attenuation of the coronagraph. While the brightness of the star has been measured in the reduced frames, the brightness of the candidates has been measured in the PSF-subtracted frames constructed in the way described above.
To calibrate the transmission of the coronagraph, a standard star (HD 1274) was taken during the programme 384.C-0245A, once outside and once below the coronagraph, and reduced in the same way as the exposures of the science targets. The flux values have been integrated within apertures of 19 pixels radius which fits well inside the coronagraph. Relating the measurements inside and outside the coronagraph gives a transmission of % in the band which translates to a dimming of mag. The error bar accounts for uncertainties involved in the aperture photometry but not for other systematics like cross-talk, light-leaks, temporal variation of the PSF, improper/variable placement of the star below the coronagraph, or variable residual absorption by the transparent substrate which carries the coronagraphs. The new measurement gives a dimming weaker by half a magnitude than the value given in the NACO manual (mag). The latter measurement was done in a way similar to the present work but using frames reduced in a different way and using peak counts instead of aperture photometry (ESO, priv. comm.). A conservative estimate of has been adopted in the present work since the discrepancy cannot be explained with the data available.
For each one of the companion candidates, the average magnitude of two epochs has been adopted and the uncertainty is given by half their difference plus the square-added error bar of 0.3 mag of the transmissivity of the coronagraph. For single-epoch images, the transmissivity is the only well-known dominant source of error.
4 Assessment of field coverage and detection limits
We could not take advantage of the full field of view of the NACO mode applied (28”x28”) since the corners are affected by obstructions. Furthermore, the coronagraphs themselves are insensitive patches in the field of view.
The field of view is covered completely between angular separations of (coronagraphic radius) and which correspond to different linear scales depending on the distance of the star. The parallaxes of the sample stars vary from 37 mas (HIP 104383) to 311 mas (HD 22049) so that the field of view covers very different parts of the stellar environments, e.g. the closest view in the case of Eri (=HD 22049; au) and the farthest view for HIP 104383 ( AU) (Table B). The expected widest bound orbit of low-mass companions has been estimated based on the linear law given in Close et al., 2003 given the central mass of the target systems.
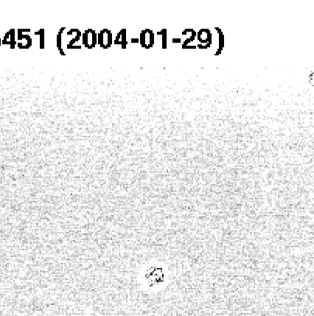
Although the field of view is complete only up to separations of 9”, it samples separations of up to 25” corresponding to as much as 650 au in the case of HD 125451 and HIP 104383. Still the field of view never reaches the widest possible bound orbit in the present sample. We note, however, that inclination is a free parameter in this whole consideration and that measured separations are projected separations. Stars with exoplanets are known for which very wide (up to one third of a parsec) companions with common proper motion have been detected (Mugrauer et al., 2014).
To understand the detection limits in the wings of the PSF, we built noise maps from the reduced and PSF-subtracted images. We measured the standard deviation at each pixel using 7x7 adjacent pixels. This value has been multiplied by the square root of the number of pixels in an aperture of 13 pixels across in order to compare to the photometric flux measurements described above.
Based on the noise analysis, the limiting magnitudes have been derived relative to the magnitude of the primary star in the same way as by Brandeker et al. (2006). We found that a source can be detected at a given location if the flux measured is larger than a detection limit of of the local noise level and adopted the conservative and common value of 10. The limits derived have been corrected for the coronagraphic attenuation of mag inferred above. For each exposure, the right panel of Fig. 2 shows the average value of pixels at same angular distance.
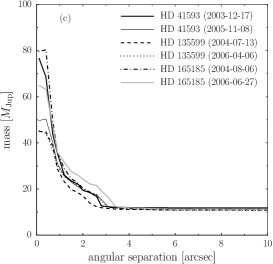
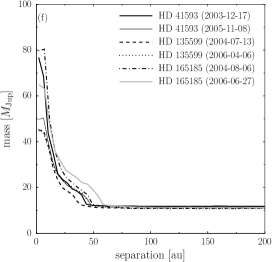
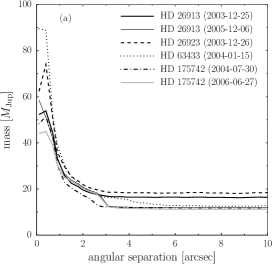
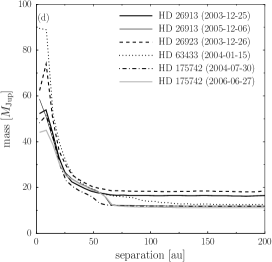
When it comes to the determination of the mass of a companion that is still detectable, uncertain age is the largest contribution to the error budget. Using the stellar band magnitude and the measured dynamic range, we calculated the band magnitude of faint objects which could still have been detected at a given separation. The magnitudes have been interpolated in evolutionary models to obtain a mass estimate. We used the COND03 models (Baraffe et al., 2003) for effective temperatures lower than 1,300 K888According to Baraffe et al. (2003), the COND03 models are more appropriate below 1300 K to predict infrared colours, for methane dwarfs and extrasolar giant planets at large orbital separation. The difference between the and the band has been neglected in the present study. and DUSTY00 (Chabrier et al., 2000) models for temperatures higher than 1,300 K. For ages of 100 Myr, 500 Myr, and 1 Gyr, this temperature corresponds to a mass of 10, 31, and 42 , respectively, and is accessible to the present survey. In this range of mass, the difference in band magnitude between 100 Myr and 1 Gyr varies from 4 at the high-mass end to 8 at the low-mass end. Even if we avoid interpolating the true age range of the UMa group in the evolutionary models, we can assess that the age uncertainty of the UMa group implies an error of several band magnitudes which is the dominant source of error in the present study.
5 Results and Discussion
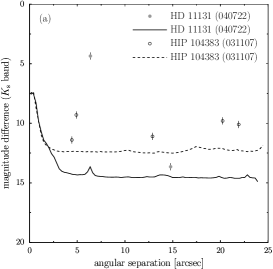
The noise level is observed to decrease strongly with increasing separation from the primary star (Fig. 2). The longest on-target exposure time was spent on the brightest target, HD 22049, resulting in the highest dynamic range of the present work (17 mag for a detection). Typically, the dynamic range for a detection limit ranges between and 15 at a separation beyond 3” (Figs. 1, 11, 12, and 13). Given the band magnitude of the central star, this corresponds to about provided an age of 500 Myr (Figs. 14 and 15). Objects with 12 and younger than 1 Gyr could have been detected at separations of less than au in the case of HIP 57548 with the deepest exposure of the present work, and objects with 20 closer than au (Table E).
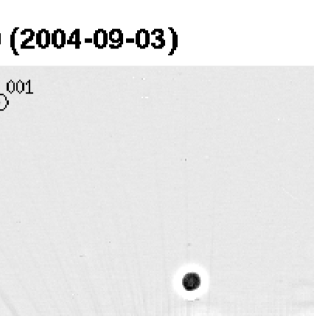
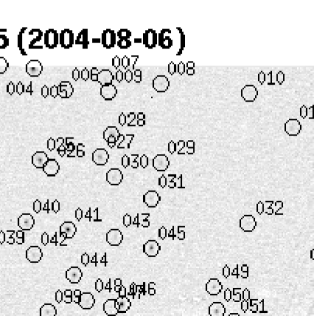
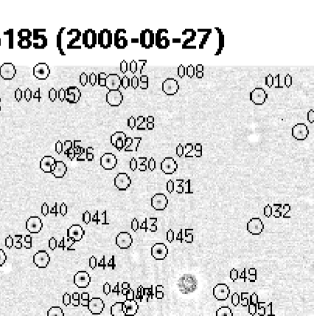
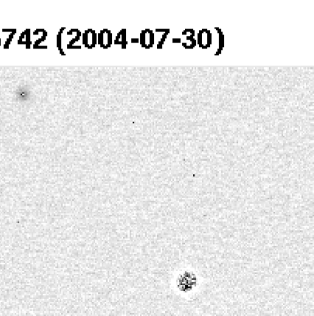
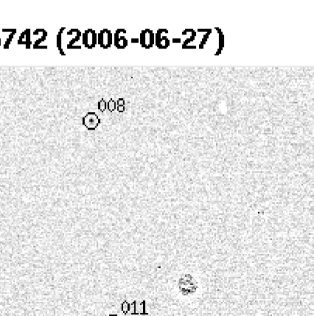
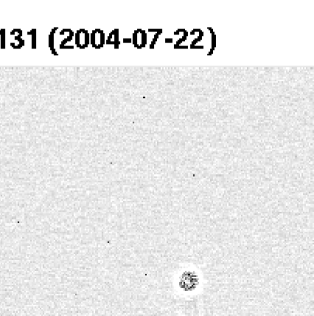
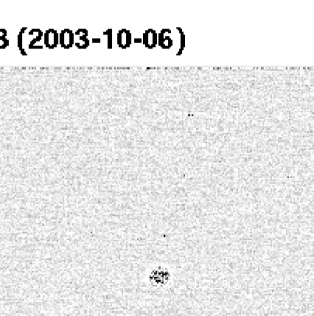
More than 200 candidates have been identified (Figs. 5-9, Table D). While in some fields, not a single object has been detected around the star (HD 11171, HD 26923, HD 38393, HD 63433, HIP 57548, HD 95650, HD 125451, HD 139006, and HD 217813), some 160 have been found around HD 165185 which is located in the galactic plane. A number of additional candidates have been found close to HD 11131, HD 22049, HD 26913, HD 41593, HD 60491, HD 61606 A, HD 135599, HD 147584, HD 175742, and HIP 104383 A999HIP 104383 A is a special case since it appears as a visual binary below the coronagraph (Fig. 10). According to Balega et al. (2004), it is a binary with a separation of 03 and a magnitude difference of 1.67 in the band. In the band we measured a magnitude difference of 0.45. The astrometric measurements presented here have been done w.r.t. the brighter component while the co-added signal has been used for photometric measurements. .

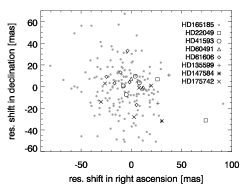
The relative shift of a companion w.r.t. the star has been measured when a second epoch was available (Table D). All those cases are non-moving background stars when comparing to the predicted shift due to the stellar parallactic and proper motion (Table E and Fig. 3)101010The parallactic motion has been calculated assuming a value of the obliquity of the ecliptic plane of and expressing the solar longitude by with the time given by Julian centuries since 1900, January 0, 12 h (Kovalevsky, 1995). The eccentricity of Earth’s orbit has been neglected.. The deviation from these expectations is less than 01 in all cases and of the order of the astrometric error bars (Table D). This shows that the true astrometric uncertainties agree with the assessments by Chauvin et al. (2010) implemented here (Sect. 3).
The detection limits can be compared to the brightness of faint background objects detected in the field of view. The uncertainties of the photometric measurements are below 1 mag in almost all cases. Usually, they are close to 0.5 mag and increasing towards the detection limit while the photometric measurements deviate by less than a magnitude from epoch to epoch. Enhanced error bars can be ascribed to smearing, noise, flux missed by the aperture photometry at the edges of the frame, or background features like diffraction spikes, ghosts, and reflections (indicated in Table D).
The faintest object identified (HD 165185, ID0101) advocates an empirical detection limit of 22 for HD 165185. However, the aperture photometry of this object is affected by insufficient background correction so that it must be somewhat brighter (Fig. 7). Moreover, the lower envelope to the distribution of most candidates (Fig. 12) is a bit higher as is also indicated by the brightness distribution of all candidates (cf. Fig. 3). It covers magnitudes in the range with a single brighter object next to HD 11131. As can be expected for a distribution of field stars, there are a few bright objects and a larger number of faint objects. The number of objects decreases rapidly at a brightness level fainter than indicating that the census is complete down to this value. Since the distribution is almost entirely constituted of objects next to HD 165185, this completeness limit is certainly valid for this subset.
| target/cand. | epoch/position | reference/magnitude/ID | ||
| HD 22049 | 2002-08-20 | (1) | ||
| ID0001 | 2 | |||
| ID0002 | 1 | |||
| HD 41593 | 2002-2004 | (2) | ||
| ID0002 | cc1 | |||
| HD 175742 | 2004-06-28 | (3) | ||
| ID0001 | 3 | |||
| ID0003 | 4 | |||
| ID0004 | 1 | |||
| ID0006 | 2 | |||
| HD 175742 | 2011-05-23 | (4) | ||
| ID0004 | … | … | ||
We compared our candidates with previous work for targets in common with other surveys which have not necessarily been dedicated to the UMa group (Macintosh et al., 2003; Itoh et al., 2008b; Metchev & Hillenbrand, 2009).We recovered all of the previously known candidates (Table 1) at the positions expected as far as they are covered by our field of view. Photometric measurements agree well within the error bars as long as they have been measured in the same or a similar photometric band. The single exception is ID 4 next to HD 175742 (Metchev & Hillenbrand, 2009, object 1). Most certainly, the difference of one magnitude can be explained by the location of ID 4 in the PSF of HD 175742 where the photometric measurement is very sensitive to imperfections of the PSF subtraction. The same object was found by Janson et al. (2013) but no photometric measurement is given there. The southern component of HD 165185 listed by Mason et al. (2014) is out of the field of view of the present work but displayed in Table B.
The deepest exposure has been chosen for each target to derive a survey upper limit on the frequency of stars with a companion of given mass and age. This has been done in a basic way similar to Lafrenière et al. (2007) without assuming any prior knowledge on the mass-period distribution of companions.
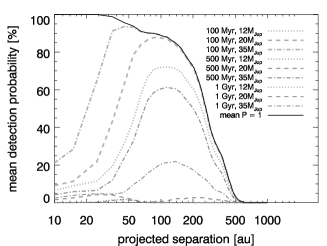
For this purpose, maps of 10 detection probability have been derived from the maps of limiting magnitude presented in Sect. 4 by comparing them to the signal of a 12, 20, and 35 companion at different ages of 100 Myr, 500 Myr, and 1 Gyr (using the evolutionary models described in Sect. 4)121212The probability has been computed that a signal exceeds the 10 detection threshold in the presence of noise, assuming a normal distribution.. The mean survey detection probability has been assessed by centering, rescaling, and averaging those probability maps (Fig. 4). In the limiting case, where the detection probability equals 1 throughout each frame, the average detection probability is only limited by the respective field of view and approaches zero at separations beyond 500 au which are not covered by any exposure of the survey. The age range considered has a stronger effect than the mass range. On average, the survey is most sensitive at separations between 100 and 200 au since the distance of the targets and thus the field of view covered is very different.
We derived the upper limit on the frequency of stars with a companion where the mean detection probability is high. We followed the Bayesian approach described by Lafrenière et al. (2007) using the Poisson approximation and a confidence level of . In the most sensitive range between 100 and 200 au, we can place an upper limit of 25 % on the frequency of UMa group members with low-mass companions more massive than 35 if the age of the UMa group is close to 500 Myr or younger. The limit is never below 15 %, defined by the number of stars, the confidence level, and the case of a detection probability of one everywhere (solid line in Fig. 4).
When interpreting the outcome of the present study one has to be aware of specific formation environments represented by the significant fraction of targets with stellar companions (cf. Tables A and B). In addition we note that the known companions of GJ 569 have not been considered for the frequency estimate since they are closer to the star than the field covered by the present work and we did not account for the companions of HD 130948 since they have masses close to the Deuterium burning limit of which we are not sensitive to on average. Although the results are not at variance with previous work, it is obvious that the study of the UMa group would benefit from a larger sample size. So far, northern UMa group members have not been studied systematically. Those actually comprise the largest part of the UMa group. Although its densest part on the northern hemisphere is within 30 pc, the group extends far beyond.
Acknowledgements.
M.A. thanks Eike W. Guenther for fruitful discussions. We thank the anonymous referee for the constructive comments. AB acknowledges support from DFG in grants NE 515/13-1 and 13-2. M.A. was supported by a graduate scholarship of the Cusanuswerk, one of the national student elite programs of Germany, and an individual fellowship granted by the Fundação para a Ciência e a Tecnologia (FCT), Portugal (reference SFRH/BPD/26817/2006). M.A. acknowledges research funding granted by the Deutsche Forschungsgemeinschaft (DFG) under the project RE 1664/4-1. M.A. further acknowledges support by DLR under the projects 50OW0204 and 50OO1501. RN acknowledges general support from the German National Science Foundation (Deutsche Forschungsgemeinschaft, DFG) in grants NE 515/13-1, 13-2, and 23-1. TOBS would like to thank Evangelisches Studienwerk e. V. Villigst, the state of Thuringia as well as DFG for support in program NE 515/30-1. RN and RE would like to thank DFG for support in the Priority Programme SPP 1385 on the First ten Million years of the Solar System in project NE 515 / 34-1 and 34-2. Use was made of the CDS services SIMBAD, Vizier, and the NASA/ADS abstract service. This research has made use of the Washington Double Star Catalog maintained at the U.S. Naval Observatory. This publication makes use of data products from the Two Micron All Sky Survey, which is a joint project of the University of Massachusetts and the Infrared Processing and Analysis Center/California Institute of Technology, funded by the National Aeronautics and Space Administration and the National Science Foundation.References
- Alibert et al. (2005) Alibert, Y., Mordasini, C., Benz, W., & Winisdoerffer, C. 2005, A&A, 434, 343
- Allende Prieto & Lambert (1999) Allende Prieto, C. & Lambert, D. L. 1999, A&A, 352, 555
- Ammler (2006) Ammler, M. 2006, PhD thesis, Astrophysikalisches Institut und Universitäts-ternwarte Jena, Schillergäßchen 2-3, 07743 Jena, Germany
- Ammler-von Eiff et al. (2009) Ammler-von Eiff, M., Bedalov, A., Mugrauer, M., Neuhäuser, R., & Guenther, E. 2009, in AIP Conf. Proc., Vol. 1094, COOL STARS, STELLAR SYSTEMS AND THE SUN: Proceedings of the 15th Cambridge Workshop on Cool Stars, Stellar Systems and the Sun, St. Andrews (Scotland), 21-25 July 2008, 828
- Ammler-von Eiff & Guenther (2009) Ammler-von Eiff, M. & Guenther, E. W. 2009, A&A, 508, 677
- Balega et al. (2004) Balega, I., Balega, Y. Y., Maksimov, A. F., et al. 2004, A&A, 422, 627
- Bannister & Jameson (2007) Bannister, N. P. & Jameson, R. F. 2007, MNRAS, 378, L24
- Banse et al. (1983) Banse, K., Crane, P., Ounnas, C., & Ponz, D. 1983, in Proc. of DECUS, Zurich, 87
- Baraffe et al. (2003) Baraffe, I., Chabrier, G., Barman, T. S., Allard, F., & Hauschildt, P. H. 2003, A&A, 402, 701
- Benedict et al. (2006) Benedict, G. F., McArthur, B. E., Gatewood, G., et al. 2006, AJ, 132, 2206
- Biller et al. (2010) Biller, B. A., Liu, M. C., Wahhaj, Z., et al. 2010, ApJ, 720, L82
- Biller et al. (2013) Biller, B. A., Liu, M. C., Wahhaj, Z., et al. 2013, ApJ, 777, 160
- Boccaletti et al. (2013) Boccaletti, A., Lagrange, A.-M., Bonnefoy, M., Galicher, R., & Chauvin, G. 2013, A&A, 551, L14
- Bonavita & Desidera (2007) Bonavita, M. & Desidera, S. 2007, A&A, 468, 721
- Bouvier et al. (2008) Bouvier, J., Kendall, T., Meeus, G., et al. 2008, A&A, 481, 661
- Bowler et al. (2015) Bowler, B. P., Liu, M. C., Shkolnik, E. L., & Tamura, M. 2015, ApJS, 216, 7
- Brandeker et al. (2006) Brandeker, A., Jayawardhana, R., Khavari, P., Haisch, Jr., K. E., & Mardones, D. 2006, ApJ, 652, 1572
- Brandt & Huang (2015) Brandt, T. D. & Huang, C. X. 2015, ArXiv e-prints
- Broeg (2007) Broeg, C. 2007, MNRAS, 377, L44
- Bulut & Demircan (2007) Bulut, I. & Demircan, O. 2007, MNRAS, 378, 179
- Burrows et al. (1997) Burrows, A., Marley, M., Hubbard, W. B., et al. 1997, ApJ, 491, 856
- Chabrier et al. (2000) Chabrier, G., Baraffe, I., Allard, F., & Hauschildt, P. 2000, ApJ, 542, 464
- Chauvin et al. (2010) Chauvin, G., Lagrange, A.-M., Bonavita, M., et al. 2010, A&A, 509, A52
- Chauvin et al. (2005) Chauvin, G., Lagrange, A.-M., Zuckerman, B., et al. 2005, A&A, 438, L29
- Close et al. (2003) Close, L. M., Siegler, N., Freed, M., & Biller, B. 2003, ApJ, 587, 407
- Cushing et al. (2011) Cushing, M. C., Kirkpatrick, J. D., Gelino, C. R., et al. 2011, ApJ, 743, 50
- Deller & Maddison (2005) Deller, A. T. & Maddison, S. T. 2005, ApJ, 625, 398
- Devillard (1997) Devillard, N. 1997, The Messenger, 87, 19
- Devillard (2011) Devillard, N. 2011, in Astrophysics Source Code Library, record ascl:1112.001, 12001
- Duchêne et al. (2007) Duchêne, G., Bontemps, S., Bouvier, J., et al. 2007, A&A, 476, 229
- Eggen (1994) Eggen, O. J. 1994, in Galactic and Solar System Optical Astrometry, 191–+
- Eggen (1995) Eggen, O. J. 1995, AJ, 110, 2862
- Eggleton & Tokovinin (2008) Eggleton, P. P. & Tokovinin, A. A. 2008, MNRAS, 389, 869
- Eisenbeiss et al. (2013) Eisenbeiss, T., Ammler-von Eiff, M., Roell, T., et al. 2013, A&A, 556, A53
- Eisenbeiss et al. (2007) Eisenbeiss, T., Seifahrt, A., Mugrauer, M., et al. 2007, Astronomische Nachrichten, 328, 521
- Fabricius et al. (2002) Fabricius, C., Høg, E., Makarov, V. V., et al. 2002, A&A, 384, 180
- Fischer et al. (2014) Fischer, D. A., Howard, A. W., Laughlin, G. P., et al. 2014, Protostars and Planets VI, 715
- Fuhrmann (2004) Fuhrmann, K. 2004, Astronomische Nachrichten, 325, 3
- Gray (2005) Gray, D. 2005, The observation and analysis of stellar photospheres, 3rd edn. (Cambridge: Cambridge University Press)
- Guenther et al. (2005) Guenther, E. W., Paulson, D. B., Cochran, W. D., et al. 2005, A&A, 442, 1031
- Hatzes et al. (2000) Hatzes, A. P., Cochran, W. D., McArthur, B., et al. 2000, ApJ, 544, L145
- Ida & Lin (2004) Ida, S. & Lin, D. N. C. 2004, ApJ, 604, 388
- Itoh et al. (2008a) Itoh, Y., Hayashi, M., Tamura, M., et al. 2008a, PASJ, 60, 223
- Itoh et al. (2006) Itoh, Y., Oasa, Y., & Fukagawa, M. 2006, ApJ, 652, 1729
- Itoh et al. (2008b) Itoh, Y., Tamura, M., Hayashi, M., et al. 2008b, PASJ, 60, 209
- Janson et al. (2007) Janson, M., Brandner, W., Henning, T., et al. 2007, AJ, 133, 2442
- Janson et al. (2013) Janson, M., Brandt, T. D., Moro-Martín, A., et al. 2013, ApJ, 773, 73
- King & Schuler (2005) King, J. R. & Schuler, S. C. 2005, PASP, 117, 911
- King et al. (2003) King, J. R., Villarreal, A. R., Soderblom, D. R., Gulliver, A. F., & Adelman, S. J. 2003, AJ, 125, 1980
- Kirkpatrick (2008) Kirkpatrick, J. D. 2008, in Astronomical Society of the Pacific Conference Series, Vol. 384, 14th Cambridge Workshop on Cool Stars, Stellar Systems, and the Sun, ed. S. P. P. S. D. E. M. B. J. Messina, 85–+
- König et al. (2002) König, B., Fuhrmann, K., Neuhäuser, R., Charbonneau, D., & Jayawardhana, R. 2002, A&A, 394, L43
- Kovalevsky (1995) Kovalevsky, J. 1995, Modern Astrometry (Springer)
- Lafrenière et al. (2007) Lafrenière, D., Doyon, R., Marois, C., et al. 2007, ApJ, 670, 1367
- Lenzen et al. (2003) Lenzen, R., Hartung, M., Brandner, W., et al. 2003, in Presented at the Society of Photo-Optical Instrumentation Engineers (SPIE) Conference, Vol. 4841, Instrument Design and Performance for Optical/Infrared Ground-based Telescopes. Edited by Iye, Masanori; Moorwood, Alan F. M. Proceedings of the SPIE, Volume 4841, pp. 944-952 (2003)., ed. M. Iye & A. F. M. Moorwood, 944–952
- Lodieu et al. (2014) Lodieu, N., Boudreault, S., & Béjar, V. J. S. 2014, MNRAS, 445, 3908
- Macintosh et al. (2003) Macintosh, B. A., Becklin, E. E., Kaisler, D., Konopacky, Q., & Zuckerman, B. 2003, ApJ, 594, 538
- Malkov et al. (1998) Malkov, O., Piskunov, A., & Zinnecker, H. 1998, A&A, 338, 452
- Marengo et al. (2006) Marengo, M., Megeath, S. T., Fazio, G. G., et al. 2006, ApJ, 647, 1437
- Martín et al. (2000) Martín, E. L., Koresko, C. D., Kulkarni, S. R., Lane, B. F., & Wizinowich, P. L. 2000, ApJ, 529, L37
- Mason et al. (2001) Mason, B. D., Wycoff, G. L., Hartkopf, W. I., Douglass, G. G., & Worley, C. E. 2001, AJ, 122, 3466
- Mason et al. (2014) Mason, B. D., Wycoff, G. L., Hartkopf, W. I., Douglass, G. G., & Worley, C. E. 2014, VizieR Online Data Catalog, 1, 2026
- McCarthy & Zuckerman (2004) McCarthy, C. & Zuckerman, B. 2004, AJ, 127, 2871
- Metchev & Hillenbrand (2009) Metchev, S. A. & Hillenbrand, L. A. 2009, ApJS, 181, 62
- Montes et al. (2001) Montes, D., López-Santiago, J., Gálvez, M. C., et al. 2001, MNRAS, 328, 45
- Mugrauer et al. (2014) Mugrauer, M., Ginski, C., & Seeliger, M. 2014, MNRAS, 439, 1063
- Neuhäuser & Guenther (2004) Neuhäuser, R. & Guenther, E. W. 2004, A&A, 420, 647
- Neuhäuser et al. (2003) Neuhäuser, R., Guenther, E. W., Alves, J., et al. 2003, Astronomische Nachrichten, 324, 535
- Neuhäuser et al. (2007) Neuhäuser, R., Mugrauer, M., Fukagawa, M., Torres, G., & Schmidt, T. 2007, A&A, 462, 777
- Neuhäuser & Schmidt (2012) Neuhäuser, R. & Schmidt, T. 2012, in Topics in Adaptive Optics, ed. R. K. Tyson (Rijeka, Croatia: InTech)
- Perryman et al. (1997) Perryman, M. A. C., Lindegren, L., Kovalevsky, J., et al. 1997, A&A, 323, L49
- Persson et al. (1998) Persson, S. E., Murphy, D. C., Krzeminski, W., Roth, M., & Rieke, M. J. 1998, AJ, 116, 2475
- Potter et al. (2002) Potter, D., Martín, E. L., Cushing, M. C., et al. 2002, ApJ, 567, L133
- Quillen & Thorndike (2002) Quillen, A. C. & Thorndike, S. 2002, ApJ, 578, L149
- Rameau et al. (2013) Rameau, J., Chauvin, G., Lagrange, A.-M., et al. 2013, A&A, 553, A60
- Rousset et al. (2003) Rousset, G., Lacombe, F., Puget, P., et al. 2003, in Presented at the Society of Photo-Optical Instrumentation Engineers (SPIE) Conference, Vol. 4839, Adaptive Optical System Technologies II. Edited by Wizinowich, Peter L.; Bonaccini, Domenico. Proceedings of the SPIE, Volume 4839, pp. 140-149 (2003)., ed. P. L. Wizinowich & D. Bonaccini, 140–149
- Simon et al. (2006) Simon, M., Bender, C., & Prato, L. 2006, ApJ, 644, 1183
- Skrutskie et al. (2006) Skrutskie, M. F., Cutri, R. M., Stiening, R., et al. 2006, AJ, 131, 1163
- Skuljan et al. (2004) Skuljan, J., Ramm, D. J., & Hearnshaw, J. B. 2004, MNRAS, 352, 975
- Tokovinin et al. (2006) Tokovinin, A., Thomas, S., Sterzik, M., & Udry, S. 2006, A&A, 450, 681
- Tokunaga et al. (2002) Tokunaga, A. T., Simons, D. A., & Vacca, W. D. 2002, PASP, 114, 180
- Valenti & Fischer (2005) Valenti, J. A. & Fischer, D. A. 2005, ApJS, 159, 141
- van Leeuwen (2007) van Leeuwen, F. 2007, A&A, 474, 653
- Wahhaj et al. (2011) Wahhaj, Z., Liu, M. C., Biller, B. A., et al. 2011, ApJ, 729, 139
- Warmels (1992) Warmels, R. H. 1992, in Astronomical Society of the Pacific Conference Series, Vol. 25, Astronomical Data Analysis Software and Systems I, ed. D. M. Worrall, C. Biemesderfer, & J. Barnes, 115
- Yamamoto et al. (2013) Yamamoto, K., Matsuo, T., Shibai, H., et al. 2013, PASJ, 65, 90
- Zapatero Osorio et al. (2004) Zapatero Osorio, M. R., Lane, B. F., Pavlenko, Y., et al. 2004, ApJ, 615, 958
- Zechmeister et al. (2013) Zechmeister, M., Kürster, M., Endl, M., et al. 2013, A&A, 552, A78
Appendix A Sample
| name | Montes et al. | King et al. (2003) | Fuhrmann | proper motion [mas/yr] | number of | ||||
|---|---|---|---|---|---|---|---|---|---|
| (2001) | (2004) | ||||||||
| kin. | phot. | final | NACO epochs | ||||||
| HD 11131 | Y | Y | ? | Y? | Y? | Y | -124.54 3.03 | -105.82 2.93 | 1 |
| HD 11171 | Y | Y | ?/Y? | Y? | Y? | Y | -148.11 0.25 | -93.43 0.24 | 2 |
| HD 22049 | … | … | … | … | … | Y | -975.17 0.21 | 19.49 0.20 | 2 |
| HD 26913 | N | Y | ? | ? | ? | Y | -102.64 0.66 | -113.30 0.59 | 2 |
| HD 26923 | Y | Y | Y? | Y | Y? | Y | -109.46 0.48 | -108.25 0.43 | 1 |
| HD 38393 | Y | Y | ?/Y? | Y? | Y? | … | -291.67 0.14 | -368.97 0.15 | 1 |
| HD 41593 | Y | Y | N?/? | Y | N?/? | Y | -120.46 0.71 | -103.21 0.43 | 2 |
| HD 60491 | N | Y | N?/? | Y? | N?/? | … | -81.17 1.26 | -42.66 0.66 | 2 |
| HD 61606 | N | Y | N? | Y? | N? | … | 69.90 0.71 | -278.33 0.31 | 2 |
| HD 63433 | Y | N | Y? | ? | ? | Y | -8.31 0.65 | -10.48 0.46 | 1 |
| HD 95650 | N | Y | Y | Y? | Y | … | 142.30 1.16 | -51.69 0.79 | 1 |
| HIP 57548 | N | Y | N? | N? | N? | … | 605.26 2.32 | -1219.28 1.97 | 1 |
| HD 125451 | N | Y | … | … | … | … | 105.95 0.23 | -31.80 0.21 | 1 |
| HD 135599 | … | … | ? | Y | ? | Y | 178.35 0.66 | -137.52 0.62 | 2 |
| HD 139006 | … | … | Y | Y | Y | Y | 120.27 0.19 | -89.58 0.20 | 2 |
| HD 147584 | … | … | Y | Y | Y | … | 199.97 0.25 | 110.97 0.43 | 2 |
| HD 165185 | N | Y | Y | Y? | Y | … | 105.05 0.60 | 7.95 0.32 | 2 |
| HD 175742 | … | … | N? | Y? | ? | … | 131.31 0.49 | -283.72 0.63 | 2 |
| HIP 104383 | N | Y | … | … | … | … | -77.56 2.42 | -32.89 0.87 | 2 |
| HD 217813 | N | Y | ? | ? | ? | Y | -117.70 0.59 | -27.66 0.49 | 1 |
Appendix B Field of view and nearby visual companions
Appendix C Images with candidates


Appendix D List of candidates
1
[x]l—rrrrrr—rrrrrr—rrrrrrrrr
ID [mag] \endfirsthead
ID [mag] \endhead\endfoot\endlastfootHD 11131 2004-07-22 ID0001-12.437 0.022 7.981 0.033 … … 18.8 0.3 … … ID0002 -0.680 0.017 6.335 0.004 … … 9.5 0.3 … … HD 22049 2004-09-03 2005-12-23 ID0001 6.749 0.044 16.607 0.020 8.558 0.044 16.731 0.025 17.2 0.51809 62 124 32 ID0002 -7.215 0.036 13.812 0.021 -5.454 0.037 13.974 0.016 17.3 0.41761 52 162 26 HD 26913 2003-12-25 2005-12-06 ID0001 … … 7.626 0.006 -1.747 0.020 18.3 0.3 … … ID0002 … … 6.864 0.016 -5.755 0.018 18.6 0.3 … … HD 41593 2003-12-17 2005-11-08 ID0001 8.784 0.027 10.313 0.024 8.966 0.028 10.507 0.024 17.8 0.4 182 39 194 34 ID0002 -6.208 0.025 9.453 0.017 -6.023 0.026 9.639 0.017 15.4 0.4 185 36 186 24 ID0003-16.149 0.013 3.558 0.042-15.951 0.014 3.755 0.042 16.8 0.5 198 19 197 59 ID0004 8.700 0.007 1.857 0.023 8.894 0.008 2.060 0.023 17.6 0.4 194 11 203 33 ID0005-16.878 0.010 -0.197 0.044 … … 16.2 0.3 … … HD 60491 2003-12-26 2005-11-08 ID0001-15.721 0.018 5.847 0.041-15.582 0.018 5.918 0.041 17.4 0.3 139 25 71 58 ID0002 -1.695 0.045 17.052 0.011 -1.567 0.045 17.132 0.011 15.6 0.3 128 64 80 16 ID0003 2.382 0.015 -5.890 0.007 2.522 0.015 -5.818 0.007 18.5 0.3 140 21 72 10 ID0004 … … 11.312 0.013 -4.255 0.030 18.5 0.3 … … HD 61606 2004-01-10 2005-11-08 ID0001 -1.114 0.035 13.389 0.008 -1.324 0.036 13.898 0.009 17.7 0.3-210 50 509 12 ID0002 1.021 0.017 6.328 0.005 0.819 0.018 6.831 0.005 19.0 0.9a𝑎aa𝑎aBulut & Demircan (2007)-202 25 503 7 ID0003 4.780 0.004 1.135 0.013 4.584 0.005 1.648 0.012 16.9 0.3-196 6 513 18 ID0004 -1.017 0.012 -4.491 0.004 -1.204 0.010 -3.987 0.004 17.8 0.9a𝑎aa𝑎aaffected by background features (like diffraction spikes, ghosts, reflections)-187 16 504 6 ID0005-11.218 0.017 -5.886 0.030-11.398 0.016 -5.403 0.030 18.1 0.3-180 23 483 42 ID0006 9.264 0.026 -9.712 0.025 9.075 0.025 -9.179 0.024 18.2 0.3-189 36 533 35 HD 135599 2004-07-13 2006-04-06 ID0001 7.610 0.024 8.923 0.021 7.238 0.024 9.163 0.020 17.1 0.3-372 34 240 29 ID0002 -0.490 0.030 11.476 0.007 -0.851 0.031 11.742 0.007 17.9 0.3-361 43 266 10 HD 147584 2004-02-10 2006-02-21 ID0001 7.082 0.038 14.442 0.020 6.702 0.037 14.197 0.020 13.4 0.8b𝑏bb𝑏bHD 147584: mean value of M4 of the range given by Skuljan et al. (2004) (M1V-M7V)-380 53-245 28 ID0002 … … 11.121 0.041 15.617 0.031 15.1 0.3 … … ID0003 … … 5.645 0.033 12.509 0.017 17.7 0.3 … … ID0004 … … 6.463 0.030 11.456 0.018 18.5 0.3 … … ID0005 … … 3.956 0.025 9.465 0.012 19.5 0.3 … … ID0006 … … 8.022 0.018 6.592 0.021 16.5 0.3 … … ID0007 … … -6.014 0.006 1.809 0.016 17.7 0.3 … … ID0008 … … -11.427 0.009 2.109 0.030 16.4 0.3 … … ID0009 … … 6.303 0.016 5.777 0.017 19.2 0.3 … … ID0010 … … -16.132 0.011 2.120 0.042 21.4 0.3 … … HD 165185 2004-08-06 2006-06-27 ID0001-12.109 0.014 4.500 0.032-12.367 0.014 4.475 0.032 16.7 0.4-258 20 -25 45 ID0002 9.264 0.047 17.735 0.027 9.035 0.047 17.770 0.026 18.6 0.6-229 66 35 37 ID0003 9.114 0.045 17.253 0.026 8.881 0.045 17.264 0.025 19.8 0.9c𝑐cc𝑐cHD 175742: SB1 (Tokovinin et al. 2006); literature not unanimous on the parameters (Eggleton & Tokovinin 2008)-233 64 11 36 ID0004 6.524 0.047 17.879 0.020 6.301 0.047 17.840 0.020 21.8 2.1c𝑐cc𝑐caperture photometry misses flux at edge of frame-223 66 -39 28 ID0005 5.351 0.047 17.779 0.018 5.110 0.047 17.834 0.017 17.0 0.8c𝑐cc𝑐caperture photometry misses flux at edge of frame-241 66 55 25 ID0006 4.259 0.045 17.036 0.015 4.019 0.045 17.027 0.015 19.9 0.4-240 64 -9 21 ID0007 2.842 0.046 17.473 0.013 2.595 0.046 17.429 0.012 19.5 0.6-247 65 -44 18 ID0008 0.875 0.045 17.248 0.010 0.610 0.045 17.277 0.010 19.4 0.5-265 64 29 14 ID0009 2.753 0.044 16.955 0.012 2.534 0.044 16.901 0.012 22.3 1.5d𝑑dd𝑑dHIP 104383: Balega et al. (2004)-219 62 -54 17 ID0010 -2.224 0.044 16.927 0.012 -2.515 0.044 16.964 0.012 19.5 0.3-291 62 37 17 ID0011 -3.699 0.041 15.713 0.013 -3.968 0.041 15.710 0.014 19.2 0.5-269 58 -3 19 ID0012 -4.902 0.040 15.352 0.016 -5.177 0.040 15.364 0.016 20.7 0.8d𝑑dd𝑑dmeasurement affected by noise in first epoch.-275 57 12 23 ID0013 -5.338 0.042 15.915 0.017 -5.481 0.042 15.887 0.017 19.1 0.4-143 59 -28 24 ID0014 -5.415 0.041 15.784 0.017 -5.673 0.041 15.790 0.018 18.5 0.6-258 58 6 25 ID0015 -6.450 0.044 16.762 0.020 -6.697 0.044 16.764 0.020 18.1 0.4-247 62 2 28 ID0016 -5.497 0.046 17.530 0.018 -5.785 0.046 17.517 0.018 21.9 1.9d𝑑dd𝑑dmeasurement affected by noise in first epoch.-288 65 -13 25 ID0017 -8.445 0.046 17.338 0.024 -8.713 0.046 17.352 0.025 16.9 0.5-268 65 14 35 ID0018-10.926 0.041 15.457 0.030-11.194 0.041 15.463 0.031 17.8 0.5-268 58 6 43 ID0019-11.310 0.040 15.103 0.031-11.551 0.040 15.040 0.031 19.9 0.7-241 57 -63 44 ID0020-10.113 0.037 13.975 0.028-10.377 0.037 13.970 0.028 18.1 0.5-264 52 -5 40 ID0021-11.011 0.037 13.883 0.030-11.253 0.037 13.822 0.031 20.0 0.3-242 52 -61 43 ID0022 -8.846 0.035 13.106 0.024 -9.117 0.035 13.102 0.025 13.8 0.5-271 49 -4 35 ID0023 7.949 0.042 16.054 0.023 7.695 0.042 16.079 0.022 18.9 0.5-254 59 25 32 ID0024 8.492 0.044 16.573 0.024 8.262 0.044 16.594 0.024 20.5 0.7-230 62 21 34 ID0025 5.126 0.038 14.583 0.016 4.881 0.038 14.596 0.015 17.5 0.5-245 54 13 22 ID0026 4.724 0.038 14.350 0.015 4.477 0.038 14.395 0.015 19.7 0.5-247 54 45 21 ID0027 3.015 0.038 14.689 0.012 2.762 0.039 14.711 0.011 18.1 0.4-253 54 22 16 ID0028 2.606 0.040 15.448 0.011 2.364 0.041 15.467 0.011 17.6 0.5-242 57 19 16 ID0029 0.896 0.038 14.477 0.009 0.648 0.038 14.497 0.009 18.5 0.3-248 54 20 13 ID0030 2.528 0.037 14.003 0.011 2.284 0.037 14.002 0.010 19.5 0.5-244 52 — 15 ID0031 1.235 0.035 13.261 0.009 0.991 0.035 13.267 0.008 19.4 0.5-244 49 6 12 ID0032 -2.163 0.032 12.380 0.009 -2.420 0.032 12.377 0.010 19.6 0.4-257 45 -3 13 ID0033 -5.715 0.034 12.750 0.017 -5.990 0.034 12.723 0.017 18.9 0.5-275 48 -27 24 ID0034 10.187 0.034 12.688 0.028 9.948 0.034 12.707 0.027 16.5 0.5-239 48 19 39 ID0035 10.304 0.035 13.084 0.028 10.039 0.035 13.088 0.027 19.1 0.3-265 49 4 39 ID0036 8.481 0.034 12.975 0.024 8.265 0.034 12.919 0.023 19.5 0.3-216 48 -56 33 ID0037 8.773 0.032 11.895 0.024 8.539 0.032 11.913 0.023 18.5 0.5-234 45 18 33 ID0038 11.459 0.028 10.500 0.031 11.254 0.028 10.510 0.030 17.4 0.5-205 40 10 43 ID0039 6.865 0.030 11.321 0.019 6.626 0.030 11.318 0.019 17.9 0.4-239 42 -3 27 ID0040 5.618 0.033 12.429 0.016 5.363 0.033 12.441 0.016 17.9 0.4-255 47 12 23 ID0041 4.147 0.032 12.160 0.013 3.906 0.032 12.163 0.013 17.2 0.4-241 45 3 18 ID0042 5.329 0.030 11.286 0.016 5.088 0.030 11.269 0.015 19.1 0.5-241 42 -17 22 ID0043 2.489 0.031 11.910 0.010 2.237 0.031 11.904 0.009 19.4 0.6-252 44 -6 13 ID0044 3.924 0.028 10.574 0.012 3.676 0.028 10.575 0.011 17.6 0.4-248 40 1 16 ID0045 1.229 0.030 11.519 0.008 0.976 0.030 11.525 0.007 17.6 0.4-253 42 6 11 ID0046 2.264 0.025 9.561 0.008 2.020 0.025 9.555 0.008 17.1 0.4-244 35 -6 11 ID0047 2.615 0.025 9.453 0.009 2.372 0.025 9.458 0.008 19.5 0.3-243 35 5 12 ID0048 3.465 0.025 9.642 0.011 3.222 0.025 9.652 0.010 19.2 0.4-243 35 10 15 ID0049 -0.968 0.027 10.156 0.007 -1.226 0.027 10.138 0.007 18.8 0.4-258 38 -18 10 ID0050 -1.061 0.024 9.312 0.006 -1.316 0.024 9.311 0.006 18.2 0.4-255 34 — 8 ID0051 -1.644 0.024 8.968 0.007 -1.897 0.023 8.956 0.007 18.6 0.4-253 33 -12 10 ID0052 -5.516 0.031 11.827 0.016 -5.800 0.031 11.769 0.017 19.8 0.7-284 44 -58 23 ID0053 -4.664 0.030 11.306 0.014 -4.940 0.030 11.301 0.015 19.5 0.3-276 42 -5 21 ID0054 -8.807 0.033 12.330 0.024 -9.122 0.033 12.337 0.025 18.8 0.5-315 47 7 35 ID0055-12.998 0.034 12.774 0.035-13.254 0.034 12.739 0.035 19.3 0.6-256 48 -35 49 ID0056-13.804 0.033 12.147 0.037-14.088 0.033 12.130 0.038 18.4 0.5-284 47 -17 53 ID0057-14.100 0.031 11.487 0.038-14.349 0.031 11.426 0.038 19.4 0.6-249 44 -61 54 ID0058-15.891 0.024 8.285 0.042-16.159 0.024 8.268 0.043 15.2 0.5-268 34 -17 60 ID0059 -7.046 0.026 9.665 0.019 -7.302 0.026 9.656 0.020 17.4 0.4-256 37 -9 28 ID0060 -7.789 0.029 10.781 0.021 -8.055 0.029 10.749 0.022 19.6 0.6-266 41 -32 30 ID0061 -8.341 0.029 10.856 0.023 -8.635 0.029 10.842 0.023 20.9 0.5-294 41 -14 33 ID0062 -6.989 0.023 8.738 0.019 -7.252 0.023 8.722 0.020 20.0 0.9d𝑑dd𝑑dmeasurement affected by noise in first epoch.-263 33 -16 28 ID0063 -6.684 0.019 7.250 0.018 -6.953 0.019 7.229 0.019 19.0 0.4-269 27 -21 26 ID0064 -4.377 0.018 6.647 0.012 -4.627 0.018 6.640 0.013 17.9 0.5-250 25 -7 18 ID0065 -4.525 0.016 6.039 0.012 -4.772 0.016 6.032 0.013 17.0 0.4-247 23 -7 18 ID0066 -4.525 0.016 6.039 0.012 -4.772 0.016 6.032 0.013 17.0 0.4-247 23 -7 18 ID0067 -1.017 0.021 7.835 0.005 -1.246 0.020 7.816 0.006 18.4 1.5a𝑎aa𝑎aaffected by background features (like diffraction spikes, ghosts, reflections)-229 29 -19 8 ID0068 -1.637 0.019 7.295 0.006 -1.880 0.019 7.282 0.007 18.6 0.5-243 27 -13 9 ID0069 -1.399 0.015 5.886 0.005 -1.636 0.015 5.869 0.005 18.2 0.4-237 21 -17 7 ID0070 0.403 0.021 7.970 0.005 0.159 0.021 7.961 0.005 17.0 0.3-244 30 -9 7 ID0071-12.492 0.026 9.687 0.033-12.776 0.027 9.731 0.034 20.1 0.4-284 37 44 47 ID0072-11.868 0.022 7.887 0.031-12.115 0.022 7.863 0.032 19.6 0.4-247 31 -24 45 ID0073-12.086 0.018 6.158 0.032-12.353 0.018 6.133 0.033 17.9 0.5-267 25 -25 46 ID0074-12.515 0.019 6.636 0.033-12.817 0.019 6.630 0.034 20.0 0.8d𝑑dd𝑑dmeasurement affected by noise in first epoch.-302 27 -6 47 ID0075-11.278 0.018 6.521 0.030-11.558 0.018 6.522 0.030 19.1 0.4-280 25 1 42 ID0076 -9.094 0.020 7.428 0.024 -9.368 0.020 7.472 0.025 19.5 0.4-274 28 44 35 ID0077 -8.837 0.019 7.130 0.023 -9.111 0.019 7.008 0.024 19.7 0.4-274 27-122 33 ID0078-13.843 0.019 6.393 0.036-14.117 0.019 6.363 0.037 19.2 0.7-274 27 -30 52 ID0079-12.928 0.013 4.072 0.034-13.151 0.013 4.010 0.035 20.0 0.5-223 18 -62 49 ID0080-13.304 0.013 4.143 0.035-13.535 0.013 4.117 0.036 19.5 0.4-231 18 -26 50 ID0081-13.845 0.014 4.111 0.036-14.116 0.014 4.072 0.037 18.9 0.7-271 20 -39 52 ID0082 -3.875 0.008 2.857 0.010 -4.086 0.008 2.951 0.011 17.1 0.4-211 11 94 15 ID0083 -4.401 0.010 3.594 0.012 -4.649 0.010 3.580 0.012 19.8 0.7-248 14 -14 17 ID0084 -4.962 0.010 3.546 0.013 -5.218 0.010 3.523 0.014 18.1 0.4-256 14 -23 19 ID0085 -5.102 0.010 3.747 0.014 -5.362 0.010 3.724 0.014 18.8 0.5-260 14 -23 20 ID0086 -3.561 0.012 4.340 0.010 -3.809 0.012 4.340 0.010 19.5 0.3-248 17 0 14 ID0087 -5.510 0.013 4.835 0.015 -5.763 0.013 4.822 0.015 18.5 0.3-253 18 -13 21 ID0088-10.682 0.007 -1.022 0.028-10.935 0.007 -1.060 0.029 17.4 0.5-253 10 -38 40 ID0089-11.034 0.007 -0.490 0.029-11.289 0.007 -0.505 0.030 19.5 0.3-255 10 -15 42 ID0090 -7.401 0.006 -1.589 0.019 -7.647 0.006 -1.620 0.020 17.1 0.4-246 8 -31 28 ID0091 -7.058 0.007 -2.340 0.019 -7.304 0.008 -2.367 0.019 17.2 0.3-246 11 -27 27 ID0092 -8.906 0.008 2.189 0.023 -9.174 0.008 2.131 0.024 22.4 1.8a,d𝑎𝑑a,da,d𝑎𝑑a,dfootnotemark: -268 11 -58 33 ID0093-11.528 0.009 2.211 0.030-11.819 0.009 2.199 0.031 19.5 0.4-291 13 -12 43 ID0094 1.450 0.015 5.663 0.005 1.209 0.015 5.651 0.005 19.2 0.7-241 21 -12 7 ID0095 1.188 0.014 5.164 0.004 0.925 0.013 5.152 0.004 18.4 0.5-263 19 -12 6 ID0096 1.571 0.013 5.052 0.005 1.333 0.013 5.030 0.005 18.8 0.3-238 18 -22 7 ID0097 1.897 0.013 4.968 0.006 1.655 0.013 4.965 0.005 17.9 0.3-242 18 -3 8 ID0098 1.885 0.012 4.628 0.006 1.644 0.012 4.631 0.005 18.4 0.4-241 17 3 8 ID0099 4.854 0.024 9.288 0.014 4.619 0.024 9.288 0.013 19.0 0.5-235 34 0 19 ID0100 4.326 0.021 7.897 0.012 4.068 0.021 7.903 0.012 19.5 0.5-258 30 6 17 ID0101 8.097 0.024 8.856 0.022 7.867 0.023 8.808 0.021 22.0 0.7-230 33 -48 30 ID0102 10.651 0.022 8.107 0.028 10.427 0.022 8.128 0.028 18.1 0.4-224 31 21 40 ID0103 7.372 0.016 5.737 0.020 7.136 0.016 5.740 0.019 14.0 0.4-236 23 3 28 ID0104 6.457 0.014 5.051 0.017 6.228 0.014 5.043 0.017 17.9 0.3-229 20 -8 24 ID0105 6.426 0.012 4.379 0.017 6.192 0.012 4.389 0.016 13.8 0.3-234 17 10 23 ID0106 4.477 0.011 4.009 0.012 4.237 0.011 4.006 0.011 19.3 0.4-240 16 -3 16 ID0107 8.397 0.010 3.350 0.022 8.181 0.010 3.356 0.022 19.0 0.5-216 14 6 31 ID0108 8.364 0.006 1.566 0.022 8.141 0.006 1.563 0.021 18.5 0.3-223 8 -3 30 ID0109 11.177 0.008 1.725 0.029 10.972 0.008 1.729 0.029 19.5 1.2a𝑎aa𝑎aaffected by background features (like diffraction spikes, ghosts, reflections)-205 11 4 41 ID0110 6.199 0.005 1.517 0.016 5.972 0.005 1.458 0.016 18.0 0.6-227 7 -59 23 ID0111 7.798 0.006 -1.437 0.020 7.570 0.006 -1.443 0.020 16.6 0.3-228 8 -6 28 ID0112 9.992 0.007 -1.069 0.026 9.774 0.006 -1.074 0.026 17.6 0.4-218 9 -5 37 ID0113 10.644 0.007 -1.060 0.028 10.412 0.007 -1.080 0.027 19.4 1.0a,d𝑎𝑑a,da,d𝑎𝑑a,dfootnotemark: -232 10 -20 39 ID0114 10.654 0.007 -0.774 0.028 10.433 0.007 -0.780 0.027 18.2 0.3-221 10 -6 39 ID0115 4.980 0.007 -2.438 0.013 4.758 0.007 -2.457 0.013 19.0 0.3-222 10 -19 18 ID0116 9.866 0.010 -2.898 0.026 9.640 0.010 -2.901 0.025 18.5 0.3-226 14 -3 36 ID0117 9.696 0.010 -3.045 0.025 9.480 0.010 -3.045 0.025 17.4 0.3-216 14 0 35 ID0118 8.358 0.012 -4.031 0.022 8.132 0.012 -4.039 0.021 16.5 0.3-226 17 -8 30 ID0119 8.940 0.013 -4.545 0.024 8.720 0.013 -4.560 0.023 17.6 0.4-220 18 -15 33 ID0120 9.528 0.015 -5.240 0.025 9.311 0.015 -5.260 0.025 19.5 0.3-217 21 -20 35 ID0121 9.333 0.014 -5.014 0.025 9.121 0.014 -5.029 0.024 19.0 0.3-212 20 -15 35 ID0122 10.977 0.018 -6.303 0.029 10.764 0.018 -6.327 0.028 18.0 0.5-213 25 -24 40 ID0123 10.231 0.018 -6.534 0.027 10.012 0.018 -6.550 0.026 16.9 0.4-219 25 -16 37 ID0124 10.000 0.019 -6.989 0.026 9.786 0.019 -7.007 0.026 17.3 0.4-214 27 -18 37 ID0125 9.228 0.017 -5.959 0.024 9.011 0.017 -5.974 0.024 17.1 0.3-217 24 -15 34 ID0126 7.641 0.024 -9.017 0.021 7.425 0.024 -9.048 0.020 17.9 0.4-216 34 -31 29 ID0127 7.916 0.022 -8.255 0.021 7.704 0.022 -8.274 0.021 19.2 0.3-212 31 -19 30 ID0128 7.315 0.020 -7.610 0.020 7.088 0.020 -7.621 0.019 19.2 0.3-227 28 -11 28 ID0129 6.573 0.025 -9.555 0.018 6.357 0.025 -9.580 0.018 19.5 0.4-216 35 -25 25 ID0130 5.174 0.023 -8.561 0.014 4.966 0.023 -8.578 0.014 19.3 0.3-208 33 -17 20 ID0131 5.090 0.022 -8.221 0.014 4.863 0.022 -8.240 0.014 18.9 0.3-227 31 -19 20 ID0132 4.854 0.021 -7.864 0.014 4.647 0.021 -7.903 0.013 19.8 0.6-207 30 -39 19 ID0133 4.921 0.019 -7.214 0.014 4.691 0.019 -7.216 0.013 19.5 0.3-230 27 -2 19 ID0134 6.189 0.014 -5.245 0.016 5.973 0.014 -5.272 0.016 18.9 0.3-216 20 -27 23 ID0135 5.003 0.003 -0.052 0.013 4.759 0.003 -0.075 0.012 19.5 0.4-244 4 -23 18 ID0136 1.442 0.018 -6.727 0.005 1.208 0.018 -6.776 0.005 19.1 0.7-234 25 -49 7 ID0137 1.217 0.017 -6.560 0.005 0.982 0.017 -6.580 0.005 22.1 2.1a,d𝑎𝑑a,da,d𝑎𝑑a,dfootnotemark: -235 24 -20 7 ID0138 0.147 0.015 -5.920 0.004 -0.079 0.016 -5.950 0.004 18.4 0.5-226 22 -30 6 ID0139 -1.573 0.019 -7.348 0.006 -1.785 0.019 -7.386 0.006 19.0 0.5-212 27 -38 8 ID0140 -2.515 0.022 -8.293 0.008 -2.743 0.022 -8.327 0.009 18.4 0.3-228 31 -34 12 ID0141 -3.150 0.024 -9.116 0.010 -3.391 0.024 -9.158 0.010 19.0 0.4-241 34 -42 14 ID0142 -2.760 0.019 -7.169 0.008 -2.989 0.019 -7.207 0.009 14.6 0.3-229 27 -38 12 ID0143 -4.665 0.017 -6.336 0.013 -4.901 0.017 -6.363 0.013 18.7 0.4-236 24 -27 18 ID0144 -3.964 0.016 -6.069 0.011 -4.186 0.016 -6.067 0.012 19.8 0.3-222 23 2 16 ID0145 -5.291 0.019 -7.130 0.014 -5.520 0.019 -7.151 0.015 20.0 0.3-229 27 -21 21 ID0146 -5.354 0.015 -5.633 0.014 -5.606 0.015 -5.661 0.015 17.2 0.3-252 21 -28 21 ID0147 -5.459 0.012 -4.415 0.015 -5.702 0.012 -4.441 0.015 17.2 0.3-243 17 -26 21 ID0148 -5.068 0.011 -3.964 0.013 -5.297 0.011 -3.989 0.014 19.7 0.4-229 16 -25 19 ID0149 -6.688 0.015 -5.706 0.018 -6.925 0.016 -5.743 0.018 19.7 0.8a,d𝑎𝑑a,da,d𝑎𝑑a,dfootnotemark: -237 22 -37 25 ID0150 -8.104 0.015 -5.406 0.021 -8.336 0.015 -5.452 0.022 18.8 0.4-232 21 -46 30 ID0151-10.863 0.022 -7.955 0.029-11.105 0.022 -8.008 0.029 18.6 0.4-242 31 -53 41 ID0152-10.940 0.018 -6.415 0.029-11.195 0.018 -6.466 0.030 19.4 0.5-255 25 -51 42 ID0153-10.961 0.016 -5.556 0.029-11.207 0.016 -5.595 0.030 19.3 0.3-246 23 -39 42 ID0154-12.309 0.014 -4.657 0.032-12.561 0.014 -4.687 0.033 18.6 0.5-252 20 -30 46 ID0155-13.460 0.014 -4.197 0.035-13.710 0.014 -4.235 0.036 18.1 0.5-250 20 -38 50 ID0156-14.947 0.014 -4.246 0.039-15.213 0.014 -4.284 0.040 19.5 0.6-266 20 -38 56 ID0157-14.638 0.016 -4.995 0.038-14.886 0.016 -5.029 0.039 18.4 0.4-248 23 -34 54 ID0158-12.859 0.012 -3.316 0.034-13.115 0.012 -3.348 0.034 18.2 0.3-256 17 -32 48 ID0159-10.131 0.010 -2.930 0.027-10.395 0.010 -2.905 0.027 19.6 0.3-264 14 25 38 ID0160 -3.122 0.016 -5.979 0.009 -3.332 0.016 -6.042 0.009 17.9 0.5-210 23 -63 13 ID0161 9.903 0.012 -3.896 0.026 9.687 0.012 -3.908 0.025 19.0 0.3-216 17 -12 36 ID0162 0.333 0.009 -3.306 0.002 … … 18.5 0.3 … … ID0163 3.099 0.003 -0.813 0.008 … … 17.9 0.3 … … HD 175742 2004-07-30 2006-06-27 ID0001 -7.334 0.016 5.982 0.019 -7.641 0.018 6.505 0.020 16.5 0.5-307 24 523 28 ID0003 -3.055 0.018 6.934 0.009 -3.358 0.020 7.474 0.010 18.9 0.5-303 27 540 13 ID0004 2.678 0.002 0.050 0.007 2.409 0.002 0.586 0.006 15.9 0.3-269 3 536 9 ID0005 9.109 0.010 -3.397 0.024 8.852 0.009 -2.859 0.023 18.9 0.4-257 13 538 33 ID0006 -3.039 0.023 -8.884 0.010 -3.313 0.022 -8.375 0.010 16.8 0.4-274 32 509 14 ID0007 … … 8.801 0.046 17.394 0.025 18.0 0.3 … … ID0008 … … 3.383 0.042 16.147 0.013 18.5 0.3 … … ID0009 … … -2.847 0.021 7.972 0.009 19.7 0.3 … … ID0010 … … 3.063 0.012 4.392 0.008 18.9 0.3 … … ID0011 … … 2.610 0.024 9.054 0.009 20.0 0.3 … … ID0012 … … -8.037 0.045 17.125 0.023 19.9 0.3 … … ID0013 … … -11.710 0.010 -2.498 0.031 19.5 0.3 … … ID0014 … … -3.767 0.019 -7.102 0.011 19.4 0.3 … … HIP 104383 2003-11-07 ID0001-10.192 0.046 17.479 0.029 … … 16.2 0.3 … … ID0002 0.401 0.034 12.871 0.008 … … 17.5 0.3 … … ID0003-16.661 0.039 14.241 0.044 … … 16.5 0.3 … … ID0004 -4.384 0.003 -0.608 0.011 … … 17.8 0.3 … … ID0005 -4.876 0.003 -0.504 0.013 … … 15.7 0.3 … … 161616A list of unique sequential identifiers (prefix ’ID’) has been assigned to the candidates (1) (cf. Figs. 5-9). For each candidate, the separation from the central star in right ascension and declination is given for the first epoch (2, 3) and the second epoch when present (4, 5). Finally, apparent magnitude is given for all candidates (6) and - when two epochs are available - the change of separation (7,8). The change in separation reflects the stellar parallactic and proper motion since all candidates are background stars (see text and Table E). Large error bars in the magnitude measurement are ascribed to different causes. Those are indicated by letters to the column for error bars : $b$$b$footnotetext: smeared in first epoch
Appendix E Detection limits
 |
 |
 |
 |
 |
 |
 |
 |
 |
 |
 |
 |
 |
 |
 |
 |
 |
 |
 |
 |
 |
 |
 |
 |
 |