High star formation rates in turbulent atomic-dominated gas in the interacting galaxies IC 2163 and NGC 2207
Abstract
CO observations of the interacting galaxies IC 2163 and NGC 2207 are combined with HI, H and 24 m to study the star formation rate (SFR) surface density as a function of the gas surface density. More than half of the high SFR regions are HI dominated. When compared to other galaxies, these HI-dominated regions have excess SFRs relative to their molecular gas surface densities but normal SFRs relative to their total gas surface densities. The HI-dominated regions are mostly located in the outer part of NGC 2207, where the HI velocity dispersion is high, 40 - 50 km s-1. We suggest that the star-forming clouds in these regions have envelopes at lower densities than normal, making them predominantly atomic, and cores at higher densities than normal because of the high turbulent Mach numbers. This is consistent with theoretical predictions of a flattening in the density probability distribution function for compressive, high Mach number turbulence.
1 Introduction
The galaxies IC 2163 and NGC 2207 are undergoing a grazing collision with perigalacticon Myr ago (Struck et al., 2005). The tidal force exerted on IC 2163 by NGC 2207 is prograde and nearly in-plane. It produces an intrinsically ocular structure (a cuspy oval) at mid-radius in IC 2163 and two tidal arms. A narrow ridge along the ocular appears to be a galactic-scale shock front with intense star formation, several super-star clusters including one measuring (Elmegreen et al., 2001), and an IR-to-radio continuum ratio ([8 µm]/) that is a factor of 2 higher than elsewhere in the galaxies (Kaufman et al., 2012). HI observations (Elmegreen et al., 1995a) reveal photometric and kinematic major axes in IC 2163 that are nearly orthogonal, indicating high speed streaming motions. The tidal force exerted on NGC 2207 by IC 2163 is mostly perpendicular to NGC 2207, causing a velocity perturbation in NGC 2207 that is km s-1 in places, and suggesting a warp with 15 kpc vertical distortion (Elmegreen et al., 1995b).
Both galaxies have large HI velocity dispersions of km s-1, and several large HI cloud complexes with masses of or more (Elmegreen et al., 1993, 1995a). IC 2163 has an HI tidal bridge behind the eastern half of NGC 2207, and NGC 2207 has an HI spiral arm (visible also optically) in front of IC 2163 (see Figures in Elmegreen et al., 2000, where the HI contours are overlaid on an HST image).
NGC 2207 contains a peculiar region, Feature i, called a mini-starburst by Kaufman et al. (2012). This is the brightest source for either galaxy in radio continuum, 8 µm, 24 µm and ; it accounts for one-quarter of the total 24 µm flux for both galaxies combined. At 6 cm, the radio continuum luminosity of Feature i is 13% of the radio continuum luminosity of the central starburst in M82. Soft X-ray emission was found by Mineo et al. (2014).
We observed NGC 2207/IC 2163 in CO(1-0) with the Atacama Large Millimeter Array (ALMA). The present paper is devoted to determining the spatially-resolved Kennicutt-Schmidt (Kennicutt & Evans, 2012) relation in this galaxy pair. We are interested in whether this relation on a scale of kpc diameter differs from that in other galaxies, and whether it is the same in both galaxies here. We combine the ALMA CO observations with our previous HI, 24 µm, and data to determine the star formation rate (SFR) surface density, , as a function of atomic, molecular, and total gas surface densities. Other properties of these CO observations will be discussed in Kaufman et al. (2016).
In what follows, Section 2 describes the observations, Section 3 gives the luminosities, SFRs, and surface densities of the selected regions, Section 4 shows the relations between and the gas surface density, and Section 5 discusses the implications.
2 Observations
IC 2163 and NGC 2207 were observed in 34 pointings using ALMA at the 12CO(1-0) frequency of 115.27 GHz ( 2.6 mm). We made naturally weighted maps of CO emission with a point spread function of (HPBW), beam position angle , and channel width km s-1. The rms noise per channel is mJy beam-1 and a CO surface brightness of 1 Jy beam-1 corresponds to K. To select areas of genuine CO emission, we made a blanking mask by convolving this cube to HPBW, where the noise was 7.9 mJy/beam. Regions were left unblanked if they exceeded 2.5 times this rms noise for at least 2 adjacent channels in an area of at least 1 arc sec. This means that regions with line-of-sight pc-2 were blanked out. After correcting for primary beam attenuation, we made the pixel channel subcube used in this paper that contains all of the unblanked CO emission. In the subcube, the product of the rms noise and the channel width is equivalent to a line of sight pc-2, which is a measure of our uncertainty. (The apertures A10, A16, A33, A38, and A39 discussed below have mean values of line-of-sight below this because of blanked pixels.) The total integrated CO line flux in the subcube is Jy km s-1. For more details on the observing procedure, see Kaufman et al. (2016).
To convert CO emission into molecular mass , we use H2 cm-2 (K km s-1)-1 from Dame et al. (2001) and a distance Mpc from the NASA/IPAC Extragalactic Database (NED) for a Hubble constant of km s-1 Mpc-1 corrected for infall towards Virgo. The scale is 170 pc per arcsec. To convert surface density to face-on, we took inclinations of for IC 2163 and for NGC 2207 (Elmegreen et al., 1995b). We discuss the implications of different and in Section 4.
The 24 µm flux density, , of Feature i and the galaxies as a whole were measured from the MIPS 1 pBCD image obtained from the Spitzer archive in 2013; the resolution is . Other star-forming regions were measured on the HiRes deconvolution image ( resolution) by Velusamy et al. (2008), who provided their HiRes 24 µm data to us as a FITS image 111MIPS 1 BCD images from Spitzer prior to April 2007 suffer from two software bugs which cause the brightness of sources as bright as Feature i to be underestimated. We compared our Spitzer 24 µm MIPS 1 pBCD (level 2) image retrieved from the Spitzer archive in 2013 with the MIPS 1 image in Elmegreen et al. (2006). We found that Feature i was the only source in NGC 2207/IC 2163 affected by the software bug, and that its flux density is a factor of 1.9 times greater than in Elmegreen et al. (2006) and Kaufman et al. (2012). Thus Feature i accounts for 23%, rather than 12%, of the 24 µm flux density from the galaxy pair. We use the corrected flux here.. According to Velusamy et al., the HiRes deconvolution conserves fluxes of point sources to better than 5%. This uncertainty is in addition to the 5% uncertainty in the MIPS 1 photometric calibration. The HiRes deconvolution has about the same resolution as our CO data. This high resolution minimizes line-of-sight corrections for diffuse emission at 24 µm that is not coincident with the star-forming region (Leroy et al., 2012). The absolute calibration of the 24 µm term in the SFR leads to an uncertainty of about 25% in the absolute determination of the SFR (Leroy et al., 2012).
The HI is from VLA observations obtained in 1990 using a hybrid CnB array with an extended north arm to compensate for the low latitude of the source. The duration on source was 6 hours (for more details, see Elmegreen et al., 1995a). The map representing column density, , comes from an HI cube with a channel width of 21 km s-1, rms noise 0.73 mJy beam-1, and FWHM of the point spread function equal to . The product of the rms noise times the channel width is equivalent to a line-of-sight pc-2. Before creating the HI column density map, the HI data cube was masked in a similar manner to the CO data described above; none of our apertures contain blanks in HI.
The H data stem from narrowband H images and broadband images obtained by Deidre Hunter with the Lowell 1.1m telescope in 1999 (Elmegreen et al., 2001). Four H images were combined for a total time of 3600 s, and three R band images were combined for a total of 900 s. The narrow filter excludes the redshifted [NII] line at 6583 Å, but includes the 6548 Å line, which may contribute as much as 15% of the light for solar metallicity. Considering equation 1 below, a systematic 15% decrease in the H flux after removal of [NII] amounts to an average decrease in of 5%.
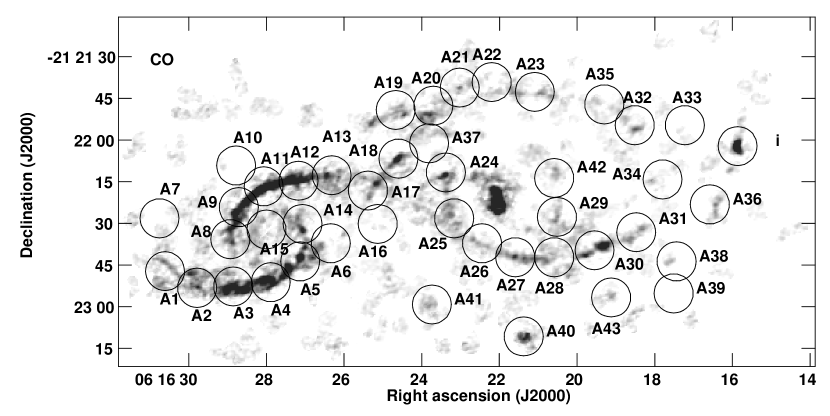
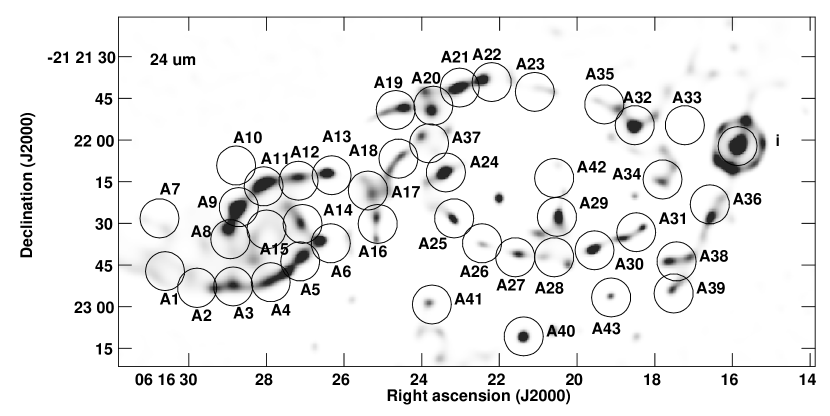
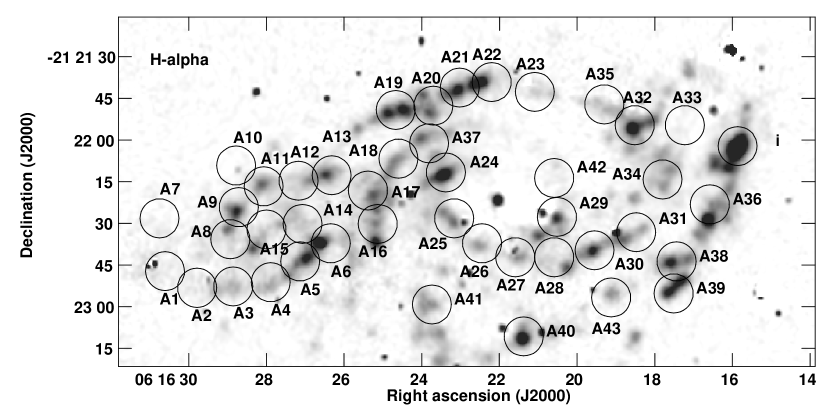
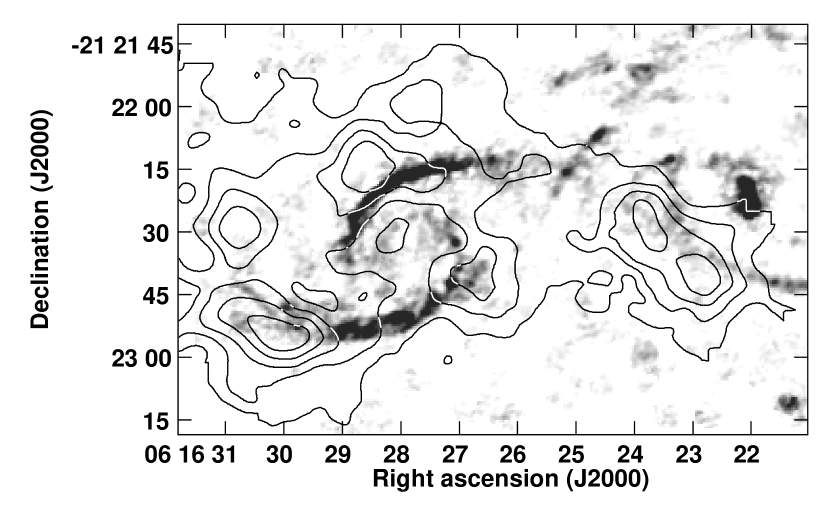
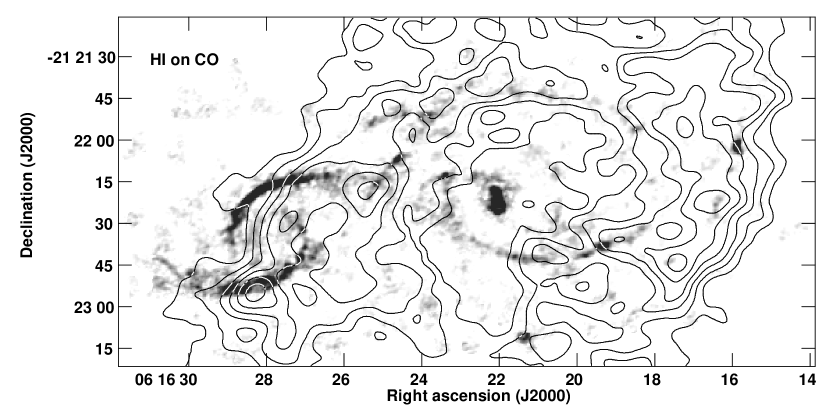
Figure 1 displays the chosen regions as circular apertures overlaid on the CO integrated intensity image, the HiRes m image, and the image, which has a point spread function of . The apertures were selected to have minimal overlap and to enclose regions with prominent 24 µm, , CO and/or HI emission. They include three of the massive HI clouds in IC 2163 (I2, I3, I5) and four in NGC 2207 (N2, N3, N4, N6), even though some have little star formation. Figure 2 shows the HI contours on CO for IC 2163 (top) and NGC 2207 (bottom), where the separate HI contributions from each galaxy were determined from the line kinematics. For IC 2163 the lowest contour level is pc-2, which is equivalent to three times the rms noise over 2 channel widths. For NGC 2207 we omitted this contour level for clarity.
Table 1 compares global values of , , the 24 µm flux density, , and the flux, , for the fields displayed in Figure 1. For the values of , , and , we chose a right ascension of as the dividing line between IC 2163 and NGC 2207. For , we included the tidal bridge of IC 2163 behind NGC 2207 and the spiral arm of NGC 2207 in front of IC 2163. The values listed under (total) include the HI emission outside the field in Figure 1; the values listed under (CO field) are only for the field in that figure. For IC 2163, the value of measured on the HiRes image is 84% of that measured on the MIPS 1 pBCD image (the HiRes image is less sensitive to faint extended emission).
Table 1 indicates that IC 2163 has a total molecular mass , which corresponds to an integrated CO line flux of 240 Jy km s-1, and NGC 2207 has for a CO line flux of 265 Jy km s-1. If we restrict the HI to the field of Figure 1, then the global ratio of molecular to atomic gas is 4 times greater in IC 2163 than in NGC 2207. For most of the 15 apertures in IC 2163 (except those on the massive HI clouds), the column density ) dominates , while for most of the 29 apertures in NGC 2207, . Thus, the eyelid shock in IC 2163 is currently more effective than the spiral arms of NGC 2207 in converting HI to H2. Also, the global ratio of to 24 µm flux density is times greater in IC 2163 than in NGC 2207, and the global ratio of to flux is times greater in IC 2163 than in NGC 2207. These molecular excesses compared to star formation in IC 2163 are not as large as the molecular excesses compared to atomic gas as traced by HI. This difference suggests that the encounter has converted a high fraction of HI into H2 in IC 2163 but has not (yet) converted the additional molecules into stars.
3 Star formation rates
A combination of the continuum-subtracted image (Elmegreen et al., 2001) and the Spitzer MIPS 24 µm image was used to obtain the SFR, following Kennicutt et al. (2009),
| (1) |
where and are in erg s-1, and . We chose source apertures with a diameter of kpc. This choice was governed by the HI resolution and by the need to have a sufficiently large aperture to avoid stochastic effects from including too few O stars when using H as a star-formation tracer.
For the 24 µm measurement of Feature i, we did a local background subtraction and applied an aperture flux correction factor of 1.61 from the MIPS Instrument Handbook222http://irsa.ipac.caltech.edu/data/SPITZER/docs/mips/mipsinstrumenthandbook/. It was not necessary to remove background for the CO or HI sources, nor for the other HiRes 24 µm sources. For , we did a global background subtraction but not a local subtraction because there would be contamination from adjacent sources in many cases.
Foreground Galactic extinction mag from NED (using Schlafly & Finkbeiner, 2011) gives an extinction at equal to mag. In addition, IC 2163 is affected by extinction from the foreground spiral arm of NGC 2207. Since the outer part of NGC 2207 is likely to be metal poor, we take for this region (Elmegreen et al., 2001). This additional extinction is applied to 8 of the 15 regions in IC 2163. These 8 have the highest foreground and the largest corrections ( mag), with an average mag from the foreground HI in NGC 2207. We assume that and 24 µm emission from the foreground part of NGC 2207 are negligible.
Table 2 compiles the locations, luminosities, SFRs, , and surface densities for H2 and HI in all of the chosen apertures. The regions associated with massive HI clouds are indicated by the footnote h. The SFR is lower than 0.001 in the massive HI cloud apertures A10 and A33. This is below the limit suggested by Leroy et al. (2012) where the SFR can be reliably determined using the above method; the actual values do not contribute to the conclusions of this paper.
4 Star formation - surface density correlation
The conventional way to consider star formation on galactic scales is in terms of the correlation between and gas surface density (the “Kennicutt-Schmidt” relation), either for HI (), H2 (), or the sum of these (Kennicutt & Evans, 2012).
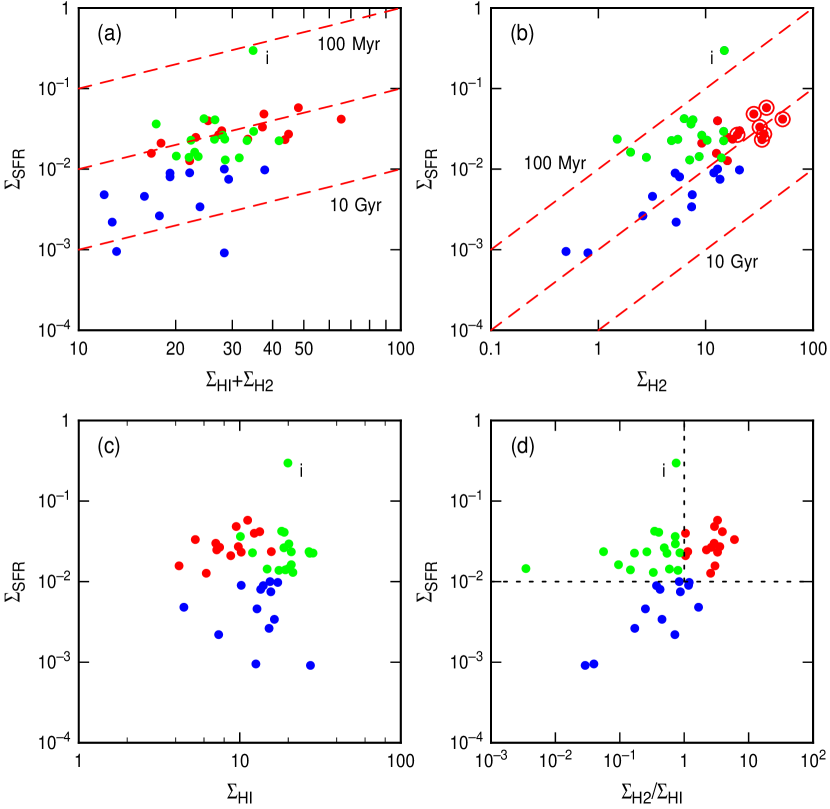
Figure 3 shows these correlations. Figure 3(a) has the total gas relation, Figure 3(b) has H2 alone, 3(c) has HI alone, and 3(d) shows versus , the molecular ratio. Figure 3(d) is divided into three parts: where , the green points are for a molecular ratio less then 1 and the red points are for a molecular ratio greater than 1. Where , the blue points are plotted for all molecular ratios. These colors have the same meaning in the other panels.
First consider the molecular relation in Figure 3(b). In the THINGS survey (Bigiel et al., 2008; Leroy et al., 2008), this was linear with a constant consumption time per CO molecule of 1-2 Gyr. This is the case here too, but only for the red and blue points, i.e., for the molecular-dominated gas at high SFR and all of the gas at low SFR. The HI-dominated gas at high SFR (green points) lies high off the linear molecular relation. The scatter in the molecular Kennicutt-Schmidt relation in Bigiel et al. (2008) is dex for , which is three times smaller than the displacement of the green points from the red+blue point correlation in Figure 3(b). The H2 consumption time for the HI-dominated gas is Myr, which is relatively fast compared to the time for the H2-dominated gas. The red circles around the points are for locations in the ocular rim of IC 2163.
The total-gas relation in Figure 3(a) has a consumption time for total gas of about 1 Gyr in regions with high SFRs (green and red points). This time is normal for molecular gas, but here it includes HI and also applies in HI-dominated regions (green points). The blue points (low SFR) have longer total-gas consumption times, between and 10 Gyr.
In Figure 3(c), the molecular-dominated regions (red points) have relatively low HI and the HI-dominated regions (green points) have relatively high HI. The values for the HI surface density in the HI-dominated, high SFR regions are unusually high: is greater than pc-2 in many cases, which is twice as large as the saturated value of HI in the THINGS survey (Bigiel et al., 2008; Leroy et al., 2008).
What is peculiar about these relationships is the HI. If we ignore the HI-rich, high SFR regions (green points), then the molecular relation in Figure 3(b) is normal; the nearly constant up to pc-2 for the high-SFR regions (red points) in Figure 3(c) is normal, and the steady increase in with molecular fraction in Figure 3(d) is normal. In these galaxies, however, there is a component of high HI column density gas where the SFR is high also. The HI is replacing some fraction of the molecules, giving a linear relation when the SFR is plotted against the total gas (Fig. 3(a)). Similarly, the HI-dominated regions lie off the normal linear law when the SFR is plotted versus only the molecular part of the gas (Fig. 3(b)). We also note that the molecular ratio increases with decreasing (not shown) suggesting more optical extinction in the star-forming cores when the molecular content is high.
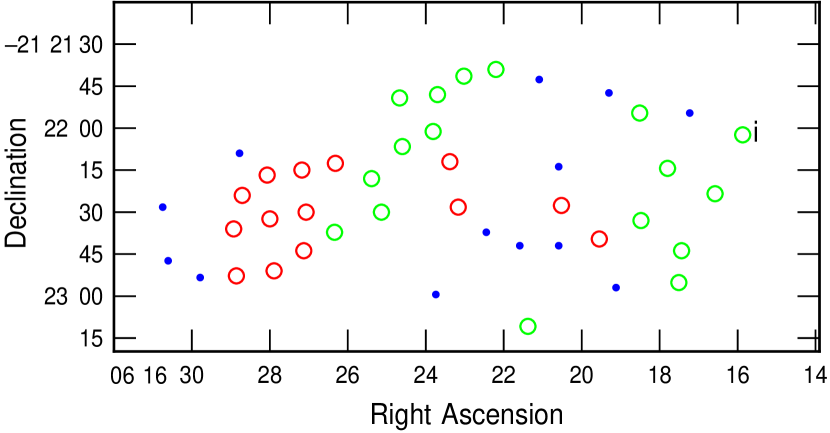
Figure 4 shows the locations of these three types of regions on the sky using the same color scheme as in Figure 3. The HI-rich regions of high are on the periphery of the galaxy that underwent the retrograde, perpendicular encounter (NGC 2207) and are globally coincident with the areas of high HI velocity dispersion in that galaxy (see Elmegreen et al. 1995a). The H2-rich regions of high are mainly in the ocular ridge of IC 2163 where in-plane tidal forces produced a compression. The low regions are scattered across both galaxies.
Feature i in each panel (denoted by “i”) has at least a factor of higher than in any other region. The molecular mass of Feature i is , which is not unusual for these 2.4 kpc diameter apertures. In IC 2163, 11 of the 15 apertures have molecular masses greater than this (Table 2), and the mass in region A9 is 2.5 times greater. However, because of the high SFR, the molecular gas consumption time for Feature i, Myr, is much shorter than for the other regions, and the total gas consumption time, Myr, is shorter too, as indicated by the positions of Feature i relative to the dashed red lines in Figures 3(b) and (a), respectively.
A lower as suggested for some interacting galaxies and in Bournaud et al. (2015) would decrease the H2 mass and strengthen the conclusion that there are HI-rich star-forming regions with peculiar cloud structure. A higher would bring the H2 content of these regions in line with the CO-bright regions, but then would have to vary from cloud to cloud and be high primarily in the outer parts of NGC 2207, where the peculiar HI gas is. These outer parts are not so remote that low metallicities and an associated high are expected. Higher is also unlikely because the high velocity dispersion should lower the CO opacity by broadening the line, producing more CO emission per unit H2 molecule (Bournaud et al., 2015). Inclination effects would not seem to be causing the peculiar HI either. The suspected warp in NGC 2207 occurs about where this HI is, but correcting for that by lengthening the line-of-sight for gas emission only strengthens the conclusions because it lowers the average density for the observed column of HI and makes star formation slower, when in fact it is faster than normal. Changing the inclination slides points parallel to the lines of constant gas consumption time in the Kennicutt-Schmidt relation because it affects the deprojected areas used for the ordinate and abscissa equally.
A second version of Figure 4 was made (not shown) with all of the images convolved to resolution before the measurements were made inside the same apertures. This change had the effect of decreasing the fluxes used for the SFRs and by factors between 0.5 and 0.9, and that moved the points in the figure slightly down and to the left in a direction nearly parallel to the lines of constant consumption time. Considering the wings of the Gaussian, this is the expected reduction factor for a small source located somewhere in the aperture when the aperture diameter is the same as the FWHM of the point spread function in the convolved image. None of the conclusions of this paper were affected by this change.
5 Discussion
HI-dominated regions with high SFRs are unusual and could be related to the high turbulent speeds in this interacting pair. The mean HI velocity dispersion for the 16 green circles in N2207 (Fig. 4) is 42 km s-1, compared to km s-1 in normal galaxies (Tamburro et al., 2009). An interaction perturbs the smooth circular flow of gas and causes deflected streams to intersect each other at high speeds, producing shocks and a turbulent cascade. Numerical simulations show this effect (Wetzstein et al., 2007; Bournaud et al., 2011a; Powell et al., 2013). Some turbulent energy in NGC 2207 may also come from excited vertical motions. High velocity dispersions in interacting systems were also reported by Kaufman et al. (1999), Rich et al. (2015) and others. In comparison, the THINGS galaxies and most others used for the conventional SFR-gas correlations are not interacting.
Stronger shocks imply a greater compressive component to the turbulence, as opposed to a normally dominant rotational component (Federrath et al., 2008, 2010). Tidal forces can increase the compressive mode too (Renaud et al., 2014). As a result, the probability distribution function for density flattens from an approximately log-normal (Nolan et al., 2015) shape to a broad distribution where a large amount of low-density atomic gas co-exists with a large amount of high-density star-forming gas (Federrath, 2013; Federrath & Klessen, 2013; Bournaud et al., 2011b; Renaud et al., 2012). The star formation rate may scale with the mass of the high density gas as usual (e.g., Evans et al., 2014; Clark & Glover, 2014). Physically, this implies a change in the structure of clouds toward more extended HI envelopes around denser H2 and CO cores.
The molecular envelop traced by CO in a self-gravitating cloud usually contributes to the gas surface density in the molecular star formation law. Here, the envelopes may be puffed up with high velocity dispersions, giving them low densities and a transparency that keeps them predominantly atomic. Then the envelopes act physically like the CO envelopes of star-forming clouds in non-interacting galaxies, but produce a star formation law with a significant amount of HI and dark substituted for CO-bright gas.
Another possibility for the HI-rich regions of high SFR is that there is large-scale synchronization of star formation in NGC 2207, starting at perigalacticon Myr ago, whereby many of the giant molecular clouds formed in the outer parts have just now dispersed into HI before their OB associations have significantly faded.
References
- Bigiel et al. (2008) Bigiel, F., Leroy, A., Walter, F., Brinks, E., de Blok, W. J. G., Madore, B., & Thornley, M. D. 2008, AJ, 136, 2846
- Bournaud et al. (2011a) Bournaud, F., Chapon, D., Teyssier, R., et al. 2011, ApJ, 730, 4
- Bournaud et al. (2011b) Bournaud, F., Powell, L. C., Chapon, D., & Teyssier, R. 2011a, in IAU Symp. 271, Star Formation in Galaxy Mergers: ISM Turbulence, Dense Gas Excess, and Scaling Relations for Disks and Starbursts, ed. N. H. Brummell, A. S. Brun, M. S. Miesch, & Y. Ponty (Cambridge: Cambridge Univ. Press), 160
- Bournaud et al. (2015) Bournaud, F., Daddi, E., Weiss, A., Renaud, F., Mastropietro, C., Teyssier, R. 2015, A&A, 575, A56
- Clark & Glover (2014) Clark, P.C., & Glover, S.C.O. 2014, MNRAS, 444, 2396
- Dame et al. (2001) Dame, T.M., Hartmann, D., & Thaddeus, P. 2001, ApJ, 655, 863
- Elmegreen et al. (1993) Elmegreen, B.G., Kaufman, M., & Thomasson, M. 1993, ApJ, 412, 90
- Elmegreen et al. (1995a) Elmegreen, D.M., Kaufman, M., Brinks, E., Elmegreen, B.G., Sundin, M. 1995, ApJ, 453, 100
- Elmegreen et al. (1995b) Elmegreen, B.G., Sundin, M., Kaufman, M., Brinks, E., Elmegreen, D.M. 1995, ApJ, 453, 139
- Elmegreen et al. (2000) Elmegreen, B.G., Kaufman, M., Struck, C., et al. 2000, AJ, 120, 630
- Elmegreen et al. (2001) Elmegreen, D.M., Kaufman, M., Elmegreen, B.G., Brinks, E., Struck, C., Klaric, M., & Thomasson, M. 2001, AJ, 121, 182
- Elmegreen et al. (2006) Elmegreen, D.M., Elmegreen, B.G., Kaufman, M., Sheth, K., Struck, C., Thomasson, M., Brinks, E. 2006, ApJ, 642, 158
- Evans et al. (2014) Evans, N.J., II., Heiderman, A., & Vutisalchavakul, N. 2014, ApJ, 782, 114
- Federrath et al. (2008) Federrath, C., Klessen, R.S., & Schmidt, W. 2008, ApJL, 688, L79
- Federrath et al. (2010) Federrath, C., Roman-Duval, J., Klessen, R. S., Schmidt, W., Mac Low, M.-M. 2010, A&A, 512, A81
- Federrath (2013) Federrath, C. 2013, MNRAS, 436, 1245
- Federrath & Klessen (2013) Federrath, C. & Klessen, R.S. 2013, ApJ, 763, 51
- Kaufman et al. (1999) Kaufman, M., Brinks, E., Elmegreen, B.G., Elmegreen, D.M., Klaric, M., Struck, C., Thomasson, M., Vogel, S. 1999, AJ, 118, 1577
- Kaufman et al. (2012) Kaufman, M., Grupe, D., Elmegreen, B. G., Elmegreen, D.M., Struck, C., Brinks, E. 2012, AJ, 144, 156K
- Kaufman et al. (2016) Kaufman, M., et al. 2016, in preparation
- Kennicutt et al. (2007) Kennicutt, R.C., Jr., Calzetti, D., Walter, F., et al. 2007, ApJ, 671, 333
- Kennicutt et al. (2009) Kennicutt, R.C., Jr., Hao, C.-N., Calzetti, D., Moustakas, J., Dale, D.A., Bendo, G., Engelbracht, C.W., Johnson, B.D., & Lee, J.C. 2009, ApJ, 703, 1672
- Kennicutt & Evans (2012) Kennicutt, R.C., & Evans, N.J. 1 2012, ARA&A, 50, 531
- Leroy et al. (2008) Leroy, A.K., Walter, F., Brinks, E., Bigiel, F., de Blok, W. J. G., Madore, B., & Thornley, M. D. 2008, AJ, 136, 2782
- Leroy et al. (2012) Leroy, A.K., Bigiel, F., de Blok, W.J.G., et al., 2012, AJ, 144, 3L
- Mineo et al. (2014) Mineo, S., Rappaport, S., Levine, A., Pooley, D., Steinhorn, B., Homan, J. 2014, ApJ, 797, 91
- Nolan et al. (2015) Nolan, C. A., Federrath, C., Sutherland, R. S. 2015, MNRAS, 451, 1380
- Powell et al. (2013) Powell, L.C., Bournaud, F., Chapon, D., & Teyssier, R. 2013, MNRAS, 434, 1028
- Renaud et al. (2012) Renaud, F., Kraljic, K., & Bournaud, F. 2012, ApJL, 760, L16
- Renaud et al. (2014) Renaud, F., Bournaud, F., Kraljic, K., Duc, P.-A. 2014, MNRAS, 442, L33.
- Rich et al. (2015) Rich, J.A., Kewley, L.J., & Dopita, M.A. 2015, ApJS, 221, 28
- Schlafly & Finkbeiner (2011) Schlafly & Finkbeiner 2011, ApJ, 737, 103
- Schneider et al. (2015) Schneider, N., Ossenkopf, V., Csengeri, T., Klessen, R. S., Federrath, C., Tremblin, P., Girichidis, P., Bontemps, S., André, Ph. 2015, A&A, 575, A79
- Smith et al. (1991) Smith, P.A., Brand, P.W.J.L., Mountain, C.M., Puxley, P.J., & Nakai, N. 1991, MNRAS, 252, 6P
- Struck et al. (2005) Struck, C., Kaufman, M., Brinks, E., Thomasson, M., Elmegreen, B.G., & Elmegreen, D.M. 2005, MNRAS, 364, 69
- Tamburro et al. (2009) Tamburro, D., Rix, H.-W., Leroy, A. K., Mac Low, M.-M., Walter, F., Kennicutt, R. C., Brinks, E., & de Blok, W. J. G. 2009, AJ, 137, 4424
- Ueda et al. (2012) Ueda, J., Iono, D., Petitpas, G., et al. 2012, ApJ, 745, 65
- Velusamy et al. (2008) Velusamy, T., Marsh, K. A., Beichman, C. A., Backus, C. R., & Thompson, T. J. 2008, AJ, 136, 197
- Wetzstein et al. (2007) Wetzstein, M., Naab, T., Burkert, A. 2007, MNRAS, 375, 805
- Wild et al. (1992) Wild, W., Harris, A.J., Eckart, A., et al. 1992, A&A, 265, 447
| Galaxy | |||||
|---|---|---|---|---|---|
| () | () | () | (mJy) | (erg cm-2 s-1) | |
| IC 2163 | |||||
| NGC 2207 |
| ID | R.A. | Dec. | (24 µm)bb(24µm) is at 24 . | cc(H) is corrected for Galactic foreground extinction using = 0.186 mag. for apertures A3, A4, A5, A6, A12, A13, A14, and A15 have also been corrected for foreground extinction by the outer arm of NGC 2207 in front of IC 2163. The latter correction (see text) amounts to an average of mag at . | SFRddSFR(M⊙ yr-1) = (erg s. | eeSurface densities have been corrected to face-on using for IC 2163 and for NGC 2207. | eeSurface densities have been corrected to face-on using for IC 2163 and for NGC 2207. | eeSurface densities have been corrected to face-on using for IC 2163 and for NGC 2207. |
|---|---|---|---|---|---|---|---|---|
| (J2000) | (J2000) | |||||||
| IC 2163 | ||||||||
| A1g,hg,hfootnotemark: | 30.612 | 22 47.20 | 19.2 | 0.195 | 0.0435 | 0.00748 | 13.6 | 15.6 |
| A2hhIn IC 2163, apertures A1 and A2 are on parts of the massive HI cloud I3, A7 is on I2, and A10 and A11 are on parts of I5. In NGC 2207, apertures A17, A33, A36, and A38 are on massive HI clouds N6, N2, N3, and N4, respectively. | 29.789 | 22 53.21 | 24.6 | 0.270 | 0.0568 | 0.00977 | 20.6 | 17.2 |
| A3 | 28.858 | 22 52.71 | 60.9 | 0.990 | 0.158 | 0.0272 | 35.0 | 9.8 |
| A4 | 27.892 | 22 51.21 | 75.9 | 1.16 | 0.193 | 0.0332 | 31.9 | 5.3 |
| A5 | 27.133 | 22 43.71 | 93.1 | 2.20 | 0.280 | 0.0482 | 28.1 | 9.5 |
| A6 | 26.345 | 22 37.21 | 53.7 | 2.17 | 0.211 | 0.0363 | 7.3 | 10.1 |
| A7hhIn IC 2163, apertures A1 and A2 are on parts of the massive HI cloud I3, A7 is on I2, and A10 and A11 are on parts of I5. In NGC 2207, apertures A17, A33, A36, and A38 are on massive HI clouds N6, N2, N3, and N4, respectively. | 30.755 | 22 28.20 | 5.7 | 0.101 | 0.0153 | 0.00263 | 2.6 | 15.2 |
| A8 | 28.930 | 22 35.71 | 73.3 | 0.539 | 0.155 | 0.0267 | 19.7 | 7.5 |
| A9 | 28.715 | 22 24.21 | 174. | 0.727 | 0.336 | 0.0578 | 36.9 | 11.2 |
| A10hhIn IC 2163, apertures A1 and A2 are on parts of the massive HI cloud I3, A7 is on I2, and A10 and A11 are on parts of I5. In NGC 2207, apertures A17, A33, A36, and A38 are on massive HI clouds N6, N2, N3, and N4, respectively. | 28.783 | 22 09.21 | 0.15 | 0.086 | 0.0055 | 0.00095 | 0.5 | 12.6 |
| A11hhIn IC 2163, apertures A1 and A2 are on parts of the massive HI cloud I3, A7 is on I2, and A10 and A11 are on parts of I5. In NGC 2207, apertures A17, A33, A36, and A38 are on massive HI clouds N6, N2, N3, and N4, respectively. | 28.071 | 22 16.71 | 123. | 0.586 | 0.242 | 0.0416 | 52.0 | 13.3 |
| A12 | 27.175 | 22 14.71 | 43.3 | 1.11 | 0.135 | 0.0232 | 33.5 | 10.2 |
| A13 | 26.320 | 22 12.71 | 52.2 | 1.55 | 0.174 | 0.0299 | 20.7 | 7.1 |
| A14 | 27.072 | 22 30.21 | 44.5 | 1.23 | 0.144 | 0.0248 | 15.9 | 7.2 |
| A15 | 27.999 | 22 32.21 | 21.6 | 0.984 | 0.0910 | 0.0157 | 12.6 | 4.2 |
| NGC 2207 | ||||||||
| A16 | 25.135 | 22 30.21 | 23.5 | 0.875 | 0.0882 | 0.0162 | 2.0 | 20.9 |
| A17hhIn IC 2163, apertures A1 and A2 are on parts of the massive HI cloud I3, A7 is on I2, and A10 and A11 are on parts of I5. In NGC 2207, apertures A17, A33, A36, and A38 are on massive HI clouds N6, N2, N3, and N4, respectively. | 25.386 | 22 18.21 | 44.0 | 0.862 | 0.122 | 0.0225 | 14.7 | 27.2 |
| A18 | 24.599 | 22 06.71 | 25.3 | 0.576 | 0.0748 | 0.0138 | 14.0 | 17.5 |
| A19 | 24.670 | 21 49.21 | 47.3 | 1.13 | 0.143 | 0.0263 | 9.2 | 18.8 |
| A20 | 23.704 | 21 47.71 | 61.0 | 1.02 | 0.160 | 0.0294 | 14.7 | 20.2 |
| A21 | 23.024 | 21 41.21 | 92.9 | 1.17 | 0.223 | 0.0410 | 7.6 | 18.9 |
| A22 | 22.200 | 21 39.21 | 47.7 | 0.834 | 0.127 | 0.0234 | 5.5 | 20.9 |
| A23 | 21.091 | 21 42.71 | 4.9 | 0.182 | 0.0183 | 0.0034 | 7.4 | 16.4 |
| A24 | 23.381 | 22 11.71 | 88.0 | 1.20 | 0.216 | 0.0398 | 12.9 | 12.3 |
| A25 | 23.167 | 22 28.21 | 22.2 | 0.570 | 0.0692 | 0.0127 | 15.9 | 6.2 |
| A26 | 22.450 | 22 37.21 | 4.2 | 0.339 | 0.0259 | 0.0048 | 7.5 | 4.5 |
| A27 | 21.592 | 22 42.21 | 15.3 | 0.411 | 0.0487 | 0.0090 | 11.9 | 10.2 |
| A28 | 20.589 | 22 42.21 | 15.2 | 0.513 | 0.0541 | 0.0100 | 12.9 | 15.4 |
| A29 | 20.519 | 22 27.71 | 49.3 | 0.551 | 0.114 | 0.0210 | 9.2 | 8.8 |
| A30 | 19.551 | 22 39.71 | 51.5 | 0.736 | 0.128 | 0.0236 | 17.8 | 15.7 |
| A31 | 18.477 | 22 33.21 | 24.7 | 0.516 | 0.0705 | 0.0130 | 7.1 | 21.4 |
| A32 | 18.514 | 21 54.71 | 96.8 | 1.19 | 0.230 | 0.0423 | 6.3 | 18.2 |
| A33hhIn IC 2163, apertures A1 and A2 are on parts of the massive HI cloud I3, A7 is on I2, and A10 and A11 are on parts of I5. In NGC 2207, apertures A17, A33, A36, and A38 are on massive HI clouds N6, N2, N3, and N4, respectively. | 17.225 | 21 54.71 | 0.090 | 0.0050 | 0.00091 | 0.8 | 27.5 | |
| A34 | 17.798 | 22 14.21 | 22.9 | 0.670 | 0.0759 | 0.0140 | 2.8 | 19.2 |
| iffFeature i | 15.865 | 22 02.21 | 866. | 2.39 | 1.606 | 0.296 | 14.9 | 19.9 |
| A36hhIn IC 2163, apertures A1 and A2 are on parts of the massive HI cloud I3, A7 is on I2, and A10 and A11 are on parts of I5. In NGC 2207, apertures A17, A33, A36, and A38 are on massive HI clouds N6, N2, N3, and N4, respectively. | 16.580 | 22 23.21 | 40.5 | 0.972 | 0.123 | 0.0226 | 4.8 | 28.5 |
| A38hhIn IC 2163, apertures A1 and A2 are on parts of the massive HI cloud I3, A7 is on I2, and A10 and A11 are on parts of I5. In NGC 2207, apertures A17, A33, A36, and A38 are on massive HI clouds N6, N2, N3, and N4, respectively. | 17.439 | 22 43.71 | 40.7 | 1.07 | 0.128 | 0.0236 | 1.5 | 26.9 |
| A39 | 17.511 | 22 55.21 | 17.6 | 0.883 | 0.0786 | 0.0145 | 0.07 | 20.0 |
| A40 | 21.377 | 23 10.71 | 44.5 | 0.872 | 0.124 | 0.0228 | 10.3 | 12.0 |
| A41 | 23.740 | 22 59.21 | 8.7 | 0.520 | 0.0433 | 0.0080 | 5.7 | 13.5 |
| A37 | 23.811 | 22 01.21 | 20.5 | 0.774 | 0.0776 | 0.0143 | 8.7 | 14.8 |
| A42 | 20.589 | 22 13.71 | 2.2 | 0.136 | 0.0112 | 0.0022 | 5.3 | 7.4 |
| A43 | 19.122 | 22 56.71 | 4.8 | 0.305 | 0.0249 | 0.0046 | 3.2 | 12.8 |
| A35 | 19.301 | 21 47.21 | 16.1 | 0.375 | 0.0481 | 0.0089 | 5.2 | 14.0 |