Double-phase transition and giant positive magnetoresistance in the quasi-skutterudite Gd3Ir4Sn13
Abstract
The magnetic, thermodynamic and electrical/thermal transport properties of the caged-structure quasi-skutterudite Gd3Ir4Sn13 are re-investigated. The magnetization , specific heat and the resistivity reveal a double-phase transition – at 10 K and at 8.8 K – which was not observed in the previous report on this compound. The antiferromagnetic transition is also visible in the thermal transport data, thereby suggesting a close connection between the electronic and lattice degrees of freedom in this Sn-based quasi-skutterudite. The temperature dependence of is analyzed in terms of a power-law for resistivity pertinent to Fermi liquid picture. Giant, positive magnetoresistance (MR) 80 is observed in Gd3Ir4Sn13 at 2 K with the application of 9 T. The giant MR and the double magnetic transition can be attributed to the quasi-cages and layered antiferromagnetic structure of Gd3Ir4Sn13 vulnerable to structural distortions and/or dipolar or spin-reorientation effects. The giant value of MR observed in this class of 3:4:13 type alloys, especially in a Gd-compound, is the highlight of this work.
I Introduction
are caged structure compounds in the class of
strongly correlated electron intermetallics where,
is either a rare-earth element, an early -block element
such as Sc or Y, or the alkali-earth metals Ca or Sr.
stands for a Group VIII -electron element,
and is either In, Ge, or Sn. The
compounds crystallize in
the cubic space group . Remeika et al.
Remeika et al. (1980)
were the first to report on phases but, the
literature refers to the archetypal
phase as either the Pr3Rh4Sn13-structure type
Vandenberg (1980), or the Yb3Rh4Sn13-type
Hodeau et al. (1980). This structure type allows a
single crystallographic site for occupation by each
of the and atoms, and two distinct sites are available
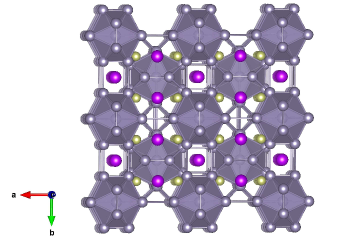
to the atom. A schematic of the crystal structure
is presented in Fig 1 showing the cage-like
structural network. attracted attention
mainly due to the discovery of superconductivity with superconducting
temperatures as high as = 8 K in
Yb3Rh4Sn13 and Ca3Rh4Sn13
Remeika et al. (1980) but this structure-type
has been of enduring interest due to its amenability
to many different elements and the wide
variety of physical properties.
Kase et al. (2011); Kulkarni et al. (2011)
Remeika et al., reported the crystal structure of
in a cubic primitive unit cell,Remeika et al. (1980)
however, also suggested face-centered and tetragonal
structures as possible unit cells.
Hodeau et al., reported a body-centered unit cell
for the same class of compounds.Hodeau et al. (1982)
Modifications to the cubic structure with changes in stoichiometry
were suggested in Ref.[7].Eisenmann and Schäfer (1986)
The first two reports on the crystal structure of
the germanides are from Segre et al.,
Segre, Braun, and Yvon (1981) and from Bruskov et al.,
Bruskov, Pecharskij, and Bodak (1986) who proposed a disordered
variant of the crystal structure where Ge atoms partially
occupy two different 24 sites. A positional disorder
of the atom or the formation of random mixture of
and atoms are known.
Mudryk et al. (2001); Niepmann et al. (2001)
Doubling of the unit cell has been observed with a
non-centrosymmetric space group in some
of the stannides ( = Sn) of .
Nagoshi et al. (2006); Bordet et al. (1991)
Stannides ( = Sn) in this class have been investigated
in some detail, for example, Ce3Ir4Sn13
Sato et al. (1993) and
Ce3Rh4Sn13Köhler et al. (2007)
are classified as heavy-fermion systems where high
effective mass or larger density of states at the Fermi
level have been observed. The stannide-
display superconductivity in the case of Rh4Sn13
(for = La, Yb, Ca, Sr, Th) while antiferromagnetism
for Gd and Eu.Hodeau et al. (1982)
A double-magnetic phase transition at
0.6 K and 2.1 K is exhibited by
the Ce-based stannide, Ce3Ir4Sn13.
Nagoshi et al. (2005)
On the other hand, Eu3Ir4Sn13 where
Eu shows valence fluctuation between non-magnetic
Eu3+ (4) and magnetic Eu2+ (4),
shows an antiferromagnetic phase transition at 10 K.
Mendonça-Ferreira et al. (2006)
Nagoshi et al., studied single crystals of Gd3Ir4Sn13
using magnetic susceptibility, resistivity, Hall effect and
epithermal neutron scattering.Nagoshi et al. (2006)
They identified a structural distortion characterized by the
propagation vector (1/2, 1/2, 0). Only a single magnetic transition
was identified at 10 K from macroscopic measurements.
The magnetic moment direction of Gd in the ordered state
is suggested to be perpendicular to the chain axis in each
magnetic sublattice.Nagoshi et al. (2006)
Antiferromagnetic interactions in one-dimensional
chains together with ferromagnetic interaction between
the nearest chains in the same sublattice was assumed to
be the reason behind the phase transition at 10 K.
Sn13 compounds have been, in fact, reported to display
multiple phase transitions in close temperature intervals.
For example, Eu3Ir4Sn13 is reported to show two
transitions in resistivity and specific heat occurring at
57 K and at 10 K.
Mendonça-Ferreira et al. (2015, 2006)
The transition at was attributed to a structural
distortion due to the displacement of Sn ions in the
Sn(1)Sn(2)12 cages while the transition at was
attributed to antiferromagnetic ordering.
Interestingly, the structural distortion and the
antiferromagnetic ordering were characterized by the same
propagation vector, = (1/2, 1/2, 0).
Mardegan et al. (2013)
Eventhough the structural transition at was observed
to be suppressed by the application of external
pressure up to 10.3 kbar, the magnetic transition
was not affected.Mendonça-Ferreira et al. (2015)
With the application of magnetic field,
a new feature was observed to develop in the magnetically
ordered state. Anomalous phase transitions were observed in
Ce3Ir4Sn13 as well, where the anomalies occurred
at 0.6 K and at 2 K.Nagoshi et al. (2005)
The transition at 0.6 K was identified as antiferromagnetic
whereas the one at 2 K was argued to be due to a change of
band structure accompanied by a lattice expansion.
Interestingly, magnetic susceptibility did not present
an anomaly at 2 K. It must be noted here that an earlier
report on Ce3Ir4Sn13 had shown that the
2 K-transition split into a very sharp peak at
2.10 K and a shoulder-like one at 2.18 K.
Takayanagi et al. (1994) A closely related compound,
Eu3Rh4Sn13, showed only one anomaly at
11.2 K due to an antiferromagnetic transition
Maurya et al. (2014)
but, in the magnetization measured for [110]
it showed two close-by transition when the applied field was 13 T.
While the previous reportMendonça-Ferreira et al. (2006)
speculated on the possibility of polaronic effects via electron-phonon
coupling or Fermi surface induced changes in the conduction
electrons scattering to be the origin of the transition at ,
present understandingMendonça-Ferreira et al. (2015)
attributes the origin of the high
temperature transition to structural disorder within the cages.
In the present paper we endeavor to re-investigate
Gd3Ir4Sn13 using magnetization, specific heat
and electrical resistivity
measurements on a polycrystalline sample. Even though a
polycrystalline sample was used for the study, two very
close-by magnetic transitions
in Gd3Ir4Sn13 are identified through high resolution
measurements. In addition, giant, positive MR 80 is
observed in this compound at 2 K which, to the best of our knowledge,
is the highest reported so far in this class of Gd-compounds.
II Experimental details
Polycrystalline samples of Gd3Ir4Sn13 were prepared by arc melting the constituent elements Gd (99.99), Ir (-22 mesh, Premion 99.99 Alfa Aesar) and Sn (99.99 Alfa Aesar) together. The elements weighed according to stoichiometric ratio were melted in the water-cooled Cu-hearth of Edmund Buehler arc melting furnace under static atmosphere of purified argon gas. A Zr-getter trap was used for purifying the Ar gas. The once-melted sample was flipped over and re-melted 5 times in order to ensure a single homogeneous phase. The melted samples were annealed for 2 weeks at 680 ∘C. Powder X ray diffractogram of pulverized sample of Gd3Ir4Sn13 was obtained using a Philips X’pert diffractometer using Cu-K radiation. Structural analysis of the x ray diffraction data was performed using Rietveld methodRietveld (1969) implemented in FullProf suite of programs.Rodriguez-Carvajal (1993) Magnetic measurements were performed using a commercial Magnetic Property Measurement System (MPMS) and specific heat was measured using a commercial Physical Property Measurement System (PPMS) (both instruments from Quantum Design, San Diego). Electrical resistivity was measured on a bar-shaped sample of dimension 5 mm 3 mm 0.8 mm using the ac transport option of the PPMS. For magnetoresistance measurements, the magnetic field , the current , and sample length were arranged such that . Thermal conductivity and Seebeck coefficients were measured on a bar shaped sample using the Thermal Transport Option (TTO) of the PPMS.
III Results
III.1 Crystal structure distortions
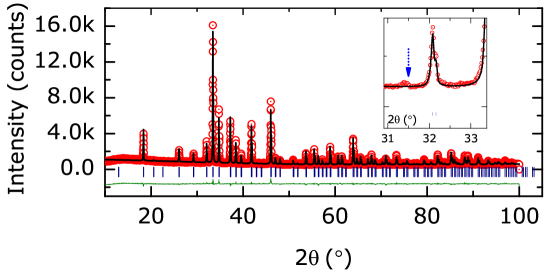
The crystal structure of compounds is generally described in cubic space group (223). Recent crystallography work on Gumeniuk et al. (2012) compounds point towards the existence of subtle structural distortions in this class of compounds and confirms the findings of earlier reports. Remeika et al. (1980); Vandenberg (1980); Miraglia et al. (1986); Hodeau et al. (1982) Rietveld refinement of the x ray data on Gd3Ir4Sn13 was performed using the space group. The results of the refinement are presented in Fig 2 where the experimentally observed data are shown in circles and the calculated pattern as thick solid line. The refinement yielded a lattice parameter value of (Å) = 9.6539(3). Nagoshi et al., Nagoshi et al. (2006) pointed out the presence of several extra reflections mainly in the 2 range of 25 to 55∘ in the x ray diffraction pattern obtained on a single crystal of Gd3Ir4Sn13. A close inspection of the x ray diffractogram of our sample also revealed additional superstructure peaks signifying structural distortions in the present sample of Gd3Ir4Sn13. The (2, ) pairs of the peaks are as following: (31.5∘, ), (37.9∘, ), (44.5∘, ) and (50.5∘, ). One such peak is shown enlarged in the inset of Fig 2 where the intensity is scaled down by a factor of 104. These peaks are indexed following the structural distortion with a propagation vector = (1/2, 1/2, 0) (a minor impurity belonging to Sn was observed at 43∘). The distorted structure of this type can be assigned to the space group , similar to the superlattice structure for Gd3Rh4Sn13 and La3Rh4Sn13.Miraglia et al. (1986)
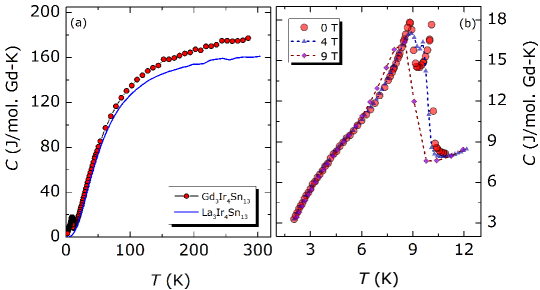
III.2 Specific heat
The experimentally measured specific heat, , of
Gd3Ir4Sn13 is presented in the panel (a) of
Fig 3 along with that of the
non-magnetic analogue La3Ir4Sn13 which is
shown in the figure using a solid line. The Dulong-Petit
value of 3
166 J/mol.Gd-K is recovered for Gd3Ir4Sn13 at
300 K ( is 1/3 of the number of atoms
in the formula unit and is the universal gas constant).
The of Gd3Ir4Sn13 resembles that
of other compounds reported in the literature.
Strydom (2007); Strydom, Oeschler, and Steglich (2008)
However, the low-temperature region of specific heat
gives evidence of a double magnetic phase transition with two
nearby peaks at 10 K and 8.8 K. The inset of Fig 3 magnifies the
temperature region
between 1 K and 14 K to highlight the double-peaks.
Presented in the panel (b) are the specific heat data
under applied magnetic fields
of 4 T and 9 T. It is observed that the application of
magnetic field shifts the peak at
10 K to low temperatures.
Previous report on the magnetic and transport properties
of Gd3Ir4Sn13 did not identify the signature of
double magnetic phase transition in their data.
Nagoshi et al. (2006) The magnetic
entropy, , was estimated
by subtracting the specific heat of non-magnetic
analogous compound La3Ir4Sn13 from that of
Gd3Ir4Sn13. In this way, 17.2 J/mol-K
was obtained at which is equal to ln(8) for the full multiplet of
Gd3+ (16 J/mol-K, at ).
III.3 Magnetization
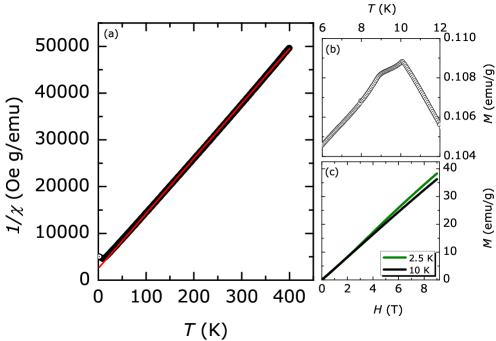
The inverse magnetic susceptibility, 1/, of Gd3Ir4Sn13 at 500 Oe is presented in the panel (a) of Fig 4. A curve-fit assuming Curie-Weiss law performed in the range 80–300 K is shown as a straight line. The Curie-Weiss fit leads to a value of effective paramagnetic moment = 7.2 Gd-atom and Curie temperature = -21 K. The and values are comparable to the theoretical free-ion value for Gd3+, 7.94 Gd-atom. The observed deviation of the experimental value of magnetic moment from that of the free ion Gd is interesting and might hint at the contributions from electrons. The double-transition in Gd3Ir4Sn13 is evident in magnetic response seen in the panel (b) of Fig 4, where in zero field cooled cycle measured at 500 Oe is presented in enlarged scales. The panel (c) of Fig 4 shows the magnetization isotherms, at 2.5 K and at 10 K plotted together. No signature of ferromagnetism or metamagnetism is observed in the magnetization isotherms while up to 9 T, the antiferromagnetic behaviour is retained.
III.4 Resistivity and magnetoresistance
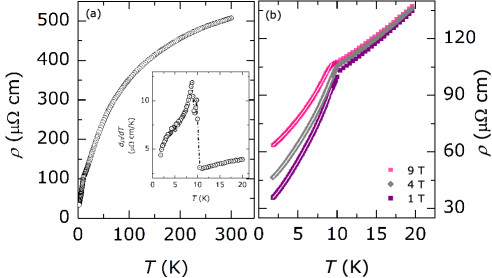
The electrical resistivity, , of Gd3Ir4Sn13 in 0 T is presented in the main panel of Fig 5. In general, a metal-like behaviour is observed with a prominent anomaly at 10 K. This ”kink” corresponds to . The residual resistance ratio (RRR) defined as is approximately 50, which is higher than the value of RRR = 3 obtained on Gd3Ir4Sn13 single crystals. Nagoshi et al. (2006) This difference between our data and that of Nagoshi et al., is large only in the magnetic state. Above the transition temperature the ratios are comparable. The deviation from the RRR of a single crystal could possibly be due to a combination of grain boundary effects and electron-phonon scattering at high temperature. The Mott term also could be relevant because the variation becomes non-linear at relatively low temperature which is a signature of - interband scattering. Enhanced quality of the polycrystalline samples reflected in RRR and visibility of low-temperature transition were observed in Ce3Pd20Si6 for example.Prokofiev et al. (2009) A closer inspection of the temperature derivative d/dT plotted in the inset (a) brings up both the anomalies and clearly. It is observed that the electrical resistivity of Gd3Ir4Sn13 below the transition at can be faithfully described by the expression;
| (1) |
In this expression, the first term accounts for impurity
scattering.
A power-law of the form accounts for the normal Fermi-liquid
quasiparticle excitation where . During the fit,
the exponent was left as a free parameter yielding a
value of 1.52(2) for
0 T while it gradually increased to 1.63(2) for 9 T.
The parameters derived from the fit are collected in Table 1.
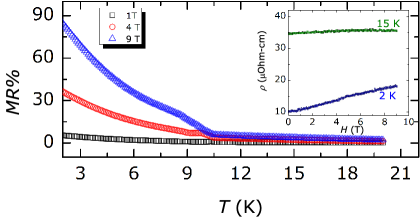
The magnetoresistance, defined as
MR = ,
of Gd3Ir4Sn13 is plotted in the main
panel of Fig 6. The MR is calculated for = 1, 4 and 9 T.
As can be seen from the figure, with the application of 9 T giant,
positive MR 80 is obtained at 2 K. A progressive
increase of MR with applied magnetic field can be observed. What is
evident is the sudden increase of MR at suggesting a
close connection between the appearance of MR and the
antiferromagnetic
transition. Above 10 K, the magnetoresistance
is nearly zero for any value of applied field. In the inset of Fig 6,
the isothermal magnetoresistance is plotted for 2 K and for 15 K.
The positive MR is clearly reproduced for the isotherm at 2 K whereas
at 15 K, a linear behaviour is recovered.
III.5 Thermal transport
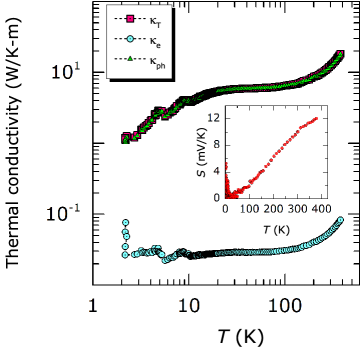
The experimentally measured thermal conductivity of Gd3Ir4Sn13 is presented in the main panel of Fig 7 (a) denoted as . The electronic contribution to the total thermal conductivity is estimated using the Wiedemann -Franz law as . The Lorenz number is = = 2.54 10-8 W and is the electrical resistivity. The estimated this way is subtracted from the total thermal conductivity to obtain the phonon contribution, ((T) = + ). Both and are shown in Fig 7. It is interesting to note that the magnetic transition at is clearly reflected in the thermal conductivity data. The thermal conductivity data bears a resemblance to the thermal transport data of other quasi-skutterudite compounds like Y3Ir4Ge13. Strydom (2007) However, the thermopower of Gd3Ir4Sn13 exhibits a behaviour slightly different from that of the Ge-based compounds of this class. Strydom (2007); Strydom, Oeschler, and Steglich (2008); Köhler et al. (2007) A plateau-like region in the thermopower seen in the Ge-based compounds is not seen in the present case, instead, a linear increase of thermopower is observed.
IV Discussion
The phase transitions and reported to be observed in the stannides
were not as close-by in temperature as has been observed
as and in
Gd3Ir4Sn13 (i.e., at 8.8 K and 10 K). The
double-transition in the present compound is observed in
, , and in thermal conductivity and
hence is a intrinsic bulk effect. At lower applied fields like 500 Oe,
both the transitions and are clearly observed in
the curve (see Fig 4). When the applied
field increases, the transition at becomes less
conspicuous in , but is still clearly identified
in d/dT. It is noted that with
applied field, the shifts to lower temperature
while that at remains unaffected. Such a feature is
also reflected in the specific heat. The earlier report on single crystals of
Gd3Ir4Sn13 proposed a chain-like magnetic
structure for this compound with interlayer antiferromagnetic
coupling and weak ferromagnetism between the layers.
Nagoshi et al. (2006) In order to test
whether any presence of
ferromagnetism can be detected, we performed ac
susceptibility measurements (data not shown here).
Though signs of both and were clear
in the data, there was no frequency dispersion present.
Also, the imaginary part of the ac susceptibility did not
show any temperature dependence ruling out any
dissipative or ferromagnetic
terms. The type of antiferromagnetic order in Gd-alloys
can be inferred from scrutinizing the specific heat.
Bouvier, Lethuillier, and Schmitt (1991); Blanco, Gignoux, and Schmitt (1991)
The peak value of magnetic specific heat at the transition
temperature is estimated to be 20.15 J/mol K if the
magnetic structure is
any equal moment structure like simple antiferro-, ferro- or
heli-magnetic. Any amplitude modulation is
expected to reduce this value.
In the present case of Gd3Ir4Sn13, a non-collinear
magnetic structure may be expected following this test.
Amplitude modulated magnetic structures are very common
among highly anisotropic rare earth compounds with orbital magnetism.
However, Gd is a -state ion with = 0 and hence one
could assume that dipolar interactions can become relevant as has been
reported in several Gd-compounds.Rotter et al. (2003)
It is interesting to note also that the - coupling scheme
becomes relevant in the case
where Hund’s coupling is modest compared to the spin-orbit
coupling and it was shown by Niikura et al., that one of the
seven electrons of Gd can result in carrying a
quadrupole moment.Niikura and Hotta (2012)
The observation of positive giant magnetoresistance in
Gd3Ir4Sn13, is an important finding of the present work.
The Sn13 compounds are not reported to
exhibit giant or positive magnetoresistance.
However, magnetoresistance anomalies in Gd-alloys
have been studied in detail and documented well.
Sampathkumaran and Das (1995); Mallik and Sampathkumaran (1998); Morellon et al. (1998, 2001); Mazumdar et al. (1996, 1999)
It is interesting to note that the temperature dependence of electrical resistivity
of Gd-alloys like GdCu2Si2 and GdNi2Si2
resemble that of Gd3Ir4Sn13.
Sampathkumaran and Das (1995)
The MR is observed to be positive
for GdCu2Si2 above the Néel
temperature.Sampathkumaran and Das (1995)
This observation suggested that the contribution
from the paramagnetic Gd fluctuation is small
compared to that from the influence of magnetic field
on the Fermi surface. On the other hand, for the Ni-based
alloy, the MR is negative in the paramagnetic state. Though
this feature is reminiscent of Kondo spin fluctuation phenomena,
since Gd electrons are well-localized, this feature is
attributed to the spin fluctuations from the Ni -band.
In contrast to these two features, the MR of
Gd3Ir4Sn13 is temperature
independent at 15 K which is above . From the analysis
of effective paramagnetic moment, it was seen that possible
contributions from the 5 electrons are present in
Gd3Ir4Sn13.
Gd2Ni3Si5 is another compound that is reported to
exhibit positive giant magnetoresistance.
Mazumdar et al. (1996) However, the MR was not
correlated to the rare earth moments but to the magnetic
ordering of the lattice as the magnitude of MR is
found to be significantly reduced in the paramagnetic state.
Notably, the MR was observed to be large in
non-magnetic rare earths other than
Gd in Ni3Si5 (Gd2Ni3Si5 showed 12 at 4.4 K
for 45 kOe).Mazumdar et al. (1996)
In Gd3Ir4Sn13 also the enhancement of MR
is prominent below the magnetic ordering temperature
which hints at the connection between magnetic ordering
and giant MR. Similar to Gd3Ir4Sn13, Gd2Ni3Si5
also has a layered magnetic structure and this structural
feature also might play a role in the high value of
MR.
On the other hand, giant magnetoresistance observed in Gd-based
magnetocaloric alloys like Gd5(Si1.8Ge2.2)
Morellon et al. (1998) is attributed to the presence of
first-order magnetostructural transition. Note that in
this compound a negative MR was observed.
A similar feature was observed in Ge-rich compound
Gd5(Si0.1Ge0.9)4.Morellon et al. (2001)
Usually, positive MR can arise from Lorentz contribution
to resistivity. In pure metals, high cyclotron frequency
and relaxation times can lead to positive MR.
However, such a scenario does not
hold in the case of Gd3Ir4Sn13 which shows a higher
low temperature resistivity than pure metals. Another
possibility is for positive MR in antiferromagnets to arise
due to enhancement of spin fluctuations.
Yamada and Takada (1973)
However, MR in such case is not as high as been observed
in Gd3Ir4Sn13. Gd-ion being an -state ion,
crystalline electric field effects can be ruled out
as reasons for the observed giant MR. At this point
it is interesting to mention that the discovery of
giant magnetoresistance was made on layered magnetic
structures with antiferromagnetic interlayer exchange.
Binasch et al. (1989) A highly plausible reason for the
double-magnetic transition and the positive
giant magnetoresistance could be spin-reorientation
effects taking place in the layered magnetic
structure of Gd3Ir4Sn13 with interlayer
antiferromagnetic exchange.
Nagoshi et al. (2006) However, it must
be noted that spin-reorientation effects in
Tb2Ni3Si5 was evident in isothermal
magnetization plots at 6 K and consequently was argued
to have lead to positive giant MR.Mazumdar et al. (1996)
The magnetization
isotherms of Gd3Ir4Sn13 at 2.5 K (Fig 4 (b))
do not present any deviation from linearity to support
effects of spin-reorientation.
V Conclusions
The double-phase transition in the quasi-skutterudite Gd3Ir4Sn13 is unambiguously identified through magnetization, specific heat, electrical resistivity, and thermal conductivity measurements. The two transitions occur very close to each other at 10 K and at 8.8 K. The transition at is seen to shift to lower temperature with application of magnetic field hence, revealing the antiferromagnetic nature whereas the transition at 8.8 K is very robust and does not change upon applied field. The interesting result is the observation of positive giant magnetoresiatance of about 80 below . The layered quasi-1D magnetic structure of Gd3Ir4Sn13 and/or dipolar interactions commonly found in Gd-based antiferromagnets could be the reason for the double-magnetic transition and the positive giant magnetoresisatnce.
Present address: Department of Applied Physics, Birla Institute of Technology, Mesra, Ranchi, Jharkhand, India
HSN and RKK acknowledge FRC/URC of UJ for postdoctoral fellowship. AMS thanks the SA NRF (93549) and UJ URC/FRC for financial assistance.
References
- Remeika et al. (1980) J. P. Remeika, G. P. Espinosa, A. S. Cooper, H. Barz, J. M. Rowell, D. B. McWhan, J. M. Vandenberg, D. E. Moncton, Z. Fisk, L. D. Woolf, et al., Solid State Commun. 34, 923 (1980).
- Vandenberg (1980) J. M. Vandenberg, Mater. Res. Bull. 15, 835 (1980).
- Hodeau et al. (1980) J. L. Hodeau, J. Chenavas, M. Marezio, and J. P. Remeika, Solid State Commun. 36, 839 (1980).
- Kase et al. (2011) N. Kase, H. Hayamizu, K. Inoue, and J. Akimitsu, Physica C 471, 711 (2011).
- Kulkarni et al. (2011) P. D. Kulkarni, S. S. Banerjee, C. V. Tomy, G. Balakrishnan, D. M. Paul, S. Ramakrishnan, and A. K. Grover, Phys. Rev. B 84, 014501 (2011).
- Hodeau et al. (1982) J. L. Hodeau, M. Marezio, J. P. Remeika, and C. H. Chen, Solid State Commun. 42, 97 (1982).
- Eisenmann and Schäfer (1986) B. Eisenmann and H. Schäfer, J. Less Comm. Metals 123, 89 (1986).
- Segre, Braun, and Yvon (1981) C. U. Segre, H. F. Braun, and K. Yvon, Ternary Superconductors , 243 (1981), ed. G. K. Shenoy.
- Bruskov, Pecharskij, and Bodak (1986) V. A. Bruskov, V. K. Pecharskij, and O. I. Bodak, Izv. Akad. Nauk. SSSR Neorg. Mater. 22, 1471 (1986).
- Mudryk et al. (2001) Y. Mudryk, A. Grytsiv, P. Rogl, C. Dusek, A. Galatanu, E. Idl, H. Michor, E. Bauer, C. Godart, D. Kaczorowski, et al., J. Phys.: Condens. Matter 13, 7391 (2001).
- Niepmann et al. (2001) D. Niepmann, R. Pöttgen, K. M. Poduska, F. J. DiSalvo, H. Trill, and B. D. Mosel, Z Natur. 56b, 1 (2001).
- Nagoshi et al. (2006) C. Nagoshi, R. Yamamoto, K. Kuwahara, H. Sagayama, D. Kawana, M. Kohgi, H. Sugawara, Y. Aoki, H. Sato, T. Yokoo, et al., J. Phys. Soc. Jpn. 75, 044710 (2006).
- Bordet et al. (1991) P. Bordet, D. E. Cox, G. P. Espinosa, J. L. Hodeau, and M. Marezio, Solid State Commun. 78, 359 (1991).
- Sato et al. (1993) H. Sato, T. Fukuhara, S. Iwakawa, Y. Aoki, I. Sakamoto, S. Takayanagi, and N. Wada, Physica B 186, 630 (1993).
- Köhler et al. (2007) U. Köhler, A. P. Pikul, N. Oeschler, T. Westerkamp, A. M. Strydom, and F. Steglich, J. Phys.: Condens. Matter 19, 386207 (2007).
- Nagoshi et al. (2005) C. Nagoshi, H. Sugawara, Y. Aoki, S. Sakai, M. Kohgi, H. Sato, T. Onimaru, and T. Sakakibara, Physica B 359, 248 (2005).
- Mendonça-Ferreira et al. (2006) L. Mendonça-Ferreira, E. M. Bittar, M. A. Pires, R. R. Urbano, O. Agüero, I. Torriani, C. Rettori, P. G. Pagliuso, A. Malachias, E. Granado, et al., Physica B 384, 332 (2006).
- Mendonça-Ferreira et al. (2015) L. Mendonça-Ferreira, E. M. Bittar, I. K. E. Bianchi, P. F. S. Rosa, Z. Fisk, and P. G. Pagliuso, in J. Phys.: Conf. Ser., Vol. 592 (IOP Publishing, 2015) p. 012046.
- Mardegan et al. (2013) J. R. L. Mardegan, N. Aliouane, L. N. Coelho, O. Aguero, E. M. Bittar, J. C. Lang, P. G. Pagliuso, I. L. Torriani, and C. Giles, IEEE Transactions on Magnetics 49, 4652 (2013).
- Takayanagi et al. (1994) S. Takayanagi, H. Sato, T. Fukuhara, and N. Wada, Physica B 199, 49 (1994).
- Maurya et al. (2014) A. Maurya, P. Bonville, A. Thamizhavel, and S. K. Dhar, JPS Conf. Proc. 3, 017022 (2014).
- Rietveld (1969) H. M. Rietveld, J. Appl. Cryst. 2, 65 (1969).
- Rodriguez-Carvajal (1993) J. Rodriguez-Carvajal, Physica B 192, 55 (1993).
- Gumeniuk et al. (2012) R. Gumeniuk, L. Akselrud, K. O. Kvashnina, W. Schnelle, A. A. Tsirlin, C. Curfs, H. Rosner, M. Schöneich, U. Burkhardt, U. Schwarz, et al., Dalton Trans. 41, 6299 (2012).
- Miraglia et al. (1986) S. Miraglia, J. L. Hodeau, M. Marezio, C. Laviron, M. Ghedira, and G. P. Espinosa, J. Solid State Chem. 63, 358 (1986).
- Strydom (2007) A. M. Strydom, J. Phys.: Condens. Matter 19, 386205 (2007).
- Strydom, Oeschler, and Steglich (2008) A. M. Strydom, N. Oeschler, and F. Steglich, Physica B 403, 746 (2008).
- Prokofiev et al. (2009) A. Prokofiev, J. Custers, M. Kriegisch, S. Laumann, M. Müller, H. Sassik, R. Svagera, M. Waas, K. Neumaier, A. M. Strydom, et al., Phys. Rev. B 80, 235107 (2009).
- du Plessis et al. (1999) P. d. V. du Plessis, A. M. Strydom, R. Troc, T. Cichorek, C. Marucha, and R. P. Gers, J. Phys.: Condens. Matter 11, 9775 (1999).
- Bouvier, Lethuillier, and Schmitt (1991) M. Bouvier, P. Lethuillier, and D. Schmitt, Phys. Rev. B 43, 13137 (1991).
- Blanco, Gignoux, and Schmitt (1991) J. A. Blanco, D. Gignoux, and D. Schmitt, Phys. Rev. B 43, 13145 (1991).
- Rotter et al. (2003) M. Rotter, M. Loewenhaupt, M. Doerr, A. Lindbaum, H. Sassik, K. Ziebeck, and B. Beuneu, Phys. Rev. B 68, 144418 (2003).
- Niikura and Hotta (2012) F. Niikura and T. Hotta, J. Phys. Soc. Jpn. 81, 114720 (2012).
- Sampathkumaran and Das (1995) E. V. Sampathkumaran and I. Das, Phys. Rev. B 51, 8631 (1995).
- Mallik and Sampathkumaran (1998) R. Mallik and E. V. Sampathkumaran, Phys. Rev. B 58, 9178 (1998).
- Morellon et al. (1998) L. Morellon, J. Stankiewicz, B. Garcia-Landa, P. A. Algarabel, and M. R. Ibarra, Appl. Phys. Lett. 73, 3462 (1998).
- Morellon et al. (2001) L. Morellon, P. A. Algarabel, C. Magen, and M. R. Ibarra, J. Magn. Magn. Mater. 237, 119 (2001).
- Mazumdar et al. (1996) C. Mazumdar, A. K. Nigam, R. Nagarajan, C. Godart, L. C. Gupta, B. D. Padalia, G. Chandra, and R. Vijayaraghavan, Appl. Phys. Lett. 68, 3647 (1996).
- Mazumdar et al. (1999) C. Mazumdar, K. Ghosh, R. Nagarajan, S. Ramakrishnan, B. D. Padalia, and L. C. Gupta, Phys. Rev. B 59, 4215 (1999).
- Yamada and Takada (1973) H. Yamada and S. Takada, Prog. Theor. Phys. 49, 1401 (1973).
- Binasch et al. (1989) G. Binasch, P. Grünberg, F. Saurenbach, and W. Zinn, Phys. Rev. B 39, 4828 (1989).
| (Tesla) | 0 | 1 | 4 | 9 |
|---|---|---|---|---|
| (cm) | 28.9 | 31.1 | 42.7 | 60.6 |
| (cm/ K2) | 2.12 | 1.99 | 1.63 | 1.20 |
| 1.52 | 1.53 | 1.58 | 1.63 |