The nuclear and integrated far-infrared emission of nearby Seyfert galaxies††thanks: Herschel is an ESA space observatory with science instruments provided by European-led Principal Investigator consortia and with important participation from NASA.
Abstract
We present far-infrared (FIR) m imaging observations obtained with Herschel/PACS and SPIRE of 33 nearby (median distance of 30 Mpc) Seyfert galaxies from the Revised Shapley-Ames (RSA) catalogue. We obtain the FIR nuclear (kpc and kpc) and integrated spectral energy distributions (SEDs). We estimate the unresolved nuclear emission at 70 m and we fit the nuclear and integrated FIR SEDs with a grey body model. We find that the integrated FIR emission of the RSA Seyferts in our sample is dominated by emission from the host galaxy, with dust properties similar to those of normal galaxies (non AGN). We use four criteria to select galaxies whose nuclear m emission has a significant AGN contribution: (1) elevated 70/160 m flux ratios, (2)spatially resolved, high dust temperature gradient, (3) m excess emission with respect to the fit of the FIR SEDs with a grey body, and (4) excess of nuclear SFR obtained from m over SFR from mid-infrared indicators. 16 galaxies (48 per cent of the initial sample) satisfy at least one of these conditions, whereas 10 satisfy half or more. After careful examination of these, we select six bona fide candidates (18 per cent of the initial sample) and estimate that per cent of their nuclear (kpc) m emission is contributed by dust heated by the AGN.
keywords:
galaxies: active – infrared: galaxies1 Introduction
Seyfert galaxies emit a large fraction of their bolometric emission in the far-infrared (FIR) range (Rieke, 1978). This emission is due to dust grains that re-radiate the absorbed optical and ultraviolet photons emitted by the active galactic nucleus (AGN) as well as by stars in their host galaxies. (1987) studied the FIR emission of a sample of optically selected Seyfert galaxies using observations taken with the Infrared Astronomical Satellite (IRAS). They found that the distribution of the integrated FIR luminosities and m to m colours of Seyfert and starburst galaxies were indistinguishable and concluded that most of the FIR emission of Seyfert galaxies must be due to star formation processes. Using Infrared Space Observatory (ISO) observations, (1998) showed that the integrated FIR thermal emission of Seyferts can be modelled with a combination of three different components: warm, cold, and very cold dust. The warm component is due to dust heated by the AGN and/or circumnuclear star formation (TK), the cold component comes from dust heated by stars in the disc of the galaxy (TK) and the very cold component arises from dust heated by the general interstellar radiation field of the galaxy (TK). (2002) also found using ISO imaging data that the integrated FIR emission of Seyfert galaxies is dominated by emission from the host galaxy.
(2014) used FIR observations taken with the Photodetector Array Camera (PACS; Poglitsch et al. 2010) on board Herschel to study a sample of hard X-ray selected galaxies from the 58 month Swift Burst Alert Telescope (BAT) Active Galactic Nuclei catalogue. They found that 35 per cent and 20 per cent of the sources are point-like at 70 and 160 m, respectively. Using the same sample, Meléndez et al. (2014) showed that the integrated FIR luminosity distributions of Seyfert 1 and Seyfert 2 galaxies are similar and their integrated ratios are indistinguishable from those of normal galaxies. Hatziminaoglou et al. (2010) studied 469 spectroscopically confirmed AGN. They used the Spectral and Photometric Imaging REceiver (SPIRE; 2010) data and showed that the FIR emission of Seyfert 1 and Seyfert 2 galaxies is identical to that of star forming galaxies. The AGN contributes very little to the integrated FIR emission and its contribution becomes important at wavelengths shorter than 70 m, where the torus starts playing an important role.
According to the unified model of AGN (, 1993), there is a dusty torus surrounding the accreting supermassive black hole. Dusty torus models where the dust is distributed both homogeneously (e.g., 2006) or in a clumpy configuration (see e.g., Nenkova et al. 2008; 2010) predict emission in the FIR, although the torus emission peaks in the mid-infrared (MIR) spectral range. Based on studies of individual Seyfert galaxies using Herschel observations, the contribution of the dust heated by the AGN to the total FIR emission varies from galaxy to galaxy. For example, (2012) found that in NGC 1365 the AGN is the brightest source in the MIR but does not dominate in the FIR. Using the Nenkova et al. (2008) torus models they quantified the AGN emission at m and determined that the AGN only contributes at most 1 per cent within the central kpc. For NGC 2992, (2015) showed that the AGN dominates the emission between 15 and 30 m, but its contribution decreases rapidly for wavelengths m. (2011) studied NGC 3081 and found that the FIR nuclear luminosity within a radius of 0.85 kpc was well reproduced with the Nenkova et al. (2008) clumpy torus models and concluded that the AGN dominates the FIR nuclear luminosity of this galaxy. There are however no statistical studies of the AGN contribution in the FIR, so it is important to find a method to determine if the AGN dominates in the FIR for large samples of galaxies. (2011) studied the infrared emission of a sample of local X-ray selected AGN with little evidence of host galaxy contamination in their MIR Spitzer/IRS spectra. They found that at least 3 of the 11 AGN in their sample are AGN dominated even at 60 .
In this work we study the FIR (m) emission of a sample of 33 nearby (median distance of 30 Mpc) Seyfert galaxies drawn from the Revised Shapley-Ames catalogue (RSA; 1987) using Herschel imaging observations taken with PACS and SPIRE. The main goal is to disentangle the FIR emission of these Seyfert galaxies due to dust heated by the AGN from that due to dust heated by star formation. In particular, we take advantage of the Herschel angular resolution of 5.6 arcsec at m, which provides a median physical resolution of kpc for our sample of galaxies. This allows us to study the nuclear (radii of kpc and kpc) and integrated FIR emission of Seyfert galaxies. The paper is organized as follows. In Section 2 we present our sample selection and the comparison with the entire RSA sample. In Section 3 we describe the data reduction and derive the aperture photometry. Section 4 presents our results, such as the unresolved m emission, the FIR colours, the grey body fitting and the nuclear and extranuclear star formation rates (SFR). In Section 5 we put forward a number of criteria to identify those Seyfert galaxies in our sample whose m emission is mostly due to dust heated by the AGN and discuss the bona fide candidates. The conclusions are presented in Section 6. Throughout this work we use a cosmology with , and .
2 The sample
We selected a sample of 33 nearby (distances Mpc, Table 1) Seyfert galaxies (see , 1995) from the RSA catalogue (1987) with Herschel/PACS imaging observations in at least two bands and SPIRE imaging observations from our own programs and from the archive111http://www.cosmos.esa.int/web/herschel/science-archive (see Table 3). We imposed the distance criterion so we could obtain at least one nuclear (radii of kpc and/or kpc) FIR measurement at m. We also required Seyfert galaxies with existing high angular resolution (″) MIR spectroscopy (Hönig et al., 2010; González-Martín et al., 2013; Esquej et al., 2014; Alonso-Herrero et al., 2016) obtained on m class telescopes (T-ReCS, CanariCam and VISIR instruments). We used the spectra published in these references instead of reducing the archival data. These observations allow us to determine whether they have star formation activity on typical physical scales of pc, which is necessary when trying to determine what galaxies in our sample have AGN-dominated FIR emission. 23 of these galaxies also have estimates of the nuclear and integrated SFR from mid-IR Spitzer/IRS spectroscopy taken from (2012) (hereafter DSR2012).
In Table 1 we list the properties of the Seyfert galaxies in our sample including their luminosity distance, optical apparent magnitude (), morphological type, and the optical activity type (15 Sy 1 galaxies and 18 Sy 2 galaxies). We consider as Sy 1 the 1.5 and 1.9 Seyfert galaxies.
We obtained the Spitzer/IRS SL+LL spectra from the Cornell Atlas of Spitzer/IRS Sources version 7 (CASSIS, Lebouteiller et al., 2011, 2015). The stitching of the different spectral orders has been made as described in Hernán-Caballero et al. (2016). We also provide in Table 1 the equivalent width (EW) of the 6.2 and 11.3 m PAH features measured from Spitzer/IRS short-low (SL) spectra, except for NGC 1068 which was from a short-high (SH) spectrum (see Esquej et al., 2014). We measured the EW of the PAH features following the method described by Hernán-Caballero & Hatziminaoglou (2011). Finally, we give the AGN bolometric luminosity, and the nuclear (kpc) and extranuclear (kpc) SFRs taken from DSR2012. For those RSA Seyferts not in that work we take the AGN bolometric luminosities from (2012) and Esquej et al. (2014).
| Number | Name | Morphological2 | Activity | EW of 6.2m | EW of 11.3m | log | SFR (r=1kpc)6 | SFR (r1kpc)6 | Ref. Activity | ||
| (Mpc) | (mag) | type | type | PAH (m) | PAH (m) | () | () | () | type | ||
| 1 | ESO 323-G077 | 60.2 | 13.58 | (R)SAB0^0(rs) | Sy 1.2 | 0.0490.005 | 0.1260.005 | 43.98 | 3 | ||
| 2 | IC 5063 | 49.9 | 13.22 | SA0^+(s)? | Sy 2 | 0.018 | 0.0110.004 | 44.08 | 10 | ||
| 3 | Mrk 1066 | 49.0 | 13.64 | (R)SB0^+(s) | Sy 2 | 0.5440.007 | 0.5910.005 | 4 | |||
| 4 | NGC 1068 | 14.4 | 9.61 | (R)SA(rs)b | Sy 2 | 44.38 | 5 | ||||
| 5 | NGC 1320 | 35.5 | 13.32 | Sa? edge-on | Sy 2 | 3 | |||||
| 6 | NGC 1365 | 21.5 | 10.21 | SB(s)b | Sy 1.8 | 0.2580.004 | 0.3140.002 | 44.3 | 4.80 | 8.40 | 3 |
| 7 | NGC 1386 | 10.6 | 12.00 | SB0^+(s) | Sy 2 | 0.019 | 0.0720.005 | 43.5 | 0.05 | 11 | |
| 8 | NGC 1808 | 12.3 | 10.762 | (R)SAB(s)a | Sy 2 | 1.0780.006 | 1.0130.003 | 41.28 | 7 | ||
| 9 | NGC 2110 | 32.4 | 14.00 | SAB0^- | Sy 2 | 0.0140.007 | 0.0510.005 | 43.78 | 12 | ||
| 10 | NGC 2273 | 28.7 | 12.55 | SB(r)a? | Sy 2 | 0.2730.006 | 0.3830.007 | 43.6 | 0.76 | 4 | |
| 11 | NGC 2992 | 34.1 | 12.80 | Sa pec | Sy 1.9 | 0.2950.008 | 0.3280.017 | 44.7 | 0.77 | 0.54 | 1 |
| 12 | NGC 3081 | 34.2 | 12.68 | (R)SAB0/a(r) | Sy 2 | 0.0220.012 | 0.0460.005 | 44.6 | 0.15 | 0.31 | 13 |
| 13 | NGC 3227 | 20.6 | 11.55 | SAB(s)a pec | Sy 1.5 | 0.2150.006 | 0.3590.007 | 44.0 | 0.48 | 0.21 | 3 |
| 14 | NGC 3281 | 44.7 | 12.62 | SA(s)ab pec? | Sy 2 | 0.0130.008 | 0.0100.011 | 45.0 | 0.87 | 3 | |
| 15 | NGC 3783 | 36.1 | 12.89 | (R’)SB(r)ab | Sy 1.5 | 0.0010.005 | 0.0130.009 | 44.2 | 0.05 | 3 | |
| 16 | NGC 4051 | 12.9 | 10.93 | SAB(rs)bc | Sy 1.5 | 0.0890.004 | 0.1140.003 | 43.5 | 0.13 | 0.88 | 1 |
| 17 | NGC 4151 | 20.3 | 11.13 | (R’)SAB(rs)ab? | Sy 1.5 | 0.0050.003 | 0.0130.003 | 44.5 | 0.06 | 3 | |
| 18 | NGC 4253 | 61.3 | 13.30 | (R’)SB(s)a? | Sy 1.5 | 0.0870.005 | 0.0830.005 | 1 | |||
| 19 | NGC 4258 | 7.98 | 8.95 | SAB(s)bc | Sy 1.9 | 0.0340.013 | 0.0670.009 | 42.2 | 0.05 | 0.39 | 1 |
| 20 | NGC 4388 | 17.0 | 11.83 | SA(s)b? edge-on | Sy 2 | 0.0720.005 | 0.1400.003 | 44.4 | 0.21 | 0.24 | 14 |
| 21 | NGC 4507 | 59.6 | 12.81 | (R’)SAB(rs)b | Sy 2 | 0.0190.006 | 0.0490.003 | 44.6 | 0.99 | 10 | |
| 22 | NGC 4579 | 17.0 | 10.56 | SAB(rs)b | Sy 1.9 | 42.49 | 0.05 | 0.47 | 1 | ||
| 23 | NGC 4594 | 12.7 | 9.28 | SA(s)a edge-on | Sy 1.9 | 42.5 | 0.03 | 0.66 | 1 | ||
| 24 | NGC 4725 | 27.0 | 10.112 | SAB(r)ab pec | Sy 2 | 41.9 | 0.01 | 0.34 | 3 | ||
| 25 | NGC 5135 | 57.7 | 12.94 | SB(s)ab | Sy 2 | 0.7420.009 | 0.7770.007 | 44.9 | 6.10 | 3.60 | 3 |
| 26 | NGC 5347 | 40.2 | 13.40 | (R’)SB(rs)ab | Sy 2 | 0.0460.001 | 0.0590.005 | 43.58 | 3 | ||
| 27 | NGC 5506 | 30.0 | 12.79 | Sa pec edge-on | Sy 1.9 | 0.0120.004 | 0.0550.003 | 44.8 | 0.58 | 1 | |
| 28 | NGC 7130 | 68.7 | 12.982 | Sa pec | Sy 1.9 | 0.4160.011 | 0.4340.008 | 44.3 | 4.30 | 6.70 | 3 |
| 29 | NGC 7172 | 37.6 | 12.85 | Sa pec edge-on | Sy 2 | 0.0520.006 | 0.2050.009 | 44.2 | 0.79 | 0.68 | 3 |
| 30 | NGC 7213 | 24.9 | 11.18 | SA(s)a? | Sy 1.5 | 0.025 | 0.0590.006 | 43.18 | 0.04 | 0.39 | 1 |
| 31 | NGC 7465 | 28.4 | 13.31 | (R’)SB0^0?(s) | Sy 2 | 15 | |||||
| 32 | NGC 7479 | 32.4 | 11.70 | SB(s)c | Sy 1.9 | 0.0080.008 | 43.2 | 0.32 | 1.70 | 3 | |
| 33 | NGC 7582 | 22.0 | 11.46 | (R’)SB(s)ab | Sy 2 | 0.5080.033 | 0.7030.011 | 44.5 | 2.10 | 1.90 | 1 |
| 1 from (1995); 2 NED Homogenized from (1991) ;3 from Véron-Cetty & Véron (2006); 4 from (1998); | |||||||||||
| 5 from (1993); 6 from (2012); | |||||||||||
| 7 from (2011); 8 from Esquej et al. (2014); 9 from (2012); 10 from (2001); 11 from (2002); | |||||||||||
| 12 from (1978); 13 from (1983); 14 from Trippe et al. (2010); 15 from Malizia et al. (2012) | |||||||||||
2.1 Sample comparison
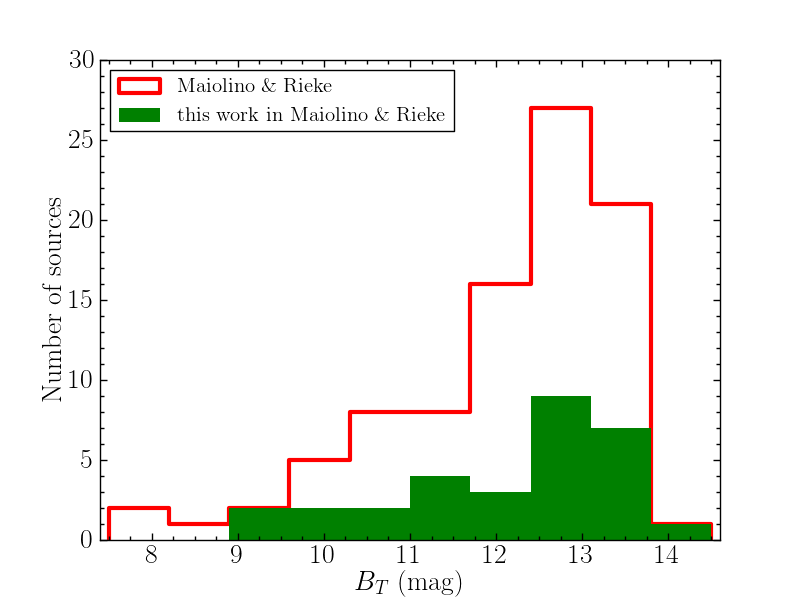
Since the RSA sample is selected based on the galaxy optical apparent magnitude, we used the values from (1995) to determine if our galaxy selection is representative of the entire RSA sample of Seyfert galaxies. Their sample contains 91 relatively nearby Seyfert galaxies with 13.31 and have 30 galaxies in common with our sample. The top left panel of Fig. 1 shows the distribution for the two samples. The 91 galaxies in (1995) are shown in red and the 30 of 33 galaxies in our sample are shown in blue. Inspection of Fig. 1 and a Kolmogorov-Smirnov (K-S) test show that our sample is not significantly different from the RSA sample in terms of (p-value).
| RSA sample | This work | |||||||
|---|---|---|---|---|---|---|---|---|
| Quantity | Number | Mean | Median | Number | Mean | Median | ||
| 1 | 91 | 12.08 | 1.32 | 12.55 | 30 | 12.10 | 1.34 | 12.68 |
| Luminosity distance (Mpc) 2 | 84 | 30.5 | 21.1 | 24.4 | 33 (23)* | 32.2 (29.5)* | 16.4 (15.6)* | 30.0 (27.0)* |
| SFR (r=1kpc) () 2 | 84 | 0.67 | 1.42 | 0.15 | 23 | 1.03 | 1.66 | 0.32 |
| log 2 | 74 | 43.4 | 1.0 | 43.4 | 29 (21)* | 43.8 (44.0)* | 1.0 (0.9)* | 44.0 (44.3)* |
1 From (1995)
2 From DSR2012
In parenthesis are galaxies in our sample in common with DSR2012.

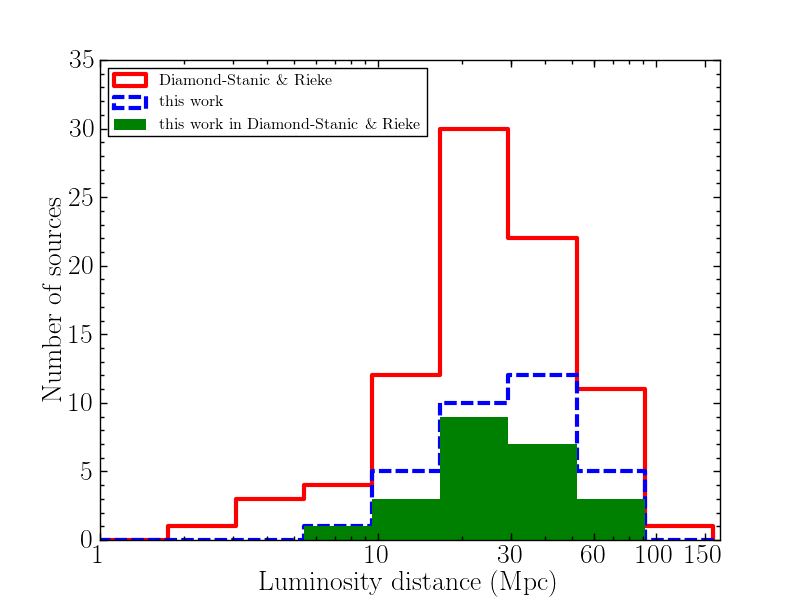
We also compared the luminosity distance of our sample those of the 84 galaxies in DSR2012. They selected Seyfert galaxies in the RSA sample with Spitzer/IRS observations of the m PAH feature. We used, as DSR2012, the luminosity distance obtained from the Nasa Extragalactic Database (NED222http://ned.ipac.caltech.edu/) using the corrected redshift to the reference frame defined by the Virgo cluster, the Great Attractor and the Shapley supercluster. The right top panel of Fig. 1 shows the luminosity distance distributions for the 84 galaxies in DSR2012 and the 33 galaxies of our sample (median luminosity distance of 30 Mpc). There are 10 Seyfert galaxies in our sample not in DSR2012 selection but in the RSA catalogue. Again, from Fig. 1 and a K-S test (p=0.87) our sample is not statistically significantly different in terms of the luminosity distance.
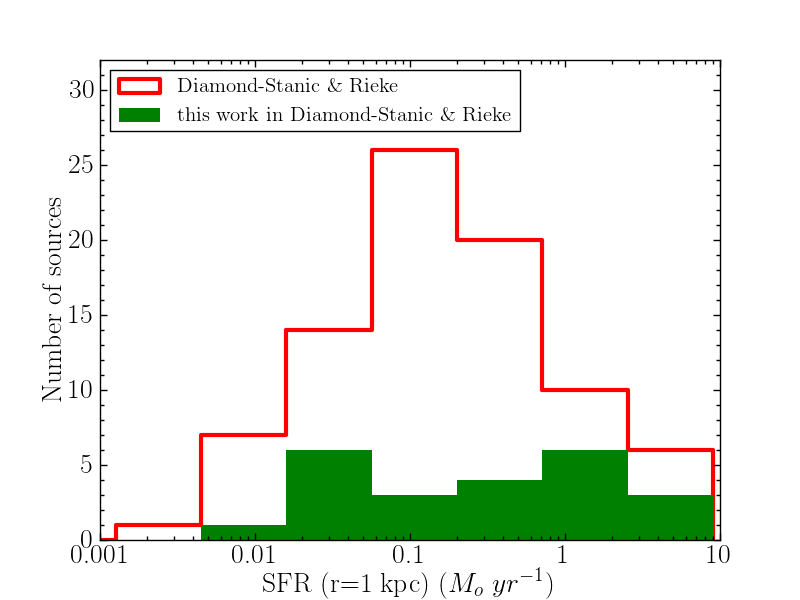
Since the main goal of this paper is to select galaxies with evidence of strong contribution of the AGN at 70 m emission, in Section 4.4 we will compare the nuclear SFR from MIR spectroscopy and Herschel 70 photometry. We therefore compared the nuclear SFR values obtained by DSR2012 for all their sample and the 23 galaxies in common with our sample. The bottom left panel of Fig. 1 shows the nuclear SFR distribution in DSR2012 and our sample with DSR2012 SFR values (median of 0.32 ). A K-S test shows that both samples are not statistically different in terms of the SFR ().
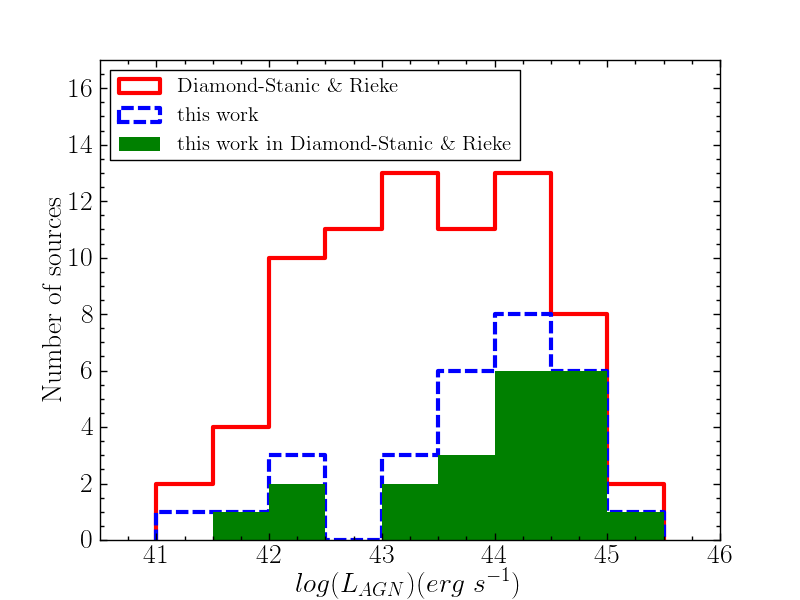
We finally compared the AGN bolometric luminosity distributions for the galaxies in DSR2012 and our galaxies with their values. This comparison is shown in the right bottom panel of Fig. 1. Clearly, our sample only includes the most luminous AGN when compared to the DSR2012 RSA sample. We find a p value for the K-S test of when comparing with the galaxies in common and when comparing with all our sample. This is because in general low-luminosity AGN are not bright in the mid-IR and thus few meet our requirement of having high angular resolution MIR spectroscopy obtained from the ground (see Alonso-Herrero et al., 2016). Even in the mid-infrared the low-luminosity AGN do not dominate the emission at least in the 40 per cent of the cases (González-Martín et al., 2015). Table 2 summarizes the statistics of the above comparisons.
3 Herschel observations
In this section we describe the process of obtaining the PACS and SPIRE images from the Herschel archive, the data reduction and the aperture photometry.
The PACS instrument has three bands referred to as blue, green, and red with central wavelengths of 70, 100, and 160 m, respectively. The nominal angular resolutions are 5.6, 6.8, and 11.3 arcsec (FWHM). The red band can be combined with the blue or the green band, for simultaneous observations.
The SPIRE instrument has three bands centred at 250, 350, and 500 m, with beam sizes of 18.1, 25.2, and 36.9 arcsec (FWHM), respectively. The three bands are observed simultaneously.
3.1 Data reduction
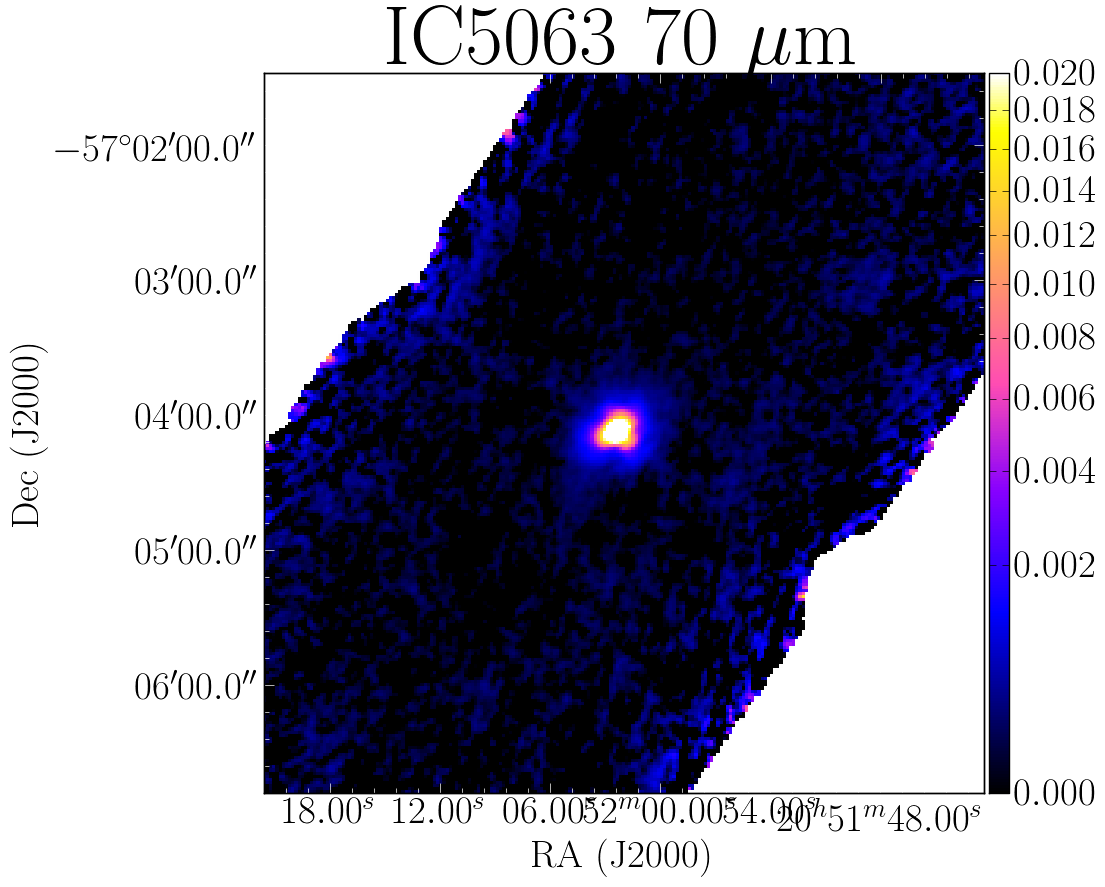
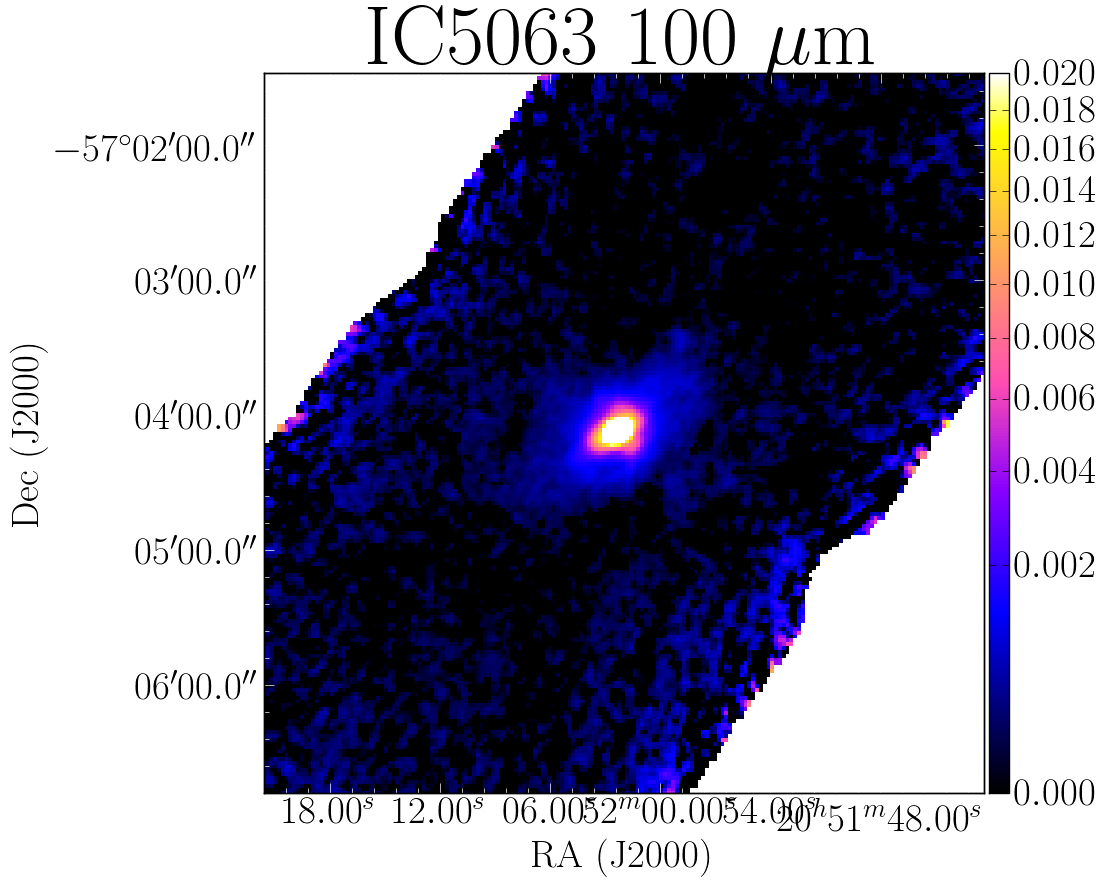
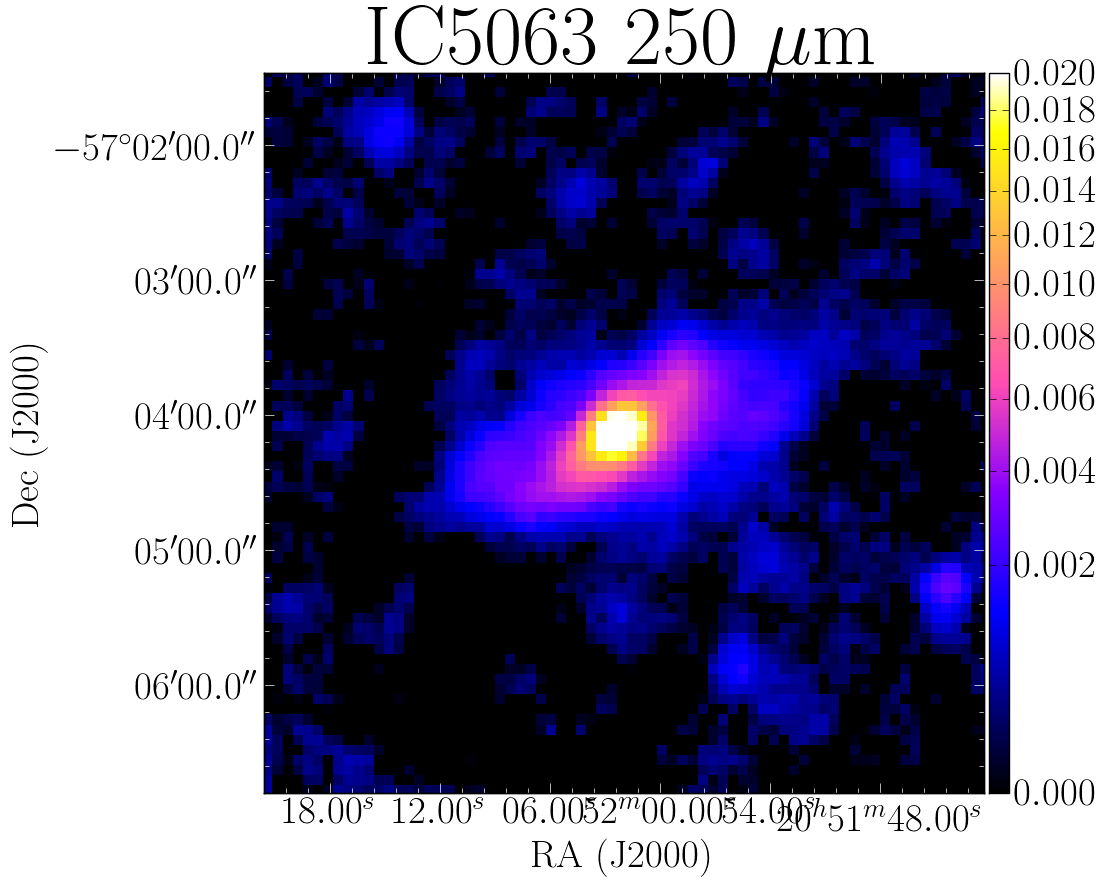
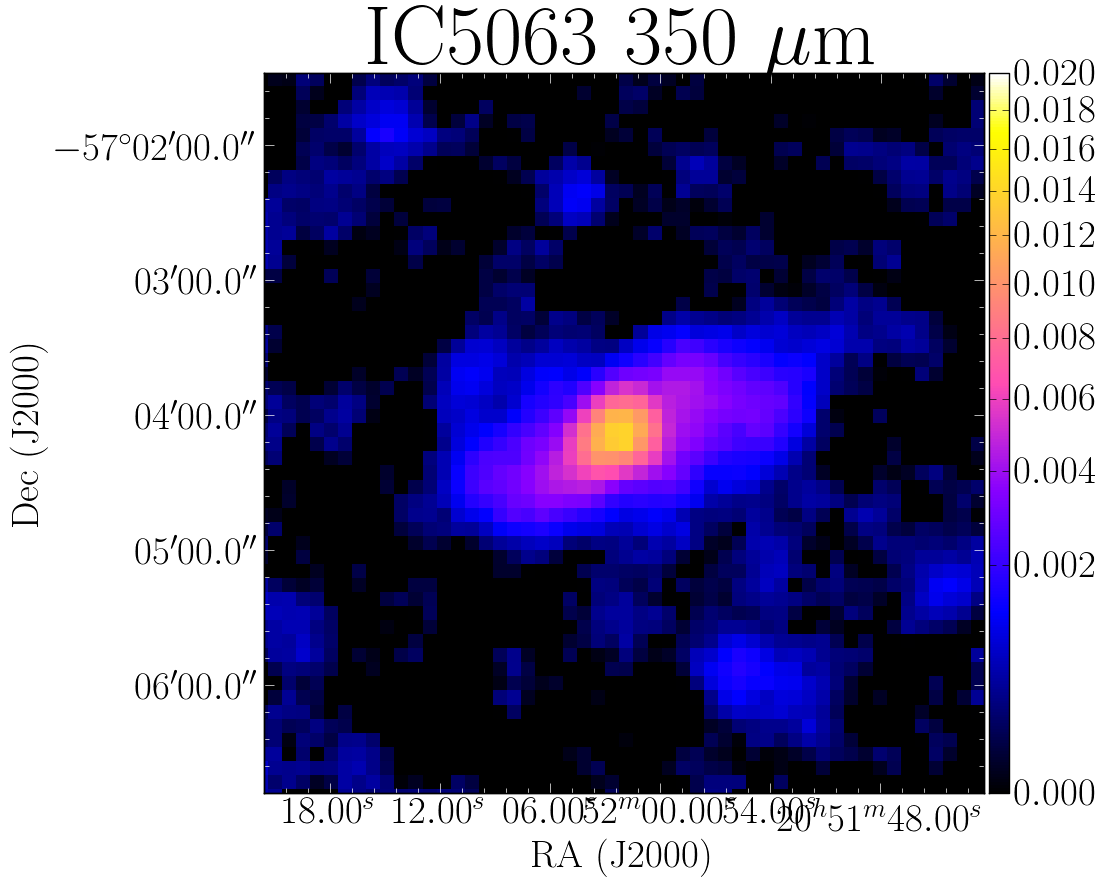
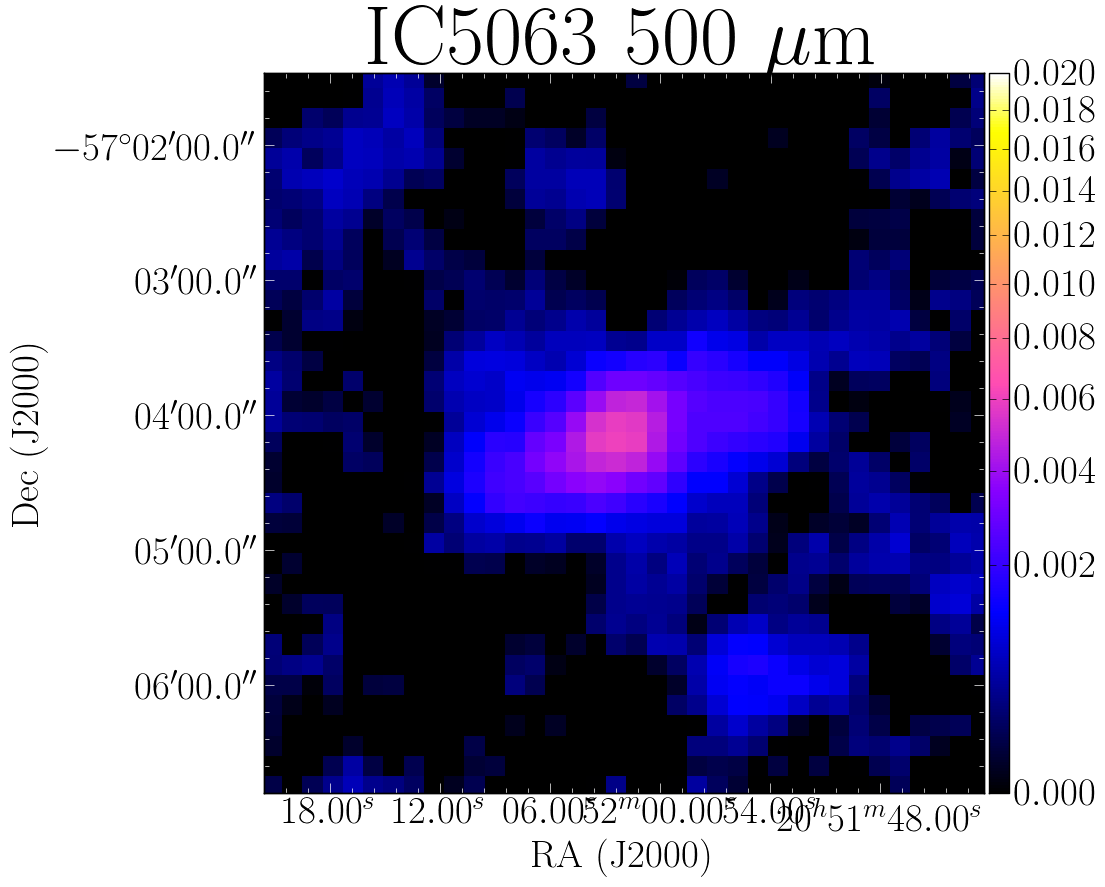
We compiled all the PACS and SPIRE images for our 33 galaxies using the Herschel Science Data Archive (HSA)333http://www.cosmos.esa.int/web/herschel/science-archive. First, we processed the raw level 1 data with the Herschel interactive pipeline environment software (HIPE) version 13 (, 2010) to obtain the flux calibrated timelines of each bolometer. The standard HIPE pipeline corrects for instrumental effects and attaches pointing information to the timelines. Then, we combined these timelines using Scanamorphos version 24 (Roussel, 2013). Scanamorphos subtracts low-frequency noise (thermal and non-thermal), masks high-frequency glitches of the data, and projects the timelines into a spatial grid. For the spatial grids, we selected a pixel size of FWHM/4 for each band. These values provide a good compromise between angular resolution and sampling (> 10 samples per pixel). We discarded mosaics at m where the galaxy reaches the edge of the image only in these band because we could not obtain reliable measurements of the background and could not obtain the integrated flux in the same aperture as the other bands. Only 22 of the 33 galaxies (67 per cent of the sample) have observations at m after discarding these images. The list of all the observations used can be found in Table 3. Fig. 2 shows an example of the mosaics of one galaxy in our sample observed in all PACS and SPIRE bands. The mosaics for the rest of the sample are available online. The number of images used for each band is given in Table 4.
| Galaxy | Observation ID | Instrument | Wavelengths (m) | PI |
|---|---|---|---|---|
| ESO 323-G077 | 1342236922 | PACS | 70, 160 | Mushotzky R. |
| ESO 323-G077 | 1342236923 | PACS | 70, 160 | Mushotzky R. |
| ESO 323-G077 | 1342236202 | SPIRE | 250, 350, 500 | Mushotzky R. |
| IC 5063 | 1342216469 | PACS | 70, 160 | Sánchez-Portal M. |
| IC 5063 | 1342216470 | PACS | 70, 160 | Sánchez-Portal M. |
| IC 5063 | 1342216471 | PACS | 100, 160 | Sánchez-Portal M. |
| IC 5063 | 1342216472 | PACS | 100, 160 | Sánchez-Portal M. |
| IC 5063 | 1342206208 | SPIRE | 250, 350, 500 | Sánchez-Portal M. |
3.2 Aperture photometry
Circular aperture photometry of the galaxies was carried out using HIPE version 13. For every galaxy and every band we performed the photometry for radii of 1 kpc, and 2 kpc, as well as for the total galaxy. To determine the size in arcsec corresponding to 1 kpc and 2 kpc we took into account the luminosity distance of each galaxy. The aperture corresponding to the total galaxy was determined by visual inspection of the radial profiles in all the bands. In Table 7 we list the apertures used for the total photometry. We imposed that the aperture had to be the same for all the bands. In some galaxies, part of the galaxy seen in the SPIRE bands is outside the aperture used for the photometry. To avoid errors in the photometry due to the small size of the aperture, we only consider fluxes from nuclear apertures with a diameter higher than 1.5 times the angular resolution of each band. The photometric error of each image is determined by placing six apertures on the background around the source and measuring the standard deviation per pixel of the background within these apertures. The error in the flux was then computed by multiplying the standard deviation per pixel by the number of pixels of the aperture.
| FWHM () | Number of images | FWHM (kpc) | ||||||||
|---|---|---|---|---|---|---|---|---|---|---|
| Galaxy | 70 m | 100 m | 160 m | 250 m | 350 m | 500 m | 70 m | 100 m | 160 m | 70 m |
| ESO 323-G077 | 6.7 | 12.4 | 19.2 | 25.4 | 36.7 | 2 | - | 2 | 1.9 | |
| IC 5063 | 6.0 | 7.8 | 13.1 | 22.6 | 33.6 | 51.9 | 2 | 2 | 4 | 1.4 |
| Mrk 1066 | 5.9 | 7.2 | 11.8 | 19.5 | 25.9 | 38.4 | 2 | 2 | 4 | 1.4 |
| NGC 1068 | 6.6 | 21.3 | 36.1 | 39.9 | 48.0 | 2 | - | 2 | 0.5 | |
| NGC 1320 | 6.1 | 8.4 | 14.7 | 22.2 | 28.5 | 41.2 | 2 | 2 | 4 | 1.0 |
| NGC 1365 | 10.3 | 11.9 | 17.4 | 23.7 | 29.9 | 39.9 | 2 | 2 | 4 | 1.1 |
| NGC 1386 | 6.1 | 8.0 | 14.5 | 23.8 | 30.4 | 39.8 | 2 | 2 | 4 | 0.3 |
| NGC 1808 | 9.4 | 11.2 | 15.3 | 21.3 | 28.3 | 39.8 | 2 | 2 | 4 | 0.6 |
| NGC 2110 | 6.6 | 8.3 | 13.2 | 20.6 | 27.2 | 46.0 | 2 | 2 | 4 | 1.0 |
| NGC 2273 | 6.1 | 7.6 | 12.2 | 20.4 | 27.9 | 40.5 | 2 | 2 | 4 | 0.8 |
| NGC 2992 | 7.9 | 9.5 | 14.2 | 21.1 | 28.6 | 39.9 | 2 | 2 | 4 | 1.3 |
| NGC 3081 | 6.2 | 8.1 | 13.3 | 22.9 | 37.6 | 65.1 | 2 | 2 | 4 | 1.0 |
| NGC 3227 | 6.3 | 12.7 | 22.4 | 31.9 | 46.4 | 2 | - | 4 | 0.6 | |
| NGC 3281 | 5.8 | 7.3 | 11.9 | 19.5 | 26.8 | 39.4 | 2 | 2 | 4 | 1.3 |
| NGC 3783 | 5.7 | 7.4 | 22.0 | 52.7 | 57.8 | 60.8 | 2 | 2 | 4 | 1.0 |
| NGC 4051 | 6.0 | 14.7 | 31.2 | 49.3 | 183.6 | 2 | - | 4 | 0.4 | |
| NGC 4151 | 5.9 | 13.7 | 31.3 | 44.5 | 141.7 | 2 | - | 4 | 0.6 | |
| NGC 4253 | 5.8 | 7.2 | 11.9 | 19.7 | 28.3 | 66.0 | 2 | 2 | 4 | 1.7 |
| NGC 4258 | 49.9 | 71.4 | 71.3 | 90.8 | 73.3 | 97.7 | 3 | 1 | 4 | 1.9 |
| NGC 4388 | 6.9 | 15.7 | 26.6 | 36.4 | 51.8 | 2 | - | 2 | 0.6 | |
| NGC 4507 | 5.7 | 12.8 | 28.5 | 44.2 | 58.1 | 2 | - | 2 | 1.6 | |
| NGC 4579 | 7.0 | 9.3 | 110.6 | 27.4 | 39.6 | 138.5 | 2 | 2 | 4 | 0.6 |
| NGC 4594 | 6.9 | 11.8 | 69.7 | 57.9 | 43.8 | 47.0 | 2 | 2 | 4 | 0.4 |
| NGC 4725 | 10.7 | 24.1 | 22.6 | 73.0 | 87.6 | 308.8 | 2 | 2 | 4 | 1.4 |
| NGC 5135 | 6.8 | 8.1 | 12.3 | 19.7 | 26.3 | 40.6 | 2 | 2 | 4 | 1.9 |
| NGC 5347 | 5.6 | 7.4 | 12.7 | 25.6 | 43.9 | 66.3 | 2 | 2 | 4 | 1.1 |
| NGC 5506 | 6.0 | 7.4 | 12.0 | 20.2 | 27.4 | 42.8 | 2 | 2 | 4 | 0.9 |
| NGC 7130 | 5.8 | 12.9 | 20.8 | 27.6 | 39.7 | 2 | - | 2 | 1.9 | |
| NGC 7172 | 7.1 | 13.4 | 20.8 | 27.3 | 41.2 | 2 | - | 2 | 1.3 | |
| NGC 7213 | 6.5 | 20.1 | 53.0 | 61.4 | 60.3 | 2 | - | 2 | 0.8 | |
| NGC 7465 | 7.3 | 9.2 | 14.1 | 22.1 | 30.0 | 47.2 | 2 | 4 | 6 | 1.0 |
| NGC 7479 | 5.6 | 7.3 | 12.3 | 21.6 | 32.3 | 47.9 | 2 | 2 | 4 | 0.9 |
| NGC 7582 | 6.6 | 12.3 | 19.8 | 26.7 | 42.6 | 2 | - | 4 | 0.7 | |
Notes.— All the galaxies have one image at the SPIRE bands except NGC 4258 and NGC 7465, which have two images.
We measured the FWHM for each galaxy at each band using Moffat with the Image Reduction and Analysis Facility (IRAF444IRAF is distributed by the National Optical Astronomy Observatory, which is operated by the Association of Universities for Research in Astronomy (AURA), Ibc., under cooperative agreement with the National Science Foundation.). We list in Table 4 the measured FWHM in all six Herschel bands. We then applied an aperture correction using HIPE to the fluxes of those galaxies that are point sources and quasi point sources. We did not apply an aperture correction to the extended sources. We consider that a source is quasi point-like at one particular band (although it may have extended emission) when the measured FWHM (see Table 4) is less than the FWHM of the instrument plus the number of arcseconds in one pixel. For a typical galaxy in our sample at 30 Mpc, the aperture correction at 70 m is 1.48 and 1.22 for photometry radio of 1 and 2 kpc, respectively. For sources that are quasi point-like the unresolved fluxes are probably slightly overestimated, as we shall see in Section 4.1. This is due to the instrumental Point Spread Function (PSF) that causes that a fraction of the external emission of the aperture to be observed in the inner region. However, although this correction cannot be calculated, it should be within the flux error and it does not modify our results.
To obtain the final error of the fluxes we added in quadrature the photometric calibration uncertainties (10 per cent) to the error calculated above. In Tables 5, 6 and 7 we provide the fluxes for all galaxies and all bands for kpc, kpc, and the total galaxy. We also list, for every galaxy, the size in arcsec for the aperture used. As can be seen from this table, the photometric calibration uncertainty dominates in most cases.
| Galaxy | radius | Flux | Flux | Flux | Flux | Flux | Flux |
|---|---|---|---|---|---|---|---|
| (arcsec) | 70m (Jy) | 100m (Jy) | 160m (Jy) | 250m (Jy) | 350m (Jy) | 500m (Jy) | |
| ESO 323-G077 | 3.43 | ||||||
| IC 5063 | 4.13 | ||||||
| Mrk 1066 | 4.21 | 121 | |||||
| NGC 1068 | 14.32 | 16416 | 889 | 283 | |||
| NGC 1320 | 5.81 | 1.80.2 | 2.00.2 |
| Galaxy | radius | Flux | Flux | Flux | Flux | Flux | Flux |
|---|---|---|---|---|---|---|---|
| (arcsec) | 70m (Jy) | 100m (Jy) | 160m (Jy) | 250m (Jy) | 350m (Jy) | 500m (Jy) | |
| ESO 323-G077 | 6.85 | 6.90.7 | |||||
| IC 5063 | 8.27 | 4.50.5 | 3.60.4 | ||||
| Mrk 1066 | 8.42 | 121 | 121 | ||||
| NGC 1068 | 28.65 | 25325 | 18619 | 657 | 232 | 8.00.8 | |
| NGC 1320 | 11.62 | 2.20.2 | 2.80.3 | 2.30.2 |
| Galaxy | radius | Flux | Flux | Flux | Flux | Flux | Flux |
|---|---|---|---|---|---|---|---|
| (arcsec) | 70m (Jy) | 100m (Jy) | 160m (Jy) | 250m (Jy) | 350m (Jy) | 500m (Jy) | |
| ESO 323-G077 | 50 | 6.80.8 | 7.10.8 | 3.20.3 | 1.30.1 | 0.430.04 | |
| IC 5063 | 60 | 4.70.5 | 4.60.5 | 3.70.4 | 2.10.2 | 0.90.1 | 0.300.04 |
| Mrk 1066 | 50 | 121 | 131 | 8.50.9 | 3.00.3 | 1.10.1 | 0.330.04 |
| NGC 1068 | 230 | 29230 | 29930 | 11712 | 455 | 152 | |
| NGC 1320 | 50 | 2.40.3 | 3.40.4 | 3.00.4 | 1.50.2 | 0.580.07 | 0.20 0.03 |
4 Results
In this Section we analyse the FIR properties of our sample, such as, the unresolved m emission, the FIR colour distributions, the results from fitting the data to a grey body and the SFR nuclear and extranuclear obtained from the 70 m data.
4.1 Unresolved m emission
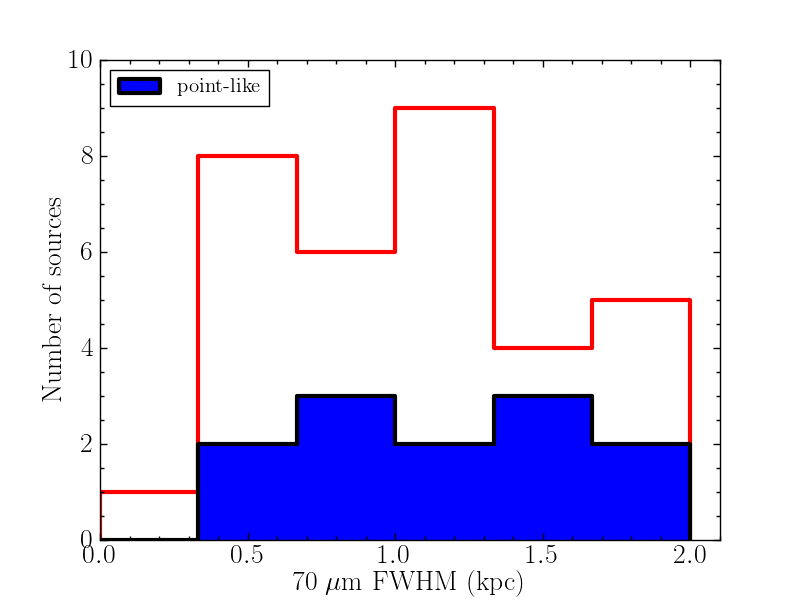
Of the 33 galaxies in our sample, 12 nuclei (31 per cent) appear point-like at 70 m, i.e., have FWHM 6 arcsec (see Table 4). As can be seen from Fig. 3, the m emission for those nuclei seen as point sources originates in regions with sizes (diameters) of less than kpc, with a median size of 1.3 kpc. These values are, however, comparable to those nuclei in our sample that appear clearly extended at m (median size of 1.0 kpc). The fraction of RSA Seyfert galaxies with unresolved emission is similar to that of the Swift/BAT hard X-ray selected AGN sample of (2014). They found that 35 per cent of their sources are point-like at m with typical sizes at m of 2 kpc. However, the Swift/BAT AGN sample is on average at , compared to the average of our sample. Therefore, it is likely that the difference in redshifts between our sample and the Swift/BAT sample explains the different physical sizes for the 70 emitting nuclear region.
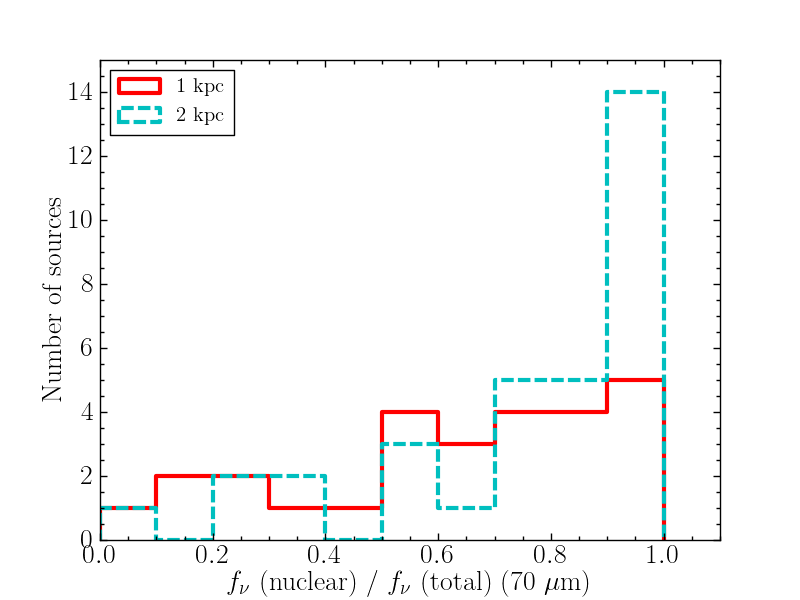
To study further the unresolved 70 m emission we estimated the contribution of the nuclear region to the total flux at m, as is shown in Fig. 4. The median values of the nuclear contributions to the total flux are 0.68 and 0.86 for kpc and kpc, respectively (see Table 8).
Of the 27 galaxies with measurements of the nuclear flux in kpc at 70 m, 20 (74 per cent) have a nuclear 1 kpc contribution to the total flux greater than 50 per cent. Of the 33 galaxies with nuclear fluxes within kpc at 70 m, 28 (85 per cent) have a nuclear kpc contribution greater than 50 per cent. The values obtained for 1 kpc and 2 kpc are similar because 88 per cent of the galaxies required an aperture correction for the fluxes. Our results are in agreement with (2014). They found that 92.5 per cent (274 out of 296 galaxies) of their sample had a point source contribution greater than 50 per cent of the total flux at 70 m. They found a slightly higher percentage because they performed the photometry with an aperture of 6 arcsec for the PACS 70 m images for all the galaxies, independently of their distance. As their galaxies are more distant than our sample, then the regions for their nuclear photometry are larger than our kpc and kpc nuclear regions. We note that (2014) also performed an aperture correction to the fluxes.
| Quantity | Number | Mean | Median | |
|---|---|---|---|---|
| (r=1kpc)/(total) | 27 | 0.63 | 0.28 | 0.68 |
| (r=2kpc)/(total) | 33 | 0.76 | 0.26 | 0.86 |
4.2 FIR colours
| Region | Number | Mean | Median | |
|---|---|---|---|---|
| RSA Seyferts | ||||
| kpc | 12 | 1.13 | 0.52 | 0.98 |
| kpc | 26 | 1.08 | 0.44 | 1.01 |
| Integrated | 33 | 0.78 | 0.30 | 0.80 |
| Swift/BAT AGN | ||||
| Integrated | 258 | 0.79 | 0.44 | 0.68 |
| PG quasars | ||||
| Integrated | 68 | 1.41 | 0.87 | 1.25 |
| KINGFISH galaxies | ||||
| Integrated normal | 29 | 0.75 | 0.45 | 0.66 |
| Integrated AGN | 31 | 0.51 | 0.27 | 0.43 |
| Integrated all | 60 | 0.63 | 0.39 | 0.50 |
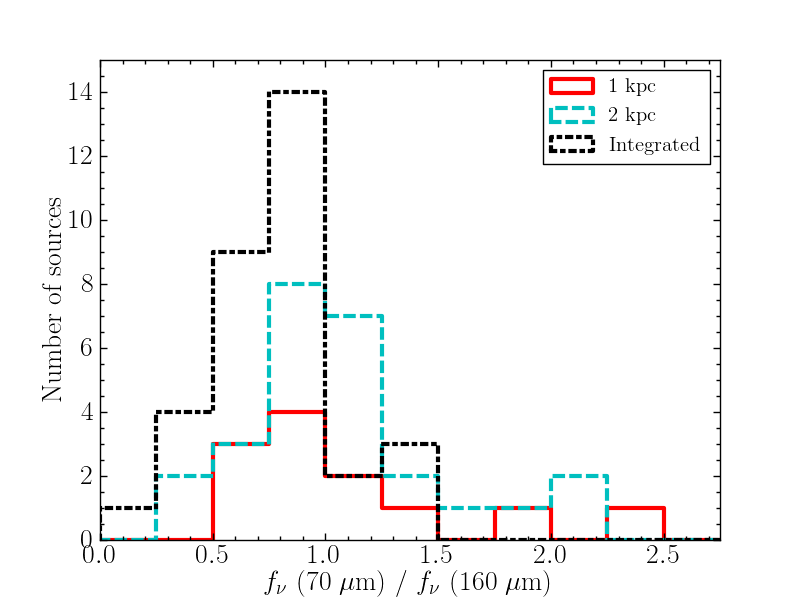
We first start by discussing the (70 m)/(160 m) flux ratio since we can still obtain nuclear values for a significant fraction of galaxies in our sample. It provides information about the peak of the galaxy spectral energy distribution (SED) and is a proxy for the dust temperature (, 2011; Meléndez et al., 2014). Figure 5 shows the distributions of this ratio for kpc and kpc, and for the entire galaxy. As can be seen from this figure (see Table 9 for the statistical information), the flux ratios for the nuclear regions tend to be higher than those measured for the entire galaxies. This is in good agreement with the decreasing (70 m)/(160 m) flux ratios with galactocentric radius found for M81 and M83 (, 2012). These authors suggested that this ratio tends to be more strongly influenced by star forming regions than other FIR ratios involving longer wavelengths. Therefore, the higher nuclear ratios in our sample could be due to higher star formation activity but also to higher dust temperature due to AGN heating (see further discussion in Section 5).
For the Swift/BAT AGN sample, Meléndez et al. (2014) measured a mean integrated (70 m)/(160 m) flux ratio of for Seyfert 1s and for Seyfert 2s. These are fundamentally the same as for our sample of optically selected AGN. Meléndez et al. (2014) also compared their observed colours with predictions from three different torus models and found that the torus models cannot produce (70 m)/(160 m) ratios of less than unity. This suggests that the 70 m and 160 m integrated emission is dominated by the host galaxy.
Meléndez et al. (2014) also compared the Swift/BAT AGN FIR colour distribution with the Key Insights on Nearby Galaxies: a Far-Infrared Survey with Herschel (KINGFISH) sample of nearby galaxies (2012). For this comparison, they only selected the normal galaxies in the KINGFISH sample using the spectral classification of Moustakas et al. (2010), and demonstrated that the BAT AGN FIR colours are statistically indistinguishable from those of normal galaxies. As our colour distribution for the total galaxies is compatible with the BAT AGN colour distribution, the colours of our galaxies are not statistically different from those of normal galaxies () comparing our galaxies with normal galaxies in the KINGFISH sample (see also Table 9).
Shimizu et al. (2015) also studied the BAT sample and found anomalous colours for 6 BAT AGN with (250 m)/(350 m) < 1.5 and (350 m)/(500 m) < 1.5. They suggested that this might be an excess based on the synchrotron emission from the jet or the corona from the accretion disks. We do not find these anomalous colours for our galaxies.
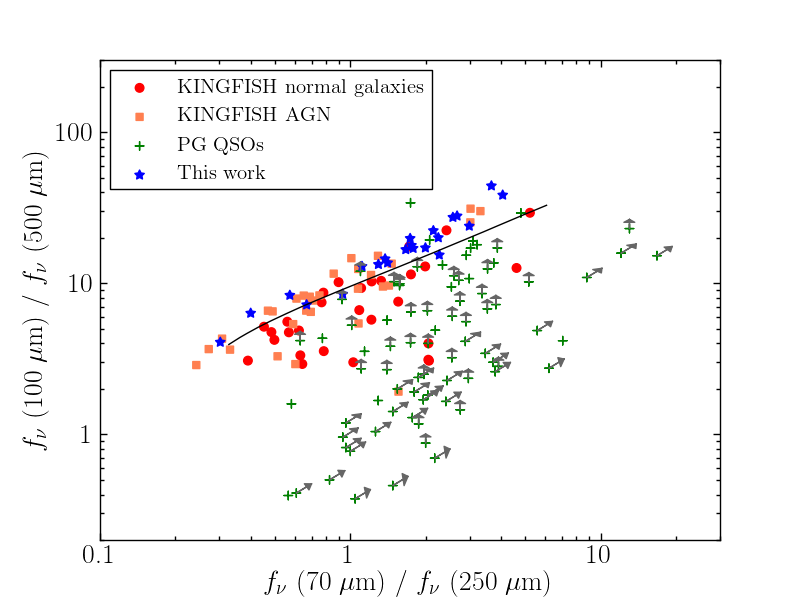
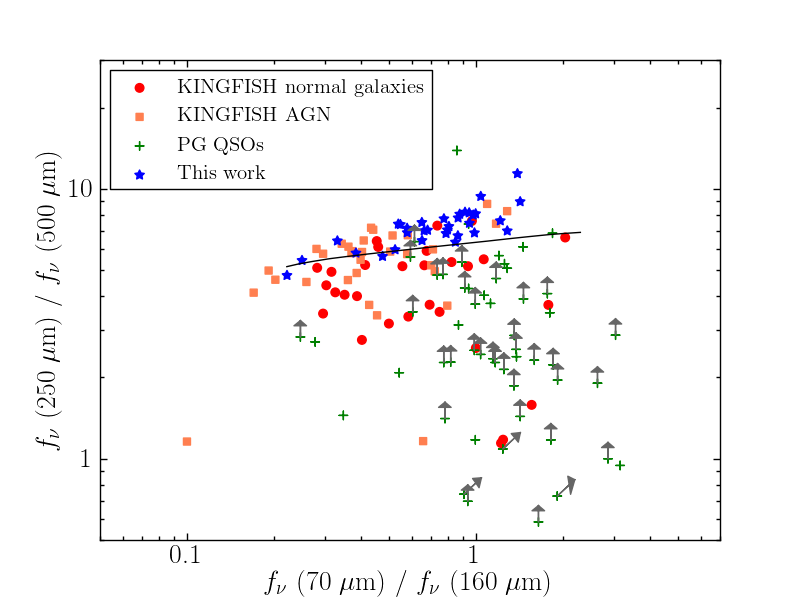
We also compare the other integrated FIR colours of our galaxies with the KINGFISH sample of (2012) (including normal galaxies and AGN) and with the 85 nearby (z0.5) quasars from the Palomar-Green (PG) sample of Petric et al. (2015). In Fig. 6 we show the (100 m)/(500 m) vs. (70 m)/(250 m) colour-color diagram (left) and (250 m)/(500 m) vs. (70 m)/(160 m) colour-colour diagram (right) for our galaxies, the KINGFISH sample and the PG quasar sample. Most of the PG quasars only have upper limits of the fluxes for some bands. There are 65 quasars with upper limits at 500 m, 29 at 250 m, 16 at 160 m, 4 at 100 m and 2 at 70 m. We do not display quasars with upper limits in the two fluxes involved in a ratio. In the left panel of Fig. 6 we show 81 quasars of the PG sample and in the right panel we show 54 quasars. We indicate with grey arrows the quasars with upper limits.
From Fig. 6, we observe that the (250 m)/(500 m) and (70 m)/(160 m) ratios of the RSA Seyfert galaxies ( and 30, respectively) are, on average, higher than those of the KINGFISH sample ( and , respectively). A K-S test indicates that the distributions of the two flux ratios are statistically different for our sample and the KINGFISH sample. We obtain p-values of and for the (70 m)/(160 m) and (250 m)/(500 m) ratios, which indicates that they are statistically drawn from different parent samples. This may be due to the large range of morphologies and metallicities of the KINGFISH galaxies, whereas the RSA Seyfert galaxies are mostly early type (see Table 1). The differences in the integrated (70 m)/(160 m) flux ratios are not in conflict with the comparison between the BAT AGN sample and the KINGFISH sample. Meléndez et al. (2014) compared their galaxies with the normal galaxies in the KINGFISH sample. A K-S test indicates that (70 m)/(160 m) ratios of Meléndez et al. (2014) and all the KINGFISH sample are statistically different ().
4.3 Grey-body fitting
In this section we estimate the dust temperature by fitting the Herschel SED to a grey body. We use sherpa (2007), that is, the Chandra Interactive Analysis of Observations (CIAO’s) modelling and fitting package (2001) module for python. We fit versus the rest-frame wavelength, using the following expression:
| (1) |
where is the rest-frame wavelength, and the free parameters of the fitting are the amplitude (), the dust temperature (), and the dust emissivity index (). To estimate the best fit to the data we first minimized the usual statistics leaving all the parameters to vary freely:
| (2) |
where is the number of data points, is the flux at the th wavelength, is the uncertainty of the observed flux at the th wavelength, and is the predicted for the th wavelength. We perform the fits for the integrated SEDs as well as for the nuclear kpc and kpc SEDs. We require four or more data points for the fittings.
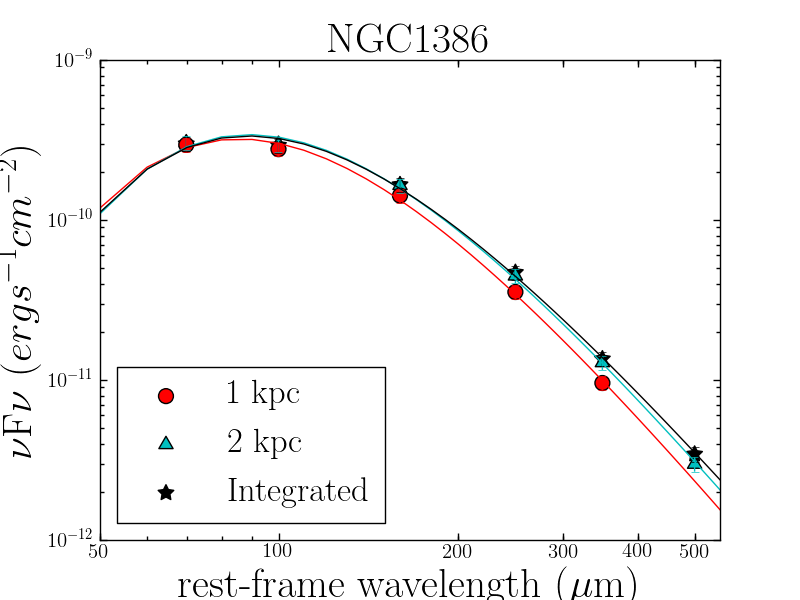
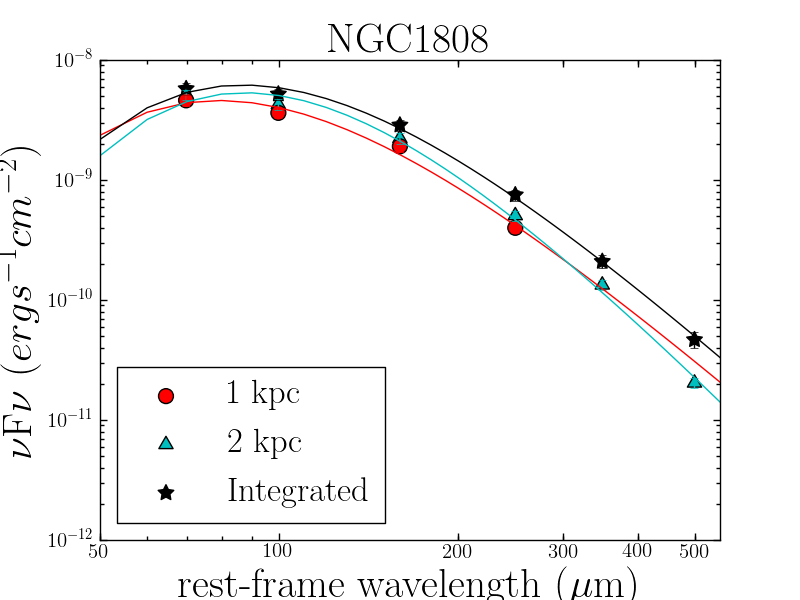
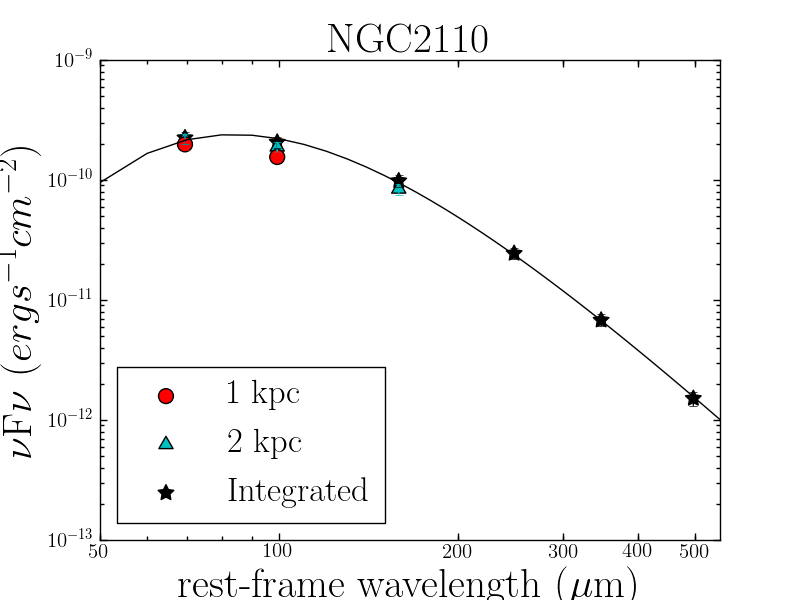
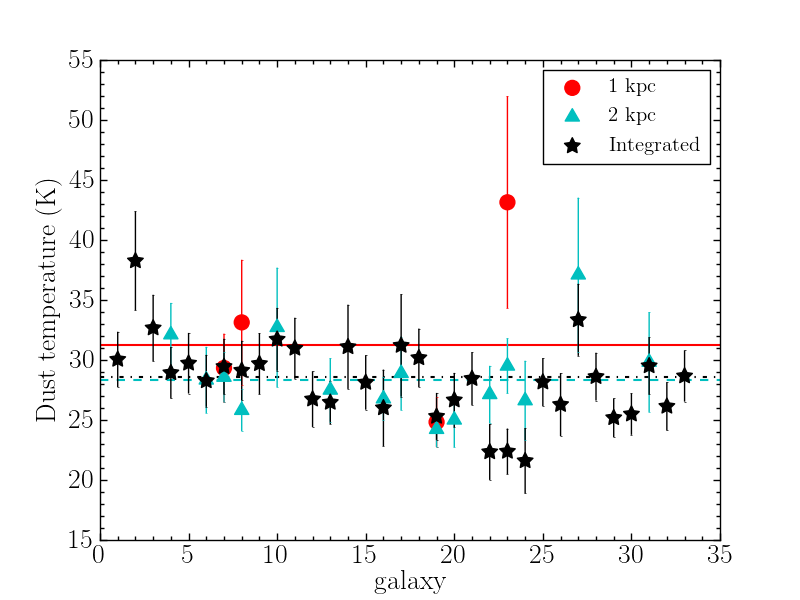
Figure 7 shows a few examples of the best-fits to the SEDs for kpc, kpc, and the total galaxy. In the rest of the galaxies in the sample can be found in the online version. The values of the best-fit and parameters are listed in Table 10. Figure 8 shows the distribution for each galaxy for kpc, kpc, and the total galaxy. In Fig. 9 we show, for each galaxy, the dust temperature obtained in the fitting of the different regions (1 kpc, 2 kpc, the total galaxy). In Table 11 we provide the statistical information corresponding to Figs. 8 and 9. We show in parenthesis the total values for those 14 galaxies in our sample with SED fits within kpc so we can compare the results for these galaxies in 2 kpc and the total galaxy.
| emission in 1 kpc | emission in 2 kpc | Integrated emission | Integrated emission with =2 | 70 m | ||||||||
| Galaxy | T | T | T | T | excess (%) | |||||||
| ESO323-G077 | 302 | 1.70.2 | 0.21 | 27.10.6 | 0.90 | 6 | ||||||
| IC5063 | 384 | 1.00.2 | 2.82 | 25.90.8 | 6.99 | 59 | ||||||
| Mrk1066 | 333 | 1.80.2 | 0.56 | 30.80.7 | 0.56 | 9 | ||||||
| NGC1068 | 323 | 1.90.2 | 0.39 | 292 | 1.90.2 | 0.01 | 27.80.6 | 0.11 | 1 | |||
| NGC1320 | 303 | 1.50.2 | 0.88 | 25.30.6 | 1.75 | 22 | ||||||
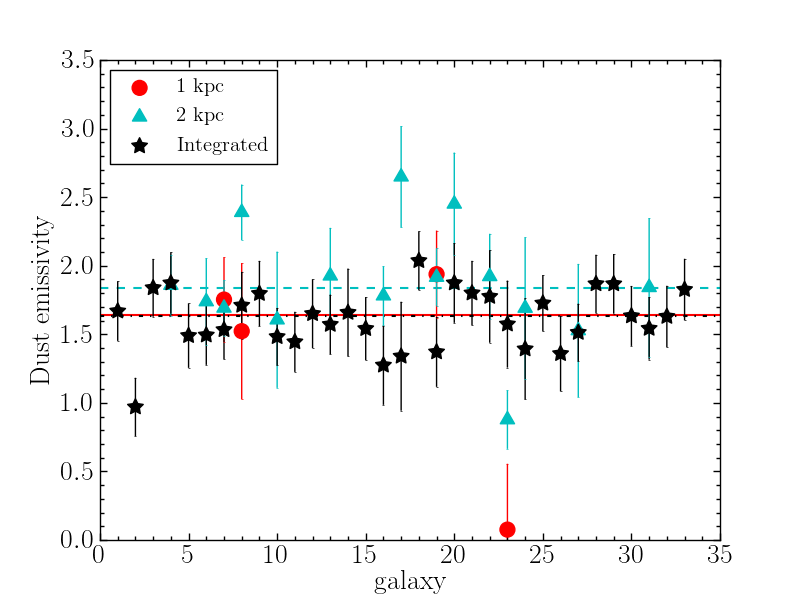
For galaxies with SED fits in the three physical regions, we find that the nuclear regions with kpc have the highest temperatures in agreement with the spatially resolved maps of the dust temperatures of (2013) for a few nearby Seyfert galaxies. The values obtained for the dust emissivity indices and temperatures for the integrated values are and K. These values of temperatures are in agreement with those obtained by (2012) (K) from fits to the m SEDs of KINGFISH galaxies. Our values are also in agreement with the ones of (2012) (). (1998) studied 10 Seyfert galaxies observed with ISO and obtained that the MIR to FIR SEDs can be reproduced with three different components: warm, cold and very cold dust. Our temperature range is between the very cold component (TK) and the cold component (TK), so it may be due to dust heated by stars in the disc (cold component) and by the general interstellar radiation field of the galaxy (very cold component).
For some galaxies (e.g., NGC 3081, NGC 3783, and NGC 5347) the fit to the integrated SED does not reproduce well the m data point. We also tried fits to the integrated SEDs without this data point and found that for the majority of galaxies the reduced values are higher with 70 m data than without it. This suggests that in some galaxies this excess of m emission requires another component with a higher dust temperature, which could be associated with dust heated by the AGN. We will come back to this issue in Section 5.
| Quantity | Region | Number | Mean | Median | |
|---|---|---|---|---|---|
| Dust emissivity | 1 kpc | 4 | 1.3 | 0.7 | 1.6 |
| Dust emissivity | 2 kpc | 15 | 1.9 | 0.4 | 1.8 |
| Dust emissivity | integrated | 33 (15) | 1.6 (1.6) | 0.2 (0.2) | 1.6 (1.5) |
| Reduced | 1 kpc | 4 | 1.47 | 1.34 | 0.77 |
| Reduced | 2 kpc | 15 | 0.90 | 0.81 | 0.57 |
| Reduced | integrated | 33 (15) | 0.76 (0.55) | 0.66 (0.40) | 0.65 (0.45) |
| Reduced , =2 | integrated | 33 (15) | 1.37 (1.23) | 1.21 (0.73) | 1.28 (1.28) |
| Dust temperature (K) | 1 kpc | 4 | 33 | 7 | 31 |
| Dust temperature (K) | 2 kpc | 15 | 29 | 39 | 28 |
| Dust temperature (K) | integrated | 33 (15) | 28 (28) | 3 (3) | 29 (28) |
| Dust temperature (K), =2 | integrated | 33 (15) | 25 (24) | 3 (3) | 26 (25) |
Notes.— We show in parenthesis the total values for the 15 galaxies that also have SED fits within kpc.
To quantify the 70 m excess in the integrated SED from the single temperature fits, we performed new grey body fits imposing =2, which is the typical value for star forming galaxies (, 2001). The statistical information about the fitted values of the dust temperature for are listed in Table 11. The range of dust temperatures obtained with the fit imposing =2 is K, which are the normal temperatures for star forming galaxies. As expected, since and are anticorrelated (see e.g. , 2012, and also Figs. 8 and 9), for a given galaxy the fits with fixed dust emissivity produce lower dust temperatures.
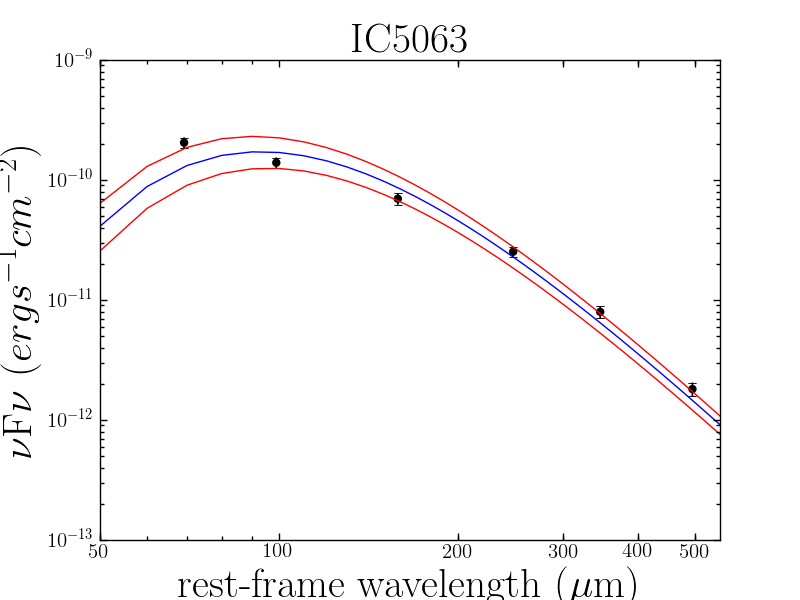
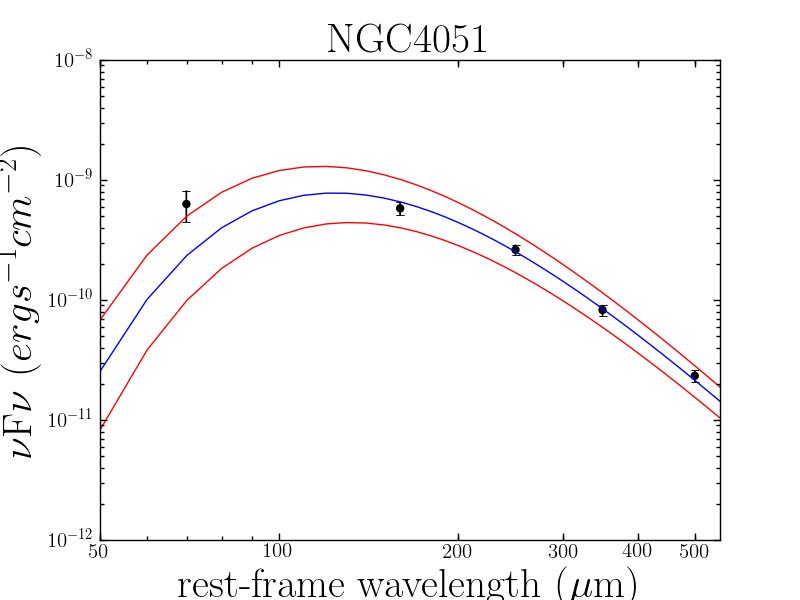
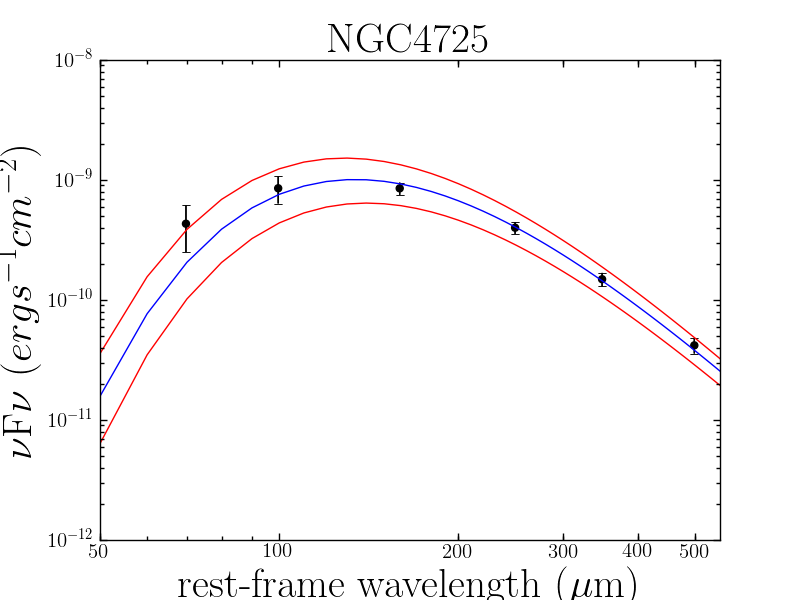
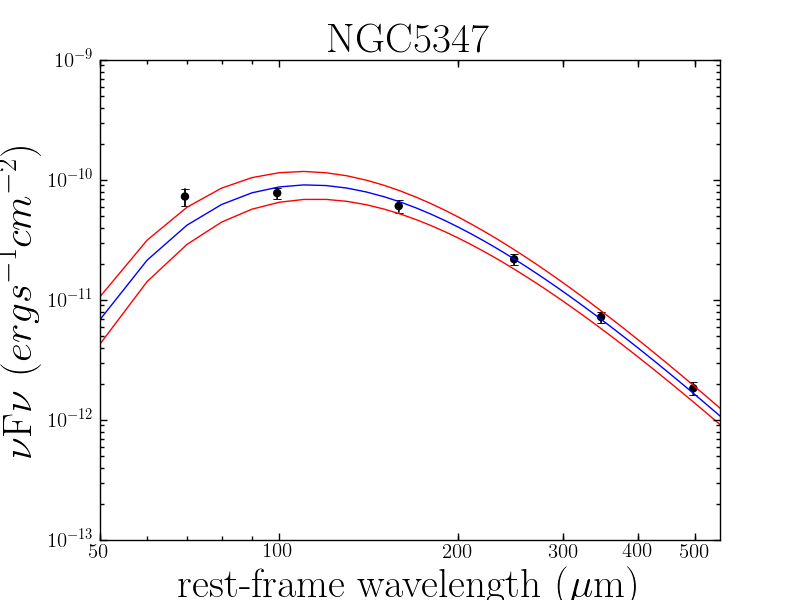
In Fig. 10 we show 4 RSA Seyfert galaxies with integrated SED fits with fixed dust emissivity showing the highest excesses at m over the single temperature fits, which puts them clearly above the uncertainty of their fits. The data are shown in black, and the best fit with =2 is shown in blue. The red lines indicate the best fit of the free parameters. The results for these fits for the rest of the sample are in the online version.
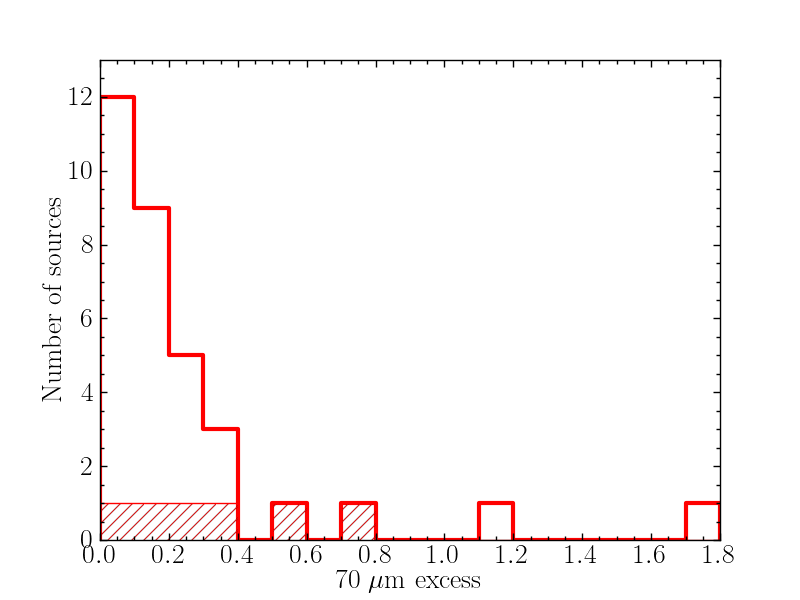
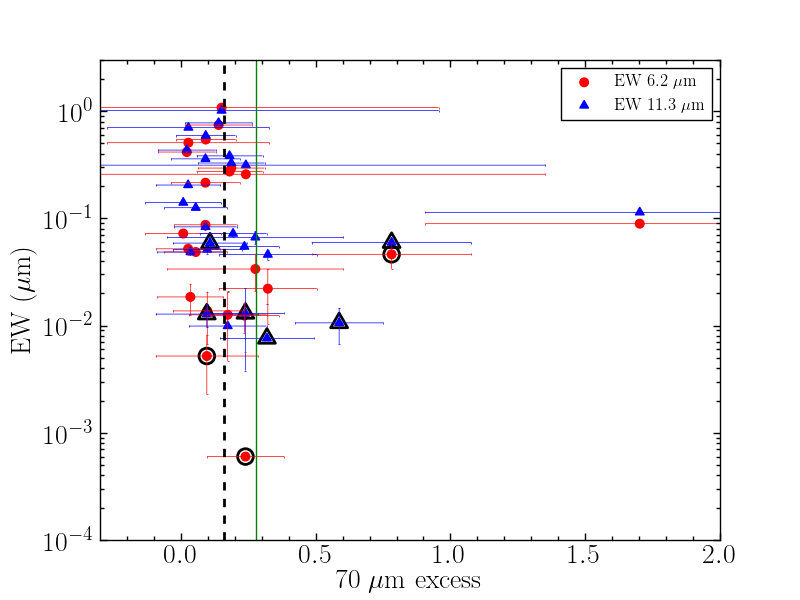
We quantify the excess over the fit at m as, , where is the grey body fitted with and free dust temperature and is the observed integrated value at m. In Table 10 we list in the last column the 70 m excess. The average and median m excess of the sample are 26 per cent and 16 per cent, respectively, although some galaxies have high excesses, such as NGC 4051 (170 per cent excess) and NGC 4725 (114 per cent excess). In Fig. 11 we show the 70 m excess distribution. We note that all the sources have a positive excess. These m excesses might be due to a hotter dust component not necessarily related to dust heated by an AGN (, 2012, 2012). We will discuss this further in Section 5.
4.4 Star Formation Rates
In this subsection we calculate the nuclear and extranuclear SFR using the m luminosity and compare them with the SFR obtained with other indicators. The goal is to identify galaxies where there is excess emission at m due to the AGN. We use the recipe from (2013), which assumes a (2001) IMF:
| (3) |
The calibration coefficient is different depending on the region of the galaxy. To calculate the SFR we used the coefficients from (2010) and (2010), which are and , respectively. The (2010) coefficient was derived from the integrated emission of galaxies and includes contributions from the diffuse component at m whereas the (2010) measurements are local (star forming regions on scales of kpc) and minimize the contribution of any diffuse component.
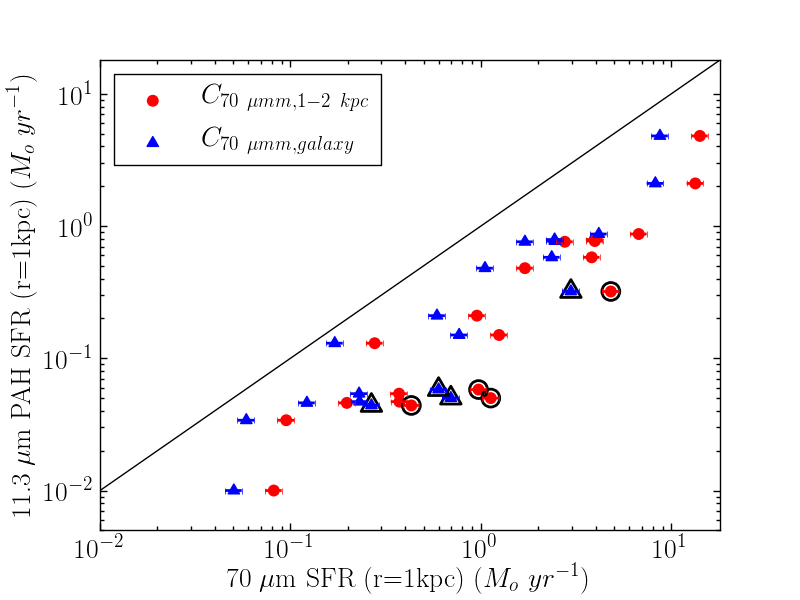
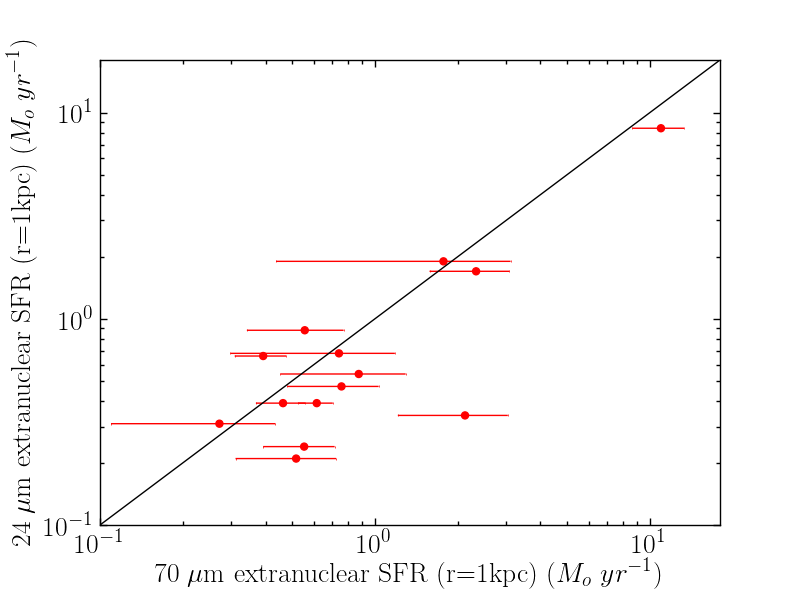
Figures 12 and 13 compare the values for the SFR obtained by DSR2012 with our m-based SFRs for the nuclear (kpc) and extranuclear (kpc) regions, respectively. We have 20 galaxies in common with DSR2012 with nuclear SFR values and 14 galaxies in common with the DSR2012 extranuclear SFR values. They obtained their nuclear SFR values from the luminosity of the m PAH feature and the extranuclear SFR from the luminosity of the extended m continuum emission after subtracting the contribution from the nuclear source. For the nuclear SFRs our values derived with the coefficient for the whole galaxy are on average four times higher than those of DSR2012, and even a factor of 7 if we used the coefficient for kpc regions. These differences are larger than the quoted scatter of 0.14dex of the (2010) calibration with some galaxies showing large discrepancies. For instance, NGC 3783 has a nuclear m based SFR 13.6 times higher than the nuclear m PAH based SFR. For the extranuclear SFRs, the majority of the galaxies in our sample have higher SFRs using the 70 m emission than the DSR2012 value, although the galaxies appear to be closer to the 1:1 line.
The discrepancies in SFRs found for the RSA Seyferts are similar to those for the Swift/BAT AGN of (2014). They calculated the total SFR using the (2010) m calibration, that is for the entire galaxy, and compared them with the SFR obtained from the m PAH feature using the calibration from DSR2012. They obtained a discrepancy of a factor of 3 between the two SFR. Petric et al. (2015) also found that the integrated galaxy SFRs of a sample of PG quasars obtained from the m PAH feature were on average 3 times lower than the SFR estimated from the m emission.
All the differences in SFR described above could be explained if the carriers of the m PAH feature were being destroyed by the AGN radiation field, if there were aperture correction issues and/or if there were systematics in the calibrations. DSR2012 argued that SFR estimates using the m PAH feature appear to be robust to the effects of AGN and shock processing based on the good correlation with the [Ne ii]m line on kpc scales. Additionally Esquej et al. (2014) showed that even on smaller physical nuclear scales of nearby Seyferts there is no strong evidence for destruction of the m PAH carriers. The SFR differences do not seem to be due to the aperture corrections applied because all three works (DSR2012, 2014 and Petric et al. 2015) also applied aperture corrections to their fluxes.
5 Identifying galaxies with significant m emission due to AGN heated dust
As the goal of this work is to select galaxies whose m emission is mostly due to dust heated by the AGN, in this section we put forward four different criteria to identify this type of galaxies. We also compare them with other results in the literature and propose candidate RSA galaxies with significant nuclear m AGN emission.
5.1 Elevated m)/m) flux ratios
If the m)/m) flux ratios are higher than the typical values for star forming galaxies, this might indicate that part of the nuclear 70 m emission is due to the dust heated by the AGN instead of star formation. To select the galaxies with an elevated m)/m) flux ratio we choose all the galaxies with a value higher than the median plus , where the M.A.D (absolute median deviation) is calculated as the median of the absolute deviations from the data median, . We do this for the kpc, kpc, and integrated flux ratios using the statistics in Table 9, each one with its own value.
We select 9 galaxies with this criterion (see Table 12). We note that the 2 galaxies with high m)/m) flux ratios within kpc also show it within kpc. All the galaxies with a high flux ratio within kpc have high flux ratio at kpc or have no measurements within 1 kpc. The same happens with the total flux ratio, galaxies with high total flux ratio have also high 2 kpc flux ratio or have no measurement at 2 kpc. However, not all galaxies with a high nuclear flux ratio have also high total flux ratio. Only NGC 5506 is selected from the flux ratios within kpc and with the total galaxy flux. The rest have extended diffuse emission at 160 m and therefore their measured integrated flux is higher at 160 m than at 70 m (see Fig. 2 and Table 7).
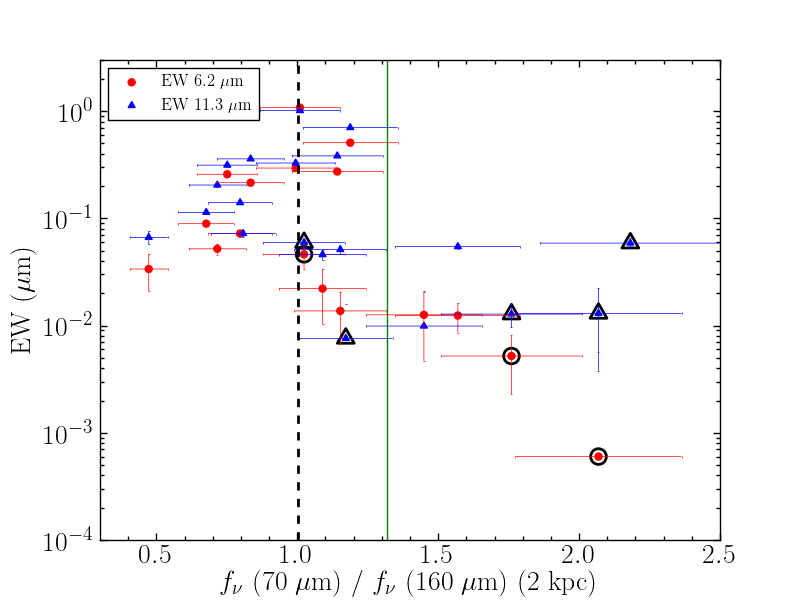
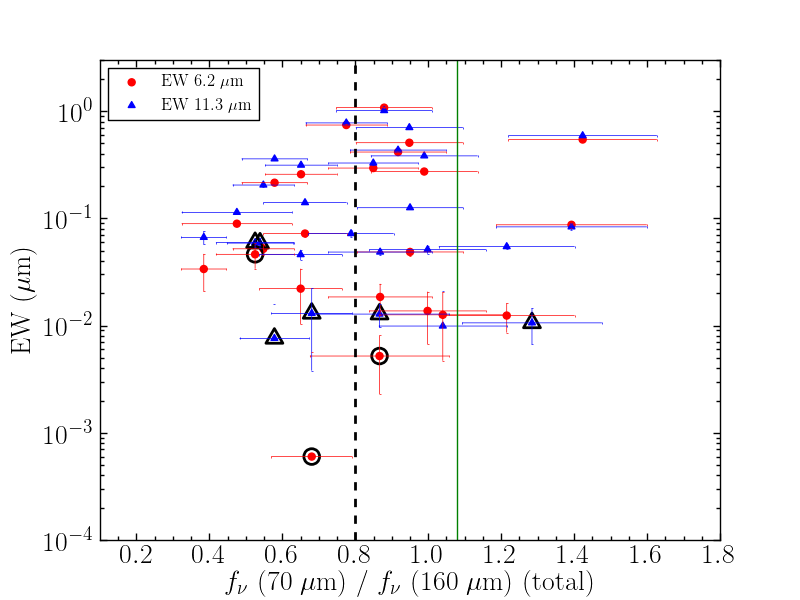
Figure 14 shows the relation between the m)/m) flux ratio and the EW of the 6.2 and m PAH features measured from Spitzer/IRS spectra. The emission from these features is an indicator of the presence of on-going/recent star formation activity (, 2004) but can be diluted by the AGN continuum, resulting in lower EW (Spoon et al., 2007; Díaz-Santos et al., 2010; Hernán-Caballero & Hatziminaoglou, 2011; Esquej et al., 2014). Note that not all the galaxies in our sample have a value of the EW (see Table 1). There is one galaxy that satisfies the criterion for kpc without EW data.
As expected, those galaxies with a high value of the m)/m) have a small value of the EW of the PAH features, indicating that it is a good criterion to select galaxies with the dust heated by the AGN. We note that the size of the IRS SL slit is similar to the FWHM at 70 . The only discrepant galaxy is the Seyfert 2 galaxy Mrk 1066, which has a high total m)/m) flux ratio, but also a high value of the EW of the PAHs. Alonso-Herrero et al. (2014) and Ramos Almeida et al. (2014) have shown, based on high angular resolution (arcsec) MIR spectroscopy, that this galaxy has a strong nuclear starburst including the central pc region. This would explain the elevated FIR colours of this galaxy. However, as can be seen from Fig. 14, not all galaxies with low PAH EWs features satisfy this criterion. Since the PAH features probe mostly the emission from O and B stars (, 2004), it is possible that some galaxies in our sample have most of their FIR emission mainly due to heating from older stars (see e.g. , 2010) explaining why they do not have bright PAH emission but still have normal FIR colours. Alternatively for these galaxies the torus emission might dominate in the MIR but it decays rapidly in the FIR (see 2011).
5.2 Dust temperature gradient higher than typical star forming galaxies
If the nuclear dust temperature is higher than those typical of star forming galaxies, this may indicate that the nuclear dust is not only heated by star forming but also by the AGN. However, because star-forming galaxies show a range of dust temperatures (, 2012), for a given galaxy we compare the nuclear (kpc and kpc) temperatures to the dust temperature fitted for entire galaxy.
To select the galaxies with an elevated dust temperature gradient we use as criterion the ratio between the nuclear temperature and the total temperature for each galaxy. We select all the galaxies with a value higher than the median plus 1.4826 M.A.D for our sample of galaxies. For this criterion we can use 15 galaxies, which are the galaxies with at least four data points to fit the kpc SEDs. These 15 galaxies have similar mean integrated dust temperatures to those of the other RSA Seyfers (see Table 11). With this criterion we select 3 galaxies with higher dust temperature gradient than the typical in our sample. These are NGC 4579, NGC 4594, and NGC 4725.
| Galaxy | #1 | #2 | #3 | #4 | ||||
|---|---|---|---|---|---|---|---|---|
| 70 m | SFR70μm/SFRD-S | criteria | ||||||
| kpc | kpc | Integrated | kpc | kpc | excess | kpc | ||
| ESO 323-G077 | - | - | x | - | - | x | - | 0/2 |
| IC 5063 | - | - | ✓ | - | - | ✓ | - | 2/2 |
| Mrk 1066 | - | - | ✓ | - | - | x | - | 1/2 |
| NGC 1068 | ✓ | ✓ | x | - | x | x | - | 1/3 |
| NGC 1320 | - | x | x | - | - | x | - | 0/2 |
| NGC 1365 | x | x | x | - | x | x | x | 0/4 |
| NGC 1386 | x | x | x | x | x | x | x | 0/4 |
| NGC 1808 | x | x | x | x | x | x | - | 0/3 |
| NGC 2110 | - | x | x | - | - | x | - | 0/2 |
| NGC 2273 | - | x | x | - | x | x | x | 0/4 |
| NGC 2992 | - | x | x | - | - | x | x | 0/3 |
| NGC 3081 | - | x | x | - | - | ✓ | x | 1/3 |
| NGC 3227 | x | x | x | - | x | x | x | 0/4 |
| NGC 3281 | - | ✓ | x | - | - | x | x | 1/3 |
| NGC 3783 | - | ✓ | x | - | - | x | ✓ | 2/3 |
| NGC 4051 | x | x | x | - | x | ✓ | x | 1/4 |
| NGC 4151 | ✓ | ✓ | x | - | x | x | ✓ | 2/4 |
| NGC 4253 | - | - | ✓ | - | - | x | - | 1/2 |
| NGC 4258 | x | x | x | x | x | x | x | 0/4 |
| NGC 4388 | - | x | x | - | x | x | x | 0/4 |
| NGC 4507 | - | - | x | - | - | x | - | 0/2 |
| NGC 4579 | x | x | x | - | ✓ | ✓ | x | 2/4 |
| NGC 4594 | x | x | x | ✓ | ✓ | x | x | 1/4 |
| NGC 4725 | - | x | x | - | ✓ | ✓ | x | 2/4 |
| NGC 5135 | - | - | x | - | - | x | - | 0/2 |
| NGC 5347 | - | x | x | - | - | ✓ | - | 1/2 |
| NGC 5506 | - | ✓ | ✓ | - | x | x | x | 1/4 |
| NGC 7130 | - | - | x | - | - | x | - | 0/2 |
| NGC 7172 | - | x | x | - | - | x | x | 0/3 |
| NGC 7213 | - | ✓ | x | - | - | x | ✓ | 2/3 |
| NGC 7465 | - | x | x | - | x | x | - | 0/3 |
| NGC 7479 | - | x | x | - | - | ✓ | ✓ | 2/3 |
| NGC 7582 | x | x | x | - | - | x | x | 0/3 |
Notes.— In bold are marked galaxies satisfying at least half of the conditions.
5.3 Excess 70 m emission with respect to the fit of the FIR SEDs with a grey body
The m excess with respect to the fit of the FIR SEDs with a grey body with =2 could in principle indicate that this emission is not only due to star formation but that there is some contribution from the AGN. We select those galaxies whose excess at m is higher than the median plus 1.4826 M.A.D for our sample of galaxies (28 per cent).
Figure 15 plots the m excess against the EW of the 6.2 and m PAH features as measured from the Spitzer/IRS spectra. Since those galaxies with a considerable excess also have small values of EW for both features, it is likely that this criterion selects galaxies with a contribution to the m from dust heated by the AGN. Again, as found for the FIR colours, not all galaxies with low EW of the PAH features have a m excess.
5.4 Excess of nuclear SFR obtained from m over SFR from mid-infrared indicators
As showed in Section 4.4, all the nuclear m-based SFR are systematically higher than those obtained by DSR2012 using the m PAH feature luminosity. We explained this as due to systematics in the calibrations. For this reason, we select those galaxies with the most discrepant values of SFR, i.e. all the galaxies with a value of higher than the median plus 1.4826 M.A.D.. This could indicate that part of the nuclear 70 m emission of these galaxies is due to the dust heated by the AGN. For this criterion we can use 20 galaxies that are the ones in common with DSR2012 and with measurements at 70 m for kpc. We select 4 galaxies with m-based nuclear SFR higher than expected taking into account the systematics in the calibrations, namely, NGC 3783, NGC 4151, NGC 7213, and NGC 7479. These four galaxies also satisfy some of the other criteria above.
5.5 Comparison with other works
The results about the nuclear 70 emission obtained with the above criteria are in good agreement with the detailed Herschel imaging studies of the infrared emission of three Seyfert galaxies, NGC 1365, NGC 2992, and NGC 3081 mentioned in Section 1. (2012) and (2015) found that the AGN emission does not dominate the m emission of NGC 1365 and NGC 2992, respectively. These two galaxies do not satisfy any of our selection criteria. On the other hand, (2011) assumed that the nuclear 70m flux of NGC 3081 is due to dust heated in the torus surrounding the AGN. They modelled the unresolved infrared emission of this galaxy with the Nenkova et al. (2008) clumpy torus models and were able to reproduce the AGN bolometric luminosity. This galaxy satisfies the 70 m excess emission with respect to the fit of the FIR SEDs with a grey body with criterion. The reason why this galaxy does not meet the other criteria may be due to the nuclear ring of 2 kpc in diameter. Because of its distance we were not able to derive nuclear kpc dust temperature and flux ratio. Therefore we were restricted to measurements within kpc and the total galaxy.
We have 4 galaxies in common with the work of (2011), namely, NGC 2110, NGC 4507, NGC 5506, and IC 5063. Among these they found that the only galaxy dominated by the AGN emission at m is IC 5063 in good agreement with our results.
5.6 Inspection of the candidates to significant nuclear m AGN emission
Table 12 summarizes the selection criteria fulfilled by each galaxy. In the last column we indicate the number of criteria satisfied by each galaxy. 16 galaxies (48 per cent of the sample) satisfy at least one of these requirements, while 10 of them fit at least half of the criteria. We found no differences between Seyfert 1 and 2 in terms of the selection requirements (p=0.30 with the Fisher’s test). Of the 16 galaxies that satisfy at least one criterion, 9 are Seyfert 1 and 7 Seyfert 2. We also found no differences between the galaxies that satisfy at least one criterion and the galaxies that donot satisfy any of them in terms of AGN luminosity or 70 m luminosity.
In what follows we take a conservative approach by only considering the 10 RSA Seyferts in our sample that satisfy half or more of the criteria defined in the previous sections to select candidates with a significant AGN contribution to the nuclear m emission.
We start by discarding two galaxies, NGC 4253 and Mrk 1066, as both show m PAH emission in the inner 0.5 arcseconds, equivalent to physical sizes of 120 and 145 pc, respectively (Alonso-Herrero et al., 2014, 2016) as well as high SFR within kpc scales. This probably suggests that the elevated m)/m) flux ratios are due to strong star formation rather than AGN dominated fluxes at m (see Ramos Almeida et al., 2014, for a detailed discussion of Mrk 1066).
We next discuss NGC 4579 and NGC 4725, which are among the least luminous AGN in our sample of RSA Seyferts. Both are close to the low-luminosity AGN (LLAGN) limit of below which the dusty torus is predicted to disappear (Elitzur & Shlosman, 2006). As can be seen from Table 10, both galaxies show a significant excess at m with respect to the grey body fit to the integrated SED. However, if we assumed that the excess is entirely due to dust heated by the AGN, then the AGN flux at m would be similar to the measured nuclear kpc flux for NGC 4579 which is resolved (FWHM=600 pc) at this wavelength. For NGC 4725 the predicted AGN flux would be more than twenty times brighter than that arising from the nuclear (resolved) region with a 1.4 kpc size (FWHM). We therefore conclude that the m nuclear emission of NGC 4579 and NGC 4725 at the Herschel resolution is not dominated by dust heated from the AGN.
We are left with six (18 per cent of the sample) bona fide candidates, namely, IC 5063, NGC 3783, NGC 4151, NGC 5347, NGC 7213, and NGC 7479.
5.7 MIR and FIR emission of the candidates to significant nuclear m AGN emission
None of the six candidates shows m PAH emission in high angular resolution (0.5-0.7 arcsec scales) MIR spectroscopy (, 2011; González-Martín et al., 2013; Esquej et al., 2014; Alonso-Herrero et al., 2016) and all of them show low values of the nuclear SFRs (see Table 1). Hernán-Caballero et al. (2015) performed a spectral decomposition of 118 Spitzer IRS spectra of local AGN. The 6 candidates have a high AGN contribution (within the IRS slit) at m and an AGN 12 luminosity in agreement with the estimates from nuclear high angular resolution spectra (, 2011; González-Martín et al., 2013). We show the selected galaxies as the hatched histogram in Fig. 11 and with black symbols in Figs. 12, 14, and 15.
We used the different criteria to estimate the range of the AGN flux at 70 . For each galaxy we only used the criteria satisfied (see Table 12). For the galaxies that have a 70 excess with respect to the fit of the FIR SEDs with a grey body (see Section 5.3), we can estimate directly the AGN flux. For the galaxies that satisfied the elevated m)/m) flux ratios (see Section 5.1), or the excess of nuclear SFR obtained from m over SFR from mid-infrared indicators (see Section 5.4) we make the observed values compatible with the typical values of the sample, and the excess is assumed to be the AGN emission. For IC 5063 we obtain an AGN flux at 70 of 1.8 Jy (40 per cent of the nuclear r = 2 kpc flux) using the two criteria. For NGC 5347 we can only calculate the contribution with the excess with respect to the grey body fit. The AGN contribution is approximately 0.7 Jy (61 per cent of the nuclear r = 1 kpc flux). For the rest of the galaxies we obtain different fluxes depending on the criterion used to estimate the 70 AGN flux. The ranges are Jy for NGC 3783 ( per cent of the nuclear r = 1 kpc flux); Jy for NGC 4151 ( per cent of the nuclear r = 1 kpc flux); Jy for NGC 7213 ( per cent of the nuclear r = 1 kpc flux); and Jy for NGC 7479 ( per cent of the nuclear r = 1 kpc flux). We finally note that the estimated AGN m fluxes for IC 5063 and NGC 4151 are in good agreement with the predicted torus FIR emission from the extrapolation of the fits to the unresolved near-infrared and MIR emission (, 2011; Ichikawa et al., 2015) using clumpy torus models.
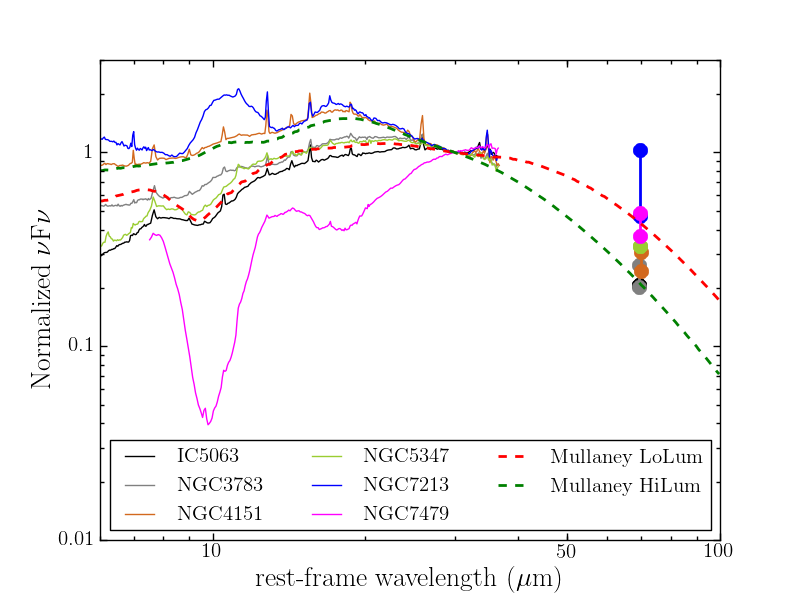
Figure 16 shows the Spitzer/IRS SL+LL spectra for these six galaxies, normalized at 30 m. We also plot the estimated AGN m flux ranges and the average SEDs of the low luminosity (log() < 42.9) and high luminosity (log() > 42.9) AGN of (2011), all of them normalized at 30 m. All our candidates have MIR and 70 AGN emission entirely consistent with the empirically determined low and high luminosity AGN templates of (2011), except around the 9.7 silicate feature range for the two most extreme features (NGC 7213 and NGC 7479).
In summary, for our sample of 33 RSA Seyferts we found a small fraction of galaxies (6/33, 18 per cent) with a significant contribution from AGN heated dust to the nuclear m emission. This fraction is similar to the findings of (2011) for a sample of X-ray selected sample with no evidence of host emission in their MIR Spitzer/IRS spectra. They only identified 4 galaxies out of the 25 AGN with FIR emission dominated by the AGN. This demonstrates that our FIR method to select galaxies with significant nuclear m AGN emission for optically selected Seyferts produces similar results to their MIR based method for X-ray selected AGN.
6 Summary and conclusions
In this work we studied the nuclear and integrated FIR (m) emission of 33 nearby (median distance of 30 Mpc) Seyfert galaxies from the RSA catalogue using Herschel/PACS and SPIRE imaging observations. We selected these galaxies because they are nearby and have estimates of their nuclear and integrated SFR. The goal was to identify galaxies with a significant fraction of their m emission produced by dust heated by the AGN by taking advantage of the broad FIR spectral coverage and the good angular resolution at m (median 0.8 kpc FWHM for our sample). We analysed the FIR properties of our sample, such as the unresolved 70 m emission and the nuclear (kpc and kpc) and integrated FIR colours. We fitted grey-bodies to their SEDs and derived nuclear and integrated SFR. We finally put forward four criteria to select galaxies whose nuclear m emission has a significant AGN contribution. These were: (1) elevated ) flux ratios to the typical colours of star forming galaxies, (2) dust temperature gradient higher than typical values of star forming galaxies, (3) m excess emission with respect to the fit of the integrated FIR SEDs with a grey body with a fixed dust emissivity , and (4) excess of nuclear SFR obtained from m over SFR from mid-infrared indicators. The main results are as follows.
-
•
At 70 m most RSA Seyfert galaxies (85 per cent) in our sample have a nuclear kpc contribution to the total flux greater than 50 per cent. This is in good agreement with results for the Swift/BAT AGN sample of (2014). The derived m sizes (FWHM) indicate that a significant fraction of this emission arises from regions kpc in size.
-
•
The nuclear flux ratio is higher in the nuclear regions than for the entire galaxy. The integrated flux ratio distribution is statistically indistinguishable from the distribution of the Swift/BAT AGN sample of Meléndez et al. (2014) and from the normal galaxies of the KINGFISH sample (2012). This confirms previous results that the integrated FIR emission of Seyfert galaxies is in general dominated by the emission from their host galaxies rather than from the AGN.
-
•
The grey body fits to the nuclear regions and the total galaxy SEDs show that for a given galaxy the nuclear regions (kpc) have the highest temperatures, in agreement with the spatially resolved maps of the dust temperatures of nearby Seyfert and normal galaxies (see e.g. , 2012, 2013). The fitted dust temperatures (K) and dust emissivities () from the integrated SEDs are similar to those of normal galaxies.
-
•
When fitting the integrated SEDs using =2, which is the typical value for star forming galaxies (, 2001), we found that 7 Seyfert galaxies in our sample have a m excess over the fit greater than 28 per cent. This suggests the presence of a hotter dust component, which could be associated to the presence of a nuclear starburst and/or dust heated by the AGN.
- •
-
•
Taking into account the four criteria defined to select galaxies whose nuclear m emission has a significant AGN contribution, we found that 16 galaxies (48 per cent of the sample) satisfy at least one of these criteria, whereas 10 satisfy half or more of the criteria.
-
•
By careful examination of the 10 candidates satisfying at least half of the criteria, we selected six RSA Seyfert galaxies (18 per cent of the initial sample) whose nuclear (kpc) m emission has a significant ( per cent) contribution from dust heated by the AGN. These galaxies are IC 5063, NGC 3783, NGC 4151, NGC 5347, NGC 7213, and NGC 7479. Four of them are Sy1 and 2 of them are Sy2. None of them show m PAH emission on scales of tens of parsecs from high angular resolution MIR spectroscopy or high nuclear SFR.
-
•
Our FIR method to select galaxies whose nuclear m emission has a significant AGN contribution for optically selected Seyferts produces similar results to the (2011) MIR based method for X-ray selected AGN, in terms of the fraction of galaxies dominated by the AGN at 70 and the spectral shapes between 5 and 70 .
The criteria defined in this work provide a good way to select statistically Seyferts with significant contribution of the AGN at 70 using Herschel data.
Acknowledgements
We thank the referee for valuable comments that helped improve the paper.
J.G.-G. acknowledges financial support from the Universidad de Cantabria through the Programa de Personal Investigador en Formación Predoctoral de la Universidad de Cantabria. J.G.-G., A.A.-H. and A.H.-C. acknowledge financial support from the Spanish Ministry of Economy and Competitiveness through grant AYA2012-31447, which is party funded by the FEDER program. P.E. acknowledges support from the Spanish Programa Nacional de Astronomía y Astrofísica under grant AYA2012-31277. C.R.-A. is supported by a Marie Curie Intra European Fellowship within the 7th European Community Framework Programme (PIEF-GA- 2012-327934). T.D.-S. acknowledges support from ALMA-CONICYT project 31130005 and FONDECYT project 1151239. J.G.-G. thanks A. Khan-Ali for his support and help with sherpa. J.G.-G. also thanks A. Marcos-Caballero for his comments on statistics. The authors also thank E. Hatziminaoglou for her insightful comments.
Based on observations made with Herschel, which is an ESA space observatory with science instruments provided by European-led Principal Investigator consortia and with important participation from NASA. PACS has been developed by a consortium of institutes led by MPE (Germany) and including UVIE (Austria); KU Leuven, CSL, IMEC (Belgium); CEA, LAM (France); MPIA (Germany); INAF-IFSI/OAA/OAP/OAT, LENS, SISSA (Italy); IAC (Spain). This development has been supported by the funding agencies BMVIT (Austria), ESA-PRODEX (Belgium), CEA/CNES (France), DLR (Germany), ASI/INAF (Italy), and CICYT/MCYT (Spain).SPIRE has been developed by a consortium of institutes led by Cardiff University (UK) and including Univ. Lethbridge (Canada); NAOC (China); CEA, LAM (France); IFSI, Univ. Padua (Italy); IAC (Spain); Stockholm Observatory (Sweden); Imperial College London, RAL, UCL-MSSL, UKATC, Univ. Sussex (UK); and Caltech, JPL, NHSC, Univ. Colorado (USA). This development has been supported by national funding agencies: CSA (Canada); NAOC (China); CEA, CNES, CNRS (France); ASI (Italy); MCINN (Spain); SNSB (Sweden); STFC, UKSA (UK); and NASA (USA).
HIPE is a joint development by the Herschel Science Ground Segment Consortium, consisting of ESA, the NASA Herschel Science Center, and the HIFI, PACS and SPIRE consortia.
This research has made use of the NASA/IPAC Extragalactic Database (NED) which is operated by the Jet Propulsion Laboratory, California Institute of Technology, under contract with the National Aeronautics and Space Administration.
This research has made use of the TOPCAT software (http://www.starlink.ac.uk/topcat/) and its tools.
References
- (1) Alonso-Herrero A., et al., 2011, ApJ, 736, 82
- (2) Alonso-Herrero A., et al., 2012, MNRAS, 425, 311
- Alonso-Herrero et al. (2014) Alonso-Herrero A. et al. 2014, MNRAS, 443, 2766
- Alonso-Herrero et al. (2016) Alonso-Herrero A., et al., 2016, MNRAS, 455, 563
- (5) Antonucci R., 1993, ARA&A, 31, 473
- (6) Bendo G. J., et al., 2012, MNRAS, 419, 1833
- (7) Bradt H. V., Burke B. F., Canizares C. R., Greenfield P. E., Kelley R. L., McClintock J. E., van Paradijs J., Koski A. T., 1978, ApJ, 226, L111
- (8) Brightman M., Nandra K., 2011, MNRAS, 413, 1206
- (9) Calzetti D. et al., 2010, ApJ, 714, 1256
- (10) Contini T., Considere S., Davoust E., 1998, A&AS, 130, 285
- (11) Dale D. A., et al., 2012, ApJ, 745, 95
- (12) Dale D. A., Helou G., 2002, ApJ, 576, 159
- (13) de Vaucouleurs G., de Vaucouleurs A., Corwin H. G., Jr., Buta R. J., Paturel G., Fouque P., 1991, S&T, 82, 621
- (14) Diamond-Stanic A. M., Rieke G. H., 2010, ApJ, 724, 140
- (15) Diamond-Stanic A. M., Rieke G. H., 2012, ApJ, 746, 168
- Díaz-Santos et al. (2010) Díaz-Santos T., Alonso-Herrero A., Colina L., Packham C., Levenson N. A., Pereira-Santaella M., Roche P. F., Telesco C. M., 2010, ApJ, 711, 328
- (17) Doe S. et al., 2007, Astronomical Data Analysis Software ans Systems XVI, 376, 543
- Esquej et al. (2014) Esquej P., Alonso-Herrero A., González-Martín O., Hönig S., Hernán-Caballero A., et al., 2014, ApJ, 780, 86
- Elitzur & Shlosman (2006) Elitzur M., Shlosman I. 2006, ApJ, 648, L101
- (20) Freeman P. E., Doe S., Siemiginowska A., 2001, SPIE Proceedings, Vol. 4477, p. 76
- (21) Fritz J., Franceschini A., Hatziminaoglou E., 2006, MNRAS, 366, 767
- (22) Galametz M. et al. 2012, MNRAS, 425, 763
- (23) García-Bernete I., et al., 2015, MNRAS, 449, 1309
- González-Martín et al. (2013) González-Martín O., et al., 2013, A&A, 553, A35
- González-Martín et al. (2015) González-Martín O., et al., 2015, A&A, 578, A74
- (26) Griffin, M.J. et al., 2010, A&A, 518, 3
- Hatziminaoglou et al. (2010) Hatziminaoglou E., et al., 2010, A&A, 518, L33
- Healey et al. (2007) Healey S. E., Romani R. W., Taylor G. B., Sadler E. M., Ricci R., Murphy T., Ulvestad J. S., Winn J. N., 2007, ApJS, 171, 61
- Hernán-Caballero & Hatziminaoglou (2011) Hernán-Caballero A., Hatziminaoglou E. 2011, MNRAS, 414, 500
- Hernán-Caballero et al. (2015) Hernán-Caballero A., et al., 2015, ApJ, 803, 109
- Hernán-Caballero et al. (2016) Hernán-Caballero A., Spoon H. W. W., Lebouteiller V., Rupke D. S. N., Barry D. P., 2016, MNRAS, 455, 1796
- (32) Hönig S. F., Kishimoto M., 2010, A&A, 523, A27
- Hönig et al. (2010) Hönig S., et al., 2010, A&A, 515, 23
- (34) Kewley L. J., Heisler C. A., Dopita M. A., Lumsden S., 2001, ApJS, 132, 37
- Ichikawa et al. (2015) Ichikawa K., et al., 2015, ApJ, 803, 57
- (36) Khachikian E. Y., Weedman D. W., 1974, ApJ, 192, 581
- (37) Kroupa P., 2001, MNRAS, 322, 231
- Lebouteiller et al. (2011) Lebouteiller V., Barry D. J., Spoon H. W. W., et al., 2011, ApJS, 196, 8
- Lebouteiller et al. (2015) Lebouteiller V., Barry D. J., Goes C., Sloan G. C., Spoon H. W. W., Weedman D. W., Bernard-Salas J., Houck J. R., 2015, ApJS, 218, 21
- (40) Li Y., Calzetti D., Kennicutt R. C., Hong S., Engelbracht C. W., Dale D. A., Moustakas J., 2010, ApJ, 725, 677
- (41) Li A., Draine B. T., 2001, ApJ, 554, 778
- (42) Li Y. et al., 2013, ApJ, 768, 180
- (43) Maiolino R., Rieke G. H., 1995, ApJ, 454, 95
- Malizia et al. (2012) Malizia A., Bassani L., Bazzano A., Bird A. J., Masetti N., Panessa F., Stephen J. B., Ubertini P., 2012, MNRAS, 426, 1750
- (45) Mason R. E. et al. 2012, AJ, 144, 11
- Meléndez et al. (2014) Meléndez M., Mushotzky R. F., Shimizu T. T., Barger A. J., Cowie L. L., 2014, ApJ, 794, 152
- Moustakas et al. (2010) Moustakas J., Kennicutt Jr., R. C., Tremonti C. A., Dale D. A., Smith J.-D. T., Calzetti D. 2010, ApJS, 190, 233
- (48) Mullaney J., Alexander D. M., Goulding A. D., Hickox R. C. 2011, MNRAS, 414, 1082
- (49) Mushotzky R. F., Shimizu T. T., Meléndez M., Koss M., 2014, ApJL, 781, 34
- Nenkova et al. (2008) Nenkova M., Sirocky M. M., Nikutta R., Ivezić Z., Elitzur M., 2008, ApJ, 685, 160
- (51) Osterbrock D. E., Martel A., 1993, ApJ, 414, 552
- (52) Ott S., 2010, ASP Conference Series, 434, 139
- (53) Panessa F., Bassani L., 2002, A&A, 394, 435
- (54) Peeters E., Spoon H. W. W., Tielens A. G. G. M. 2004, ApJ, 613, 986
- (55) Pérez García A. M., Rodríguez Espinosa J. M., Santolaya Rey A. E., 1998, ApJ, 500, 685
- Petric et al. (2015) Petric A. O., Ho L. C., Flagey N. J. M., Scoville N. Z., 2015, ApJS, 219, 22
- (57) Phillips M. M., Charles P. A., Baldwin J. A., 1983, ApJ, 266, 485
- Poglitsch et al. (2010) Poglitsch A. et al., 2010, A&A, 518, 2
- (59) Ramos Almeida C., et al., 2011, MNRAS, 417, L46
- Ramos Almeida et al. (2014) Ramos Almeida C. et al. 2014, MNRAS, 445, 1130
- (61) Reunanen J., Kotilainen J. K., Prieto M. A., 2002, MNRAS, 331, 154
- Rieke (1978) Rieke G. H., 1978, ApJ, 226, 550
- (63) Rodríguez Espinosa J. M., Rudy R. J., Jones B., 1987, ApJ, 312, 555
- Roussel (2013) Roussel H., 2013, PASP, 125, 1126
- (65) Sánchez-Portal, M. et al. 2013, in Highlights of Spanish Astrophysics VII, Proceedings of the X Scientific Meeting of the Spanish Astronomical Society (SEA), held in Valencia, July 9 - 13, 2012, Eds.: J.C. Guirado, L.M. Lara, V. Quilis, and J. Gorgas., pp.392-398
- (66) Sandage A., Tammann G. A., 1987, A revised Shapley-Ames Catalog of bright galaxies (2nd ed.; Washington, DC: Carnegie Institution of Washington)
- Shimizu et al. (2015) Shimizu T. T., Melendez M., Mushotzky R. F., Koss M. J., Barger A. J., Cowie L. L., 2015, arXiv, arXiv:1512.02733
- (68) Skibba, R. A., et al. 2011, ApJ, 738, 89
- (69) Spinoglio L., Andreani P., Malkan M. A. 2002, ApJ, 572, 105
- Spoon et al. (2007) Spoon H. W. W., Marshall J. A., Houck J. R., Elitzur M., Hao L., Armus L., Brandl B. R., Charmandaris V., 2007, ApJ, 654, L49
- Trippe et al. (2010) Trippe M. L., Crenshaw D. M., Deo R. P., Dietrich M., Kraemer S. B., Rafter S. E., Turner T. J., 2010, ApJ, 725, 1749
- Véron-Cetty & Véron (2006) Véron-Cetty M. P., Véron P., 2006, A&A, 455, 773