The mineral clouds on HD 209 458b and HD 189 733b
Abstract
3D atmosphere model results are used to comparatively study the kinetic, non-equilibrium cloud formation in the atmospheres of two example planets guided by the giant gas planets HD 209 458b and HD 189 733b. Rather independently of hydrodynamic model differences, our cloud modelling suggests that both planets are covered in mineral clouds throughout the entire modelling domain. Both planets harbour chemically complex clouds that are made of mineral particles that have a height-dependent material composition and size. The remaining gas-phase element abundances strongly effects the molecular abundances of the atmosphere in the cloud forming regions. Hydrocarbon and cyanopolyyne molecules can be rather abundant in the inner, dense part of the atmospheres of HD 189 733b and HD 209 458b. No one value for metallicity and the C/O ratio can be used to describe an extrasolar planet. Our results concerning the presence and location of water in relation to the clouds explain some of the observed differences between the two planets. In HD 189 733b, strong water features have been reported while such features are less strong for HD 209 458b. By considering the location of the clouds in the two atmospheres, we see that obscuring clouds exist high in the atmosphere of HD 209 458b, but much deeper in HD 189 733b. We further conclude that the (self-imposed) degeneracy of cloud parameters in retrieval methods can only be lifted if the cloud formation processes are accurately modelled in contrast to prescribing them by independent parameters.
keywords:
astrochemistry – opacity – methods: numerical – planets and satellites: individual: HD 189 733b, HD 209 458b –1 Introduction
HD 189 733b and HD 209 458b are the two most observed extrasolar planets. Both planets are highly irradiated due to their close proximity to their host star. HD 189 733b forms a bow shock in the wind of its host star (Llama et al. 2013) from which the planetary magnetic field strength can be derived. Cauley et al. (2015) obtained HIRES observations in H which suggest a magnetic field strength of 28G for the giant gas planet HD 189 733b. Chandra observations (0.1 - 5 keV) indicate a deeper X-ray transit than for optical wavelengths (Poppenhaeger et al. 2013), but see Llama & Shkolnik 2015 for the effect of stellar variability. Lecavelier Des Etangs et al. (2010) presented the first study of HD 189 733b mass loss based on HST transit observations, later confirmed in (Lecavelier des Etangs et al. 2012). HARPS observations of blue-shifted Na D lines ( km s-1) in the upper layers of the atmosphere above a cloud deck (Wyttenbach et al. 2015) enabled the spatial resolution of an eastward wind on HD 189 733b (Louden & Wheatley 2015) indicating a globally circulating atmosphere (Showman et al. 2008; Dobbs-Dixon & Agol 2013). The presence of H2O is suggested by dayside emission spectrum (Grillmair et al. 2008), secondary eclipse emission spectrum (Todorov et al. 2014; Crouzet et al. 2014), transit absorption spectrum (McCullough et al. 2014) and by ground-based high-resolution spectroscopy (Birkby et al. 2013). Swain et al. (2014) find strong evidence for CH4 absorption in their NICMOS transmission spectra and interpret this finding as a confirmation of earlier publications on the detection of CH4 in the atmosphere of HD 189 733b. Rodler et al. (2013) present the detection of CO at the HD 189 733b day-side from NIRSPEC observations (see also Désert et al. 2009; de Kok et al. 2013). Knutson et al. (2012) require a vertical mixing enhancement of CO to explain their Spitzer observations. de Kok et al. (2013) could not confirm CO2 NICMOS secondary eclipse observation. The efforts of deriving observational constraints on the atmosphere chemistry are challenged by the repeated detection of a thick cloud layer on HD 189 733b through transit spectroscopy (Gibson et al. 2012; Pont et al. 2013). Lecavelier Des Etangs et al. (2008) were the first to use MgSiO3[s] as a possible abundant condensate with particle size m based on transit observations with ACS on Hubble. Retrieval methods were applied to reflectance spectra to provide further insight in chemical composition of the atmosphere and cloud properties (Barstow et al. 2014; Lee et al. 2014; Benneke 2015).
The first mass loss detection on HD 209 458b was made by Vidal-Madjar et al. (2003) and Vidal-Madjar et al. (2004) suggesting the escape of HI, OI and CII. Vidal-Madjar et al. (2013) report absorption in MgI in a region where atmospheric escape is suggested to take place. 4.5m Spitzer/IRAC data imply the presence of a hot spot shifted eastward by and a day-night-side temperature difference of K (Zellem et al. 2014). The analysis of Spitzer/Infrared Array Camera primary transit and secondary eclipse light curves (Evans et al. 2015) did not confirm the detection of water in HD 209 458b, but suggest a depletion of atmospheric CO and no thermal inversion layer to be detectable at Spitzer wavelengths (also Diamond-Lowe et al. 2014). However, the Hubble observation at 1.4m by Deming et al. (2013) provides evidence for H2O absorption in HD 209 458b which was confirmed by Sing et al. (2016). Schwarz et al. (2015) observed the thermal dayside emission by high-resolution spectroscopy of the carbon monoxide band at 2.3 m. They do not find any emission signature required to confirm a thermal inversion in the atmosphere of HD 209 458b. Hoeijmakers et al. (2015) suggest that their TiO opacity data was insufficient to reach any conclusion regarding a thermal inversion on HD 209 458b. These conclusions, however, are based on the assumption that the featured molecules are associated with a thermal inversion and not with another process that affects, for example, their abundance. The presence of TiO and VO is derived from STISS observation of HD 209 458b (Désert et al. 2008). It is suggested that TiO and VO exist in two distinct layers including one at higher atmospheric layers above the -level where potential condensates would be thermally stable111The supersaturation ratio, S, equals 1 if the growth and the evaporation rates are equal, hence when thermal stability, or phase equilibrium, is achieved. The supersaturation ratio is defines as with partial pressure of the gas species x, and is the saturation vapour pressure of the (e.g. solid) material s.. This conclusion about the presence of gaseous TiO or VO, however, can only be correct if the layer above is warmer such that , i.e. in a case of an outward temperature increase. Koskinen et al. (2013) conclude that the detection of Si2+ indicates that clouds involving Si do not form in the atmosphere of HD 209 458b.
Both planets have been compared regarding the interplay between the irradiation and the atmosphere dynamics and its effect on the molecular gas composition (Agúndez et al. 2012, 2014), regarding their mass loss (Bourrier & Lecavelier des Etangs 2013), and their cloud-free dynamic atmosphere structure (Showman et al. 2009a). Benneke (2015) suggests from his retrieval procedure that both planets, HD 209 458b and HD 189 733b host a thick cloud deck. Our paper takes this approach further to present a comparative study of the cloud structures of HD 209 458b and HD 189 733b based on kinetic simulation of the non-equilibrium cloud forming processes in combination with results of 3D atmosphere structure simulations. We, however, note that our present approach is limited by the need to run the cloud-formation and 3D RHD simulations independently.
| Parameters | HD 189 733b | HD 209 458b |
|---|---|---|
| Mass | 1.13 0.025 MJ | 0.69 0.017 MJ |
| (Boisse et al., 2009) | (Wang & Ford, 2011) | |
| Semi-Major | 0.03142 | 0.04747 |
| Axis | 0.00052 AU | 0.00055 AU |
| (Southworth, 2010) | ||
| Orbital Period | 2.21857d | 3.52472 d |
| (Triaud et al., 2010) | (Wang & Ford, 2011) | |
| Eccentricity | 0.041 | 0.0082 |
| (Triaud et al., 2010) | (Wang & Ford, 2011) | |
| Radius | 1.138 0.077 RJ | 1.38 RJ |
| (Torres et al., 2008) | (Southworth, 2010) | |
| Geometric | 0.4 0.12 | 0.038 (0.045) |
| Albedo | (Evans et al., 2013) | (Rowe et al., 2008) |
| Mean Density | 1800 kgm-3 | 616 kgm-3 |
| Tequ,planet | 1000K | 1500K |
| geometrical | ||
| albedo | ||
| Parameters | HD 189 733 | HD 209 458 |
| SpecTyp | K2V | G0V |
| (Boisse et al., 2009) | ||
| Teff,∗ | 4800K | 6000K |
| (Boyajian et al., 2015) | ||
Every observation requires input from a model. Interpretations of all observations for HD 189 733b and HD 209 458b rely on various modelling approaches which mostly only include a subset of physics complexes like radiative transfer incl. gas and cloud opacities, gas-phase chemistry (kinetic or LTE), hydrodynamics (HD), magnetohydrodynamics (MHD), and cloud formation. The radiative transfer problem and the gas-phase chemical abundances have achieved rather high standards as core problems of atmosphere modelling and data analysis (see review by Marley & Robinson 2015, also Benneke 2015). HD and MHD have a long standing tradition in meteorology and in solar physics, respectively. Cloud formation, in contrast, is almost always parameterised in terms of number and sizes of particles, settling and mixing efficiencies in complex simulations like as part of radiative transfer simulations or circulation models (see e.g. Charnay et al. 2015). Parameterisation approaches have been guided by terrestrial studies, which however, treat an environment that does not compare overly well with giant gas planets. Main differences are the chemical composition of the atmospheric gas and the need to treat the formation of condensation seeds in situ (see review by Helling & Fomins 2013, also Sect. 3 in Helling & Casewell 2014). We therefore aim to provide some guidance for future cloud parameterisations based on the examples HD 189 733b and HD 209 458b for other planets as needed in preparation of JWST.
This paper applies a kinetic cloud formation model to study and compare the cloud structures of the two example extrasolar giant gas planets HD 189 733b & HD 209 458b based on global circulation models of their dynamic atmospheres (Dobbs-Dixon & Agol 2013; Mayne et al. 2014a) which were run for 600 and 1800 Earth days, respectively. All local cloud properties (number, size and material composition of cloud particles, depleted element abundances, cloud opacity) are determined by the local thermo- and hydrodynamic properties. We aim to demonstrate and to compare the consistently calculated cloud structures for both planets and the chemical feedback on the background atmosphere gas. Section 2 outlines our approach. Section 4 presents the local thermodynamic properties of the atmospheres of HD 189 733b and HD 209 458b in comparison. Section 5 discusses the resulting local cloud properties for the two giant gas planets with focus on the changing cloud material and grain sizes across the globe as major opacity input. Section 6 compares the impact of cloud formation on the local chemistry for HD 189 733b and HD 209 458 and how it changes with longitude as result of the underlying atmosphere structure. The changing element abundances and the molecular composition are discussed with the resulting inhomogenous metallicity and C/O ratio throughout an atmosphere with clouds. We also discuss the abundance of larger hydrocarbon and cyanopolyyne molecules in the inner atmosphere. Section 7 compares the opacities for the day and the night side of both planets. Section 8 presents our discussion and Sect. 9 concludes this paper.
2 Approach
We apply the two-model approach outlined in Lee et al. (2015a). We extract 1D (Tgas(z), pgas(z), v)-trajectories from 3D HD atmosphere simulations across the globe and use these structures as input for our kinetic, non-equilibrium cloud-formation code Drift (Woitke & Helling 2003, 2004; Helling & Woitke 2006; Helling et al. 2008). The 3D results for HD 189 733b are from the 3D radiation-hydrodynamic simulation by Dobbs-Dixon & Agol (2013), the 3D results for HD 209 458b are from the 3D GCM simulations by Mayne et al. (2014a) and Amundsen et al. (2014). We refer to the individual papers regarding more details on the 3D simulations and also the cloud formation modelling. A summary of the different modelling parts and of our assumptions is given below. The approach that this paper follows has the limitation of not taking into account the potential effect of horizontal winds on the cloud formation. We note, however, that the cloud formation processes are determined by the local thermodynamic properties which are the result of the 3D dynamic atmosphere simulations in our approach. Horizontal winds would affect the cloud formation profoundly if the horizontal wind time-scale would be of the order of the time-scales of the microscopic cloud formation processes. We have demonstrated that this is not the case in Lee et al. (2015a). Woitke & Helling (2003) have shown that latent heat release in negligible for the condensation of the materials considered here. However, a complete and consistent coupling of our non-equilibrium cloud formation model with a full 3D radiative hydrodynamics is most desirable to study the cloud formation affects in considerably more details than our present approach allows. We further note that some of the results from Lee et al. (2015a) are reproduced in the present paper for the benefit of the reader.
2.1 Kinetic formation of cloud particles from oxygen-rich gases
Cloud formation in extrasolar atmospheres requires the formation of seed particles because giant gas planets have no crust from which sand or ash particles are diffused upwards or injected into the atmosphere by volcanic eruptions. These condensation seeds provide a surface onto which other materials can condense more easily as surface reactions are considerably more efficient than the sum of chemical gas phase reactions leading to the formation of the seed. The formation of the first surface out of the gas phase proceeds by a number of subsequent chemical reactions that eventually result in small seed particles. Such a chain of chemical reactions can proceed by adding a molecular unit during each reaction step (e.g., Jeong et al. 2000; Plane 2013). Goumans & Bromley (2012), for example, show that condensation occurs from small gas-phase constituent like MgO and SiO, which will lead to the formation of bigger units like Mg2SiO4 during the condensation process. It is important to realise that big molecules like Mg2SiO4 or Ca4Ti3O10 do not exist in the gas phase (compare also Sect. 6). Here, the concept of homogeneous nucleation is applied to model the formation of TiO2 seed particles (Helling & Fomins 2013; Lee et al. 2015b) which allows us to calculate the nucleation rate, [cm-3 s-1], which determines the number of cloud particles, nd [cm-3], and therefore influences the total cloud surface. The cloud particle size, [cm], is determined by the efficiency of surface growth and evaporation reactions. These reactions are determined by the composition of the gas phase that provides the number density for surface reactions (Table 1 in Helling et al. 2008) and leads to the formation of a substantial material mantle on top of the seed. This mantle determines the mass, volume () and main chemical composition, ( - volume fraction of material s), of the cloud particles. Many materials can be simultaneously thermally stable in a gas but these materials change depending on the carbon-to-oxygen ratio and the abundance ratios of other elements. In principle, all thermally stable materials grow simultaneously on a seed particle as long as the key species (e.g. TiO for TiO2[s]; SiO, Mg, SiS, Mg(OH)2 for Mg2SiO4[s]; CaO, CaS, TiO for CaTiO3[s]) are present in the gas phase. Our cloud model includes 12 solid species that form from 60 gas-solid surface reactions (Table 1 in Helling et al. 2008). These are the solids that are expected to provide the most efficient growth materials and include silicates (MgSiO3[s], Mg2SiO4[s], SiO[s], SiO2[s]), metals and metal oxides (MgO[s], Fe[s], FeO[s], Fe2O3[s], Al2O3[s], TiO2[s], CaTiO3[s]) and others (FeS[s]). Internal rearrangement may lead to the formation of Ca2Al2SiO7[s] or MgAl2O4[s] which are long living minerals that, however, can not form directly from the gas phase. The life time of any of the cloud particles might, however, be too short for such rearrangement processes to have any effect.
Once cloud particles have formed, they are affected by gravity and friction with the surrounding gas. The equilibrium between friction and gravity determine how strongly the cloud particles are coupled to the gas and, hence, how fast the cloud particles fall through the atmosphere (Woitke & Helling 2003). This gravitational settling determines the vertical extension of a cloud. The cloud particles will continue to grow and to change their material composition during their descent into denser and warmer atmospheric regions. Mineral cloud particles can reach a size for which they fall faster than they can grow, hence, the cloud particle will not change any more in size and composition (Woitke & Helling 2004). The cloud formation has a strong impact on the local chemistry by depleting those elements that participate in the formation of the cloud particles. This will result in an inhomogeneous metallicity and C/O ratio of the atmosphere (see Sect. 6.1).
If nucleation and growth become inefficient, large-scale processes like gravitational settling determine the global cloud formation (Sect. 6 in Woitke & Helling 2003). The loss of elements over large-scales is counter balanced by the (vertical) mixing processes (see Sect. 2.4.2. in Lee et al. 2015a). Different approaches are applied in the literature to account for vertical mixing. For example, Ackerman & Marley (2001) use an equation where gravitational settling is balanced by cloud material diffusion. The local amount of cloud material is then derived for a given settling parameter () and diffusion coefficient (, see pg 5 in Lee et al. 2015a for a discussion). It remains to prescribe the material composition and a grain size distribution (like Eq. 2 in Morley et al. 2015). The approach presented in Woitke & Helling (2003), and utilized in this paper, applies to force balance between friction and gravity to derive a size-dependent drift velocity which is required to determine a drift dependent growth term in the moment equations. The vertical mixing efficiency enters by a mixing time scale that is derived from the local gas velocity. Beside the local element abundances, and (local gas density, [g cm-3]) determine if atmospheric clouds can form, to which sizes the cloud particles grow and of which materials they will be composed. The gravitational settling through an atmosphere is determined by the local gas density, , and the cloud particle size.
The mathematical model is formulated in terms of moment equations which describes the above physical processes (Woitke & Helling 2003; Helling & Woitke 2006; Helling et al. 2008; Helling & Fomins 2013).
We assume that both planets, HD 189 733b and HD 209 458b, have an oxygen-rich atmosphere of approximately solar element composition. We use the solar element abundances as boundary and initial values for the cloud formation simulation.
2.2 Chemical gas composition
We apply a chemical equilibrium (thermochemical equilibrium) routine to investigate the chemical composition of the atmospheres. We use the 1D (T, p) trajectories and element abundances (i=O, Ca, S, Al, Fe, Si, Mg) depleted by the cloud formation processes. All other elements are assumed to be of solar abundance. Given that collisional gas-phase processes dominate in the atmospheric part of interest, we apply a chemical equilibrium routine that allows us to provide first estimates of the abundances of carbon-bearing macro-molecules and small PAHs. This approach allows us to study the gas-phase abundances at the inner boundary of future kinetic considerations, and to look at species not presently included in most of the current networks (e.g. C6H6). A combination of gas-phase molecules (including complex carbon-bearing molecules), atoms, and various ionic species were used under the assumption of LTE. Bilger et al. (2013) is an extension of the gas-phase chemistry routine used so far in our dust cloud formation according to Helling et al. (1996). The Grevesse et al. (2007) solar composition is used for calculating the gas-phase chemistry outside the metal depleted cloud layers and before cloud formation. No solid particles were included in the chemical equilibrium calculations in contrast to equilibrium condensation models. The influence of cloud formation on the gas phase composition results from the reduced element abundances due to cloud formation and the cloud opacity impact on the radiation field, and hence, on the local gas temperature and gas pressure.
We demonstrate that the gas phase composition is affected by cloud formation to a degree that it should be taken into account also as inner boundary and initial values for kinetic gas phase calculations for irradiated, giant gas planets.
2.3 3D atmosphere simulation
2.3.1 HD 209 458b (Mayne et al. (2014b))
The simulations of HD 209 458b we use as input were run using the adapted UK Met Office General Circulation Model (GCM), called the Unified Model (UM). The testing and adaptation of this model to hot Jupiter conditions is detailed in Mayne et al. (2014b, c) and Amundsen et al. (2014). Briefly, the model solves the fully compressible Euler equations, including a height varying gravity. The equations are solved on a longitude-latitude-height grid using a semi-Lagrangian, semi-implicit scheme (see Mayne et al., 2014b, for more details). The lower and upper boundaries are both free-slip and impermeable. To represent the convective flux from the interior, an additional net upward flux is added to the black body emission from the bottom boundary (i.e. additional to the emission required to balance the downward radiation). This convective flux corresponds to an intrinsic temperature of 100K as determined from internal evolution models (see Amundsen et al. 2014 for details). At the upper (outer) boundary a so-called ghost layer is included where the atmosphere is extrapolated to account for absorption, scattering and emission above the dynamically modeled domain. The radiative transfer is solved using the two-stream approximation and opacities treated using the correlated-k method (see Amundsen et al., 2014, for more details). The opacities are derived using analytic abundances for chemical equilibrium, and no additional opacity sources are added. The planetary parameters are selected to match observational constraints of HD 209 458b as given in Table 1. The planet radius, however, is set to 1.259 Rjup to take into account the atmosphere contribution. Full details of the model setup can be found in Amundsen (2015).
2.3.2 HD 189 773b (Dobbs-Dixon & Agol (2013))
The simulations of HD 189 733b were calculated using the model described in Dobbs-Dixon & Agol (2013). This model solves the fully compressible Navier-Stokes equations coupled to a two-stream radiative transfer scheme averaging over 30 wavelength bins. The equations are solved on a latitude, longitude, radius grid. The temperature and pressure dependent molecular opacities (calculated assuming solar composition) are supplemented by both a grey component and a Rayleigh scattering tail to approximate the effects of clouds. Detailed observational diagnostics have been carried out and the best-fit model (utilized here) has a kinematic viscosity of cm2s-1. Similar to the HD 209 458b model, the lower boundary is slip-free and impermeable. A heat flux from the interior corresponding to a blackbody with a temperature of K is assumed to be flowing through the interior boundary. The exterior boundary is imposed at a density of g cm-3, is assumed to be isothermal, and allows outflow. Heating is incorporated through a spatially varying direct heating term in each of the wavelength bins. Please refer to Dobbs-Dixon & Agol (2013) for more details.
The 3D atmosphere simulations utilised here solve the full 3D Navier-Stockes equations (table 2 in Mayne et al. (2014b)) coupled with a solution of the radiative transfer problem. The largest difference between the codes arises from the different methods that are employed to solve the radiative transfer as input to the energy equation. The largest uncertainty arrises from the need to prescribe opacity values as in both cases the solution of the full gas-phase chemistry for a potentially large number of frequencies is computational unfeasible. The differences in the radiative transfer treatment will affect the details of the local values, while the global properties maybe less affected.
2.4 Atmosphere boundaries
The hydrodynamic and radiative transfer boundary conditions determine the computational domain of every atmosphere simulation. In the present cases, they determine the vertical extension towards lower pressures and temperature differently for the two cases considered here:
– All GCMs place a top boundary at either a set height or a pressure based usually on some value that assures numeric stability. The height is increased until the contribution of the ghost layer to the derived thermodynamic structure (Tgas, pgas) of the atmosphere is not significant, providing the pressure and temperature at the upper/outer boundary. This means that any significant heating will be resolved within the atmospheric domain simulated. It will provide the pressure minimum and the temperature at the top of the modelled atmosphere.
We present our comparison results for three specific latitude-longitude (, ) coordinates222We remark that the coordinate system used in meteorology refers to as the longitude and as latitude. but provide the full comparison in Sect. 6.2. The chosen (, )-pairs represent the substellar point (, ), and the two terminators ((, ) and (, )). Our (, )-quotations follow Dobbs-Dixon & Agol (2013) and have been used in Lee et al. (2015a). For visualization see Fig. 1 in Lee et al. (2015a). The day/night side coordinates used here are as follows:
-
•
Days side:
HD 189 733b:
HD 209 458b: -
•
Day/night terminator:
-
•
Night side
HD 189 733b:
HD 209 458b:
3 The general dynamical regime of the hot Jupiters
The dominant dynamical feature in hot Jupiter atmospheres is the super-rotating equatorial jet seen in the simulations of both HD 209 458b and HD 189 733b. The stellar radiative forcing coupled to the slow planetary rotation, drives equatorial Rossby and Kelvin waves that act to pump angular momentum to the equator creating and maintaining super-rotation at the equator and retrograde jets at mid-latitude (Showman & Polvani 2011; Tsai et al. 2014). These jets, which can reach speeds of Mach , advect significant energy throughout the atmosphere. Though the horizontal velocities are not directly considered in this paper, the pressure-temperature profiles that we use are significantly influenced by the jet structure.
For both our target planets the general flow regime includes a prograde equatorial jet flanked by a retrograde high latitude flow, for the low pressure strongly radiatively forced atmosphere. The outer or low pressure atmosphere also exhibits strong day night contrasts (and in HD 189 733b’s case a thermal inversion discussed later), which decreases as we move deeper into the higher pressure regions.
4 The local thermodynamic structures of HD 189 733b and HD 209 458b
The local thermodynamic structure (T, p) determines the cloud formation because the cloud formation processes (nucleation, growth/evaporation) depend on local properties only.
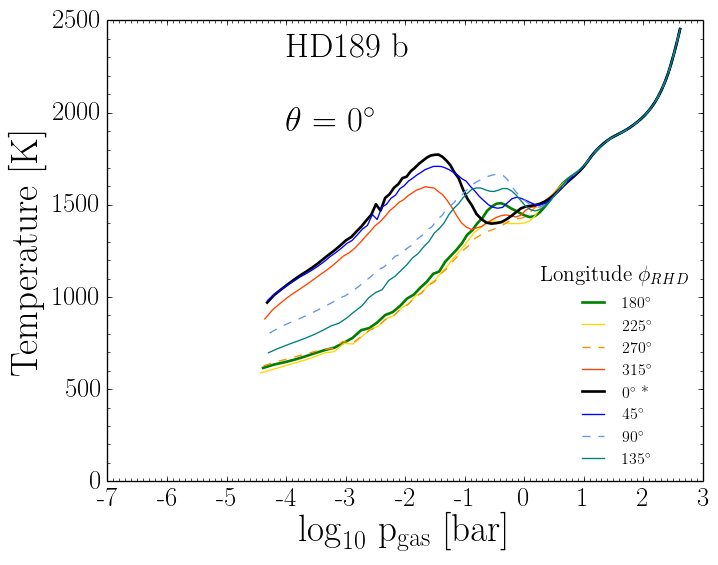
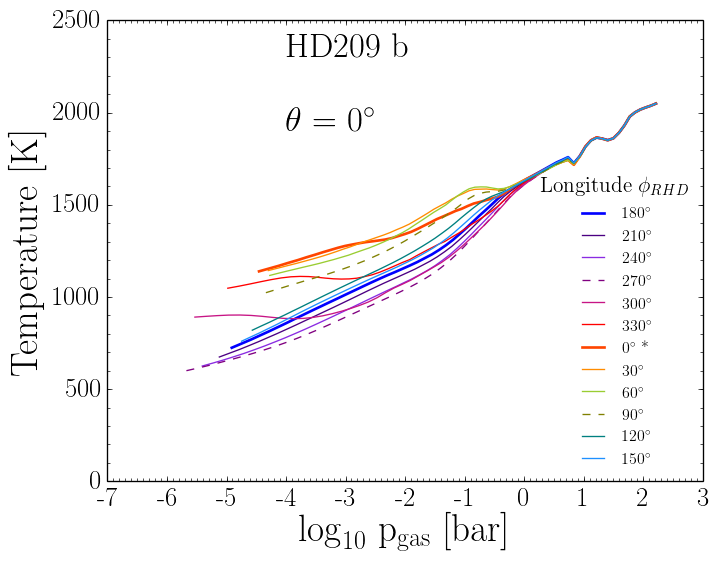
The 3D atmosphere simulations utilised here suggest for both planets, HD 189 733b (left) and HD 209 458b (right) in Fig. 1, a distinct day-night difference of K in the upper atmosphere. The local gas temperature, Tgas, is independent on longitude, , in the inner (deeper), high-pressure part of the atmosphere for pbar in both giant gas planets. The velocity, however, changes dependent on longitude as the vertical mixing parameter, , demonstrate in Fig. 2. The HD 209 458b (T, p) structures are generally smoother than in HD 189 733b across all latitudes ().
The local, height-dependent thermodynamic structures of HD 189 733b and HD 209 458b (Fig. 1) differ substantially for different longitudes as both planets differ in mass () and radii (), hence both planets have different bulk densities, , and for the atmospheric scale height, , follows that . HD 209 458b orbits its host star at a somewhat larger distance than HD 189 733b. The result is that the local (T, p)-profiles along the equator differ considerably between the two planets, as does the local vertical mixing. These differences will affect the cloud structure of the planets. The (T, p) structures span different ranges in gas pressure with HD 189 733b reaching deeper into the high-pressure regime than HD 209 458b. The extension of HD 209 458b into lower pressures compared to HD 189 733b is a result of the choice of the outer boundary conditions for both simulations.
Temperature inversion inside atmospheres are generally interesting features as they can develop a feedback with the local velocity structure. Temperature inversions (or pressure inversion) can occur as a result of the hydrodynamic evolution like for the present simulation of HD 189 733b or as result of an increase in local opacity (e.g. due to C2 and C3 Helling et al. 2000 or TiO/VO Fortney et al. 2008). Unlike for C2 and C3 in the case of AGB stars, TiO and VO had to be artificially injected at appropriate atmospheric heights as both molecules would not be present in the gas phase in the upper atmosphere (compare Fig. 11). In the present 3D atmosphere simulation for HD 189 733b, a temperature inversion develops without the need of an an additional opacity source. The HD 209 458b atmosphere simulation does not suggest such a pronounced temperature inversion inside the atmosphere. If an opacity source is artificially added in form of TiO/VO, also the HD 209 458b models develops a temperature inversion (Showman et al. 2009b) at bar on the day side. However, also the add-on-free-TiO/VO HD 209 458b model suggest a small temperature inversion at longitude and latitude at bar. A tendency of an outward temperature increase occurs for and at . Comparing system parameters for the two planets (Table 1) shows that HD 209 458b orbits its host star at a larger distance than HD 189 733b, hence HD 209 458b receives less irradiation.
There are two effects working together to create the temperature inversions seen in some of the profiles for HD 189 733b: stellar heating at low pressures and advective cooling at higher pressures. The peak in the temperature profiles at p bars is associated with the peak in the net stellar-energy deposition. In the absence of dynamics, the radiation would diffuse inward until the region at higher pressures became roughly isothermal (e.g. Guillot 2010). However, including dynamics results in a return flow of gas from the night side that is cooler then the overlying gas. The radiative timescale increases with depth, becoming comparable to the advective timescale at approximately 0.5 bars. The radiative heating of the newly arriving cooler gas is insufficient to create an isothermal region that extends throughout the region. Balancing the radiative heating and advective cooling yields the decrease in temperature in the region around 0.5 bars.
4.1 Day/night temperature difference
The day/night side temperature difference, , are largest in the upper, low pressure part for both giant gas planets due to the effect of stellar irradiation. in the high-pressure atmospheres for bar for both giant gas planets.
The day/night side temperature difference for HD 209 458b is nearly similar for all longitudes in the atmosphere model applied here. Comparing vs at the equator () results in K for HD 209 458b in the upper, low pressure part of the atmosphere model. This is, within error bars, the value that was suggested by Zellem et al. (2014) base on 4.5m Spitzer/IRAC data for HD 209 458b. The day/night side temperature difference is larger for HD 189 733b in the middle-atmosphere resulting in K at the maximum of the temperature inversion at bar. The day/night temperature difference at the equator has decreased to K for vs similar to HD 209 458b.
4.2 Vertical mixing
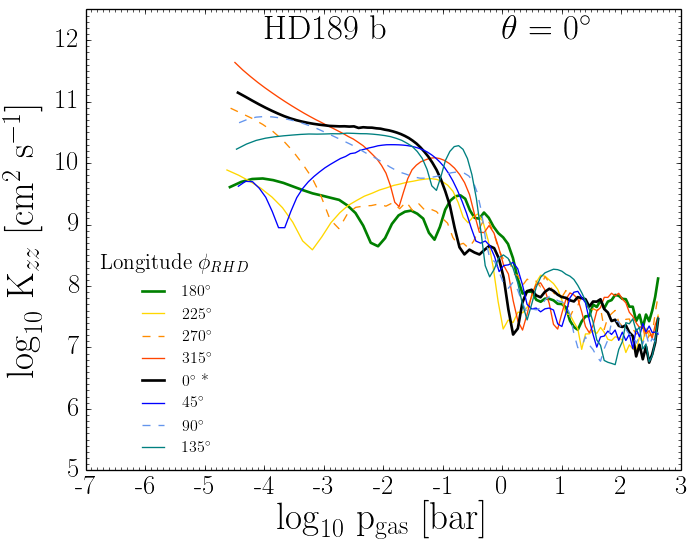
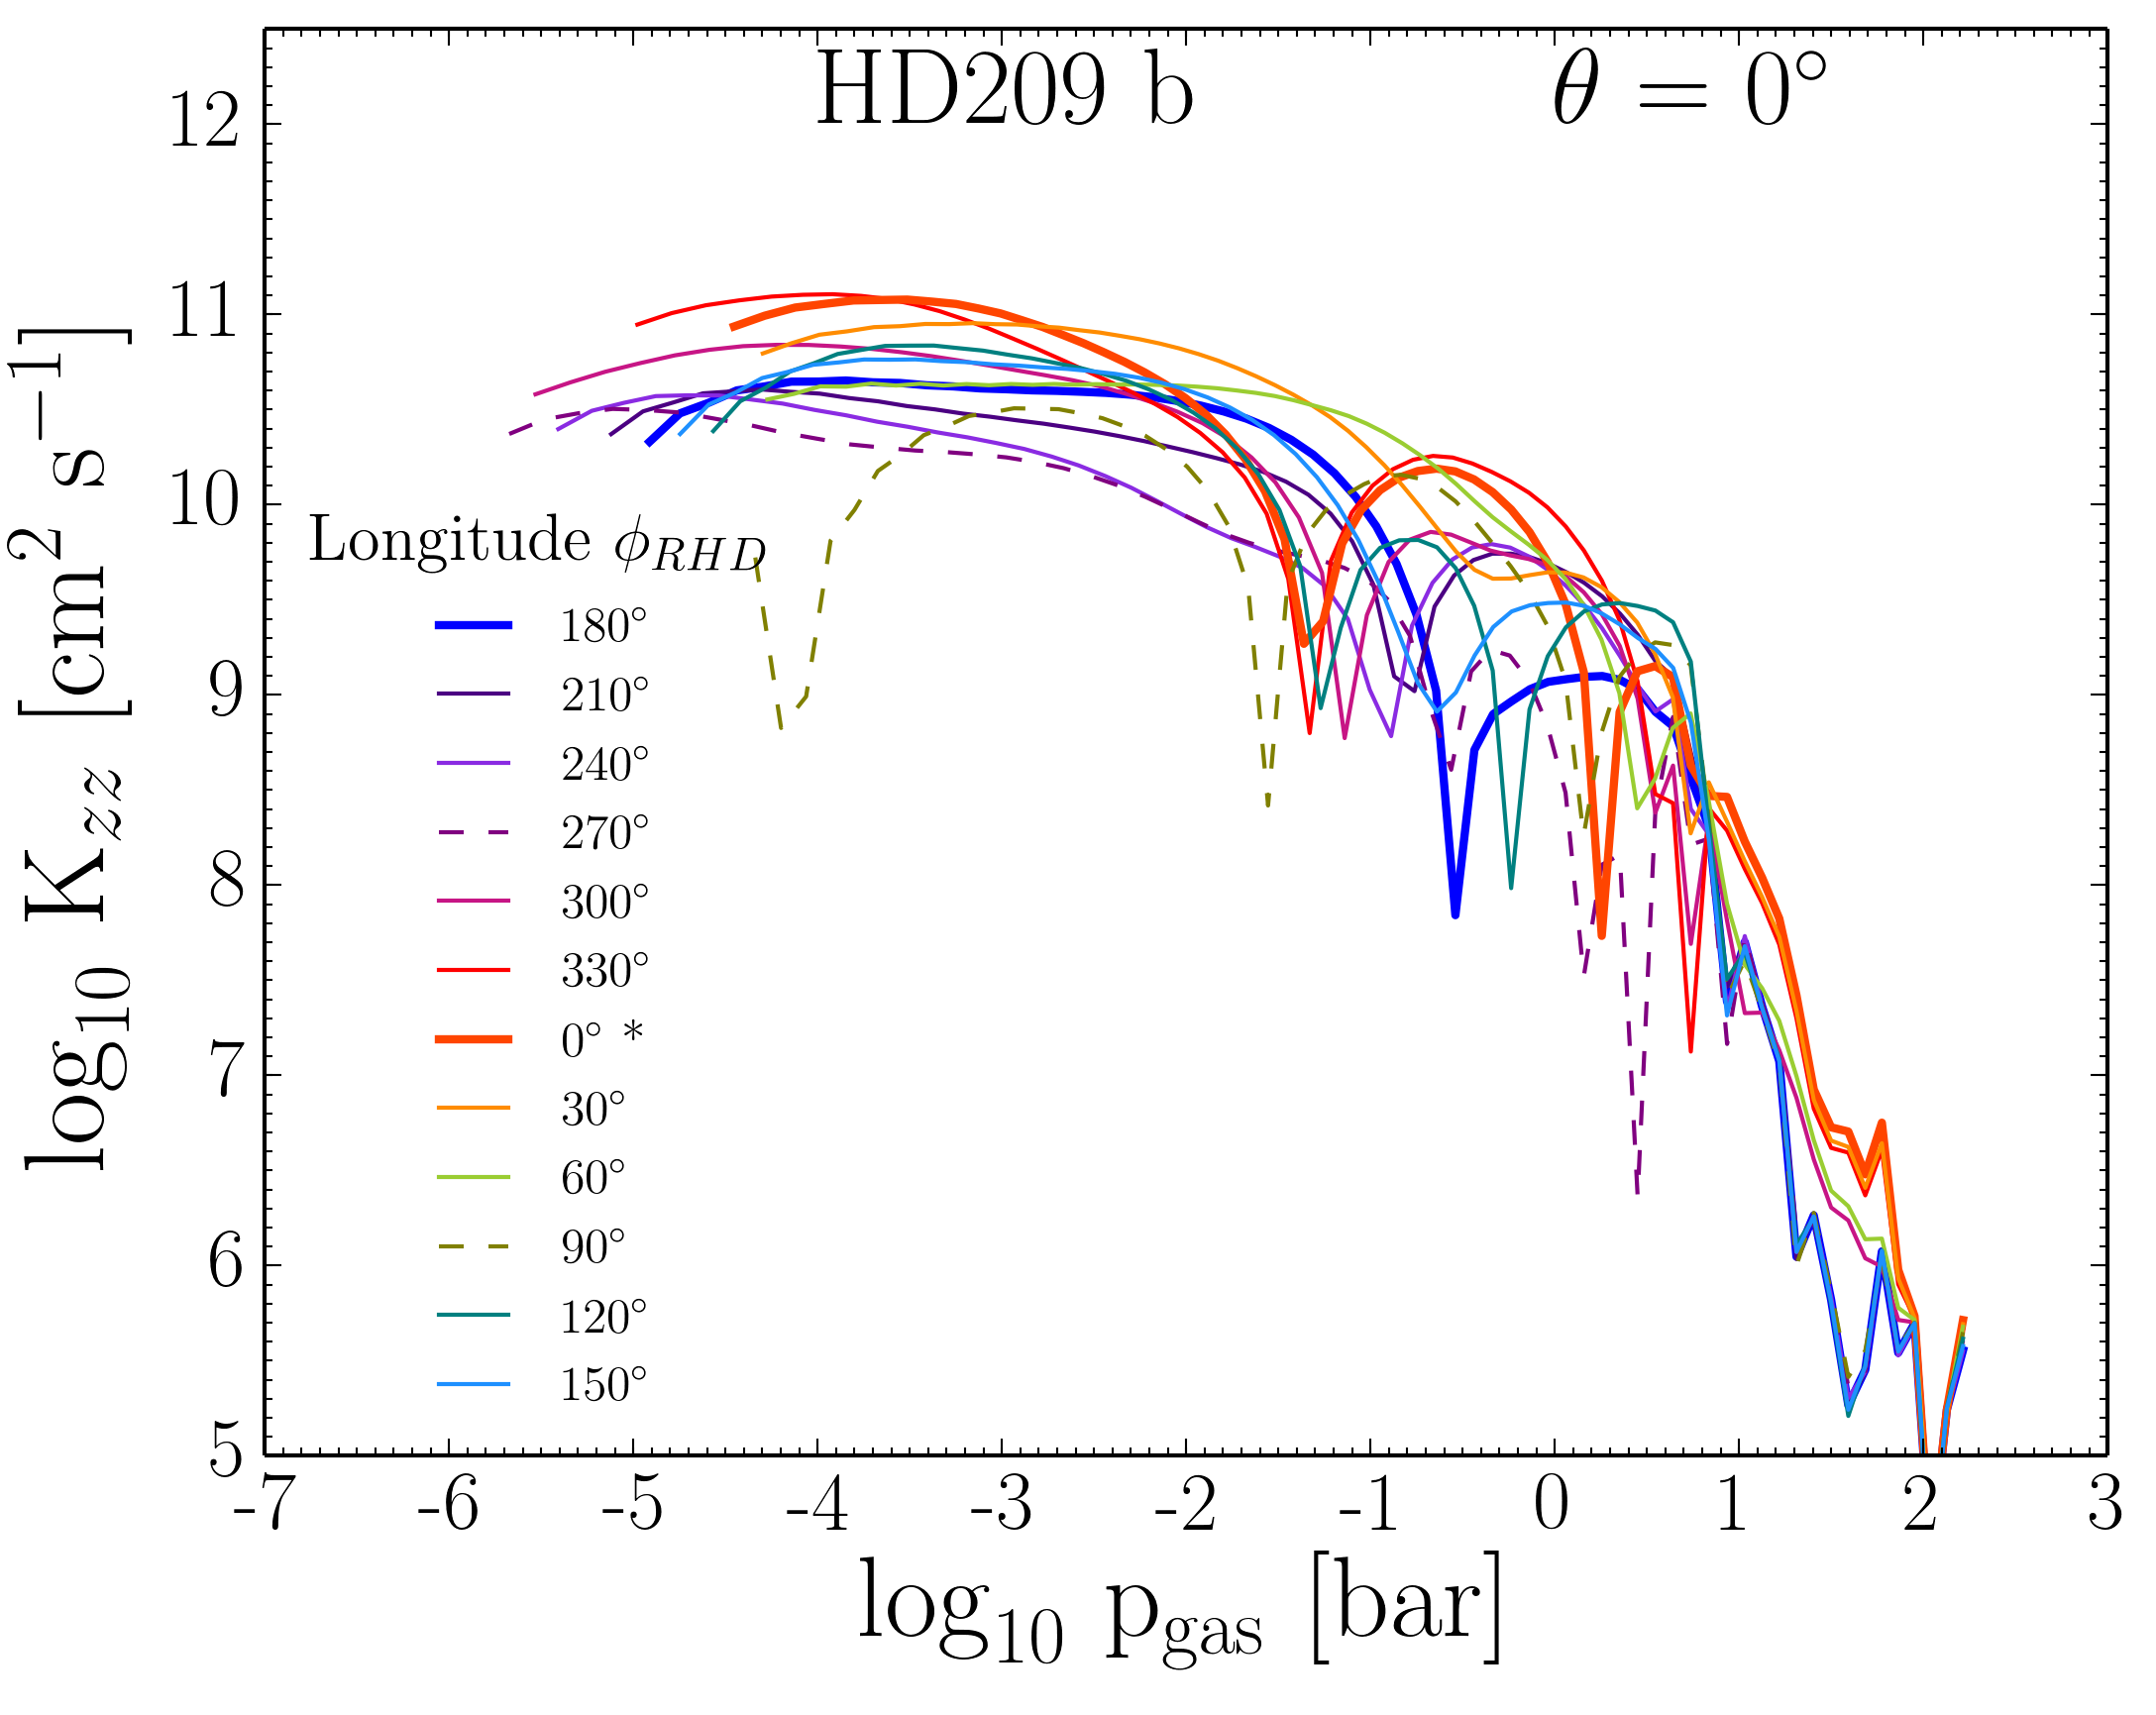
The local vertical velocity is used to determine the vertical mixing, , required for the cloud formation module. This approach is similar to the diffusion approach advocated by Ackerman & Marley (2001) who specify mixing by a constant diffusion coefficient, . Charnay et al. (2015) show that the 1D diffusive ansatz is likely to overestimate the vertical mixing resulting in an overestimation of particle abundance and particle size at high altitudes. Charnay et al. (2015) provide a gas pressure dependent parameterisation for comparable to Parmentier et al. (2013). Lee et al. (2015a) (their Fig. 3) suggest that such parameterisations are very approximate. Here we use the vertical velocity component from the 3D simulations for both planets directly. A test has shown that the use of the Parmentier et al. (2013) values mainly expands the cloud height towards lower pressures. We, however, note that the need for a vertical mixing representation results for every 1D approach, hence also for ours that we presently apply to provide a first insight into kinetically calculated cloud properties of giant gas planets like HD 189 733b and HD 209 458b. This mixing approximation will become obsolete in fully coupled 3D radiative-hydrodynamic models with cloud formation feedback.
Figure 2 shows that the vertical mixing is stronger in the inner (deeper) atmospheric regions in HD 189 733b compared to HD 209 458b. This is were element enhancement through cloud particle evaporation will occur. The terminator regions and the substellar points show different mixing efficiencies between the two planets despite relatively comparable (T, p) structures. The vertical mixing at the substellar point is stronger on HD 189 733b than on HD 209 458b in the upper atmospheric parts.
Figure 2 further suggests that the global vertical mixing for different longitudes across the planet is homogeneously more vigorous in the atmosphere of HD 209 458b (right) which is stronger irradiated by its hotter host star than HD 189 733b (left). This is different to the day/night side differences in mixing of HD 189 733b. Consequently, the optically thin atmospheric layers will always be more vigorously mixed in HD 209 458b compared to HD 189 733b indicating a stronger variability in potential spectral features. The less irradiated HD 189 733b show a stronger day/night side variation in mixing activity with the night side showing considerably less efficient mixing than HD 209 458b.
5 The dust cloud structures of HD 189 733b and HD 209 458b
HD 189 733b and HD 209 458b are the two most observed extrasolar planets (see Sect. 1). Observations were analyzed by applying retrieval methods based on mainly two codes, Nemesis (Barstow et al. 2014; Lee et al. 2014) and Scarlet (Benneke 2015), which both assume effective particle sizes, homogeneous material composition and the number of cloud particles. The present paper provides more insight into the cloud properties of HD 189 733b and HD 209 458b by analyzing the cloud formation processes based on 3D atmosphere simulations. We demonstrate that the clouds on HD 189 733b and HD 209 458b are far richer then suggested by present observation due to their necessarily hemispherically averaged nature.
5.1 The local view
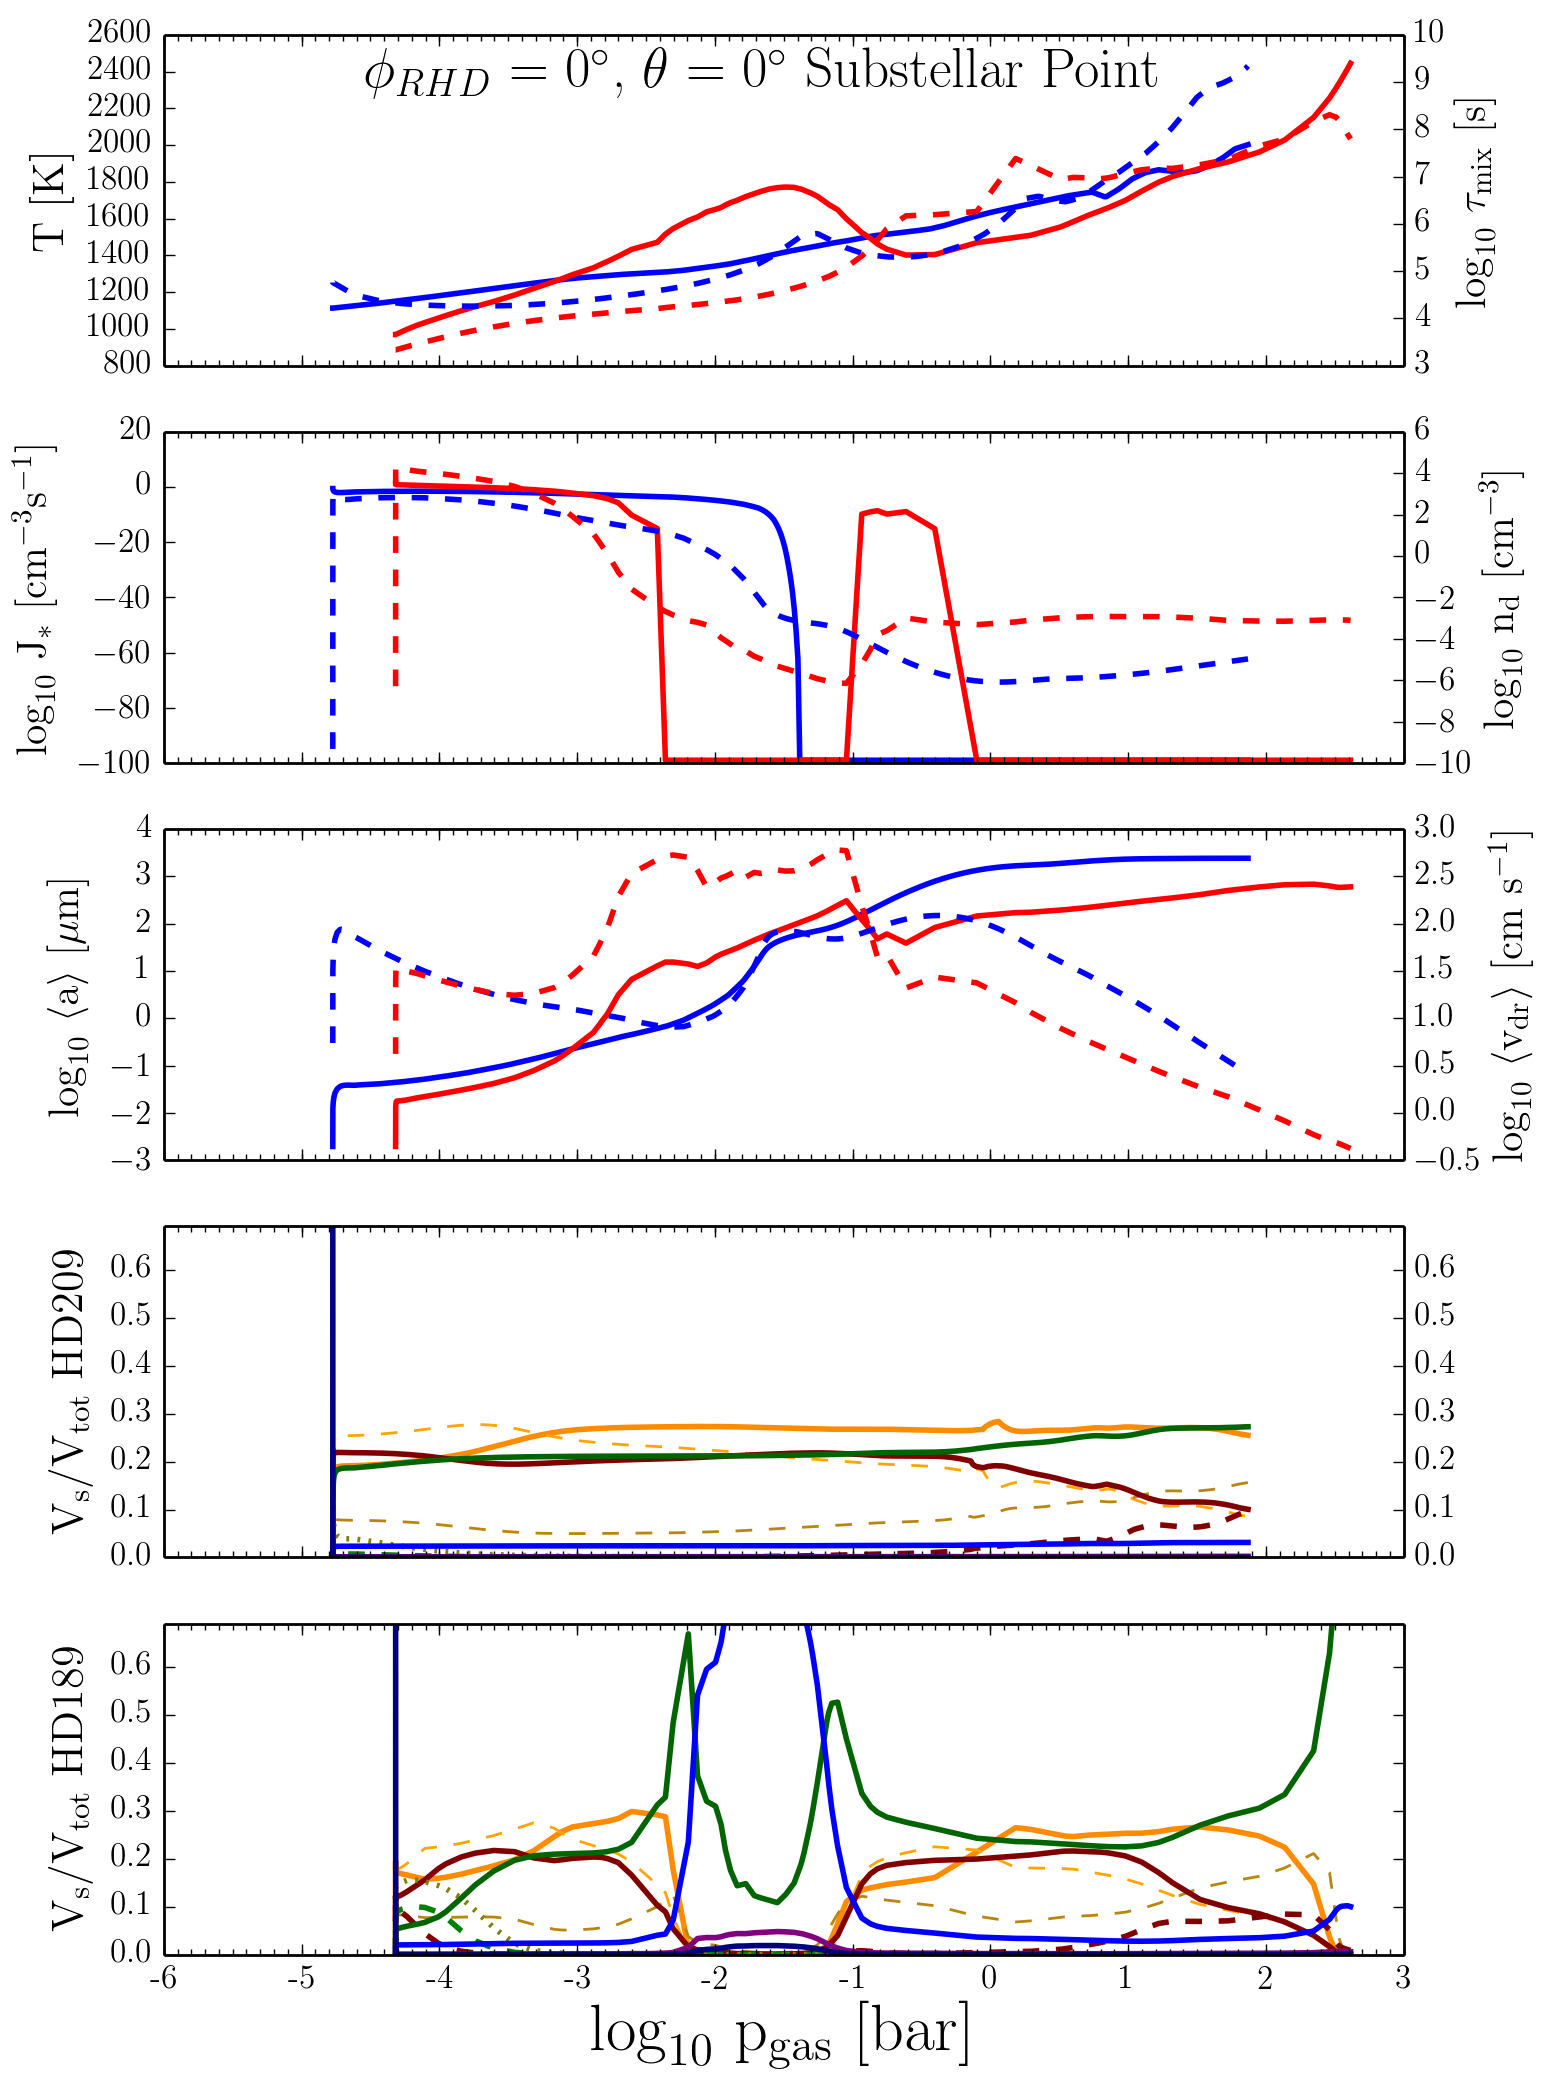
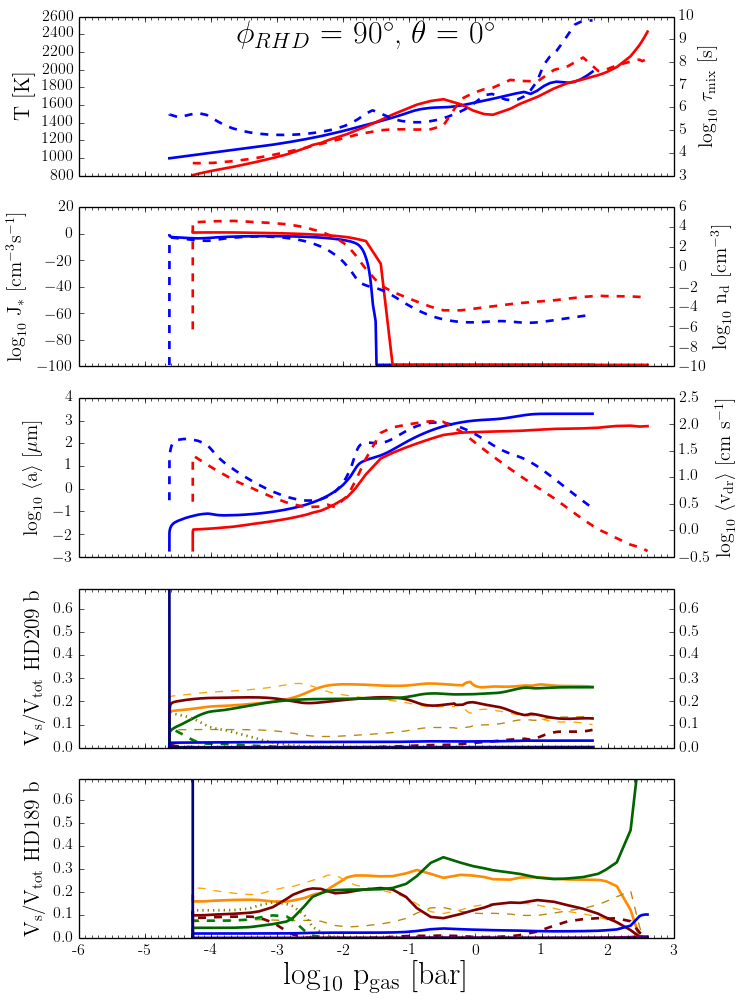
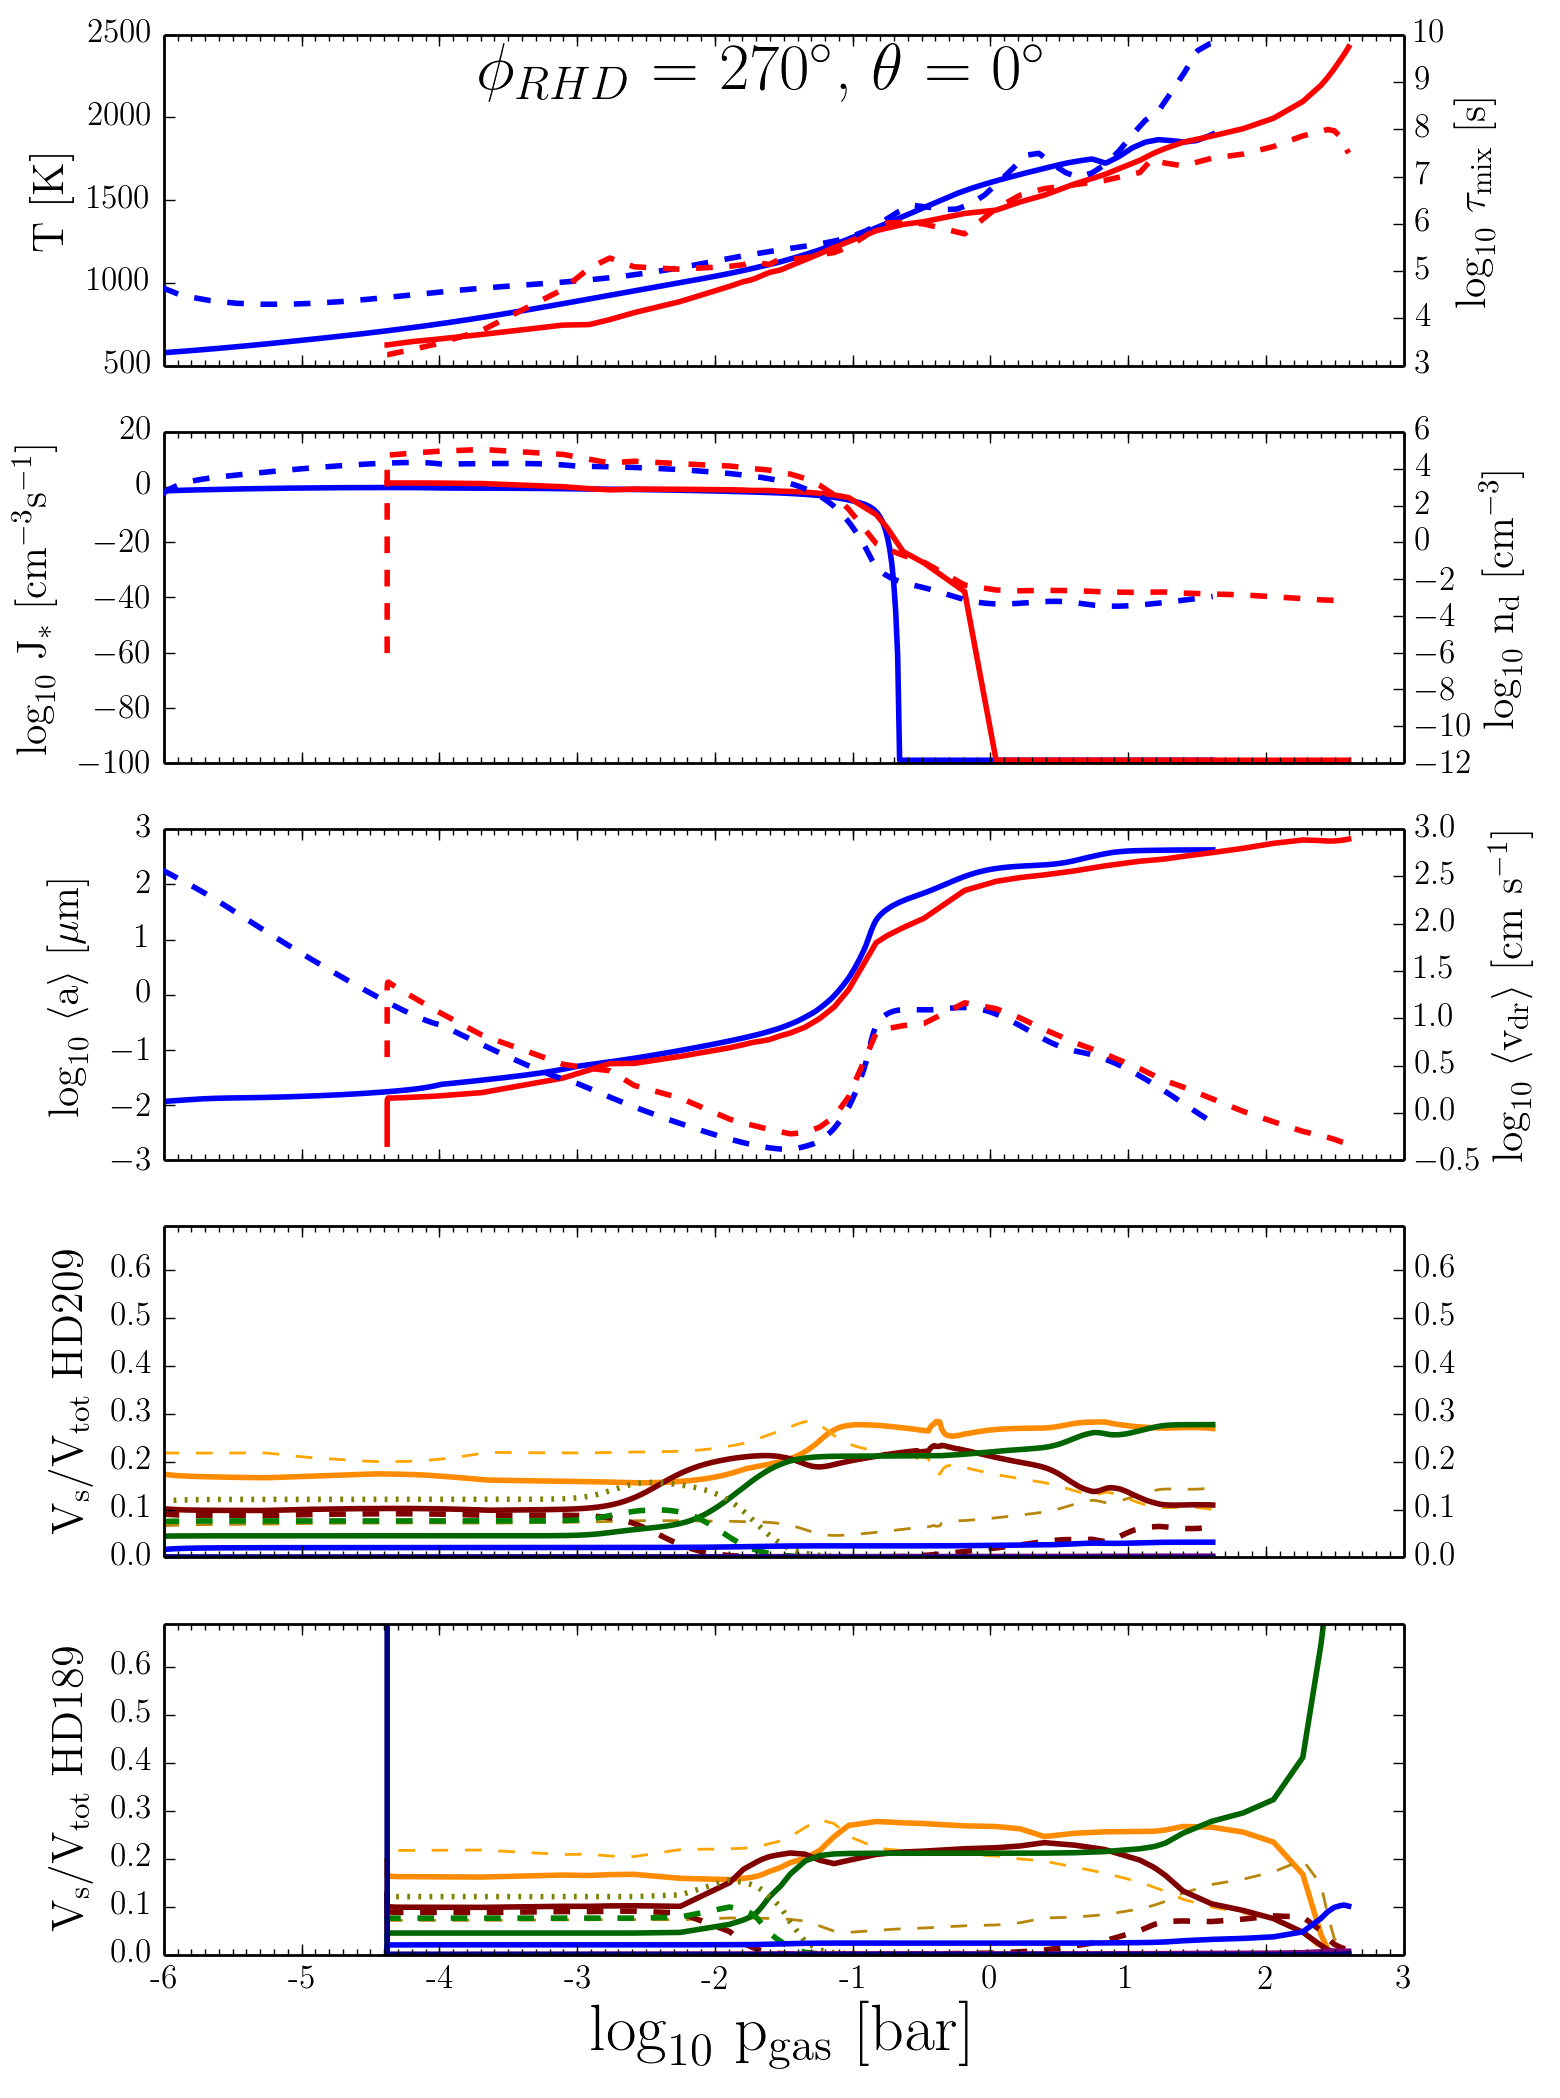
The local cloud properties are determined by the rate at which seed particles can form from the gas-phase (2nd panels Figs. 3, 4; and Fig. 18) and the efficiency with which they can grow (Figs. 19). Both are determined by the local gas temperature, the local gas density (or gas pressure, 1st panels Figs. 3, 4) and also by the local chemical composition. We discuss how the cloud structures differ between HD 189 733b and HD 209 458b in the following section, the gas-phase composition is discussed in Sect. 6.2. We note that the local quantities may change to some extent if the underlying model atmosphere simulation undergoes updates due to ongoing development work on, for example, opacities which might affect the deeper atmosphere structure. For the local view, we chose three different trajectories for each planet representing the substellar points (, ) and the two terminators (, and ).
HD 209 458b clouds form from one single nucleation region that spans several orders of magnitude in gas pressure (see also Fig. 18). HD 189 733b clouds are characterised by two nucleation peaks at low and at high gas pressure near the substellar point where the temperature inversion causes a local increase of gas temperature, and therewith nucleation ceases until the temperature has dropped low enough again. The consequence is a smoother distribution of (mean) grain sizes throughout the cloud in HD 209 458b locally and globally (3rd panels Figs. 3, 4; and Fig. 20). HD 189 733b clouds do have a middle-region of big grains with m m at bar. The material composition of the cloud particles are considerably different between the two planets at these pressures at the substellar point. In this region, the cloud particles fall fastest inside the HD 189 733b cloud structure. Similar values of gravitational settling are only reached in the lower (inner) cloud in HD 209 458b (Fig. 5).
Figures 3, 4 (3rd panel) demonstrate that the mean grain sizes differ largely between HD 189 733b and HD 209 458b at the substellar point, but they are rather similar at the terminators despite a gas temperature difference of K at the upper model boundary. A closer inspection, however, reveals that for (, ) the cloud material composition differs. Both planets show MgSiO3[s] contributing with 20-25% to the cloud material upto pbar. The next most important material is Mg2SiO4[s] (18%) in HD 189 733b but SiO[s] (20%) in HD 209 458b. HD 209 458b has a larger fraction of Fe[s] contributing to the cloud composition in these upper regions, while HD 189 733b offers a mix of SiO[s], SiO2[s], MgO[s], FeO[s] contributing with each but Fe[s]1%.
We note that HD209 458b has a large pressure scale height at (, ) spreading the upper cloud into regions of lower densities compared to HD 189 733b. If only the terminators were used to compare the atmospheric structure of HD 189 733b and HD 209 458b, one would conclude that they should be similar as also the (T, p) are rather similar and so is the material composition of the cloud particles. A more global view, however, suggests that the mean grain sizes are mostly larger in HD 209 458b at any given pressure level (Fig. 20) unless affected by a temperature inversion. This is a result of the lower nucleation rate (Fig. 18) which causes fewer seed particles to form, hence the cloud particles can grow bigger than in a case of more efficient nucleation as in HD 189 733b. The biggest cloud particles reside at the lower cloud edge in both models. However note, that none of the models reaches high enough gas temperatures for the cloud particle to evaporate completely at such high gas pressures.
5.1.1 Dust loading of atmosphere: and
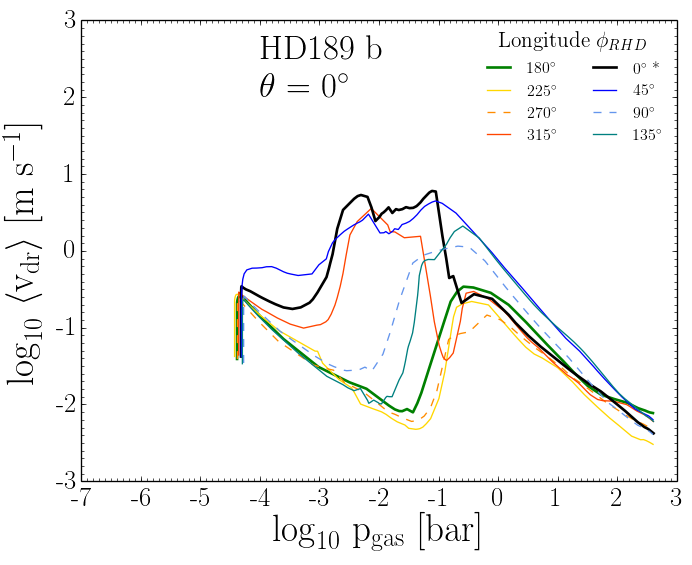
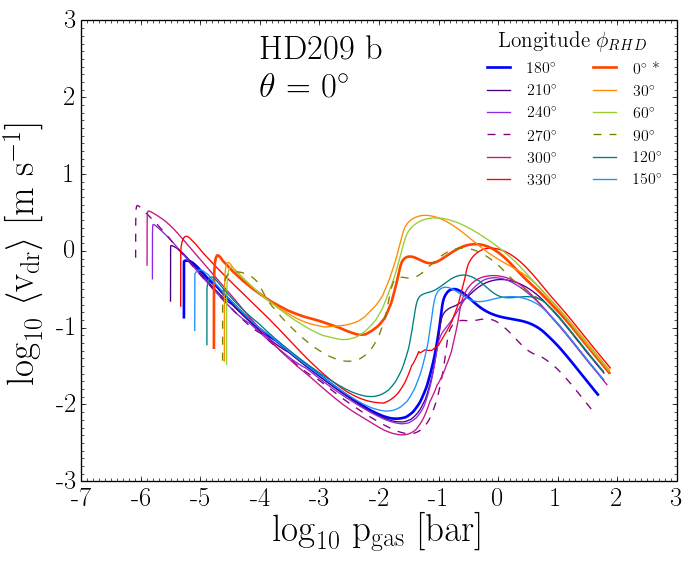
The dynamics of an atmosphere are also determined by the feedback of the clouds through dynamical processes like friction. The force equilibrium between (effective) gravity and friction determines how fast a cloud particle can fall and, hence, to what geometrical extension (or height) the cloud can grow. The drift velocity determines how fast a particular part of the atmosphere is emptied or filled with cloud material from other regions. Figure. 5 shows how the drift velocity (or gravitational settling velocity) changes with height in the atmosphere at different longitudes for the two giant gas planets.
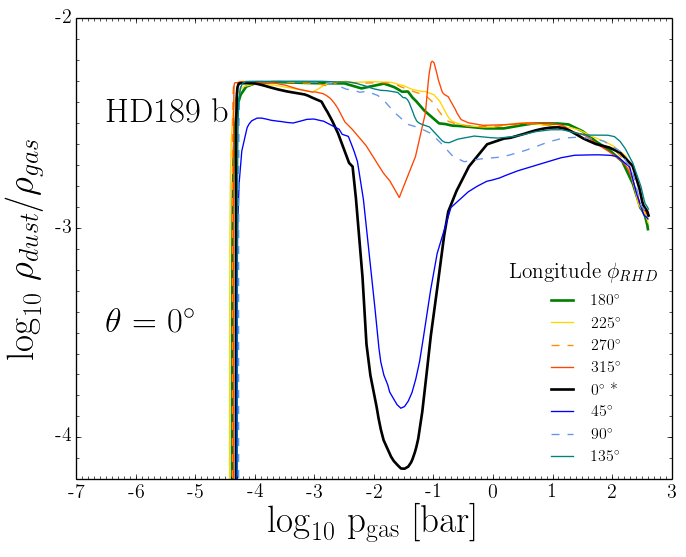
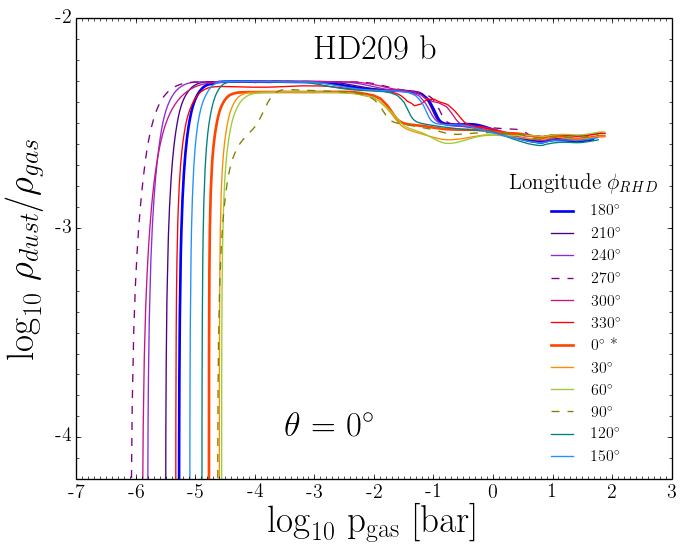
Figure 6 show the dust-to-gas ratio, , which can be understood as dust load of the atmosphere. The comparison of both figures shows that the lowest dust loading of the atmospheric gas occurs where the drift velocity is highest. decreases at the cloud bottom because the cloud particles evaporate.
5.2 The global view
The thermodynamic properties of the atmospheres of the giant gas planets HD 189 733b and HD 209 458b differ considerably due to the different global parameters of the planets like radii, bulk density and equilibrium temperature. Therefore, we now discus how the global cloud structures change which impact the global opacity pattern and with that observational global quantities like albedo and equilibrium temperatures. We expect the global cloud results to be less affected by changes of the underlying 3D atmosphere simulation in the present two-model approach.
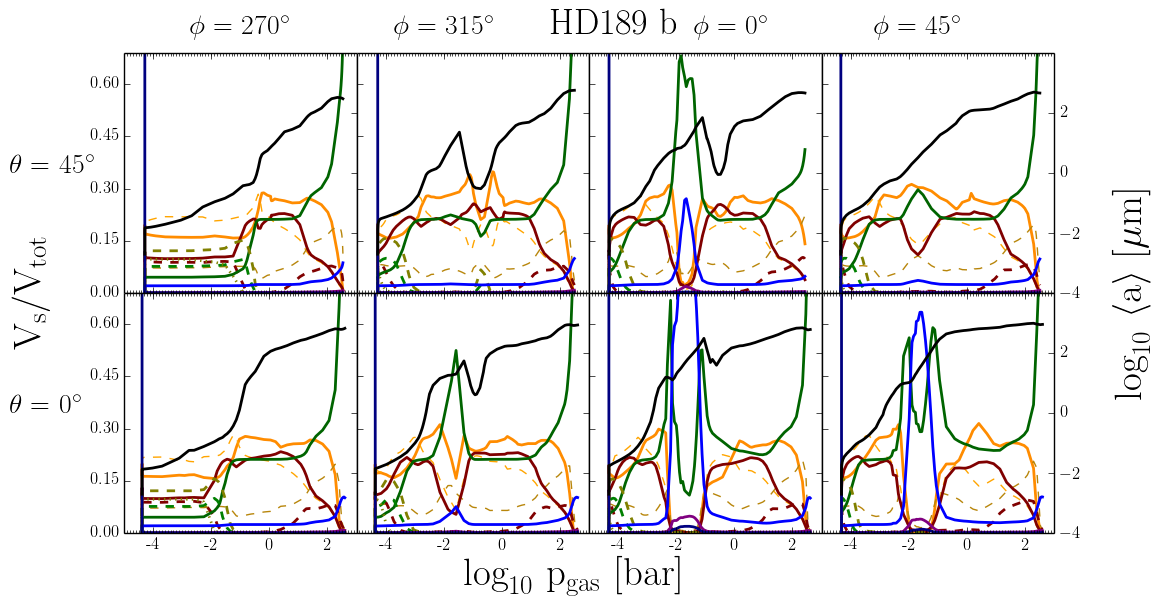
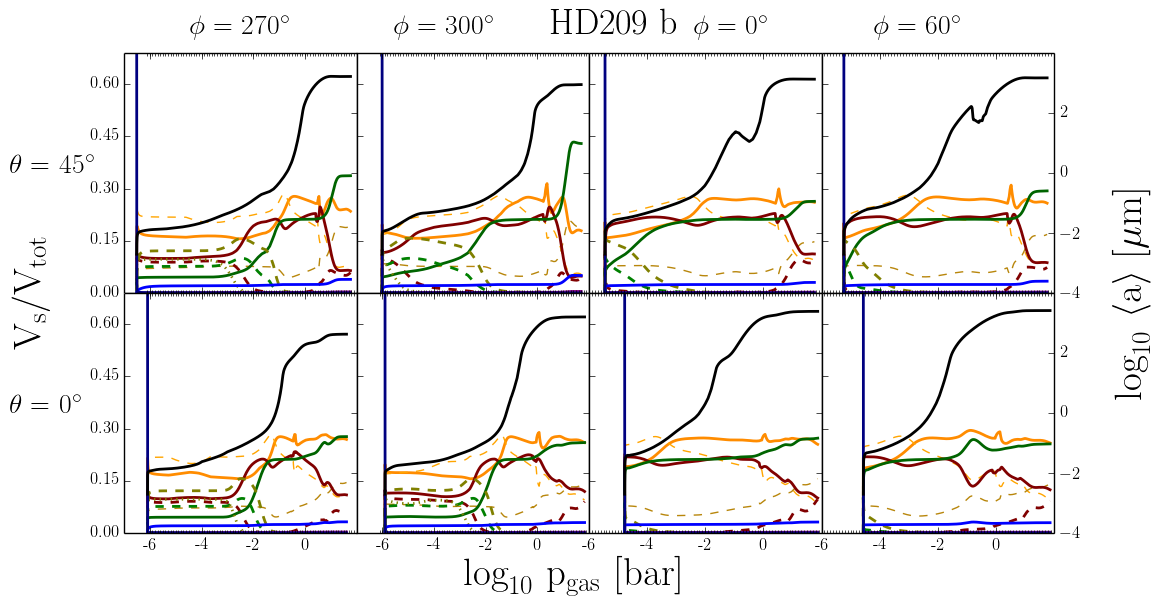
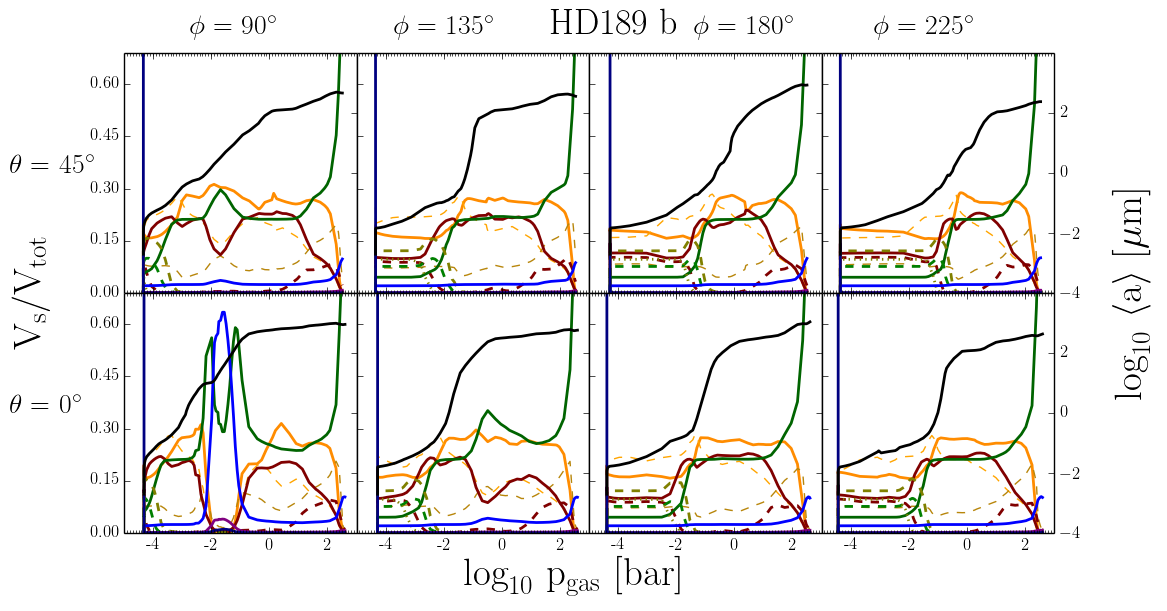
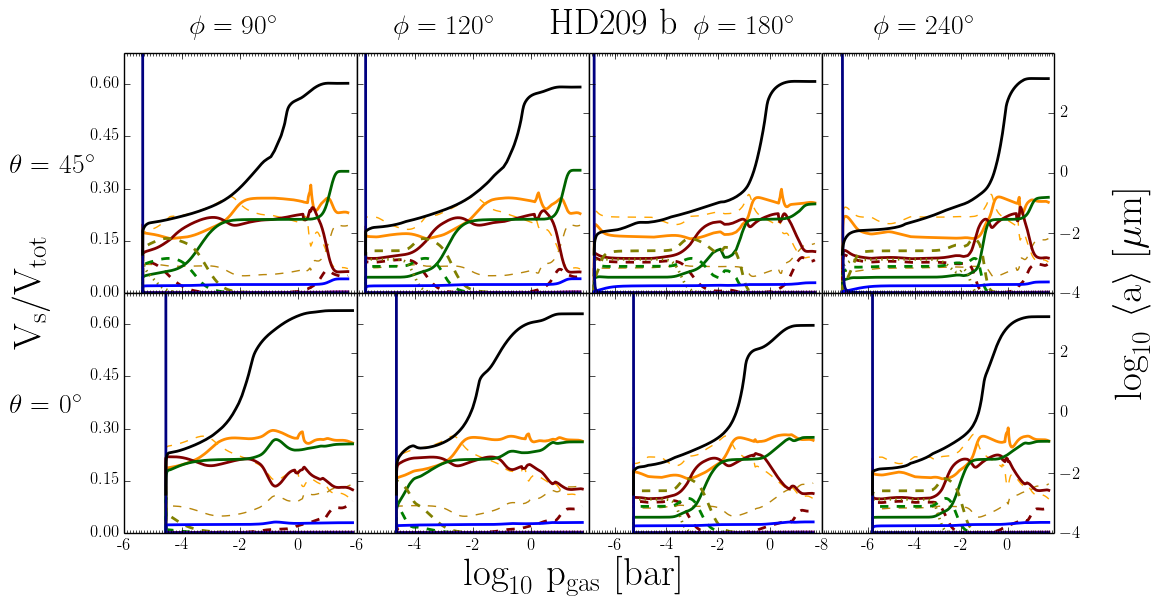
Figures 7 and 8 provide a quasi-three-dimensional view on the cloud material composition, , and the mean size of the cloud particles, , for two different longitudes (, (equator)), various longitudes at day (Fig. 7) and at night (Fig 8) side versus the local gas pressure.
Figures 7 and 8 offer a 3D impression of how the cloud material composition and the mean grain sizes change for the atmospheric trajectories probed in HD 189 733b (top) and HD 209 458b (bottom). The cloud material composition changes with height irrespective of longitude, latitude and planet considered. The clouds resulting for the 3D thermodynamic structures used here are predominantly made of a mix of MgSiO3[s] and Mg2SiO4[s] (30%), and Fe2O3[s]/Fe[s]/MgO[s] and SiO2[s] in the upper atmospheric regions where the particles are small (m). Depending on the local conditions in the upper atmosphere, SiO2[s] (%) can become the second most abundant material in these cloud particles after MgSiO3[s]. This occurs at the substellar point () and westward () of it for both planets. Generally, the cloud particles that form the upper cloud layers are the most chemically mixed. When FeS[s], Fe2O3[s], FeO[s], and SiO[s] have evaporated, the middle cloud is made of basically four materials only: MgSiO3[s] and Mg2SiO4[s], Fe[s], SiO2[s]. Small amount of Al2O3[s], and a less than 1% CaTiO3[s] and TiO2[s] contribute to the material composition throughout the whole cloud. Slightly more CaTiO3[s] is present in HD 189 733b than in HD 209 458b but it appears in almost negligible amounts in both planets for the (T, p) part of the atmospheric environment considered here.
5.2.1 Day-night-side difference
For both planets, the day side (Fig. 7) shows a stronger inward-increase of the cloud particles sizes than the night side. The particles grow more efficiently in HD 189 733b than in HD 209 458b because HD 189 733b has a more compact atmosphere, hence higher local gas densities than HD 209 458b.


6 The impact of dust cloud formation on gas-phase chemistry in HD 189 733b and HD 209 458b
The composition of the atmospheric gas in chemical equilibrium is determined by the local gas temperature and gas pressure (T, p) and by the element abundances. All element abundances that are involved in cloud formation will deviate from an initial (e.g. solar) value by how much is locked up in the cloud particles or by how much is released back into the gas phase. This is of particular interest if the cloud particle formation took place at a different location compared (e.g. cloud top) to where it evaporates (e.g. cloud bottom).
6.1 Atmospheric element abundances
Element abundances are an important set of input quantities for every chemical model, and hence, for every radiative transfer atmosphere simulation. It is therefore a long-standing challenge to determine atmospheric element abundances to a high precision for stellar atmospheres (e.g. Grevesse et al. 2007; Amarsi et al. 2015). Element abundances for planetary atmospheres are even harder to determine and the host star’s set of element abundances is usually applied assuming that planets form from gravitationally unstable protoplanetary disks keeping the host star’s element abundances. This belief has recently been challenged by chemical disk evolution models (Helling et al. 2014). Another challenge for observing the element abundances from planetary atmospheres arises from the fact that the formation of clouds causes a selective depletion of elements depending on the atmopshere’s local gas temperature and gas pressure. It results in a height-dependent element abundance pattern that changes across the planet’s globe as we demonstrate here for two extrasolar planets. The issue of element abundance determination is also highly relevant for retrieval methods and the discussion of the C/O ratio. While no one C/O ratio will exist for a cloud forming atmosphere (Sect. 6.2.3), to search for one (planetary) value for the metallicity is simply asking the wrong question. Both, the C/O ratio and the metallicity depend on the cloud formation efficiency and can therefore not be treated as independent from any of the cloud parameters invoked in retrieval methods. We demonstrate how the element abundances change due to cloud formation in the two giant gas planets HD 189 733b and HD 209 458b, and how the abundance pattern may differ between these two planets.
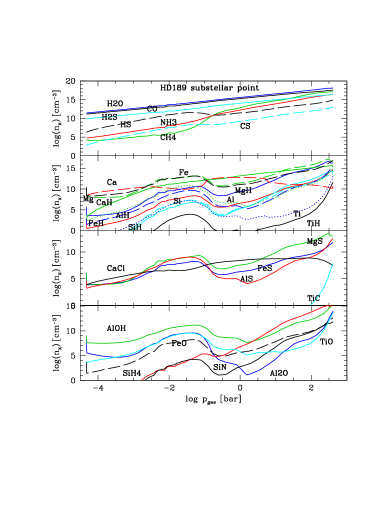
Figure 9 summarizes the element abundances for the 8 cloud forming elements (O, Ca, S, Al, Fe, Si, Mg) forming 12 solid species (MgSiO3[s], Mg2SiO4[s], SiO[s], SiO2[s], MgO[s], Fe[s], FeO[s], Fe2O3[s], Al2O3[s], TiO2[s], CaTiO3[s], FeS[s]) for various test trajectories across the equator () of HD 189 733b (left) and HD 209 458b (right). The element abundances follow the same depletion hierarchy in both planets: Ti is the most depleted, followed by Al, then Fe, Si and Mg by about the same order of magnitudes. The least overall depleted elements are O, Ca and S. Individual trajectories that probe the atmosphere differ widely in their depletion pattern. The most prominent example is the substellar point where in the case of HD 189 733b all Si, Mg and Fe is returned to the gas phase through the evaporation of the Si/Mg-binding materials (MgSiO3[s], Mg2SiO4[s], SiO[s], SiO2[s], Fe[s], FeO[s], Fe2O3[s]) as result of the temperature inversion. A similar trend occurs in HD 209 458b only at the cloud base.
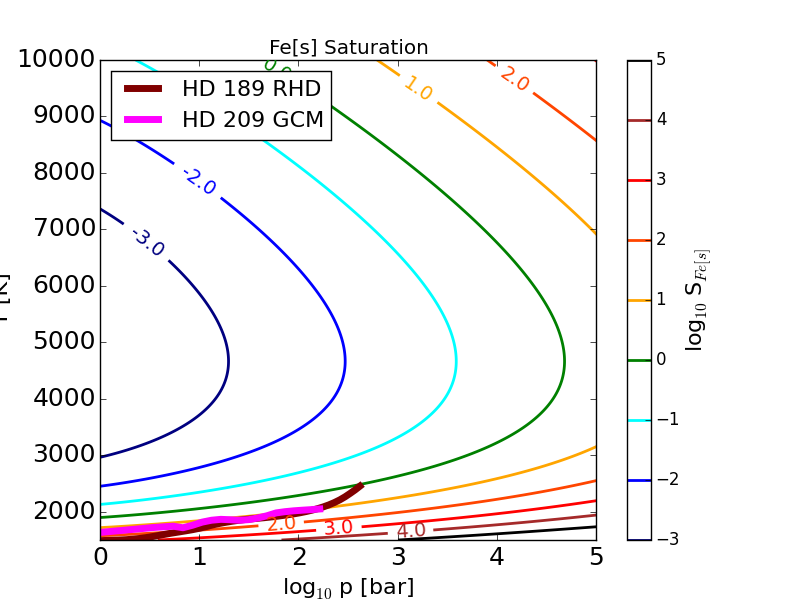
The element depletion at the cloud top is somewhat model dependent as the location of the cloud top (e.g. where element depletion starts) depends on the setting of the upper model boundary. The location of the cloud base can in principle be defined as where all cloud particles have evaporated and the bound elements have been returned to the gas phase. But this is only possible if the models extend to high enough gas temperatures that the cloud particles can evaporate completely. Both, HD 189 733b and HD 209 458b, reach such high local gas pressures in the lower atmosphere that the thermal stability of all materials considered here is extended to substantially higher temperatures compared to, for example, brown dwarfs. This is demonstrated in Fig. 10 for Fe[s]. However, some of the elements show an element enrichment that results from cloud particles being formed elsewhere and having rained into these regions where some of their solids become thermally unstable. This is the case for HD 189 733b on the day and the night side (compare top of Figs. 7, 8) where all the Mg/Si/O minerals have evaporated except MgO[s]. As MgSiO3[s], Mg2SiO4[s] and SiO[s]/Fe2O3[s] make up 60% of the cloud particle volume, its evaporation produces a substantial enrichment at the cloud base in oxygen, and to a lesser extent in Si and Mg in HD 189 733b. Inspecting Fig. 9 shows that HD 209 458b receives an even stronger oxygen enrichment at the cloud base which, however, results mainly from MgSiO3[s] and SiO2[s] evaporation (compare bottom of Figs. 7, 8). The changing element abundance of Ca does not affect the cloud material volume remarkably.
6.2 Abundances of atoms, molecules and electrons
We consider the collisional dominated inner (deeper) part of an atmosphere where kinetic gas-phase modelling is not required, but which composes the inner boundary for kinetic gas-phase rate networks (e.g. Agúndez et al. 2012; Rimmer & Helling 2015). We consider the part of the atmosphere where the formation of dust clouds influences the local gas-phase chemistry. The cloud formation causes a depletion of those elements which take part in the condensation process (e.g. Fe, Mg, O, Ti; Fig. 9) resulting in reduced abundances of respective molecules. We neglect any external radiation field effect on the gas phase chemistry. We are interested in
-
•
by how much the gas-phase composition changes due to the element depletion by cloud formation and how this effect might differ between the two planets, HD 189 733b and HD 209 458b (Figs.11)
-
•
TiO abundance in a cloud forming atmosphere (Figs.11)
-
•
how the C/O-ratio changes across the globe and between the two planets (Figs.13)
- •
-
•
how the water abundance compares to the cloud location (Fig. 12).
6.2.1 Chemical gas-phase abundance as a result of element depletion by cloud formation
The first observation from our results is that n(CO) n(CH4) at the substellar point and at both terminators in HD 189 733b and HD 209 458b in the case of oxygen depletion by cloud formation (Fig 11). CH4 approach CO in abundance in our test case if no oxygen-depletion occurs (see Fig. 21, 22). CO has been suggested to exist in the upper atmosphere of HD 189 733b (Désert et al. 2009; de Kok et al. 2013; Rodler et al. 2013), and Knutson et al. (2012) suggest that more CO is required than suggested by chemical equilibrium calculation. More CO is required in order to suppress the Spitzer 4.5m flux to the observed level with the models applied in Knutson et al. (2012).
Figure 11 demonstrates how the molecular abundances change as a result of element depletion. All molecules containing Fe/Al/Mg/Si/O or a combination of those follow element depletion pattern. Molecules like NH3 and N2 are not visibly affected by cloud formation because N is not part of any condensing species considered here. CaH and CaCl are also not affected by the cloud formation despite Ca being part of CaTiO3 as condensing species.
Figure 11 further demonstrates that the abundance of individual molecules is reduced by many orders of magnitudes which change throughout the atmosphere. It is further important to note that this effect occurs also for CH4 and CS which are molecules that are not affected by depletion of one of their constituent elements. Instead, they are influenced by element depletion through other molecules like CO2 for CH4 and AlS, FeS, MgS for CS.
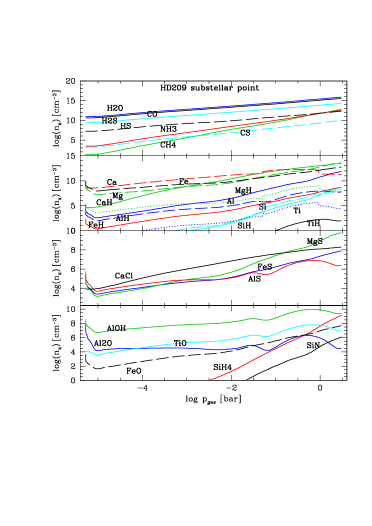
Comparing the abundances of molecules of major interest for observations, CO, H2O and CH4, for HD 189 733b and HD 209 459b shows that the abundance of CO and H2O are very similar in both atmospheres at the substellar point (Fig. 11) in a gas that is affected by element depletion due to cloud formation. HS differs by one order of magnitude between the two planets. Figure 21 and 22 (left columns) demonstrate that differences increase at the terminator points which will affect transit spectroscopy. H2O remains the most abundant of these molecules and of similar abundance in both atmospheres, but CO and CH4 strongly decrease in the upper-most layers at the east terminator () in HD 209 459b. The differences in the local (Tgas(z), pgas(z)) structures between the terminator and substellar trajectories are imprinted into the local molecular abundances: all trajectories show distinct chemical differences in both planets. We refer for more details to Figs. 11, 21 and 22. Cloud free models will overestimate differences in molecular abundances between both planets (compare right columns of Figs. 21 and 22).
Given the interest in additional opacity species to possibly account for temperature inversions in atmospheres of irradiated planets, we discuss our findings about the TiO abundance. First, Ti is one of the most depleted elements in an oxygen rich atmosphere where cloud formation takes place. This is a result rather independent of the cloud modelling approach simply because of the low solar abundance value for Ti. TiO is depleted by 5-6 orders of magnitudes in both planets inside the cloud region. Only TiH, AlH, AlS, and Al2O appear more depleted than TiO. Considering now that the upper boundaries of our present simulations for HD 189 733b (left) and HD 209 458b are artificially fixed, it is reasonable to expect that the cloud expands to lower pressures and with that the TiO depletion would continue to higher atmospheric layers.
Figure 11 suggest that a temperature inversion might be detectable by atomic emission lines as Fe and Mg appear very abundant and even enhanced to a small extent. Temperature inversions are related to a local positive temperature gradient at the high-pressure part of it. Molecules like TiO and CO seem not too well suited to search for a temperature inversion because TiO has a very low abundance in the cloud region and CO is simply not affected by the temperature inversion, at least according to our equilibrium chemistry calculation inside the irradiation-shielded and collisional dominated atmosphere. However, strong molecular lines may be used to derive local temperatures, for example from high-resolution spectra as in Schwarz et al. (2015).
6.2.2 Water abundance
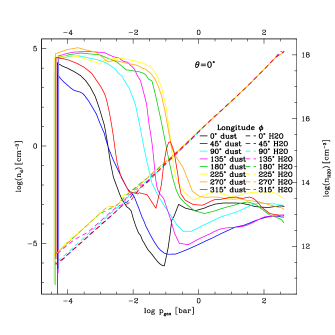
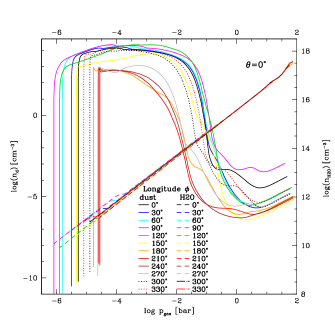
Figure 12 compares the location of the cloud in terms of cloud particle number density, , along the equator to the H2O gas abundance (dashed lines). Water is the most abundant gas-phase absorber in ultra-cool atmospheres, and Fig. 12 shows where the molecule is most abundant compared to the cloud location. The detection of atmospheric molecular water in HD 189 733b has been reported by Todorov et al. (2014); Crouzet et al. (2014) near m from secondary eclipse emission spectrum and McCullough et al. (2014) report the detection of water in the transit absorption spectrum of HD 189 733b. Evans et al. (2015) initial results from Spitzer observations suggest no water detection for HD 209 458b but the spectrum would suggest the detection of haze and depleted CO. However, Deming et al. (2013) provide evidence for molecular water at shorter wavelengths, 1.4m, from Hubble observations, which recently was confirmed by Sing et al. (2016). While molecular water is omnipresent in both atmospheres, in HD 189 733b and HD 209 459b, modelled here, we have an indication for a drop in CO abundance at the east terminator (). This result, however, would need to be confirmed by kinetic gas-phase calculations to test the effect of the stellar radiation field. Returning to Fig. 12 suggests that a considerably larger portion of the atmosphere of HD 209 458b is affected by the dust cloud. The lower mass of HD 209 458b leads to a smaller surface gravity which leads to a larger atmospheric scale height resulting in a larger geometrical extension of the clouds. Our results concerning the presence and location of gaseous water in relation to the clouds may explain some of the observed differences between the two planets. In HD 189 733b, strong molecular water features have been reported while HD 209 458b H2O-absorption appears much shallower. However, by considering the location of the clouds in the two atmospheres, we see that obscuring clouds exist high in the atmosphere of HD 209 458b, but much deeper in HD 189 733b. Cloud opacity calculations suggest that gaseous water could be observable on both planets, on HD 189 733b and on HD 209 458b (Fig. 26, 25, 26) as the cloud extinction is low at wavelength related to Spitzer bands. A closer inspection of the 3.6m, 4.5m, and 5.8m opacity in Figs. 16 and 17 as indicative of the IRAC 1,2 and 3 bands, shows that the opacity peaks at 0.1 bars.
6.2.3 Changing carbon-to-oxygen ratio
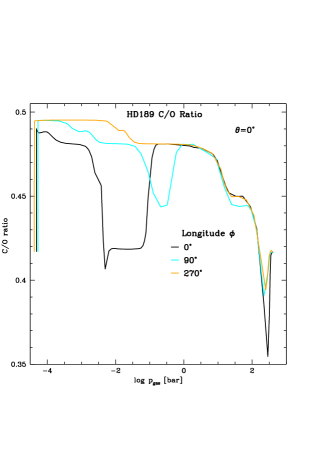
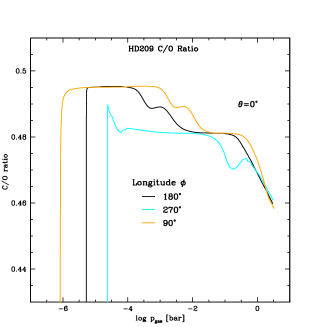
The carbon-to-oxygen ratio (C/O, - carbon element abundance, - oxygen element abundance) is often used as indicator for potential carbon-binding molecules and it has recently attracted attention in the exoplanetary community with respect to the study of pre-biotic carbohydrate molecules. The C/O ratio has been used a global parameter (similar to log(g) or Teff) to argue for the existence of carbon planets where C/O1 (Madhusudhan 2012). Helling et al. (2014) demonstrated that a considerable overabundance of carbon over oxygen is very unlikely to occur during disk evolution, and that cloud formation is one mechanism to tip an atmosphere into a carbon-rich regime if C/O is already close to one. Benneke (2015) concludes from his analysis that HD209458b, WASP-12b, WASP-19b, HAT-P-1b, and XO-1b but also WASP-17b, WASP-43b and HD 189 733b have atmospheres with a global C/O0.9, hence these atmosphere appear oxygen-rich. We summarize our findings about the C/O ratio for HD 189 733b and HD 209 458b based on the combined modelling approach of this paper in Fig. 13. Figure 13 shows that the C/O ratio changes with height throughout the cloud. It first increases due to the massive depletion of oxygen from an initial value of C/O=0.427 to C/O=0.495 for both planets near the top of the cloud. Depending on longitude, it remains at the this maximum level or starts to drop due to oxygen being released to the gas through silicate evaporation. In the case of HD 189 733b, the oxygen abundance is enriched to values larger than the initial solar value which is a clear sign for cloud particles moving through the atmosphere and, hence, transporting elements into different regions. This is particularly prominent at the cloud base of HD 189 733b where C/O has decreased to almost 0.35. Note that these changes are solely caused by changes in the as in the present models. Such a changing C/O ratio has implications for synthetic spectrum calculation, for example for young objects where the accreted dust from the protoplanetary disk serves as condensation seed and clears out the atmosphere until the supersaturation (, any key species of a condensing material) drops below one for the key species of a condensing material, i.e. until . Our investigations show again that it remains an illusion to attribute one C/O ratio value or one metallicity value to a planet that forms clouds inside its atmosphere. With that we confirm our previous findings in (Bilger et al. 2013; Helling et al. 2014).
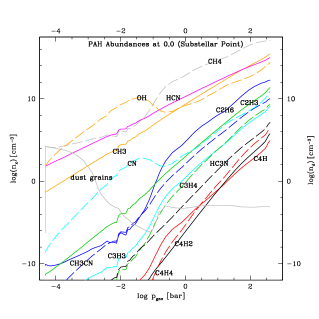
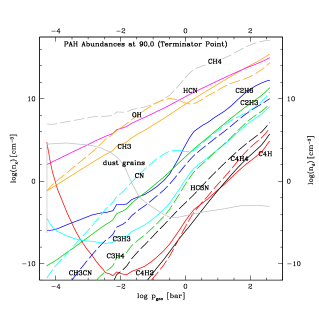
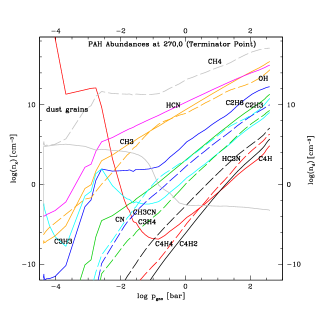
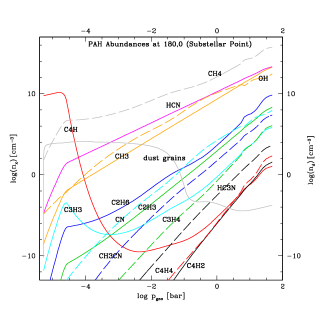
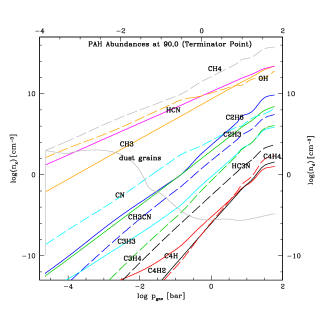
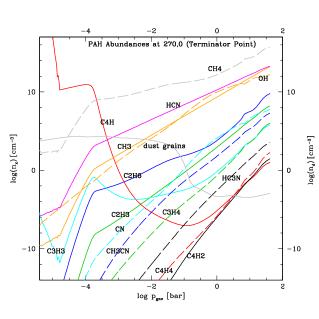
6.3 The abundances of hydrocarbon and cyanopolyyne molecules
Hydrocarbon and cyanopolyyne molecules are of growing interest for extrasolar planets due to their potential link to biomolecules (e.g. Rimmer & Helling 2015 and references therein). The oxygen depletion caused by the formation of clouds has a strong impact on the abundance of the dominant molecules as re-iterated in Sect. 6.2. We are now in the position to investigate what affect this would have on the abundance of carbohydrate molecules including large N-bearing species HCxN, complex hydrocarbons CnH2n±2, C2H2n, CH-bearing radical CxH, CHx and Cx. Bilger et al. (2013) have demonstrated that cloud formation leads to a increase in the C/O ratio such that several hydrocarbon molecules and cyanopolyyne molecules can be present in brown dwarf and giant gas planet atmospheres. A large surface gravity and/or a decrease in metallicity lead to an increased abundance of these species. Bilger et al. (2013) show that CO, CO2, CH4 and HCN contain the largest fraction of carbon.
Figures 14 and 24 show the abundance of hydrocarbon molecules and cyanopolyyne molecules in HD 189 733b and HD 209 458b, respectively. We note that these abundances are for the collisionally dominated part of the atmosphere only, where the assumption of chemical equilibrium is valid.
The most abundant hydrocarbon molecule is CH4 in both planets, followed by HCN, OH and CH3 with changing importance depending on the local thermodynamic conditions. These molecules reach abundances comparable to MgH, MgS, CaH or Fe at p1bar (Fig. 11). The larger hydrocarbon and cyanopolyyne molecules abundance decrease strongly towards the upper atmosphere but are rather substantial in the high-density part of the atmosphere where p1bar. Large molecules like C2H6 and C2H3 followed by CH3CN are the most abundant molecules after CH4, HCN, OH and CH3. The number density of the most abundant hydrocarbon molecule (C2H6) changes considerably in particular in the low-density part of the atmosphere of both planets (Fig. 24, 24). The C2H3 abundances, in contrast, do not change very much with longitude.
We therefore conclude that hydrocarbon and cyanopolyyne molecules can be rather abundant in the inner, dense part of the atmospheres of HD 189 733b and HD 209 458b but non-equilibrium processes will need to be studied to see if these molecules could reach an observational abundance also in the upper part of the atmosphere. It is, however, likely that these molecules would be hidden beneath cloud layers as the comparison with the cloud particle number density in Figures 14 and 24 suggests.
These findings are also of interest for future kinetic gas phase studies that take into account the influence of high-energy radiation like for example cosmic rays or the host star’s radiation field.
7 Different cloud opacity for different planets
The cloud extinction is relevant for understanding observations of hot spots or molecular abundances as discussed in Sect. 6.2.2 for water. Many authors very approximatively describe the chemically complex clouds on extrasolar planets like HD 189 733b and HD 209 459b. We therefore present the cloud extinctions for HD 189 733b and HD 209 459b for their day-side and the night-side in conjunction with the (height-dependent mean cloud particle size). The material composition that relates to an for the atmospheric trajectories considered here can be retrieved from Figs. 7 and 8. We demonstrate how the cloud opacities differ between the two planets in the following section.
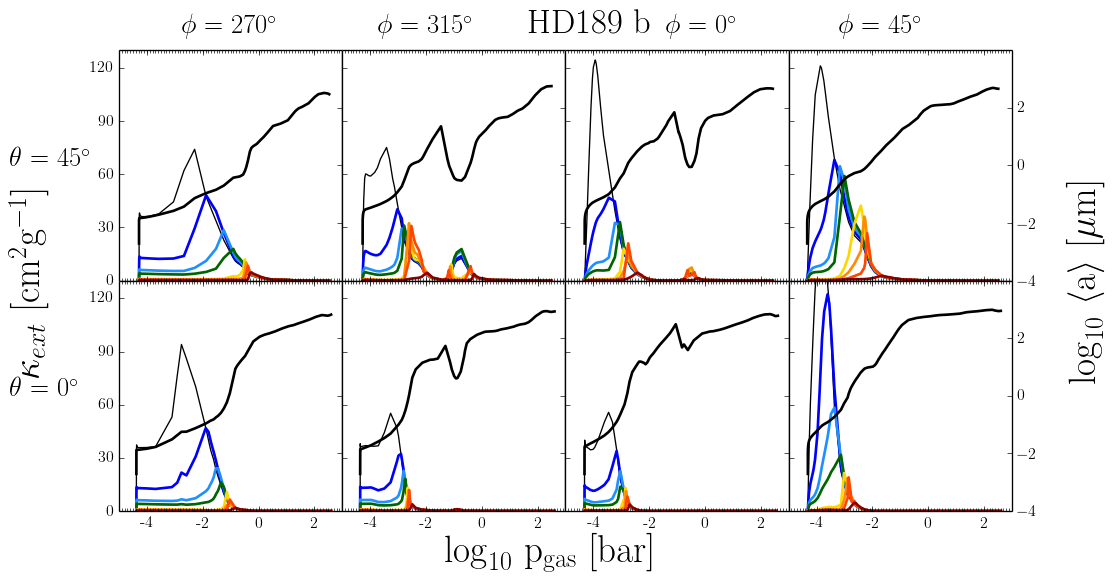
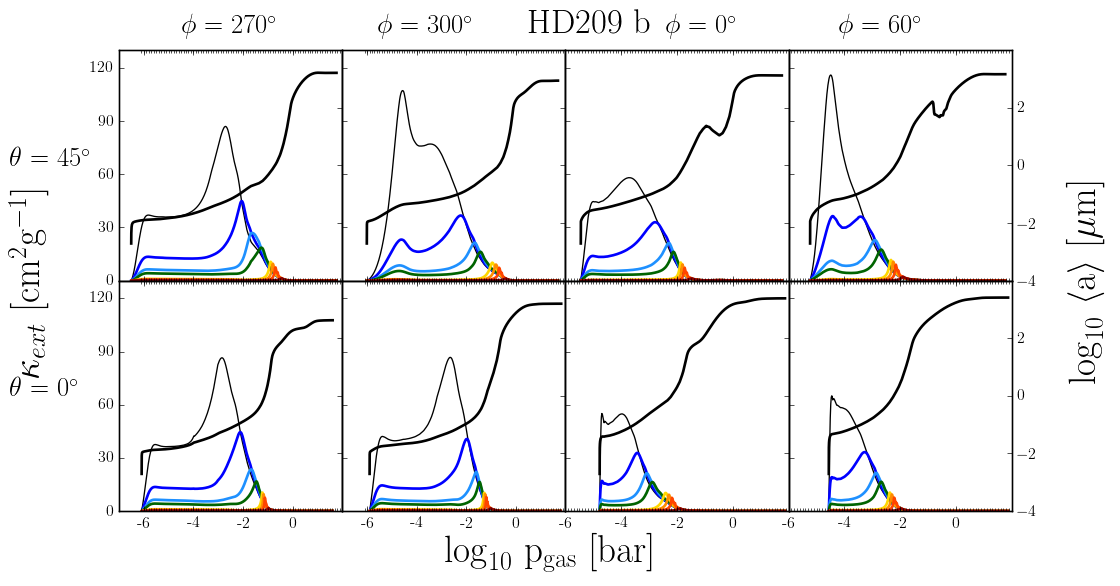
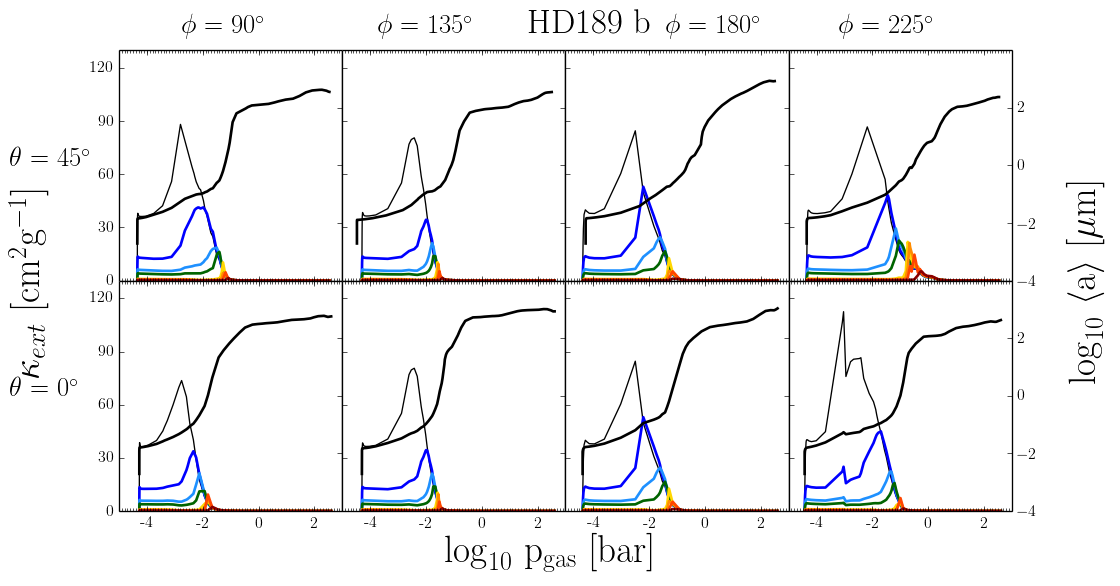
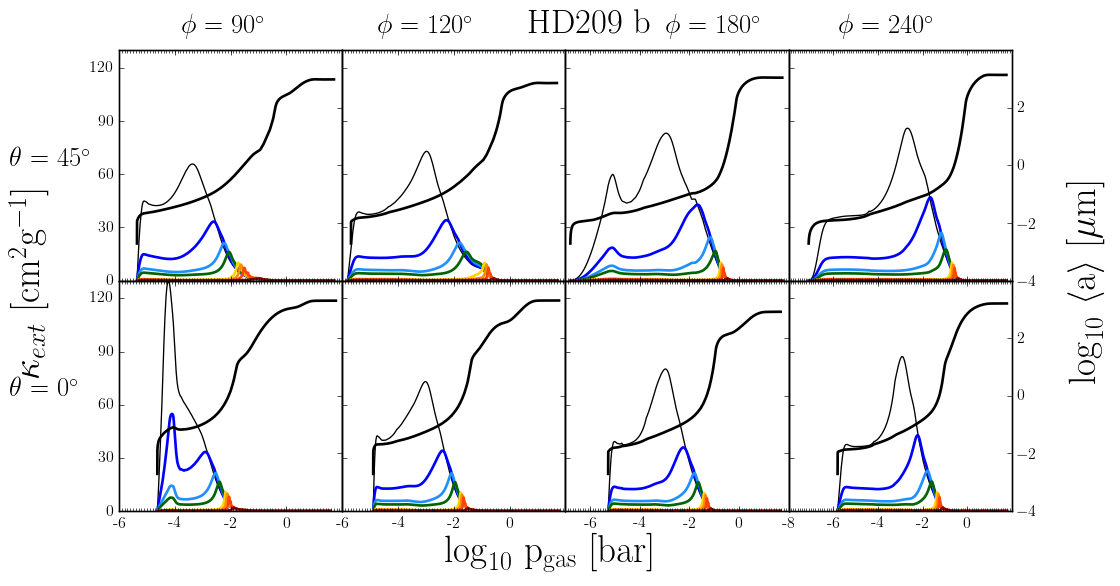
7.1 Cloud extinction from cloud formation
Figures 16 shows the day-side cloud extinction, [cm2g-1], and Fig. 17 the night-side cloud extinction as sum of the cloud absorption and scattering. Figures 25 (substellar point) and 26 (terminator) provide more details of the individual contributions of scattering and absorption of the cloud layers.
Generally, the cloud opacity is individual to each of the two planets. In both planets, however, the cloud opacity is largest in the upper cloud layers which are dominated by particles of m. Both clouds are darkest if observed at m and appear successively lighter if observed at longer wavelengths as the extinction decreases with increasing wavelengths. The extinction drops rapidly at a certain pressure level in both planets and this is associated with the strong rise in particles sizes. Once the mean particles sizes (panel 3 in Figs. 3, 4) has reached a maximum value, the cloud extinction drops to its minimum. HD 209 458b shows generally a smother change in cloud particle size (Fig. 20, bottom) as result of the formation of seed particles occurring rather homogeneously along those trajectories studied here. Our results for HD 189 733b demonstrates that a temperature inversion in the atmosphere has a distinct effect on the cloud properties that will also affect the cloud extinction: Seed formation occurs intermittently along a certain trajectory and in comparison between different trajectories (Fig. 18, ). As consequence, the mean grain size changes vividly along such a trajectory, hence the cloud particle sizes change strongly with atmospheric height, but also with longitude as Fig. 20 (top) demonstrates. Following now the cloud extinction at and in HD 189 733b in Fig. 16 shows, that the cloud opacity shows the most unpredictable changes as function of wavelength and also with atmospheric height at these longitudes. To put these results in perspective, most of the transit spectroscopy observations are fitted with one particle size for the whole cloud, retrieval methods assume 2-4 particle sizes (e.g. de Kok et al. 2011; Barstow et al. 2014; Lee et al. 2014). However, it is interesting to note that both planets have similar cloud opacity at the 90o-terminator despite HD 209 458b having lower gas pressure at the cloud top. The differences between the two planets in cloud opacity at the 270o-terminator originates from a difference in number of cloud particles at the cloud top as the r.h.s. of Fig. 4 indicates, but not from a difference in particle sizes or materials.
While the material composition is important for the element depletion of the gas phase, it is less important for the cloud extinction near the top of the atmosphere. Here, the number of particles and the mean grain size have the largest impact on the cloud extinction. It is therefore not surprising that observations for transitting planets can be fit by almost every material for which optical data are available (e.g. Wakeford & Sing 2015; Nikolov et al. 2015). This also means, that the cloud extinction is the result of the cloud formation process as the mean grain size will be determined by the rate at which condensation seeds can form and where. We have discussed this above for the example of a temperature inversion. In conclusion, we demonstrated that only a detailed cloud model lifts the // degeneracy in retrieval methods. This degeneracy is artificially generated by assuming independence of cloud parameters which is simply incorrect.
8 Discussion
8.1 Cloud properties in perspective
The desire to extract meaningful information from observations (or to decide what a meaningful information is) led to the development of retrieval methods which mainly solve the radiative transfer problem for prescribed parameters. The challenge is now to statistically evaluate and re-set these initial parameters such that a best fit to a set of observational information is achieved. Therefore, observations were fitted by a selected number of cloud size bins, a prescribed material composition and number of cloud particles, prescribed pressure levels for cloud deck and the cloud base and other assumptions for the gas composition.
HD 189 733b:
Lecavelier Des Etangs et al. (2008) identifed MgSiO3[s]
as a possible abundant condensate with particle size m. Barstow et al. (2014) used STISS observations of
HD 189 733b to retrieve a monodisperse cloud layer made of
MgSiO3[s] (or MnS[s]). Best fits were achieved for small particles m or 10
m particles, but a degeneracy with the Na abundance occurred. The
authors settled on a best fit by a homodisperse cloud layer made of
m-sized MnS[s] particles and 50 ppmv of
Na.
Lee et al. (2014), for the same object, chose MgSiO3[s] as
material for their chemically homogeneous cloud particles. They also
derive a vertically homogeneous layer for 0.1m-sized particles.
Both groups treat their cloud parameters and gas phase abundances as
independent parameters and find a degeneracy between gas composition
and cloud particle parameters. Lee et al. (2014) emphasis that this
degeneracy does not affect H2O.
Pont et al. (2013) imply that various cloud particle sizes would be
required to fit to their transit spectra of HD 189 733b.
Our results indeed show that the upper part of the cloud on HD 189 733b is dominated by small cloud particles of m and an abundance of cm-3. The material composition of a mix of materials with the most abundant materials being % MgSiO3[s], % SiO2[s], % Mg2SiO4[s], FeS[s] which quickly is replaced by the same amount of Fe[s], and % MgO[s]. These detailed volume fractions are for the terminator. We have demonstrated that the relative abundance of the materials does change across the globe and that MgSiO3[s] is the dominating material at the cloud top with % volume fraction but with other silicates only marginally less abundant.
HD 209 458b:
Not much seems known from observation about
cloud properties on HD 209 458b, except the suggestion that the
observation of Si2+ in the planet’s exosphere indicates that no
clouds involving Si should form (Koskinen et al. 2013). Burrows et al. (2008)
and Rowe et al. (2006) conclude that there are no (high-altitude)
reflecting clouds in HD 209 458b. Hood et al. (2008) invoked iron and
enstatite (MgSiO3[s]) assuming a homodisperse cloud particle size
of 5m for their 3D radiative transfer calculation on fractal
clouds.
Our results show that the mean cloud particle size can
be as small as 0.01m at the cloud top which might be accessible
by transit spectroscopy. These particles are made of a mix of
materials with again % volume fraction by MgSiO3[s]
and % Mg2SiO4[s] or SiO2[s] depending on
latitude.
Limitations of these results arise from the confinement of our simulation to a limited computational domain. One might therefore wonder if other elements like Na, K, Mn, Cu, or Zn would change our results if the atmosphere would extent to lower pressures. Element abundance determination is an ever evolving topic, but also the newest literature confirms that Fe(7.47), Mg (7.59), Si (7.51), are considerably more abundant in the Sun than Na (6.21), Mn (5.42), K(5.04), Zn (4.56), or Cu (4.18) (Scott et al. 2015b; Grevesse et al. 2015; Scott et al. 2015a) but considerably less than oxygen. Hence, if we use the Sun as a reference, all less abundant elements can only contribute to the cloud particle growth with a very small fraction. The growth of TiO2[s] is such an example. While TiO2 is very important as nucleation seed, it plays a very minor role for the cloud particle sizes or the material composition. We are therefore confident that the number of elements will not alter the cloud particle sizes nor their material composition substantially.
9 Conclusion
The results of present global circulation models, coupled with a non-equilibrium cloud formation model, suggest that HD 189 733b and HD 209 458b are covered with mineral clouds throughout the entire modelling domain. Both giant gas planets, HD 189 733b and HD 209 458b, have similarly chemically complex mineral clouds. Their cloud particles are a mix that is dominated by Si/Fe/Mg/Al-O silicates and oxides, and the relative abundance of these materials changes depending on the local thermodynamic properties. Independent of longitude and latitude, a strong height-dependence of the cloud particle material composition and their mean size occur in both planets. The cloud material composition in the upper and intermediate cloud layers is generally more rich in HD 189 733b than in HD 209 458b meaning more materials contribute to each cloud particle. HD 209 458b generally has a small-grain cloud part region of several pressure magnitudes (cloud top) with a sharp growth zone leading to big mixed grains (m) with an iron content of % at the cloud base. The cloud particles in HD 189 733b grow to a maximum size of m and are made of 90% Fe[s] and 10% TiO2[s] at the cloud base. If only the terminators were used to compare the atmospheric structure of HD 189 733b and HD 209 458b, one would conclude that they should be similar as their (T, p) structures are rather similar at these points, and so is the material composition of the cloud particles. A more global view, however, suggests a more differentiated picture.
The chemical diversity of the cloud particles is imprinted into the remaining element abundances which is also strongly height-dependent. Both, the C/O ratio and the metallicity depend on the cloud formation efficiency and can therefore not be treated as independent from any of the cloud parameters as it is commonly assumed in retrieval methods. It remains an illusion to attribute one C/O ratio value to any particular cloud forming planet.
The individual cloud results for HD 189 733b and HD 209 458b allow to understand the difference in the detected molecular water on HD 209 458b: The H2O content at 0.1 bars is higher on HD189 733b then in HD209 458b Hydrocarbon and cyanopolyyne molecules can be rather abundant in the inner, dense part of the atmospheres of HD 189 733b and HD 209 458b but non-equilibrium processes will need to be studied to see if these molecules could reach an observational abundance also in the upper part of the atmosphere. The presence of large hydrocarbon molecules is not to be confused with the formation of hydrocarbon clusters which then could be interpreted as hydrocarbon hazes.
In conclusion, we have demonstrated that only a detailed modelling of the cloud formation processes allows to disentangle the cloud parameter degeneracy that is an artificial result from retrieval methods by their assumption of the independence of parameters.
Acknowledgments
We highlight financial support of the European Community under the FP7 by the ERC starting grant 257431 and by an ERC advanced grant 247060. JK acknowledges the Rosen fellowship from the Brooklyn College New York, US. Some of the calculations for this paper were performed on the DIRAC Facility jointly funded by STFC, the Large Facilities Capital Fund of BIS, and the University of Exeter.
References
- Ackerman & Marley (2001) Ackerman, A. S. & Marley, M. S. 2001, ApJ, 556, 872
- Agúndez et al. (2014) Agúndez, M., Parmentier, V., Venot, O., Hersant, F., & Selsis, F. 2014, A&A, 564, A73
- Agúndez et al. (2012) Agúndez, M., Venot, O., Iro, N., et al. 2012, A&A, 548, A73
- Amarsi et al. (2015) Amarsi, A. M., Asplund, M., Collet, R., & Leenaarts, J. 2015, MNRAS, 454, L11
- Amundsen (2015) Amundsen, D. S. 2015, PhD thesis, University of Exeter
- Amundsen et al. (2014) Amundsen, D. S., Baraffe, I., Tremblin, P., et al. 2014, A&A, 564, A59
- Anders & Grevesse (1989) Anders, E. & Grevesse, N. 1989, GCA, 53, 197
- Barstow et al. (2014) Barstow, J. K., Aigrain, S., Irwin, P. G. J., et al. 2014, ApJ, 786, 154
- Benneke (2015) Benneke, B. 2015, ArXiv e-prints [arXiv[arXiv]1504.07655]
- Bilger et al. (2013) Bilger, C., Rimmer, P., & Helling, C. 2013, MNRAS, 435, 1888
- Birkby et al. (2013) Birkby, J. L., de Kok, R. J., Brogi, M., et al. 2013, MNRAS, 436, L35
- Boisse et al. (2009) Boisse, I., Moutou, C., Vidal-Madjar, A., et al. 2009, A&A, 495, 959
- Bourrier & Lecavelier des Etangs (2013) Bourrier, V. & Lecavelier des Etangs, A. 2013, A&A, 557, A124
- Boyajian et al. (2015) Boyajian, T., von Braun, K., Feiden, G. A., et al. 2015, MNRAS, 447, 846
- Burrows et al. (2008) Burrows, A., Ibgui, L., & Hubeny, I. 2008, ApJ, 682, 1277
- Cauley et al. (2015) Cauley, P. W., Redfield, S., Jensen, A. G., et al. 2015, ApJ, 810, 13
- Charnay et al. (2015) Charnay, B., Meadows, V., Misra, A., Leconte, J., & Arney, G. 2015, ArXiv e-prints [arXiv[arXiv]1510.01706]
- Crouzet et al. (2014) Crouzet, N., McCullough, P. R., Deming, D., & Madhusudhan, N. 2014, ApJ, 795, 166
- de Kok et al. (2013) de Kok, R. J., Brogi, M., Snellen, I. A. G., et al. 2013, A&A, 554, A82
- de Kok et al. (2011) de Kok, R. J., Helling, C., Stam, D. M., Woitke, P., & Witte, S. 2011, A&A, 531, A67
- Deming et al. (2013) Deming, D., Wilkins, A., McCullough, P., et al. 2013, ApJ, 774, 95
- Désert et al. (2009) Désert, J.-M., Lecavelier des Etangs, A., Hébrard, G., et al. 2009, ApJ, 699, 478
- Désert et al. (2008) Désert, J.-M., Vidal-Madjar, A., Lecavelier Des Etangs, A., et al. 2008, A&A, 492, 585
- Diamond-Lowe et al. (2014) Diamond-Lowe, H., Stevenson, K. B., Bean, J. L., Line, M. R., & Fortney, J. J. 2014, ApJ, 796, 66
- Dobbs-Dixon & Agol (2013) Dobbs-Dixon, I. & Agol, E. 2013, MNRAS, 435, 3159
- Evans et al. (2015) Evans, T. M., Aigrain, S., Gibson, N., et al. 2015, MNRAS, 451, 680
- Evans et al. (2013) Evans, T. M., Pont, F., Sing, D. K., et al. 2013, The Astrophysical Journal Letters, 772, L16
- Fortney et al. (2008) Fortney, J. J., Lodders, K., Marley, M. S., & Freedman, R. S. 2008, ApJ, 678, 1419
- Gibson et al. (2012) Gibson, N. P., Aigrain, S., Pont, F., et al. 2012, MNRAS, 422, 753
- Goumans & Bromley (2012) Goumans, T. P. M. & Bromley, S. T. 2012, MNRAS, 420, 3344
- Grevesse et al. (2007) Grevesse, N., Asplund, M., & Sauval, A. J. 2007, Space Science Reviews, 130, 105
- Grevesse et al. (2015) Grevesse, N., Scott, P., Asplund, M., & Sauval, A. J. 2015, A&A, 573, A27
- Grillmair et al. (2008) Grillmair, C. J., Burrows, A., Charbonneau, D., et al. 2008, Nature, 456, 767
- Guillot (2010) Guillot, T. 2010, A&A, 520, A27
- Helling & Casewell (2014) Helling, C. & Casewell, S. 2014, arXiv, 22, 80
- Helling & Fomins (2013) Helling, C. & Fomins, A. 2013, Philosophical Transactions of the Royal Society of London Series A, 371, 10581
- Helling et al. (1996) Helling, C., Jørgensen, U. G., Plez, B., & Johnson, H. R. 1996, A&A, 315, 194
- Helling et al. (2000) Helling, C., Winters, J. M., & Sedlmayr, E. 2000, A&A, 358, 651
- Helling & Woitke (2006) Helling, C. & Woitke, P. 2006, A&A, 455, 325
- Helling et al. (2014) Helling, C., Woitke, P., Rimmer, P. B., et al. 2014, Life, 4, 142
- Helling et al. (2008) Helling, C., Woitke, P., & Thi, W.-F. 2008, A&A, 485, 547
- Hoeijmakers et al. (2015) Hoeijmakers, H. J., de Kok, R. J., Snellen, I. A. G., et al. 2015, A&A, 575, A20
- Hood et al. (2008) Hood, B., Wood, K., Seager, S., & Collier Cameron, A. 2008, MNRAS, 389, 257
- Jeong et al. (2000) Jeong, K. S., Chang, C., Sedlmayr, E., & Sülzle, D. 2000, Journal of Physics B Atomic Molecular Physics, 33, 3417
- Knutson et al. (2012) Knutson, H. A., Lewis, N., Fortney, J. J., et al. 2012, ApJ, 754, 22
- Koskinen et al. (2013) Koskinen, T. T., Yelle, R. V., Harris, M. J., & Lavvas, P. 2013, Icarus, 226, 1695
- Lecavelier des Etangs et al. (2012) Lecavelier des Etangs, A., Bourrier, V., Wheatley, P. J., et al. 2012, A&A, 543, L4
- Lecavelier Des Etangs et al. (2010) Lecavelier Des Etangs, A., Ehrenreich, D., Vidal-Madjar, A., et al. 2010, A&A, 514, A72
- Lecavelier Des Etangs et al. (2008) Lecavelier Des Etangs, A., Pont, F., Vidal-Madjar, A., & Sing, D. 2008, A&A, 481, L83
- Lee et al. (2015a) Lee, G., Helling, C., Dobbs-Dixon, I., & Juncher, D. 2015a, ArXiv e-prints [arXiv[arXiv]1505.06576]
- Lee et al. (2015b) Lee, G., Helling, C., Giles, H., & Bromley, S. T. 2015b, A&A, 575, A11
- Lee et al. (2014) Lee, J.-M., Irwin, P. G. J., Fletcher, L. N., Heng, K., & Barstow, J. K. 2014, ApJ, 789, 14
- Llama & Shkolnik (2015) Llama, J. & Shkolnik, E. L. 2015, ApJ, 802, 41
- Llama et al. (2013) Llama, J., Vidotto, A. A., Jardine, M., et al. 2013, MNRAS, 436, 2179
- Louden & Wheatley (2015) Louden, T. & Wheatley, P. J. 2015, ArXiv e-prints [arXiv[arXiv]1511.03689]
- Madhusudhan (2012) Madhusudhan, N. 2012, ApJ, 758, 36
- Marley & Robinson (2015) Marley, M. S. & Robinson, T. D. 2015, ARA&A, 53, 279
- Mayne et al. (2014a) Mayne, N. J., Baraffe, I., Acreman, D. M., et al. 2014a, A&A, 561, A1
- Mayne et al. (2014b) Mayne, N. J., Baraffe, I., Acreman, D. M., et al. 2014b, A&A, 561, A1
- Mayne et al. (2014c) Mayne, N. J., Baraffe, I., Acreman, D. M., et al. 2014c, Geoscientific Model Development, 7, 3059
- McCullough et al. (2014) McCullough, P. R., Crouzet, N., Deming, D., & Madhusudhan, N. 2014, ApJ, 791, 55
- Morley et al. (2015) Morley, C. V., Fortney, J. J., Marley, M. S., et al. 2015, ArXiv e-prints [arXiv[arXiv]1511.01492]
- Nikolov et al. (2015) Nikolov, N., Sing, D. K., Burrows, A. S., et al. 2015, MNRAS, 447, 463
- Parmentier et al. (2013) Parmentier, V., Showman, A. P., & Lian, Y. 2013, A&A, 558, A91
- Plane (2013) Plane, J. M. C. 2013, Philosophical Transactions of the Royal Society of London Series A, 371, 20335
- Pont et al. (2013) Pont, F., Sing, D. K., Gibson, N. P., et al. 2013, MNRAS, 432, 2917
- Poppenhaeger et al. (2013) Poppenhaeger, K., Schmitt, J. H. M. M., & Wolk, S. J. 2013, ApJ, 773, 62
- Rimmer & Helling (2015) Rimmer, P. B. & Helling, C. 2015, ArXiv e-prints [arXiv[arXiv]1510.07052]
- Rodler et al. (2013) Rodler, F., Kürster, M., & Barnes, J. R. 2013, MNRAS, 432, 1980
- Rowe et al. (2006) Rowe, J. F., Matthews, J. M., Seager, S., et al. 2006, ApJ, 646, 1241
- Rowe et al. (2008) Rowe, J. F., Matthews, J. M., Seager, S., et al. 2008, ApJ, 689, 1345
- Schwarz et al. (2015) Schwarz, H., Brogi, M., de Kok, R., Birkby, J., & Snellen, I. 2015, A&A, 576, A111
- Scott et al. (2015a) Scott, P., Asplund, M., Grevesse, N., Bergemann, M., & Sauval, A. J. 2015a, A&A, 573, A26
- Scott et al. (2015b) Scott, P., Grevesse, N., Asplund, M., et al. 2015b, A&A, 573, A25
- Showman et al. (2008) Showman, A. P., Cooper, C. S., Fortney, J. J., & Marley, M. S. 2008, ApJ, 682, 559
- Showman et al. (2009a) Showman, A. P., Fortney, J. J., Lian, Y., et al. 2009a, ApJ, 699, 564
- Showman et al. (2009b) Showman, A. P., Fortney, J. J., Lian, Y., et al. 2009b, ApJ, 699, 564
- Showman & Polvani (2011) Showman, A. P. & Polvani, L. M. 2011, ApJ, 738, 71
- Sing et al. (2016) Sing, D. K., Fortney, J. J., Nikolov, N., et al. 2016, Nature, 529, 59
- Southworth (2010) Southworth, J. 2010, MNRAS, 408, 1689
- Swain et al. (2014) Swain, M. R., Line, M. R., & Deroo, P. 2014, ApJ, 784, 133
- Todorov et al. (2014) Todorov, K. O., Deming, D., Burrows, A., & Grillmair, C. J. 2014, ApJ, 796, 100
- Torres et al. (2008) Torres, G., Winn, J. N., & Holman, M. J. 2008, The Astrophysical Journal, 677, 1324
- Triaud et al. (2010) Triaud, A. H. M. J., Collier Cameron, A., Queloz, D., et al. 2010, å, 524, A25
- Tsai et al. (2014) Tsai, S.-M., Dobbs-Dixon, I., & Gu, P.-G. 2014, ApJ, 793, 141
- Vidal-Madjar et al. (2004) Vidal-Madjar, A., Désert, J.-M., Lecavelier des Etangs, A., et al. 2004, ApJL, 604, L69
- Vidal-Madjar et al. (2013) Vidal-Madjar, A., Huitson, C. M., Bourrier, V., et al. 2013, A&A, 560, A54
- Vidal-Madjar et al. (2003) Vidal-Madjar, A., Lecavelier des Etangs, A., Désert, J.-M., et al. 2003, Nature, 422, 143
- Wakeford & Sing (2015) Wakeford, H. R. & Sing, D. K. 2015, A&A, 573, A122
- Wang & Ford (2011) Wang, J. & Ford, E. B. 2011, Monthly Notices of the Royal Astronomical Society, 418, 1822
- Woitke & Helling (2003) Woitke, P. & Helling, C. 2003, A&A, 399, 297
- Woitke & Helling (2004) Woitke, P. & Helling, C. 2004, A&A, 414, 335
- Wyttenbach et al. (2015) Wyttenbach, A., Ehrenreich, D., Lovis, C., Udry, S., & Pepe, F. 2015, A&A, 577, A62
- Zellem et al. (2014) Zellem, R. T., Lewis, N. K., Knutson, H. A., et al. 2014, ApJ, 790, 53
Appendix A Cloud property for HD 189 733b and HD 209 458b
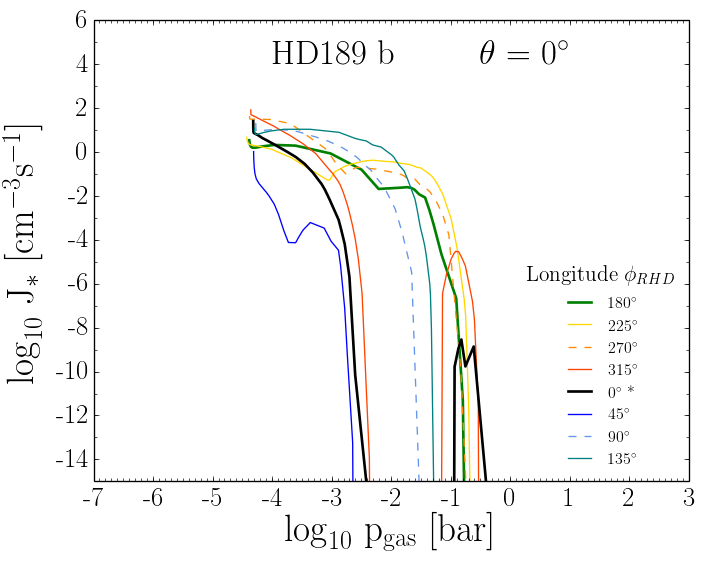
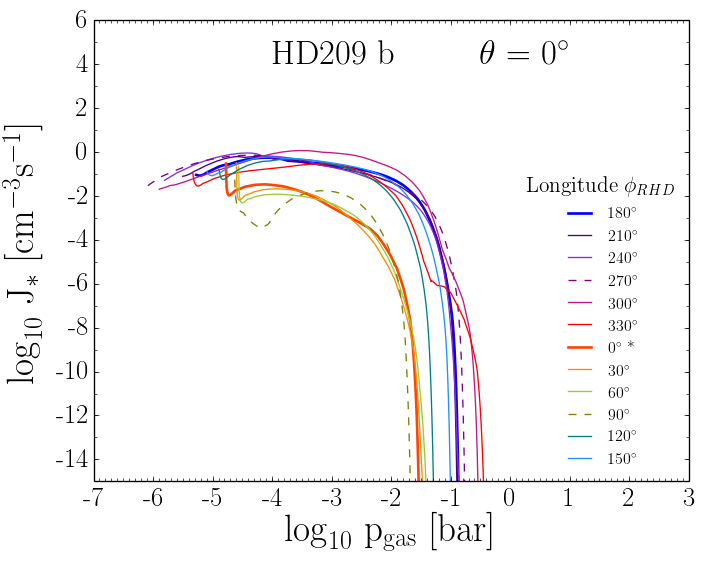

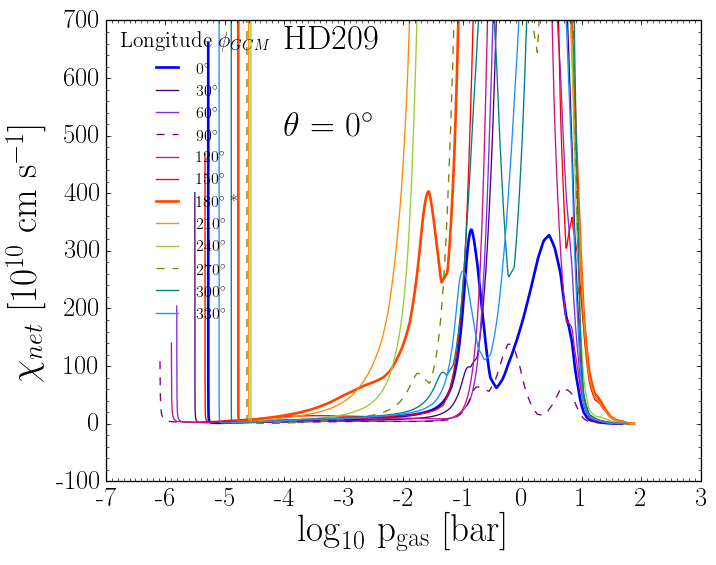
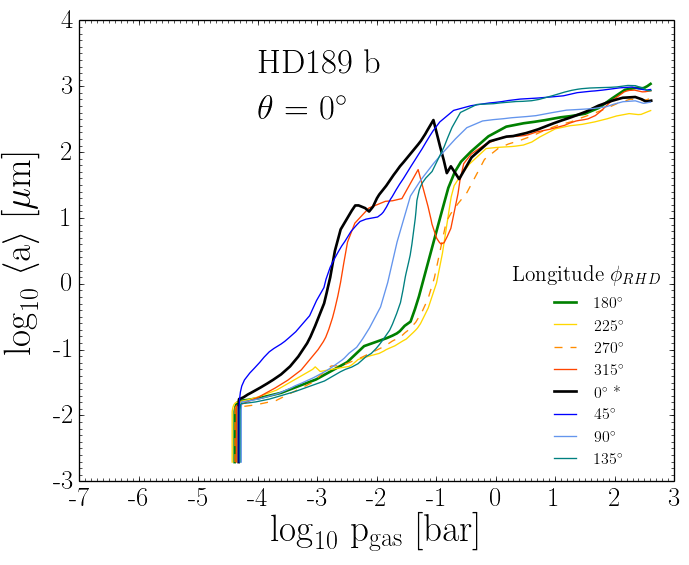
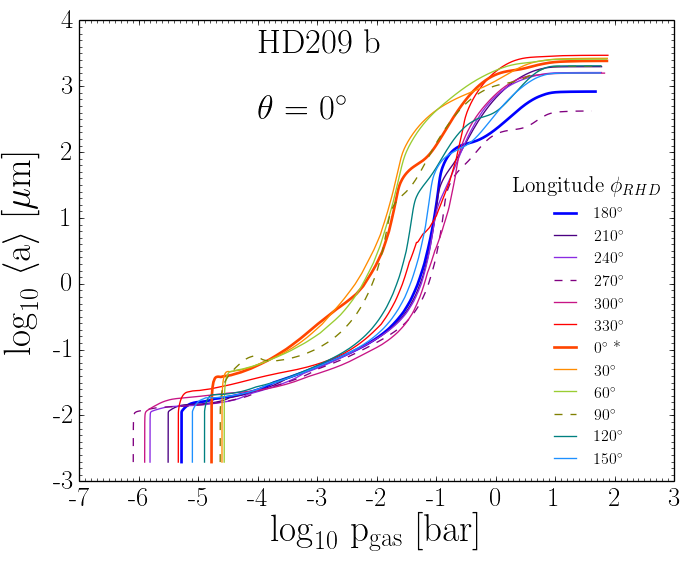
A.1 Equilibrium gas-phase abundance
The equilibrium gas-abundance of the most dominating gas-species at the terminator points for HD189 733b (Fig. 21) and for HD209 458b (Fig. 22) as complementary material to the results shown in the main text for the substellar points only.
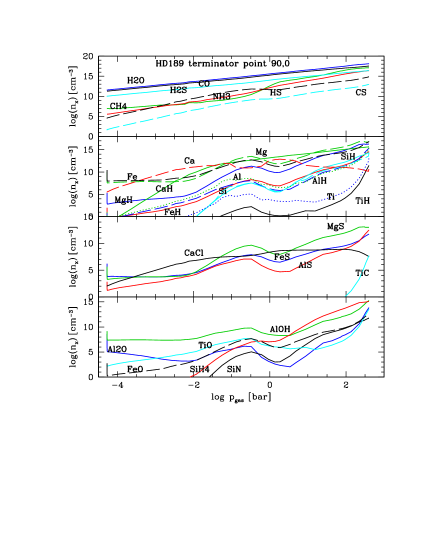 |
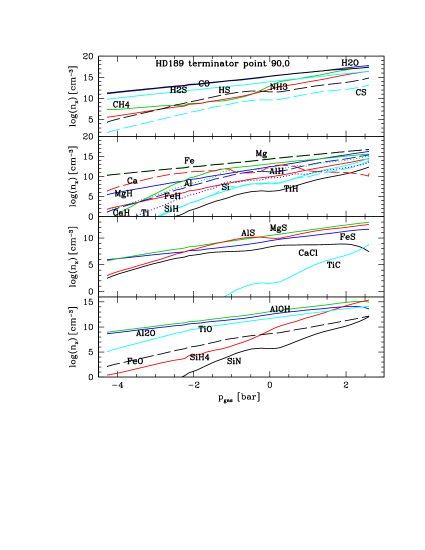 |
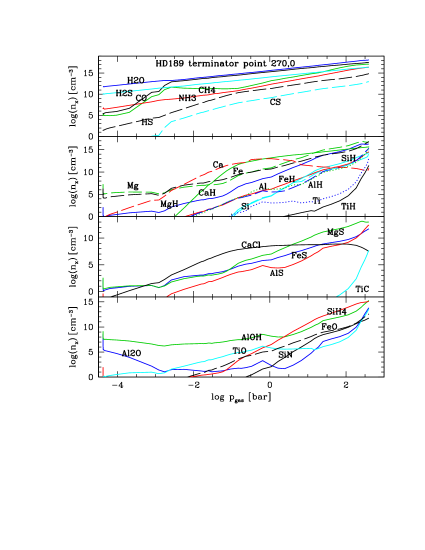 |
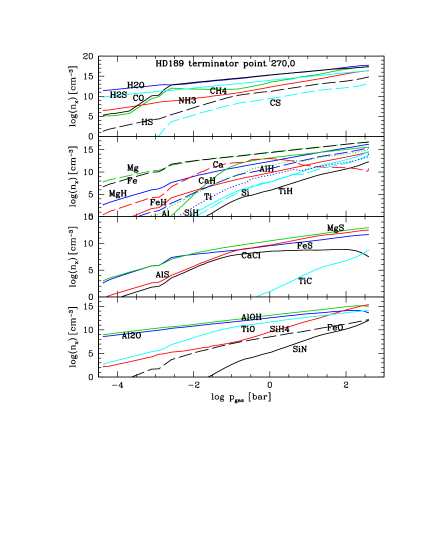 |
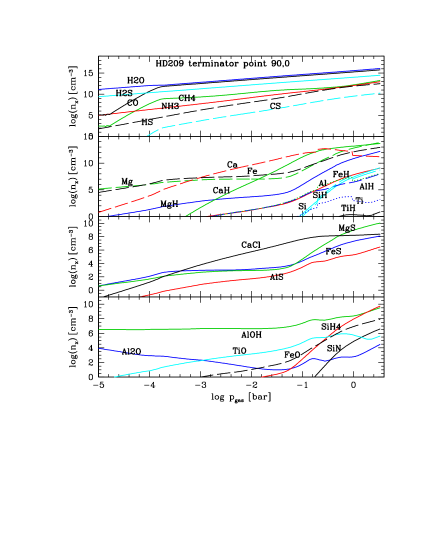 |
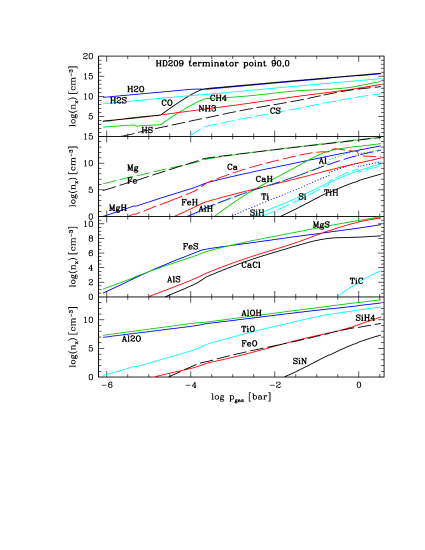 |
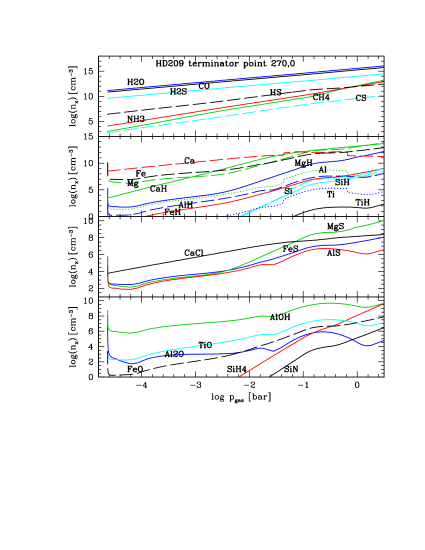 |
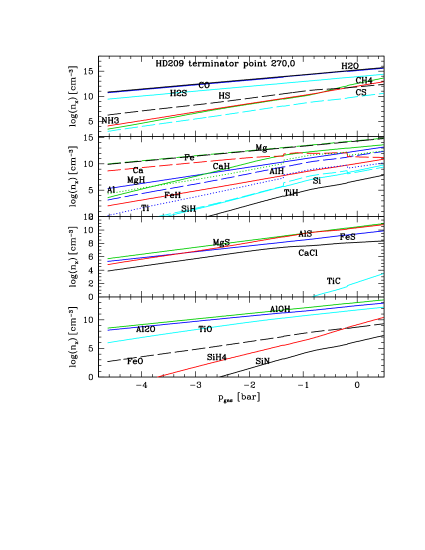 |
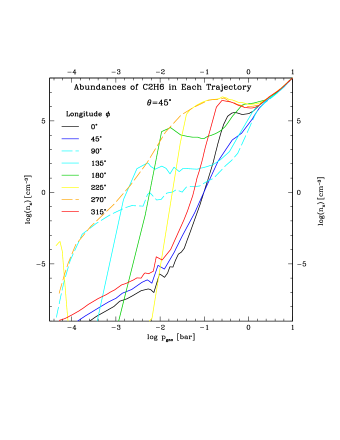 |
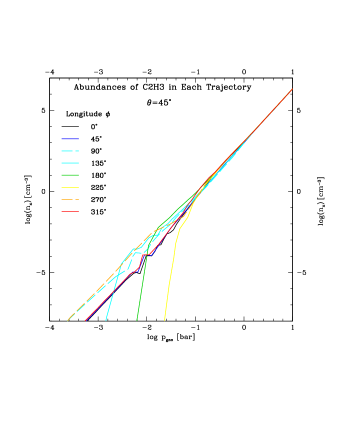 |
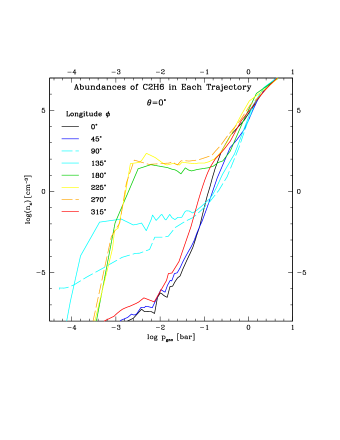 |
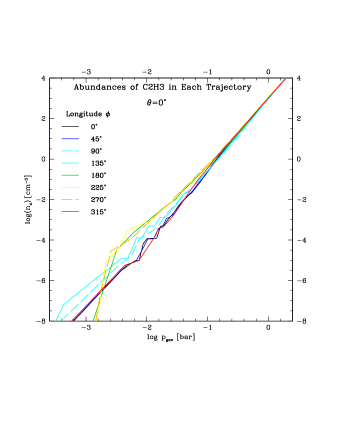 |
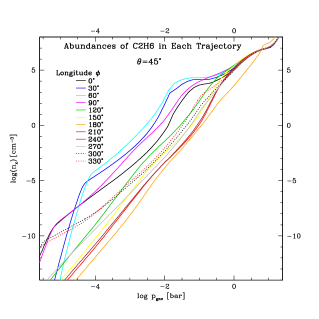 |
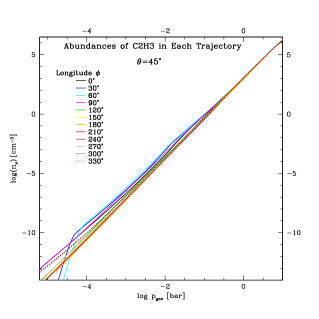 |
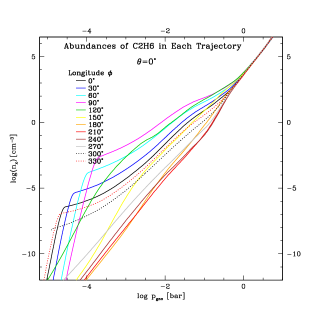 |
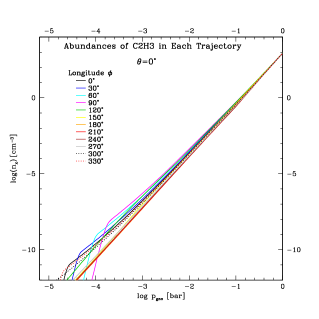 [-0.5cm] [-0.5cm]
|
A.2 Cloud absorption, scattering and extinction
The break-down of the contribution of cloud absorption and cloud scattering to the total cloud extinction at the terminator points for HD189 733b (Fig. 25) and for HD209 458b as complementary material to the results shown in the main text in form of 2D-tables for the total extinction sampled across the globe (Figs. 16, 17).
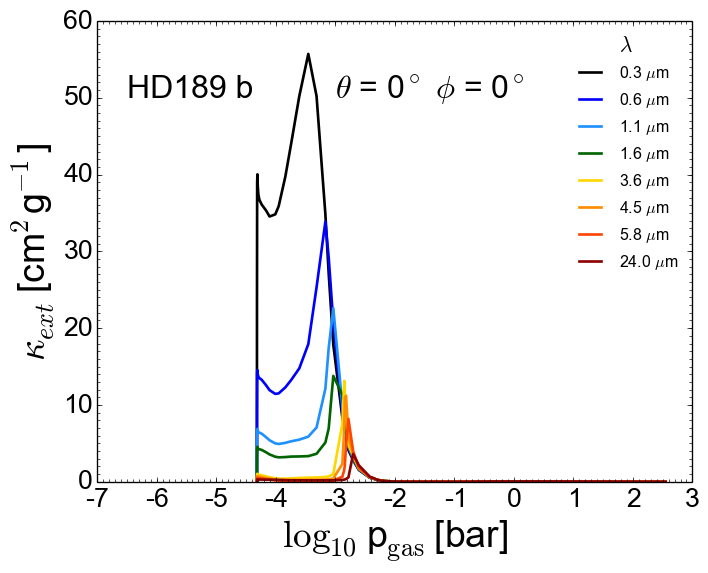 |
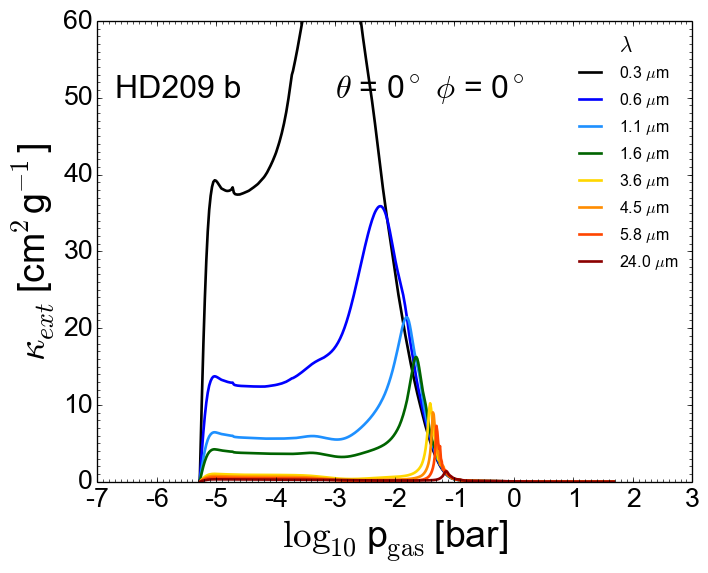 |
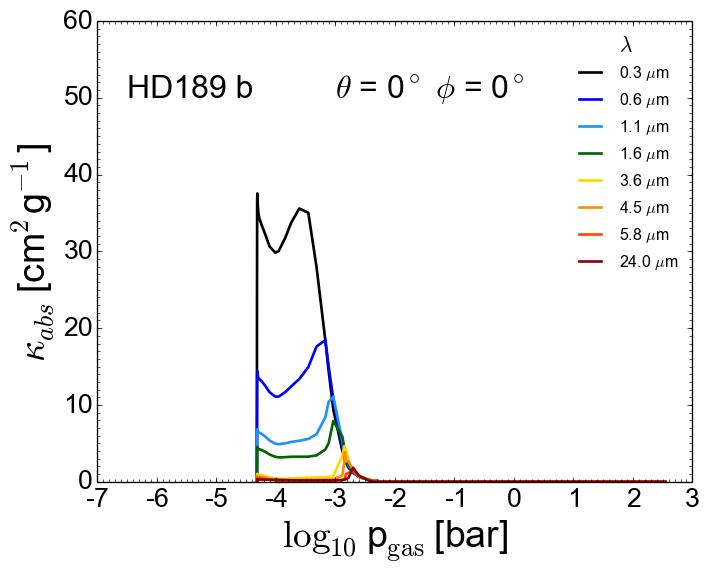 |
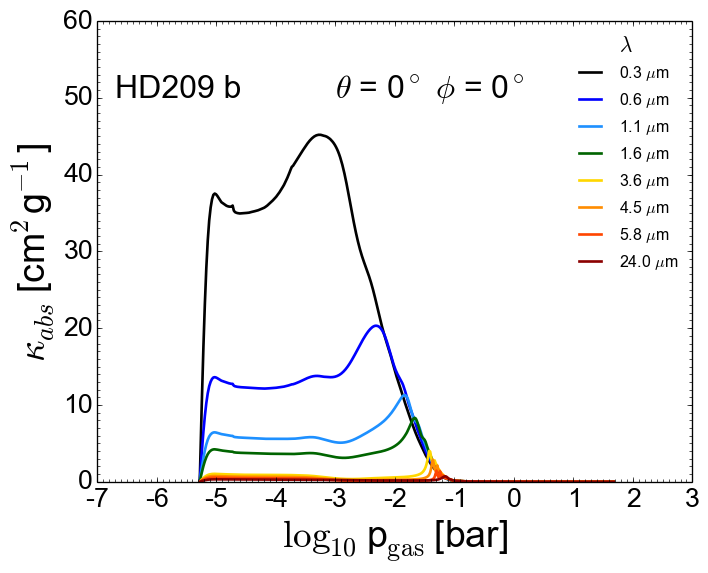 |
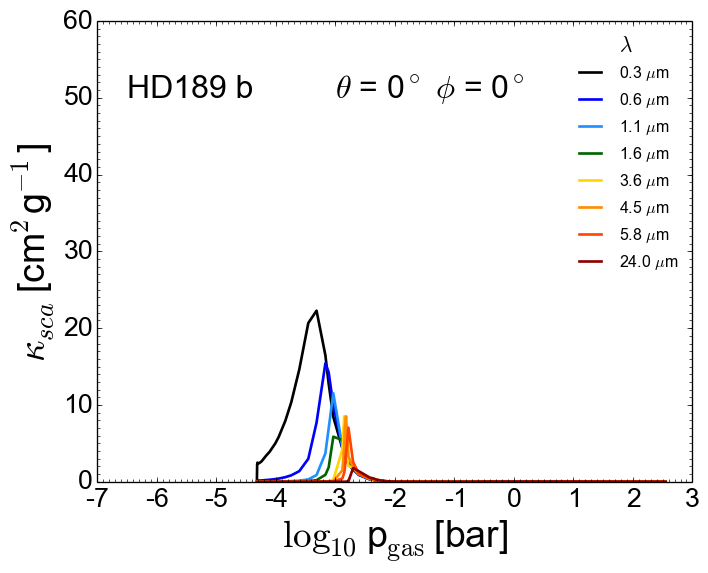 |
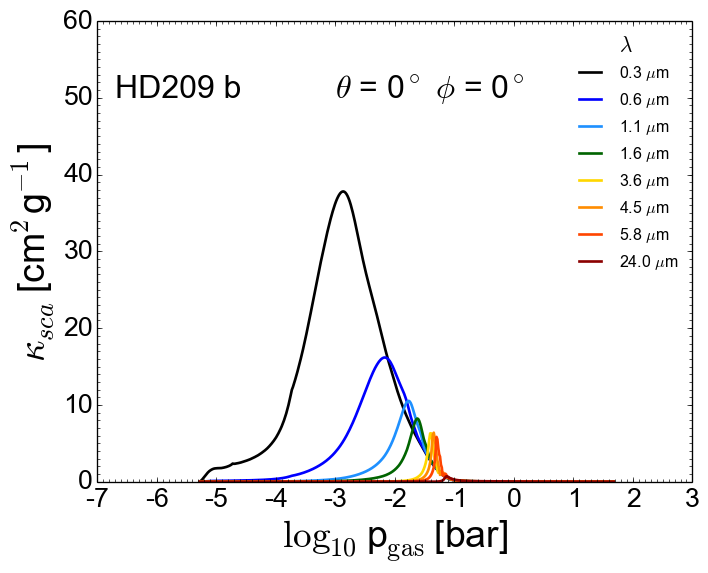 |
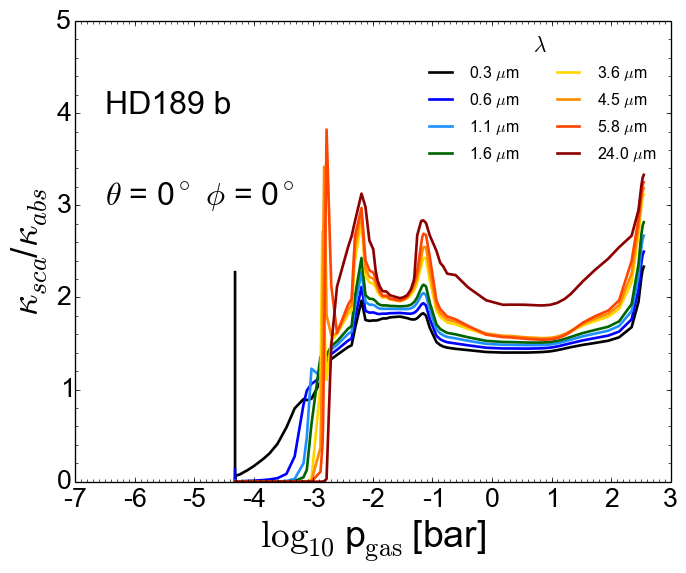 |
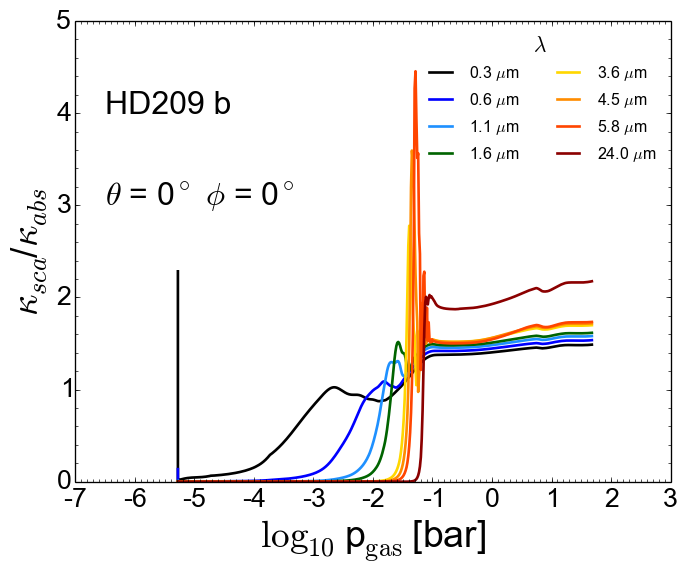 |
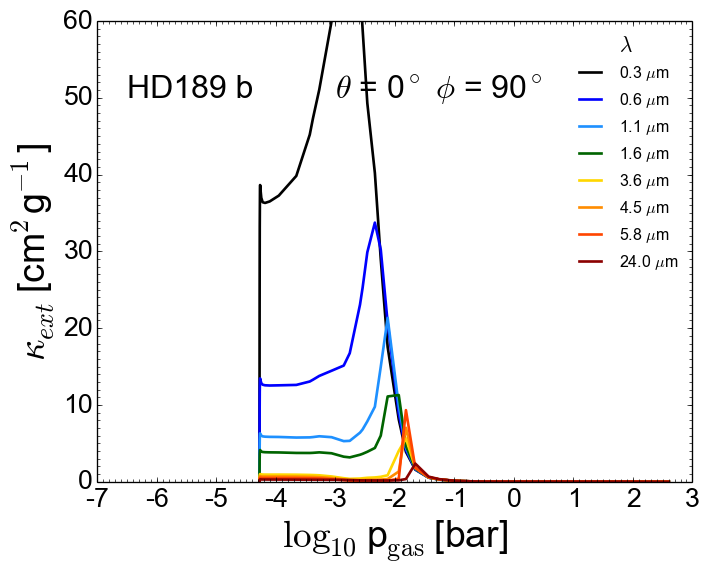 |
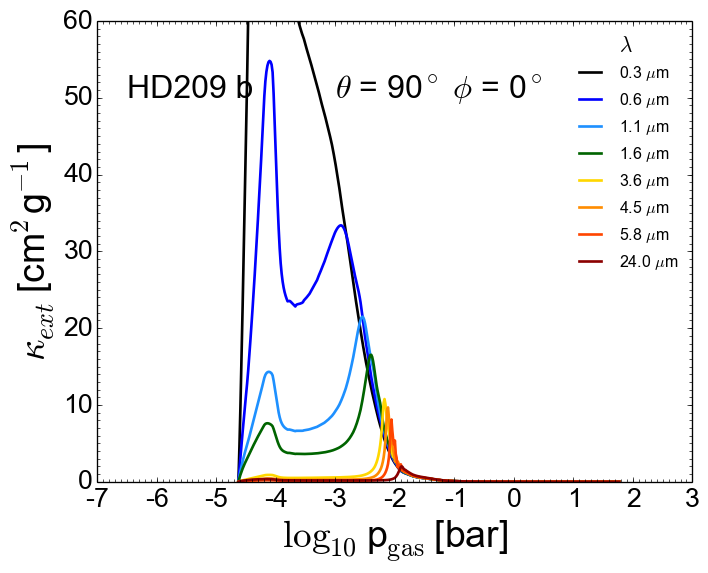 |
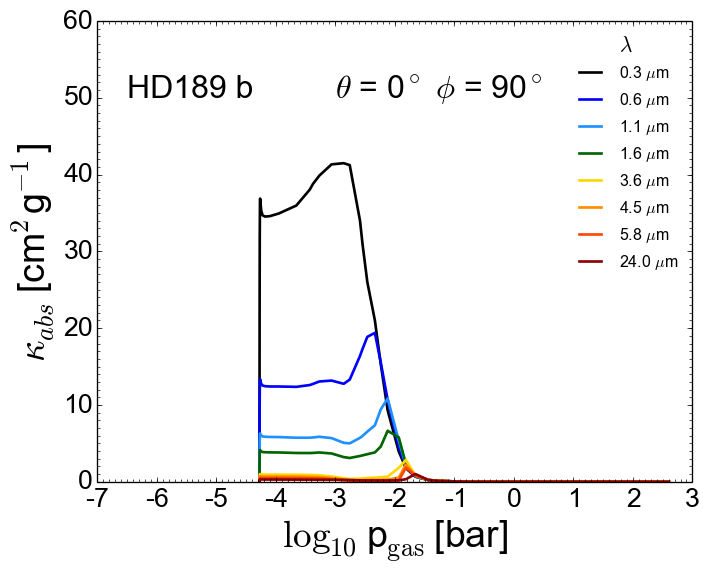 |
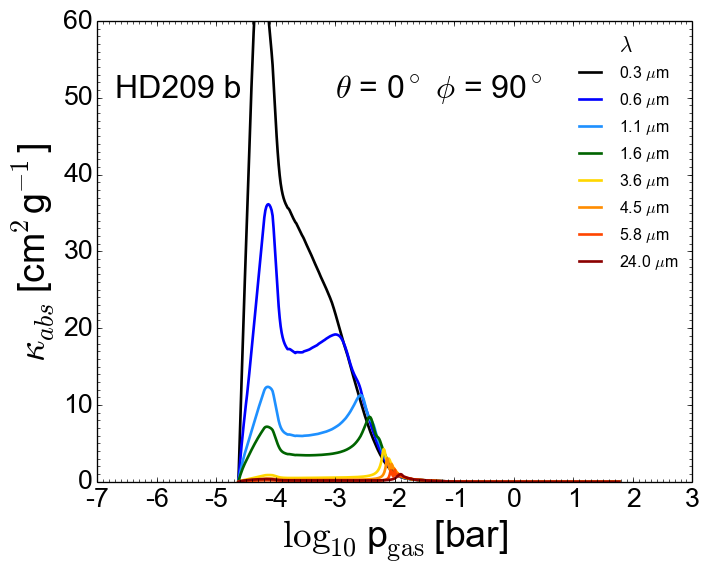 |
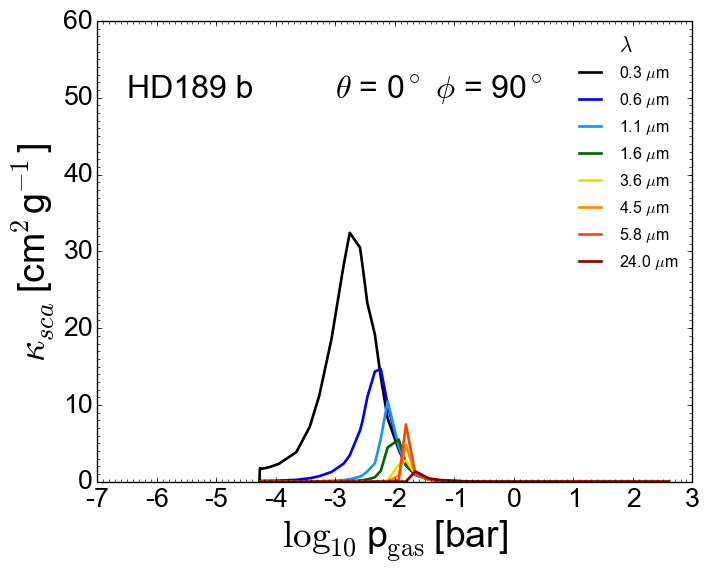 |
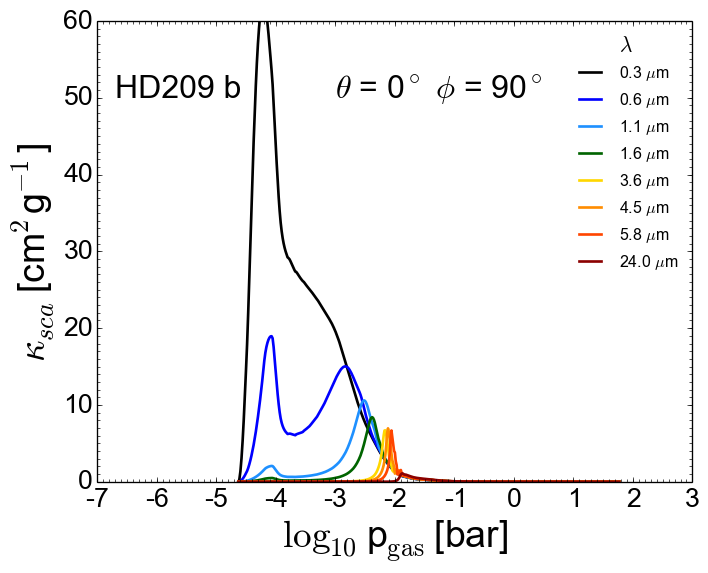 |
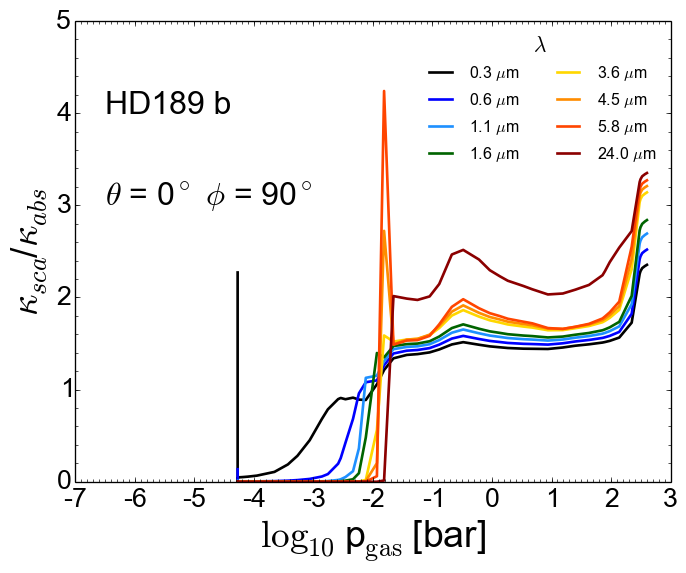 |
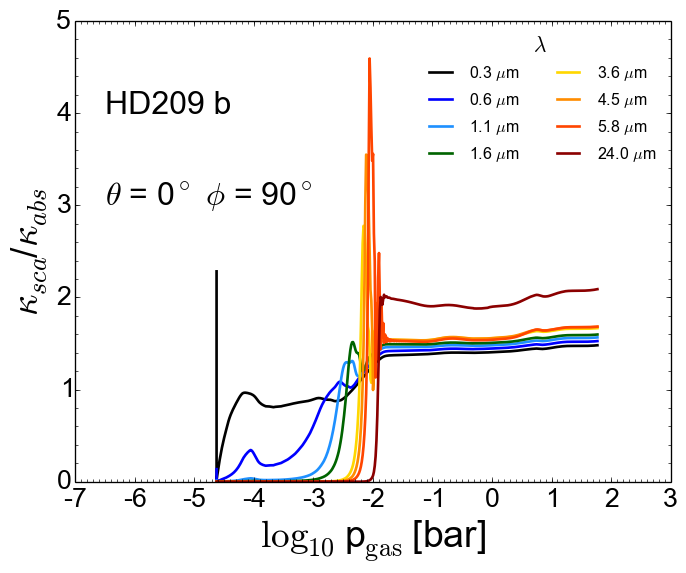 |