A distance constrained synaptic plasticity model of C. elegans neuronal network
Abstract
Brain research has been driven by enquiry for principles of brain structure organization and its control mechanisms. The neuronal wiring map of C. elegans, the only complete connectome available till date, presents an incredible opportunity to learn basic governing principles that drive structure and function of its neuronal architecture. Despite its apparently simple nervous system, C. elegans is known to possess complex functions. The nervous system forms an important underlying framework which specifies phenotypic features associated to sensation, movement, conditioning and memory. In this study, with the help of graph theoretical models, we investigated the C. elegans neuronal network to identify network features that are critical for its control. The ‘driver neurons’ are associated with important biological functions such as reproduction, signalling processes and anatomical structural development. We created 1D and 2D network models of C. elegans neuronal system to probe the role of features that confer controllability and small world nature. The simple 1D ring model is critically poised for the number of feed forward motifs, neuronal clustering and characteristic path-length in response to synaptic rewiring, indicating optimal rewiring. Using empirically observed distance constraint in the neuronal network as a guiding principle, we created a distance constrained synaptic plasticity model that simultaneously explains small world nature, saturation of feed forward motifs as well as observed number of driver neurons. The distance constrained model suggests optimum long distance synaptic connections as a key feature specifying control of the network.
I Introduction
The quest for understanding broad structural organization, functional building blocks and mechanisms of control of nervous systems has been central to neuroscience Kandel et al. (2000). Vast knowledge of cellular and molecular mechanisms garnered through reductionist studies over decades, while enriching our understanding of brain mechanisms, have highlighted the need for holistic perspective of neural architecture Sporns (2011). This urge to delve into systems properties has propelled efforts into connectome projects that attempt to map and model neural wirings to the finest detail possible White et al. (1986); Chiang et al. (2011); Sporns (2013); Zingg et al. (2014). C. elegans connectome is the only complete neuronal wiring diagram available till date White et al. (1986); Chen et al. (2006); Towlson et al. (2013). Along with the rich understanding available on the biology of this model organism Altun et al. ; Howe et al. (2016), its connectome presents an opportunity to learn basic governing principles that drive structure and function of neuronal architecture.
Despite its apparently simple nervous system, C. elegans is known to possess complex functions associated to sensation, movement, conditioning and memory Chatterjee and Sinha (2008); Ardiel and Rankin (2010). This multi-cellular nematode has been extensively investigated to understand neural mechanisms involved in response to chemicals, temperature, mechanical stimulation as well as mating and egg laying behaviors Hobert (2003); Chatterjee and Sinha (2008). These biological functions have neuronal basis and are a reflection of emergent properties of signal dynamics over the network. Its nervous system has evolved to confer evolutionary benefits under constant tinkering and is known to undergo synaptic rewiring during the course of its life Kandel et al. (2014). Beyond the broad evolutionary architecture, synaptic plasticity offers additional adaptive advantage to respond to the environment and perhaps to achieve better functional efficiency. The key role of distance constraint in shaping the architecture of complex networks has been well studied and highlighted Amaral et al. (2000); Barthélemy (2011); Avena-Koenigsberger et al. (2015).
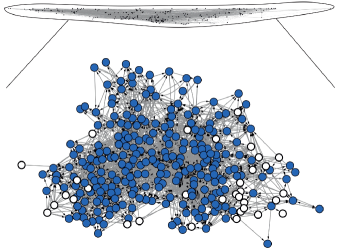
The C. elegans neuronal system could be modelled as a network and studied for structural properties of its neuronal architecture as well as for network dynamics (Figure 1). Graph theoretical studies provide important insights into evolutionary mechanisms of this system and enable biological inference. The C. elegans neuronal network (CeNN) has been mapped to a high resolution with details of its neurons, their locations and synaptic connectivity Yoonsuck Choe, BH McCormick (2004). The network, comprising of 277 neurons that are interlinked with 2105 synapses, has been studied for its broad structural features as well as towards identification of motifs that potentially contribute to the dynamics over the network. Using graph theoretical measures, CeNN has been observed to have a small world architecture with small path length and high clustering Watts and Strogatz (1998). One of the mechanisms by which interconnected systems acquire small world nature is by having modules densely connected with short-range connections, which are further interlinked through long-range connections Watts and Strogatz (1998). It has been proposed that such connectivity pattern may emerge due to processes that leave the network critically poised between absolute order and extreme randomness. The small world nature may render this neural network (as well as other neuronal systems) efficient for information dynamics. Such a topology is known to offer evolutionary advantage by optimized wiring in neuronal systems Chen et al. (2006); Ahn et al. (2006).
Networked systems are known to be built with recurring circuit modules that are central to their function Alon (2007). When probing for network sub-structures that could form the building block of the CeNN, Milo et al. identified feed forward motifs (FFMs) to be significantly over-represented Milo et al. (2002). FFMs have been suggested to be of functional relevance to biological systems such as transcriptional regulatory networks Mangan and Alon (2003); Balaji et al. (2007). One of the possible utilities ascribed to these structural building blocks is control of signal regulation in response to persistent input. How exactly such building blocks may offer functional advantage to neuronal networks and whether these entities have evolved to optimize the building blocks is not clearly understood yet.
Control systems approach to complex networks provides a better perspective of dynamics over the network and ability to steer its ‘state’ Liu et al. (2011). Neuronal architecture of CeNN forms an important underlying framework which specifies phenotypic features of C. elegans. Important behavioral traits as well as cognitive processes (such as movement, sensation, egg laying, mechanosensation, chemosensation and memory) are known to have neuronal basis. A network is said to be controllable if it can be reached to a desired state from any initial state by providing inputs to certain nodes Lin (1974); Liu et al. (2011). The set of nodes that facilitate such a control are named driver nodes Liu et al. (2011).
By studying genotypic and phenotypic aspects of CeNN, in our earlier study we have shown that ‘driver neurons’ are associated with important biological functions such as reproduction, signalling processes and anatomical structural development Badhwar and Bagler (2015). Going by their relevance to structural controllability, driver neurons are expected to be important in dictating the state of the network. In C. elegans driver neurons are primarily of short span and linked to motor activities Badhwar and Bagler (2015). Interestingly, randomized controls have no driver neurons as compared to CeNN which presents a sizeable number of driver neurons that are crucial for its control. While earlier studies have shown that connectivity of neurons in CeNN partially explains the observed number of driver neurons Liu et al. (2011), no model has so far been developed that accounts for its small world architecture, over-representation of FFMs as well as controllability.
In this study, we create one-dimensional (1D) and two-dimensional (2D) network models of C. elegans neuronal system to investigate the role of FFMs as building blocks in conferring controllability and small world nature. With the help of a simple 1D ring model we show such a network is critically poised for the number of FFMs, neuronal clustering and characteristic path-length in response to synaptic rewiring, indicating optimal rewiring. We found that synaptic connections between neurons are characterized with a strong distance constraint in CeNN. Using this as a guiding principle, we created a distance constrained synaptic plasticity model that simultaneously explains small world nature, FFM saturation and controllability of the network. This model could account for the number of driver neurons observed in CeNN. Moreover, the nodes that act as driver neurons in this model match with those obtained from empirical network with high accuracy. Thus the model highlights realistic process of distance constrained synaptic plasticity as a plausible basis of nature of functional sub-structures and controllability observed in CeNN.
II Materials and methods
II.1 C. elegans neuronal network
The nervous system of C. elegans consists of 277 neurons (barring the pharyngeal neurons) which are interconnected via electrical and chemical synapses White et al. (1986); Yoonsuck Choe, BH McCormick (2004). We constructed CeNN, a graph theoretic model of C. elegans neuronal network, comprising of 277 somatic neurons and 2105 synaptic connections. Multiple synaptic connections between two neurons were merged to yield a simple directed unweighted graph in which neurons represent nodes and synaptic connections are links. A typical neuron in CeNN on an average had synaptic connections.
II.2 Topological properties of CeNN
We calculated following graph theoretical properties of the network embodying clustering, compactness, structural motifs and controllability of the network.
II.2.1 Clustering coefficient
Clustering coefficient of a node is defined as ratio of number of triangles (triangle refers to a three node clique) made by a node with its neighbours to the maximum number of triangles that can be formed by them Watts and Strogatz (1998). For a graph the clustering coefficient of a node is defined as follows:
Here, refers to the neighbourhood of node and represents its connectivity (degree).
The average clustering coefficient () was calculated by averaging clustering coefficients of all nodes: .
II.2.2 Characteristic path-length
Characteristic path-length () enumerates compactness, reflecting ease of information transfer, of the network. It is defined as the average of shortest path-lengths among all pairs of nodes in the network.
II.2.3 Feed forward motifs
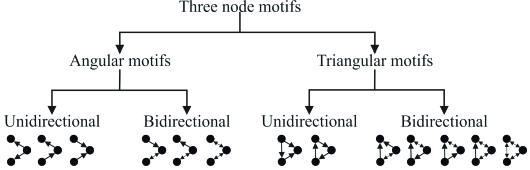
Network motifs are defined as patterns of interconnections occurring in complex networks at numbers that are significantly higher than those in randomized networks Milo et al. (2002). In a three node digraph different types of three node motifs can exist. Angular motifs are linear three node sub-structures, and triangular motifs comprise of three nodes inter-connected with either unidirectional or bidirectional edges. For our studies, we computed number of feed forward motifs, , (among unidirectional triangular motifs) that are prevalent in many real world networks including CeNN Milo et al. (2002); Alon (2007). Please see Section S1 (Figure S1 and Figure S2) of Supplementary Material for more details. We used the algorithm employed by Milo et al. for identification and enumeration of frequency of occurrence motifs Milo et al. (2002). The , indicating significance of observed number of FFMs in CeNN, was calculated by comparing it with random controls: .
II.2.4 Number of driver neurons
From control systems perspective, driver nodes in a network are those nodes which when controlled by an external input can provide full control over the state of the network Liu et al. (2011). Analogously, we term driver nodes in CeNN as driver neurons. Due to their role in control of network, driver neurons are of functional relevance to the neuronal network Badhwar and Bagler (2015). We computed minimum number of driver neurons using maximum matching criterion Liu et al. (2011). A node is said to be matching if any matching edge is pointing towards it and is unmatched if no matching edge is directed towards it. We implemented maximum matching algorithm proposed by Pothen et al. to find unique unmatched nodes by augment matching Pothen and Fan (1990).
II.3 Random controls of CeNN
We constructed two random controls of CeNN viz. Erdös-Rényi random control (ER) and degree distribution conserved control (DD) Erdös and Rényi (1959); Maslov and Sneppen (2002). In ER control, number of nodes and edges were kept the same as that of CeNN but the connectivity was random. In DD control, the in-degree and out-degree of each node was also preserved in addition to number of nodes and edges.
II.4 1D ring model of CeNN
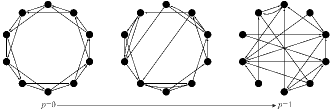
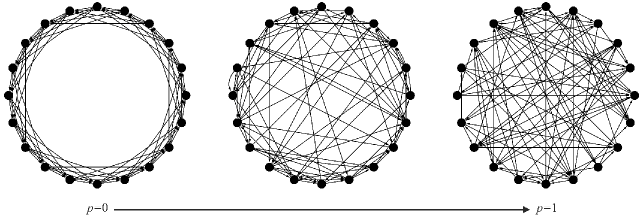
We constructed a ring graph model of CeNN so as to maximise the number of FFMs while preserving the number of neurons as well as average neuronal connectivity of CeNN (Figure 2). While the core idea and strategy implemented in this model is analogous to that of Watts and Strogatz’s Watts and Strogatz (1998), it is extended to represent directed edges (synapses), and hence naturally accommodates network motifs and controllability analysis. Starting with nodes arranged in a circular manner, every node was connected (in anti-clockwise sense) to its next nearest neighbour with a directed edge. The procedure was repeated to connect every node with its nearest neighbour and the next nearest neighbour until the out-degree of every node matched with that of average out-degree of CeNN . This strategy maximises the number of FFMs to in the regular graph model of CeNN and represents an asymptotic version saturated with FFMs.
To mimic random synaptic plasticity in this simple 1D model, we rewired every edge in this network with a certain ‘probability of rewiring ()’. Every out-going edge connecting a node to its nearest neighbour was chosen and rewired randomly with probability by ensuring that there were no duplicate edges or self-edges and that the network is always connected. In the second lap, the process was repeated for the edges made with next-nearest neighbours and so on. All edges are thus exhaustively considered for rewiring in laps. For every probability of rewiring instances of graphs were created for a range of to . Topological properties (, , and ) were computed for every instance of graph thus generated.
II.5 Distance constrained models of CeNN
We created 2D distance constrained models that, similar to distance constraint observed in CeNN, follow a restraint on synaptic connectivity based on distance between two neurons. These 2D models are based on positional data of C. elegans neurons, that have been mapped to a high resolution Yoonsuck Choe, BH McCormick (2004). In these models, the probability that two neurons at a distance are connected with a synapse approximately follows a power law pattern observed from empirical data:
The distance constraint is modulated by the exponent . Here, the distance between neurons and , , was calculated as the Euclidean distance: . The power law nature of neuronal connectivity was established following the recipe suggested by Clauset et al. Clauset et al. (2009).
We created two models of CeNN based on the distance constraint: Distance constrained random (DCR) and Distance constrained synaptic plasticity (DCP).
II.5.1 Distance constrained random (DCR) model
The underlying framework for DCR model is that of ER control. Starting with ER (random) control, we rewired every edge to impose distance constraint for specific exponent . Statistics of topological parameters were computed over 100 instances. Response of DCR model was observed by varying the value of exponent between .
II.5.2 Distance constrained synaptic plasticity (DCP) model
In contrast to DCR model, the underlying framework for DCP model is that of DD control which preserves the synaptic connectivity of each neuron. Starting with DD control, every edge was rewired to impose distance constraint for specific exponent () and statistics of topological parameters were computed over 100 instances.
II.6 Cartesian graph model of CeNN
The deterministic Cartesian graph model of CeNN was created by ensuring that every neuron is connected to its spatially nearest neurons. Beginning with 277 neurons placed at cartesian coordinates matching their observed position in the nervous system of C. elegans Yoonsuck Choe, BH McCormick (2004), every neuron was connected to 8 spatially nearest neurons. This model reflects preferential deterministic connections made by a neuron based on its distance from another neuron.
II.7 Identification of specific driver neurons
Using maximum matching algorithm Pothen and Fan (1990), the set of specific driver nodes was identified from both the empirical neuronal network as well as its computational models (DCR and DCP). The latter were compared against the former to assess the performance of models in achieving real-like topology and control structure. The success of DCR, DCP models in accurate identification of driver neurons was measured with the help of F1 score. Using the driver neurons set identified from the CeNN (34) as the basis (Details of driver neurons is provided in Table S3 of Supplementary Material), we identified true positives and true negatives (neurons that are correctly classified) as well as false positives and false negatives (neurons that were incorrectly marked as driver neurons, and neurons that were incorrectly marked as non-driver neurons, respectively) for DCR and DCP models across 100 instances. The score, which is used for computing the quality of binary classification is defined as, .
III Results
III.1 Topological properties of CeNN
Topological features of network provide insights into its structure and function Albert and Barabasi (2002); Dorogovtsev (2010). Consistent with previous reports, we observed that C. elegans neuronal network is a small world network by virtue of high clustering coefficient () and comparable characteristic path length (), with respect to its randomized counterpart ( and ) (Table 1) Watts and Strogatz (1998). Beyond these global topological features, CeNN is known to be over represented with feed forward motifs Milo et al. (2002) that are functionally associated with mechanisms of memory Mozzachiodi and Byrne (2010). We observed that, FFMs were significantly overrepresented in CeNN as compared to those in corresponding random graphs.
| CeNN | ER | DD | |
|---|---|---|---|
| 0.172 | 0.028 0.001 | 0.067 0.003 | |
| 4.018 | 2.97 0.01 | 2.981 0.018 | |
| 34 | 0.28 0.514 | 22.38 1.153 | |
| 3776 | 438.3 22.1 | 1699.6 57.5 |
From control systems perspective CeNN can be controlled through a small set of driver neurons (34) to any desired state in finite time Liu et al. (2011). The number of driver neurons in CeNN is significantly higher in comparison to its random counterpart. Driver neurons in CeNN are genotypically and phenotypically associated with biological functions such as reproduction and maintenance of cellular processes Badhwar and Bagler (2015). This alludes to the fact that driver neurons serve a critical role in the neuronal architecture of C. elegans and the number of driver neurons therefore has functional bearing on its control.
Table 1 depicts topological features of CeNN that are potentially critical for specifying its function. Other than the small world nature, evident from high clustering among neurons, the CeNN is characterized with significantly higher number of driver nodes as well as number of feed forward motifs. While connectivity (degree) of neurons (DD) partially explains the increase in FFMs as well as that in , at the same time it cannot account for observed clustering. No comprehensive model that can explain all of these functionally relevant features is hitherto known.
III.2 1D ring model of CeNN
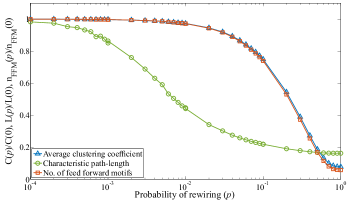
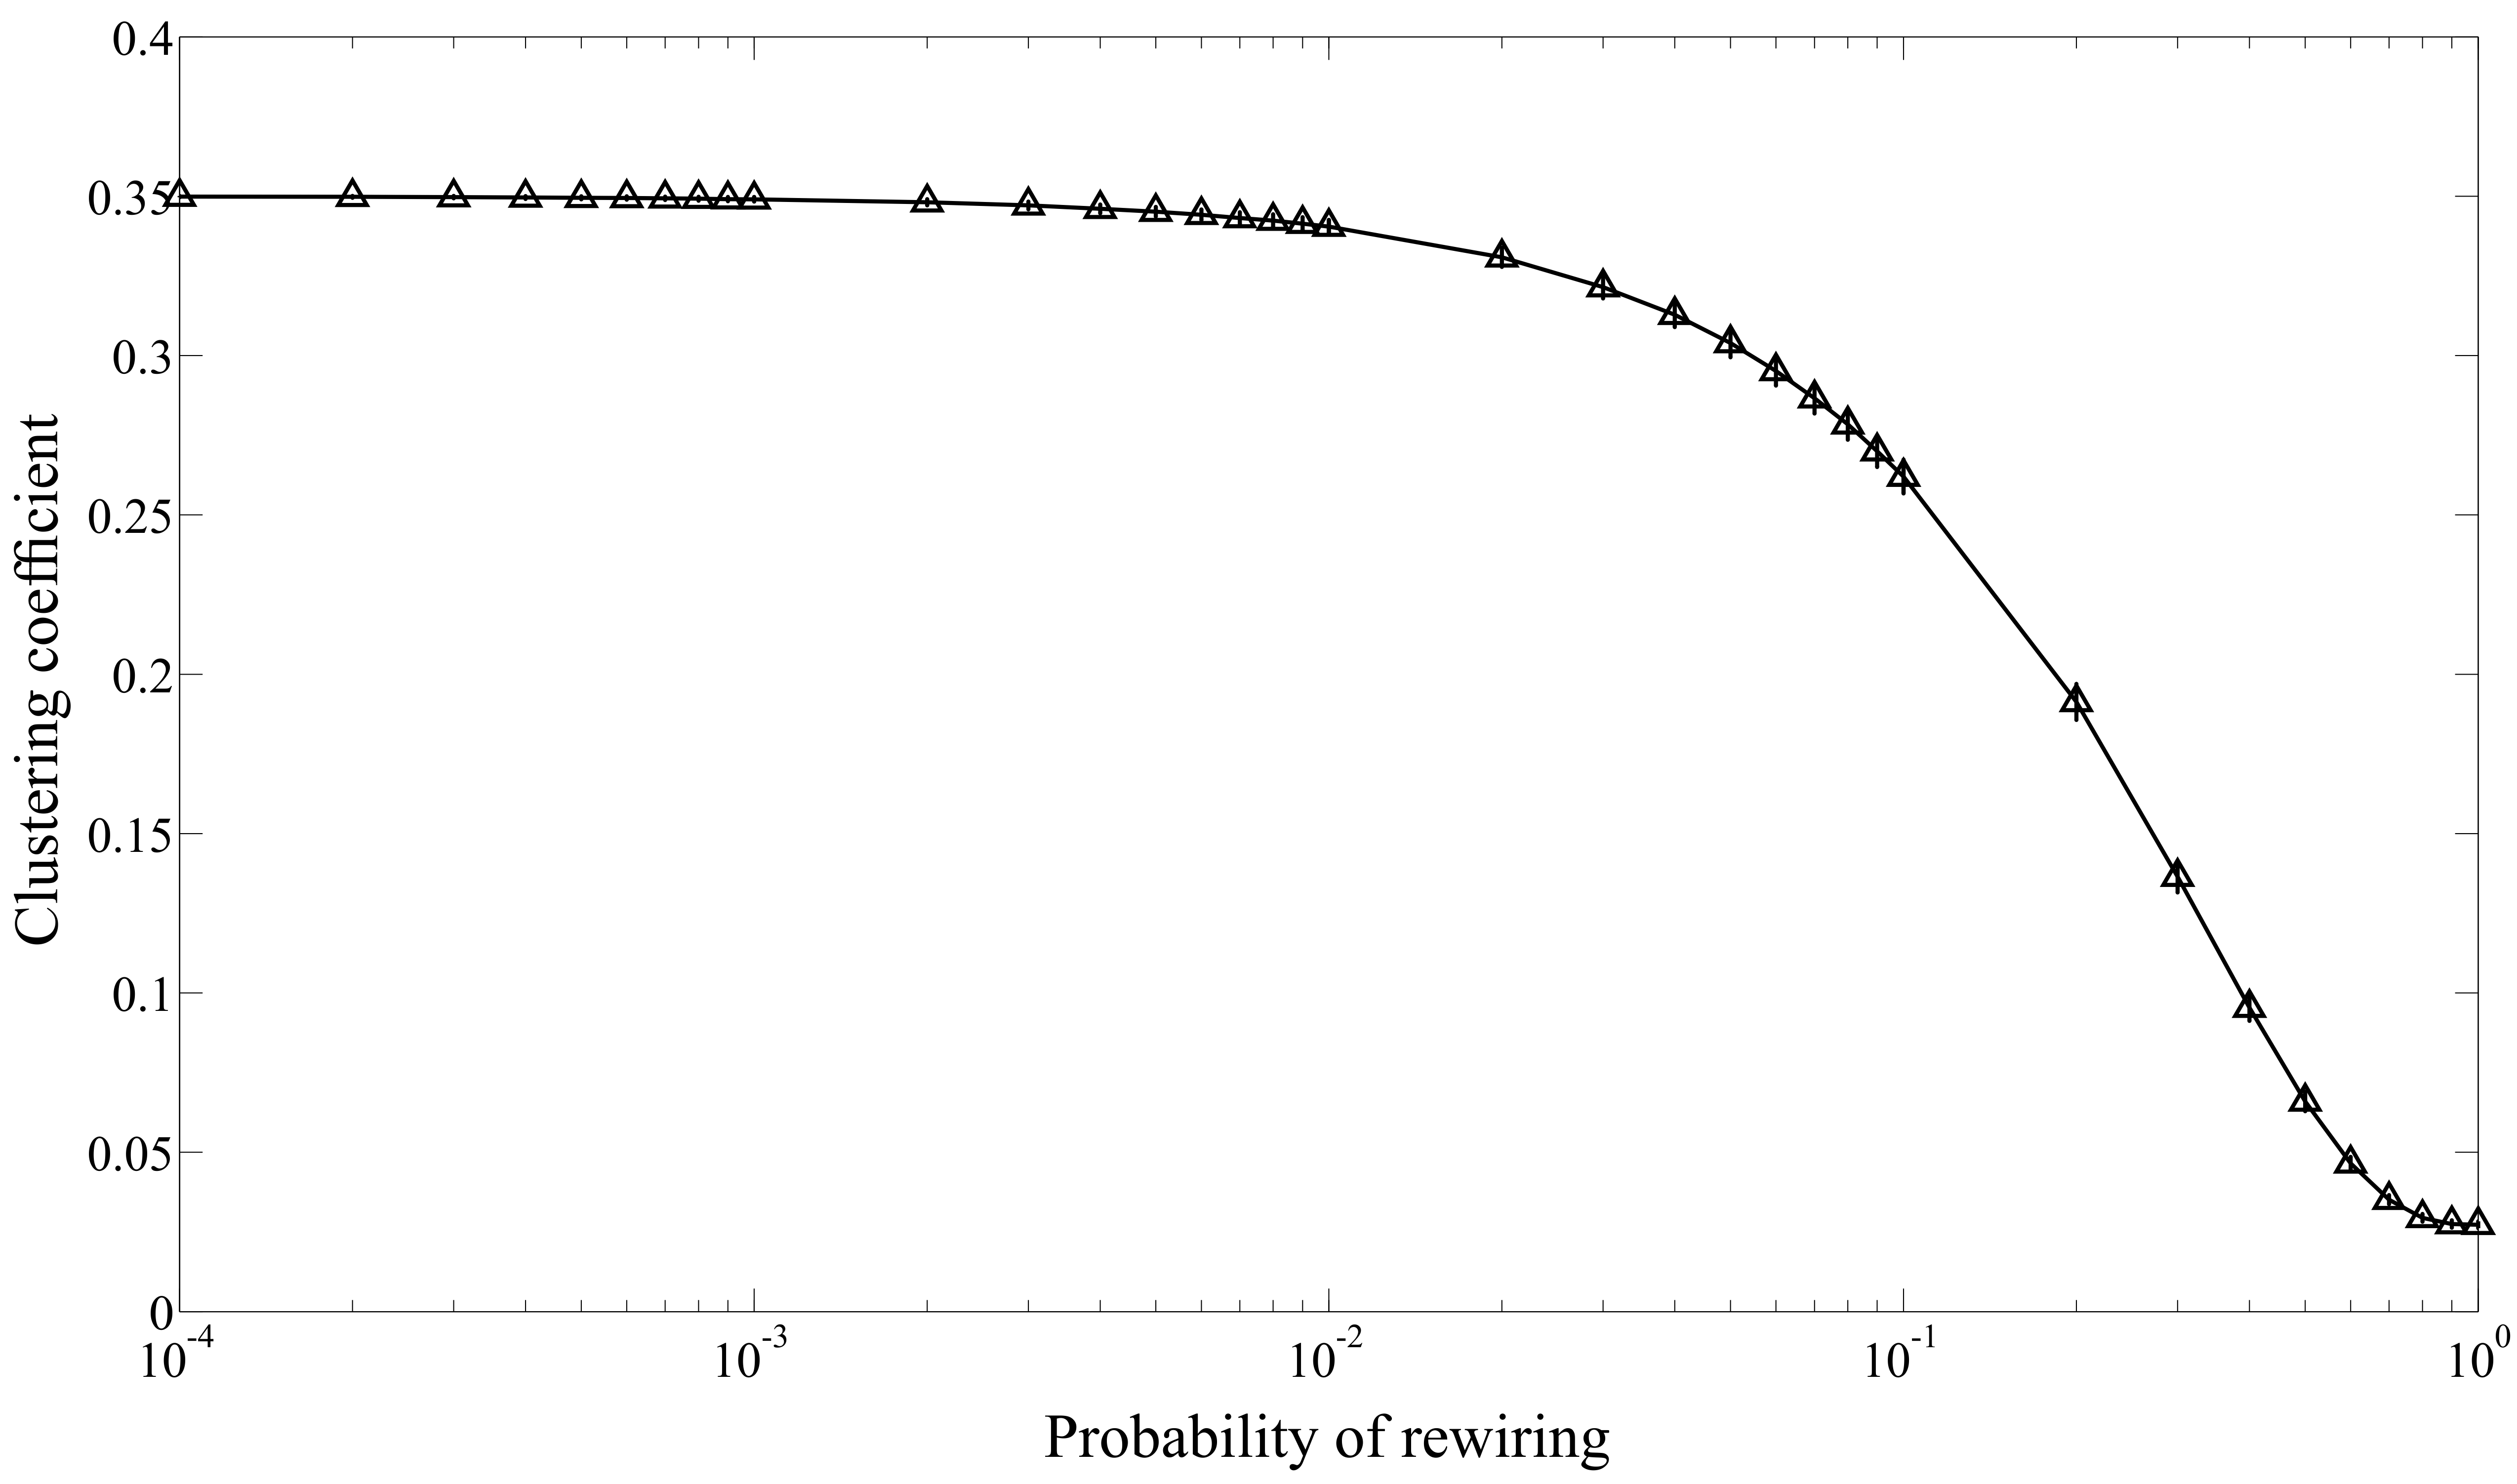
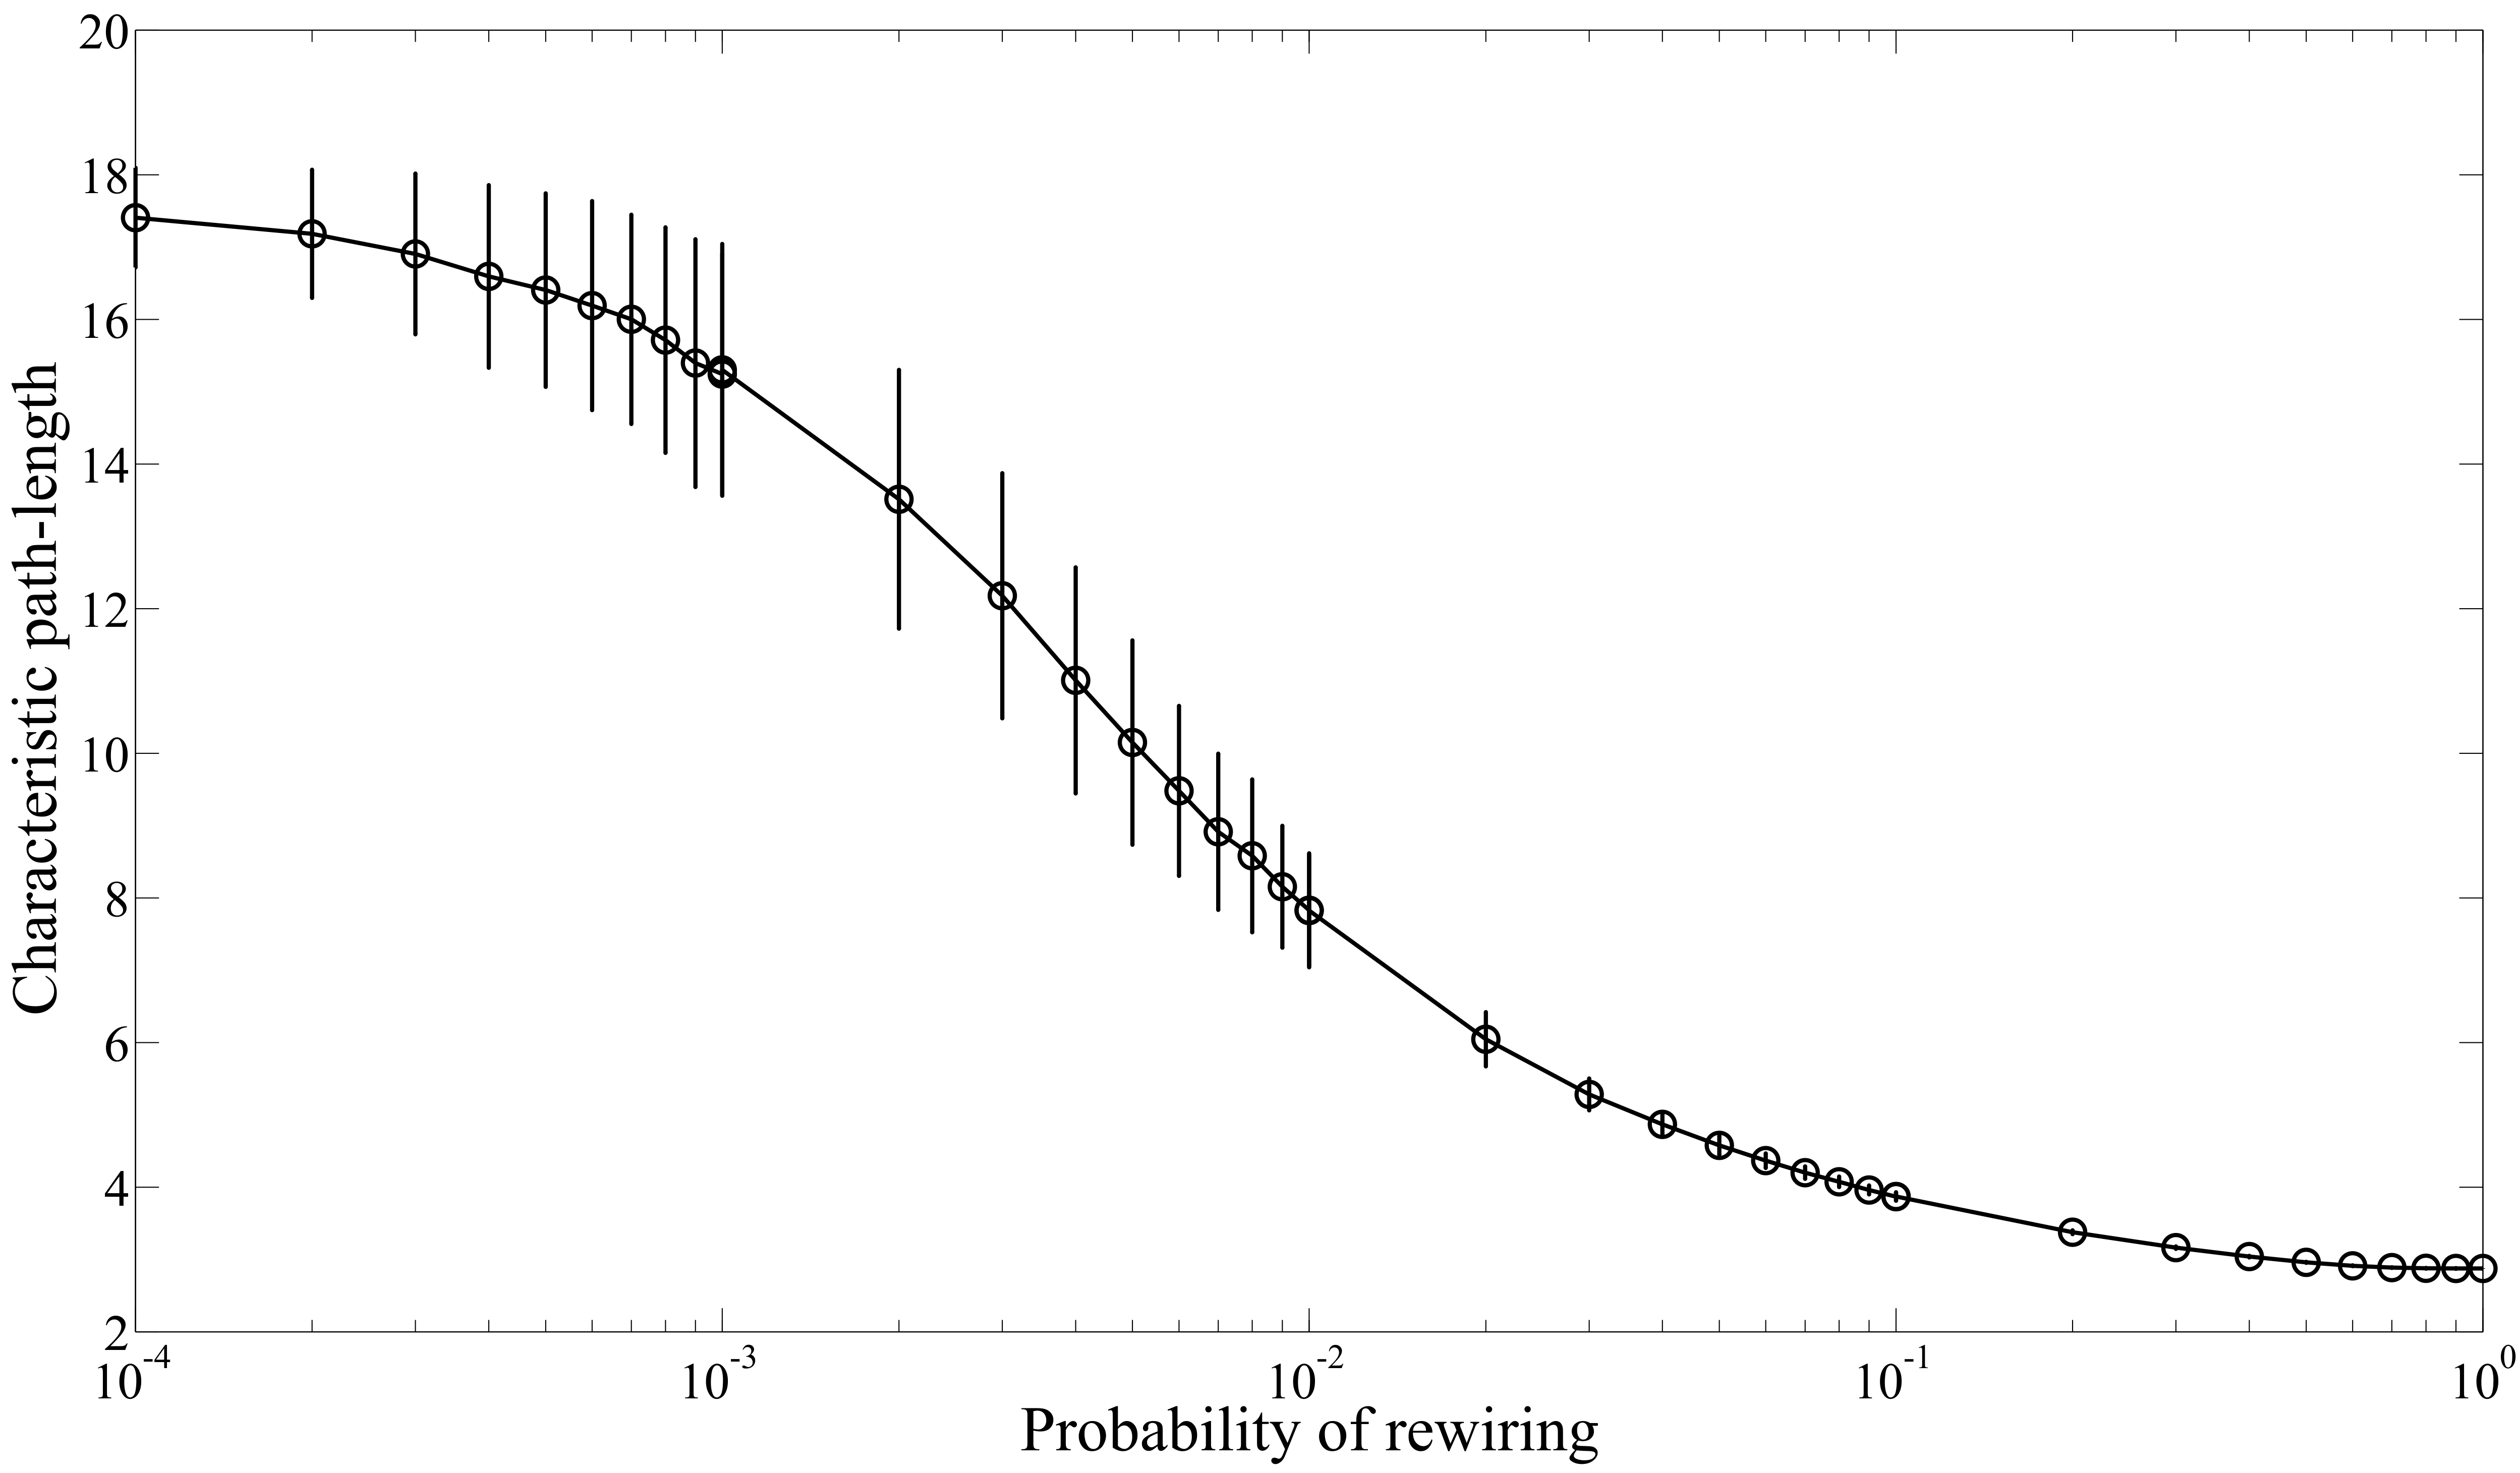
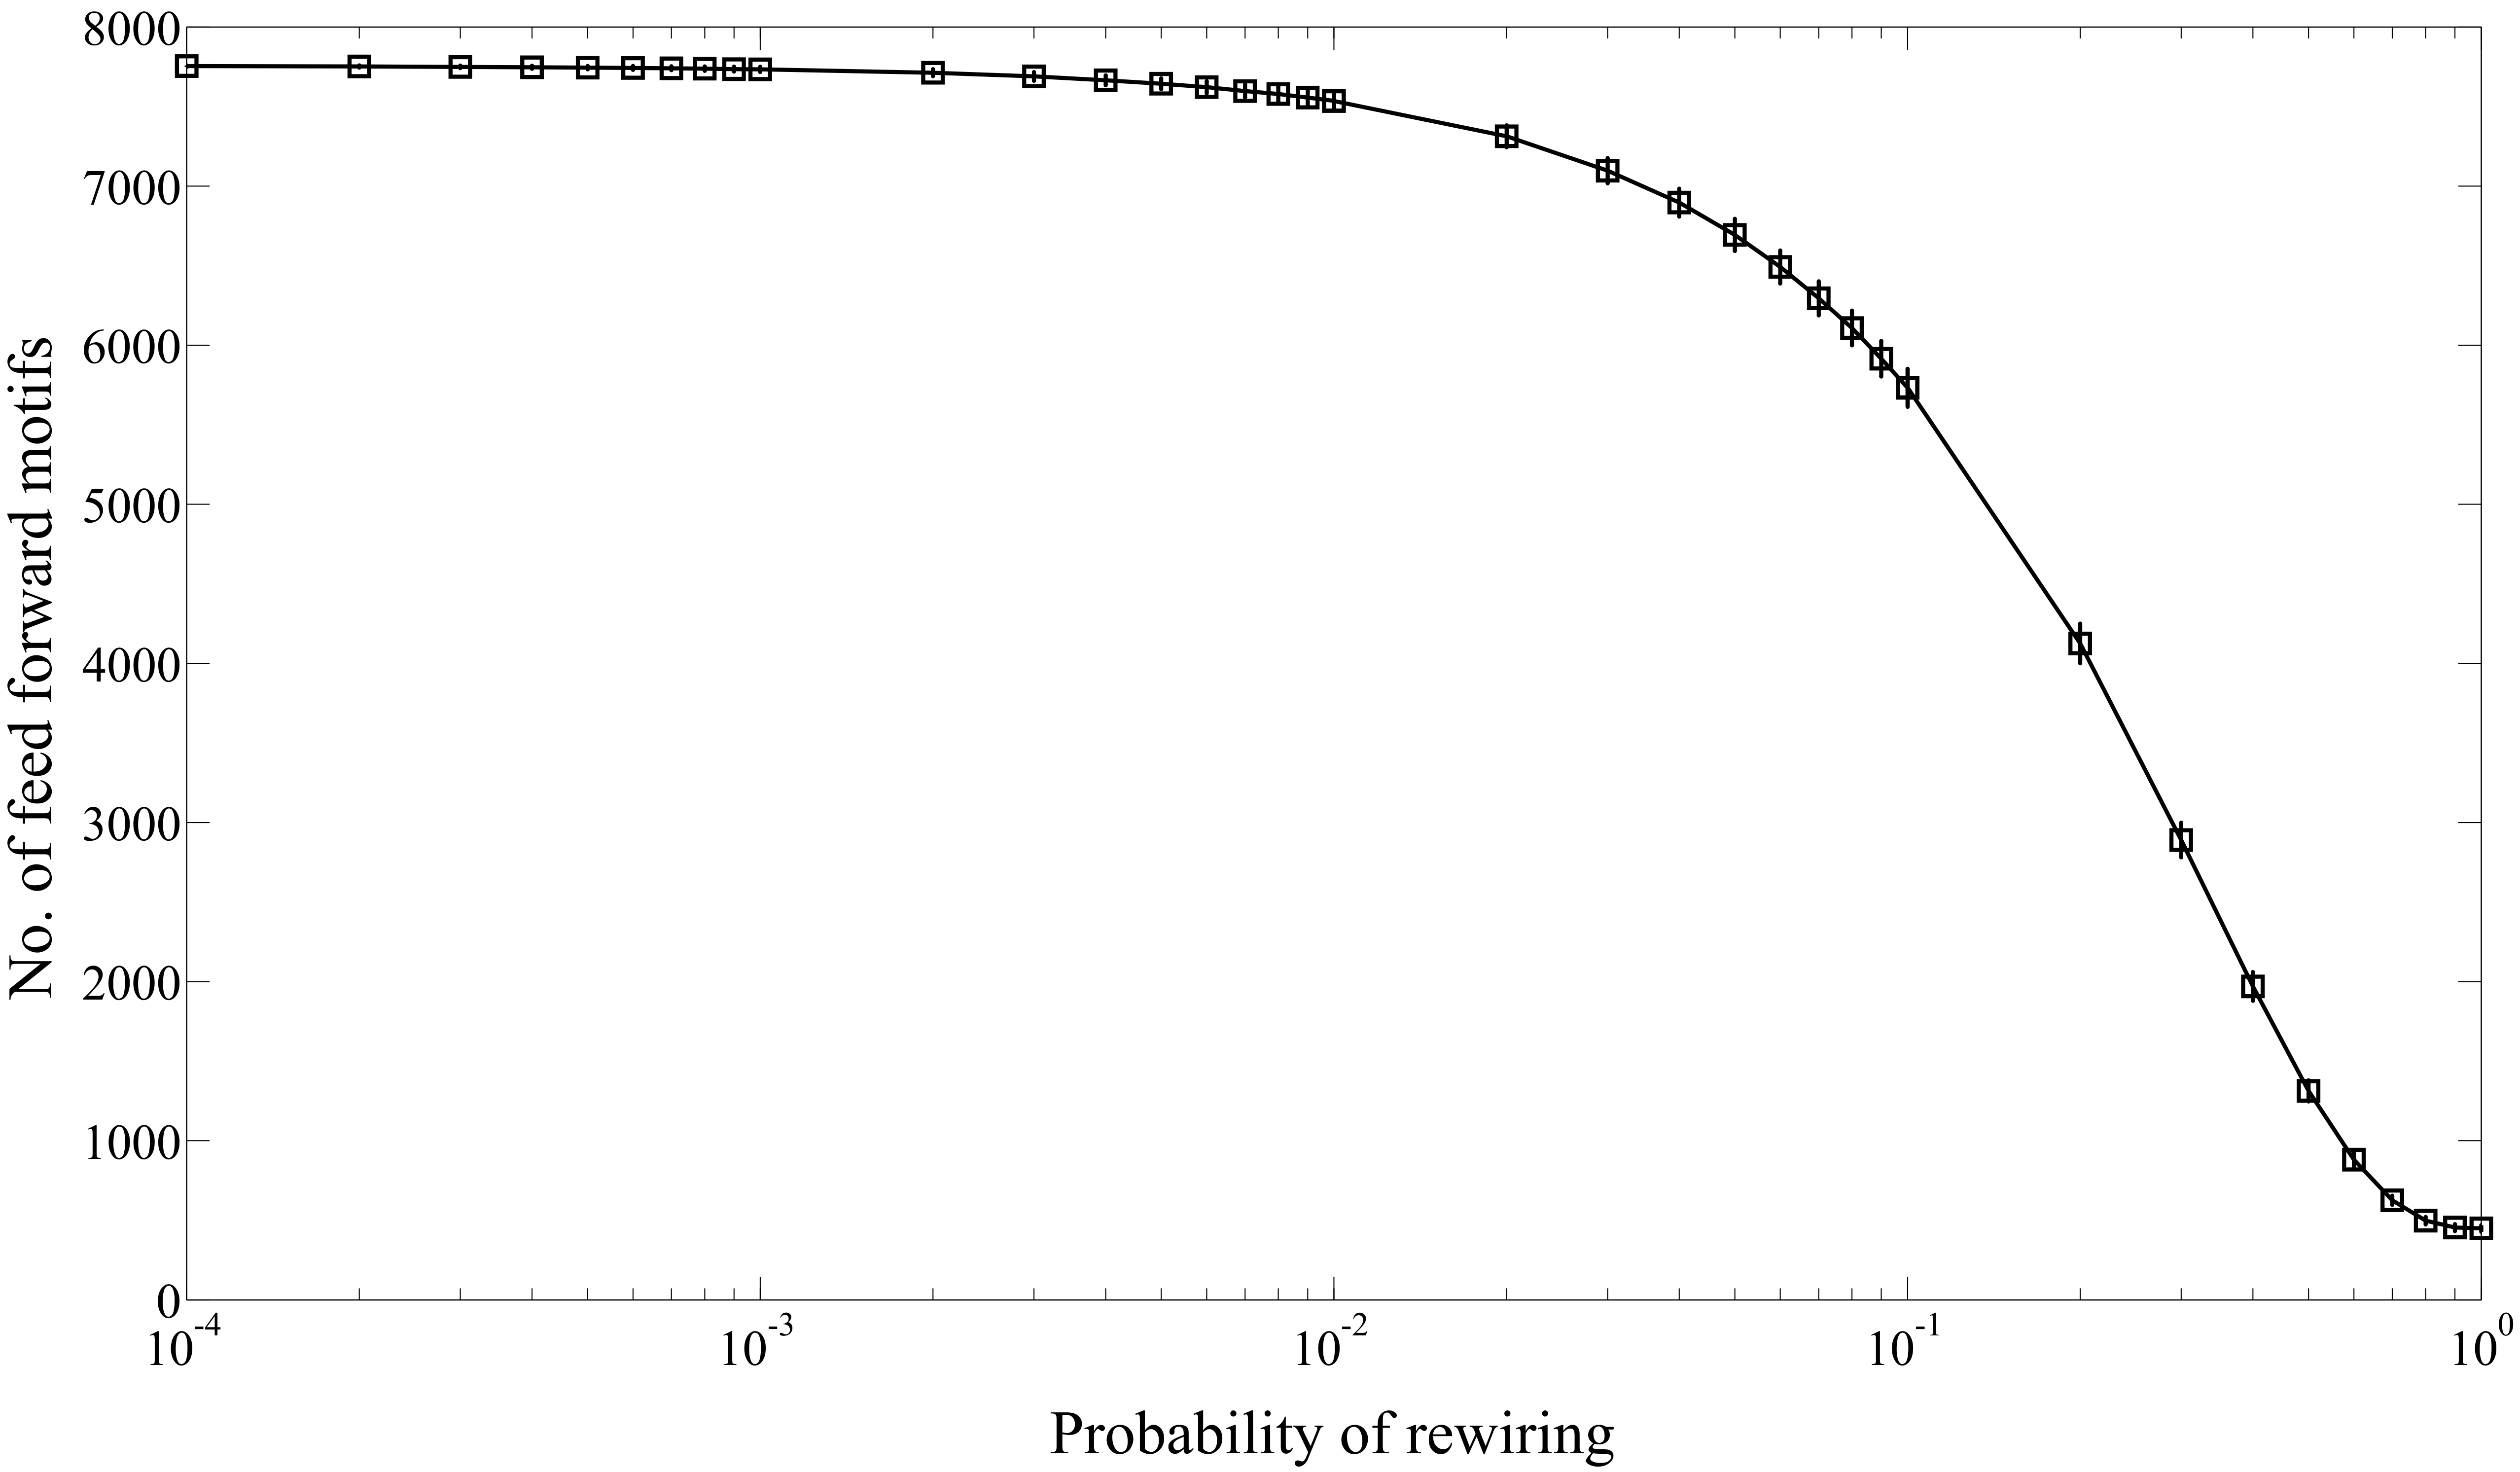
To investigate for possible mechanisms that could have lead to the observed saturation of FFMs, we created a 1D ring model of CeNN. A directed regular ring graph with neurons and average synapses can have a maximum of FFMs as shown in (Figure 2). Starting from such a regular ring graph maximally saturated with FFMs, we simulated random synaptic rewiring to observe its effect on topological features. In addition to FFM saturation, the regular graph had very high average clustering coefficient as well as characteristic path-length . From an analogous undirected Watts and Strogatz model it was anticipated that with increase in synaptic rewiring the clustering as well as path-length would decrease to approach that of random graph asymptotically Watts and Strogatz (1998). This simulation of synaptic rewiring was also expected to provide insights into its impact on number of FFMs and driver neurons. As shown in the Figure 3, with increasing probability of synaptic rewiring the number of FFMs is unaffected up to before falling sharply. While this result points at a critical threshold for number of FFMs in response to probability of synaptic rewiring, no driver neurons were presented by the model across the simulation ( ). For 1D ring graph, these results highlight a critical threshold of rewiring for which the network has optimum saturation of FFMs. This implies that to reflect small world nature and saturation of FFMs, the 1D representation of CeNN would need to have an optimum extent of rewiring. Such a simple model can only provide topological insights devoid of biological basis and clearly can not justify observed controllability. Search for a more realistic model prompted us to look for biological constraints that may dictate synaptic rewiring as well as to build a 2D model that could possibly reveal mechanisms that render observed controllability in CeNN.
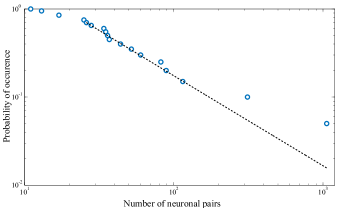
III.3 CeNN follows distance constrained synaptic connectivity pattern
We measured the connectivity pattern in CeNN by enumerating number of neuron pairs that are synaptically connected and cartesian distance between them. We observed that the synaptic connections were constrained by distance as evident from the power law observed from neuronal connectivity data (Figure 4). The probability of two neurons being connected scales as a power law (), with presence of a few exceptional long distance connections with an exponent (-value=). The power law nature of data was established following the strategy prescribed by Clauset et al. Clauset et al. (2009).
To incorporate this empirical distance constrained connectivity pattern we created more realistic 2D models: (1) Distance constrained random (DCR) model that adds distance constraint starting from ER control, and (2) Distance constrained plasticity (DCP) model that overlays the distance constraint starting from the DD control. Along with the ER and DD random controls these models allow us to segregate the contribution of degree (connectivity) vis-à-vis distance constrained synaptic wiring towards conferring observed topological features upon CeNN.
III.4 Distance constrained random model
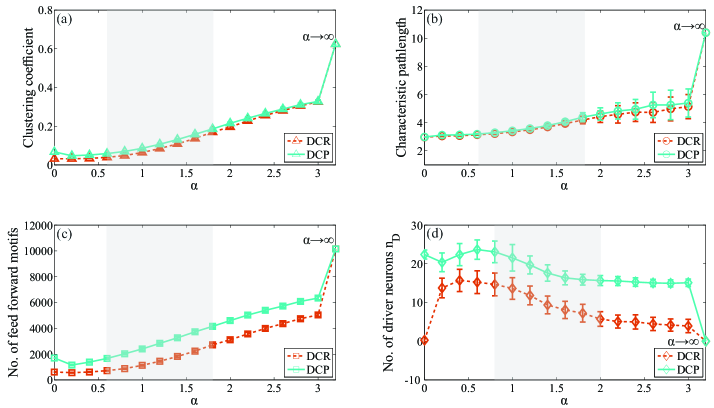
The distance constrained random (DCR) model is a 2D model in which the number of neurons, number of synapses and neuronal locations were preserved. Starting from initial random connectivity (ER) every synapse was probabilistically rewired to follow distance constraint with a certain (Figure 5). The lower asymptotic limit of this model converges to ER model for . With increasing the probability of long distance synaptic connections decreases. For extremely large values of this model converges to the Cartesian model in which every neuron is deterministically connected to its spatially nearest neighbours. We varied the value of between and to assess its impact on the topology of neural network. We found that the average clustering coefficient, characteristic path-length and number of FFMs monotonously increase with increasing . For these parameters the DCR model was closest to actual neuronal network of C. elegans for . While this model took us closer to CeNN, it did not reflect controllability measured in terms of . The driver neurons vanish for asymptotic limits of with maximum for . The fact that DD control, in which number of synapses of every neuron is preserved, matches with CeNN better in controllability (Table 1) prompted us to create a more refined ‘distance constrained synaptic plasticity model’.
III.5 Distance constrained synaptic plasticity model
The distance constrained synaptic plasticity (DCP) model preserves the number of synapses of every neuron over and above the number of neurons and their locations. While following the distance constraint, this model mimics synaptic rewiring that is known to take place in CeNN Shen and Bargmann (2003); Kandel et al. (2014). We observed the response of topological features for varying extent of distance constraint (Figure 5). In addition to the clustering and characteristic path-length, interestingly, this model successfully realised number of FFMs as well as number of driver neurons. We found that for an intermediate distance constraint of this model is closest to CeNN in reproducing number of driver neurons that are critical for control of the network (Figure 5(d)). This model presents a range of distance constraint parameter for which the small world nature as well as functionally relevant features of regulatory motifs and controllability were realistically exhibited. The number of driver nodes in DCP model was always higher than those returned by DCR model. For , i.e. in the presence of strong distance constraint, DCP model returned significantly high number of driver nodes higher than maximally displayed by DCR model. This points at the role of long distance synaptic connections in conferring observed nature of control in CeNN. This result brings out the importance of optimum heterogeneity in the range at which synapses are formed. Economizing on the synaptic lengths yields the Cartesian model (), equivalent of a 2D regular graph devoid of long-range connections. In such a case control nature of DCP model is similar to that of ER model. For smaller values of , where long range synaptic connections dominate, the model yields control response closest to reality. This highlights the important role played by long-range connections in controllability, and hence in key biological functions of the worm.
III.6 Identification of specific driver neurons
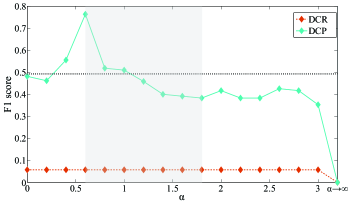
While the DCP model successfully reproduces key topological features important for function and control of CeNN (Figure 5), the question is whether it can also capture specific neurons implicated in control of the network and not just the number of driver neurons (Figure 5(d)). We compared specific neurons identified by ‘the minimum driver neurons set’ obtained from real-world CeNN with that obtained from distance constraint models, for varying extent of distance constraint (Figure 6). Neurons that were consistently identified as driver neurons over 100 random instances of DCP and DCR models were obtained as True Positives. The classification accuracy of these models was assessed using F1 score. Interestingly, we found that the performance of DCP model was significantly better compared to DCR model (the accuracy of which was indistinguishable from that obtained from random sampling) and superior to DD control in the presence of dominant long distance connections (). Thus DCP model is not only closer to real-world network in terms of number of driver nodes but also accurately identified specific neurons that can drive the network dynamics. In summary, the DCP model, that embeds empirically observed phenomenon of neuronal rewiring in addition to fixed neuronal connectivity, successfully recreates topological features of functional relevance to C. elegans.
IV Discussion
C. elegans connectome is one of the simplest yet complete neural diagram known to us so far. The neuronal network of this organism is responsible for many essential cognitive functions including learning and memory Ardiel and Rankin (2010). CeNN seemingly has evolved as a small world network with high clustering and low characteristic path-length for functional benefits Watts and Strogatz (1998). Other than the small world global architecture CeNN is reported to be enriched with number of feed forward motifs among all possible three and four node motifs Milo et al. (2002). Our results suggest that the heterogeneous composition of motifs dictated by FFMs contributes to increased clustering as well as control of the network.
Analysis of neuronal architecture of CeNN has revealed that the network is optimally wired Chen et al. (2006); Pérez-Escudero and de Polavieja (2007) and is dictated by constraints Ahn et al. (2006); Itzhack and Louzoun (2010); Towlson et al. (2013); Pan et al. (2010). Till date a few simple null models of CeNN have been implemented with network feature constraints Erdös and Rényi (1959); Maslov and Sneppen (2002). These studies suggest that neuronal connectivity plays a key role in rendering clustering as well as presentation of as many driver neurons as observed in CeNN Liu et al. (2011). None of these models has been able to explain all network features, especially clustering and number of driver neurons, claimed to be of biological relevance Liu et al. (2011); Badhwar and Bagler (2015).
Here, we present a distance constrained synaptic plasticity model that accounts for high clustering, FFMs saturation and large number of driver nodes. With a 1D ring model maximized for feed forward motifs, we show that such a model exhibits critical phenomenon in response to increased probability of synaptic rewiring. While this simple model lends interesting insights into the mechanisms of CeNN architecture, it cannot capture the aspect of controllability. This study indicated that small-world nature, known to be important for neuronal communication, can be recreated at an optimal value of rewiring. But at the same time 1D model is incapable of exhibiting nature of control observed in the empirical network.
Rooted in empirical observation of distance constraint followed in neuronal connections, we built more realistic 2D distance constrained models with random connectivity (DCR) and degree preserved connectivity (DCP). The latter model, that mimics real-world C. elegans neuronal wiring and follows a distance constrained synaptic plasticity mechanism, comes closest to the CeNN in presenting small world architecture, dominance of FFMs and nature of controllability within a range of free variable . Consistent with previous studies, number of contacts made by neurons came out as an important factor that governs network control Liu et al. (2011); Badhwar and Bagler (2015). But importantly, this study brings out the key role played by long-range synaptic connections. Our results suggest that the extent of synaptic plasticity in CeNN is optimized so as to acquire key structural and dynamical network features. Thus, optimized long-range synaptic links in response to synaptic plasticity as a biologically relevant property that not only ensures small world nature, but also lends the control phenotype of this neuronal network. Further, the DCP model also successfully captures specific driver neurons with impressive accuracy. Thus beyond confirming the importance of connectivity (degree) of neurons and highlighting the role of long-range synapses as signalling conduits, this results identifies parameter value for which the model is closest to CeNN.
Structurally, the small world architecture and distance constrained connectivity mirror presence of densely connected ganglionic structures that are bridged via optimized long-range synapses Ahn et al. (2006). From functional perspective, optimum heterogeneity in synaptic lengths is a reflection of wiring optimization in the brain architecture Chen et al. (2006); Ahn et al. (2006); Pérez-Escudero and de Polavieja (2007) of the worm that is shaped by evolution. The model reveals the role of length constrained wiring in shaping biologically important neuronal clustering Ahn et al. (2006) and saturation of functionally critical feed forward motifs Mangan and Alon (2003); Milo et al. (2002). It also pins down specific driver neurons that have been shown to be linked with critical functions of the worm such as reproduction, signalling processes and anatomical structural development Badhwar and Bagler (2015). Thus, the distance-constrained plasticity model presented in this study embodies an essential structural aspect of neuronal wiring with significant biological implications for survival of the organism.
Clearly, while the DCP model highlights the role of synaptic plasticity and distance constrained neuronal connectivity in specifying structural features and control architecture of CeNN, it is limited in many ways. The present study overlooks functional differences of synaptic links such as chemical synapses and gap junctions. Also, the strength of synaptic connections (edge weight) were ignored in these unweighted network models. Models that factor in such biologically relevant aspects, which are ignored in this study in favour of simplicity, may yield more enriched representations of CeNN.
Acknowledgment
Ganesh Bagler acknowledges the seed grant support from Indian Institute of Technology Jodhpur (IITJ/SEED/2014/0003), and support from Dhirubhai Ambani Institute of Information and Communication Technology as well as from Indraprastha Institute of Information Technology Delhi (IIIT-Delhi). Rahul Badhwar thanks Ministry of Human Resource Development, Government of India and Indian Institute of Technology Jodhpur for the senior research fellowship.
References
- Kandel et al. (2000) E. Kandel, J. Schwartz, and T. Jessel, Principles of Neural Science, 4th ed. (McGraw-Hill, 2000).
- Sporns (2011) O. Sporns, Networks of the Brain (MIT Press, 2011) p. 412.
- White et al. (1986) J. G. White, E. Southgate, J. N. Thomson, and S. Brenner, Philosophical Transactions of the Royal Society B: Biological Sciences 314, 1 (1986).
- Chiang et al. (2011) A.-S. Chiang, C.-Y. Lin, C.-C. Chuang, H.-M. Chang, C.-H. Hsieh, C.-W. Yeh, C.-T. Shih, J.-J. Wu, G.-T. Wang, Y.-C. Chen, C.-C. Wu, G.-Y. Chen, Y.-T. Ching, P.-C. Lee, C.-Y. Lin, H.-H. Lin, C.-C. Wu, H.-W. Hsu, Y.-A. Huang, J.-Y. Chen, H.-J. Chiang, C.-F. Lu, R.-F. Ni, C.-Y. Yeh, and J.-K. Hwang, Current Biology 21, 1 (2011).
- Sporns (2013) O. Sporns, NeuroImage 80, 53 (2013).
- Zingg et al. (2014) B. Zingg, H. Hintiryan, L. Gou, M. Y. Song, M. Bay, M. S. Bienkowski, N. N. Foster, S. Yamashita, I. Bowman, A. W. Toga, and H.-W. Dong, Cell 156, 1096 (2014).
- Chen et al. (2006) B. L. Chen, D. H. Hall, and D. B. Chklovskii, PNAS 103, 4723 (2006).
- Towlson et al. (2013) E. K. Towlson, P. E. Vértes, S. E. Ahnert, W. R. Schafer, and E. T. Bullmore, The Journal of Neuroscience 33, 6380 (2013).
- (9) Z. Altun, L. Herndon, C. Crocker, C. Wolkow, R. Lints, and D. Hall, “WormAtlas,” .
- Howe et al. (2016) K. L. Howe, B. J. Bolt, S. Cain, J. Chan, W. J. Chen, P. Davis, J. Done, T. Down, S. Gao, C. Grove, T. W. Harris, R. Kishore, R. Lee, J. Lomax, Y. Li, H.-M. Muller, C. Nakamura, P. Nuin, M. Paulini, D. Raciti, G. Schindelman, E. Stanley, M. A. Tuli, K. Van Auken, D. Wang, X. Wang, G. Williams, A. Wright, K. Yook, M. Berriman, P. Kersey, T. Schedl, L. Stein, and P. W. Sternberg, Nucleic Acids Research 44, D774 (2016).
- Chatterjee and Sinha (2008) N. Chatterjee and S. Sinha, Progress in Brain Research 168, 145 (2008).
- Ardiel and Rankin (2010) E. L. Ardiel and C. H. Rankin, Learning & Memory (Cold Spring Harbor, N.Y.) 17, 191 (2010).
- Hobert (2003) O. Hobert, Journal of Neurobiology 54, 203 (2003).
- Kandel et al. (2014) E. R. Kandel, Y. Dudai, and M. R. Mayford, Cell 157, 163 (2014).
- Amaral et al. (2000) L. A. N. Amaral, A. Scala, M. Barthelemy, and H. E. Stanley, PNAS 97, 11149 (2000).
- Barthélemy (2011) M. Barthélemy, Physics Reports 499, 1 (2011).
- Avena-Koenigsberger et al. (2015) A. Avena-Koenigsberger, J. Goñi, R. Solé, and O. Sporns, Journal of The Royal Society Interface 12, 20140881 (2015).
- Yoonsuck Choe, BH McCormick (2004) W. K. Yoonsuck Choe, BH McCormick, Society of Neuroscience Abstracts 30 (2004).
- Watts and Strogatz (1998) D. J. Watts and S. H. Strogatz, Nature 393, 440 (1998).
- Ahn et al. (2006) Y. Y. Ahn, H. Jeong, and B. J. Kim, Physica A: Statistical Mechanics and its Applications 367, 531 (2006).
- Alon (2007) U. Alon, An Introduction to Systems Biology: Design Principles of Biological Circuits (Chapman and Hall/CRC Press, 2007).
- Milo et al. (2002) R. Milo, S. Shen-Orr, S. Itzkovitz, N. Kashtan, D. Chklovskii, and U. Alon, Science 298, 824 (2002).
- Mangan and Alon (2003) S. Mangan and U. Alon, PNAS 100, 11980 (2003).
- Balaji et al. (2007) S. Balaji, M. M. Babu, and L. Aravind, Journal of Molecular Biology 372, 1108 (2007).
- Liu et al. (2011) Y.-Y. Liu, J.-J. Slotine, and A.-L. Barabási, Nature 473, 167 (2011).
- Lin (1974) C. Lin, Automatic Control, IEEE Transactions on 19, 201 (1974).
- Badhwar and Bagler (2015) R. Badhwar and G. Bagler, PLoS ONE 10, e0139204 (2015).
- Pothen and Fan (1990) A. Pothen and C.-J. Fan, ACM Transactions on Mathematical Software 16, 303 (1990).
- Erdös and Rényi (1959) P. Erdös and A. Rényi, Publicationes Mathematicae 6, 290 (1959).
- Maslov and Sneppen (2002) S. Maslov and K. Sneppen, Science 296, 910 (2002).
- Clauset et al. (2009) A. Clauset, C. R. Shalizi, and M. E. J. Newman, SIAM Review 51, 661 (2009).
- Albert and Barabasi (2002) R. Albert and A. L. Barabasi, Reviews of Modern Physics 74, 47 (2002).
- Dorogovtsev (2010) S. N. Dorogovtsev, Lectures on Complex Networks (Oxford University Press, 2010).
- Mozzachiodi and Byrne (2010) R. Mozzachiodi and J. H. Byrne, Trends in Neurosciences 33, 17 (2010).
- Shen and Bargmann (2003) K. Shen and C. I. Bargmann, Cell 112, 619 (2003).
- Pérez-Escudero and de Polavieja (2007) A. Pérez-Escudero and G. G. de Polavieja, PNAS 104, 17180 (2007).
- Itzhack and Louzoun (2010) R. Itzhack and Y. Louzoun, Bioinformatics 26, 647 (2010).
- Pan et al. (2010) R. K. Pan, N. Chatterjee, and S. Sinha, PLoS ONE 5, e9240 (2010).
Supplemental Material
S1 Three node motif classification
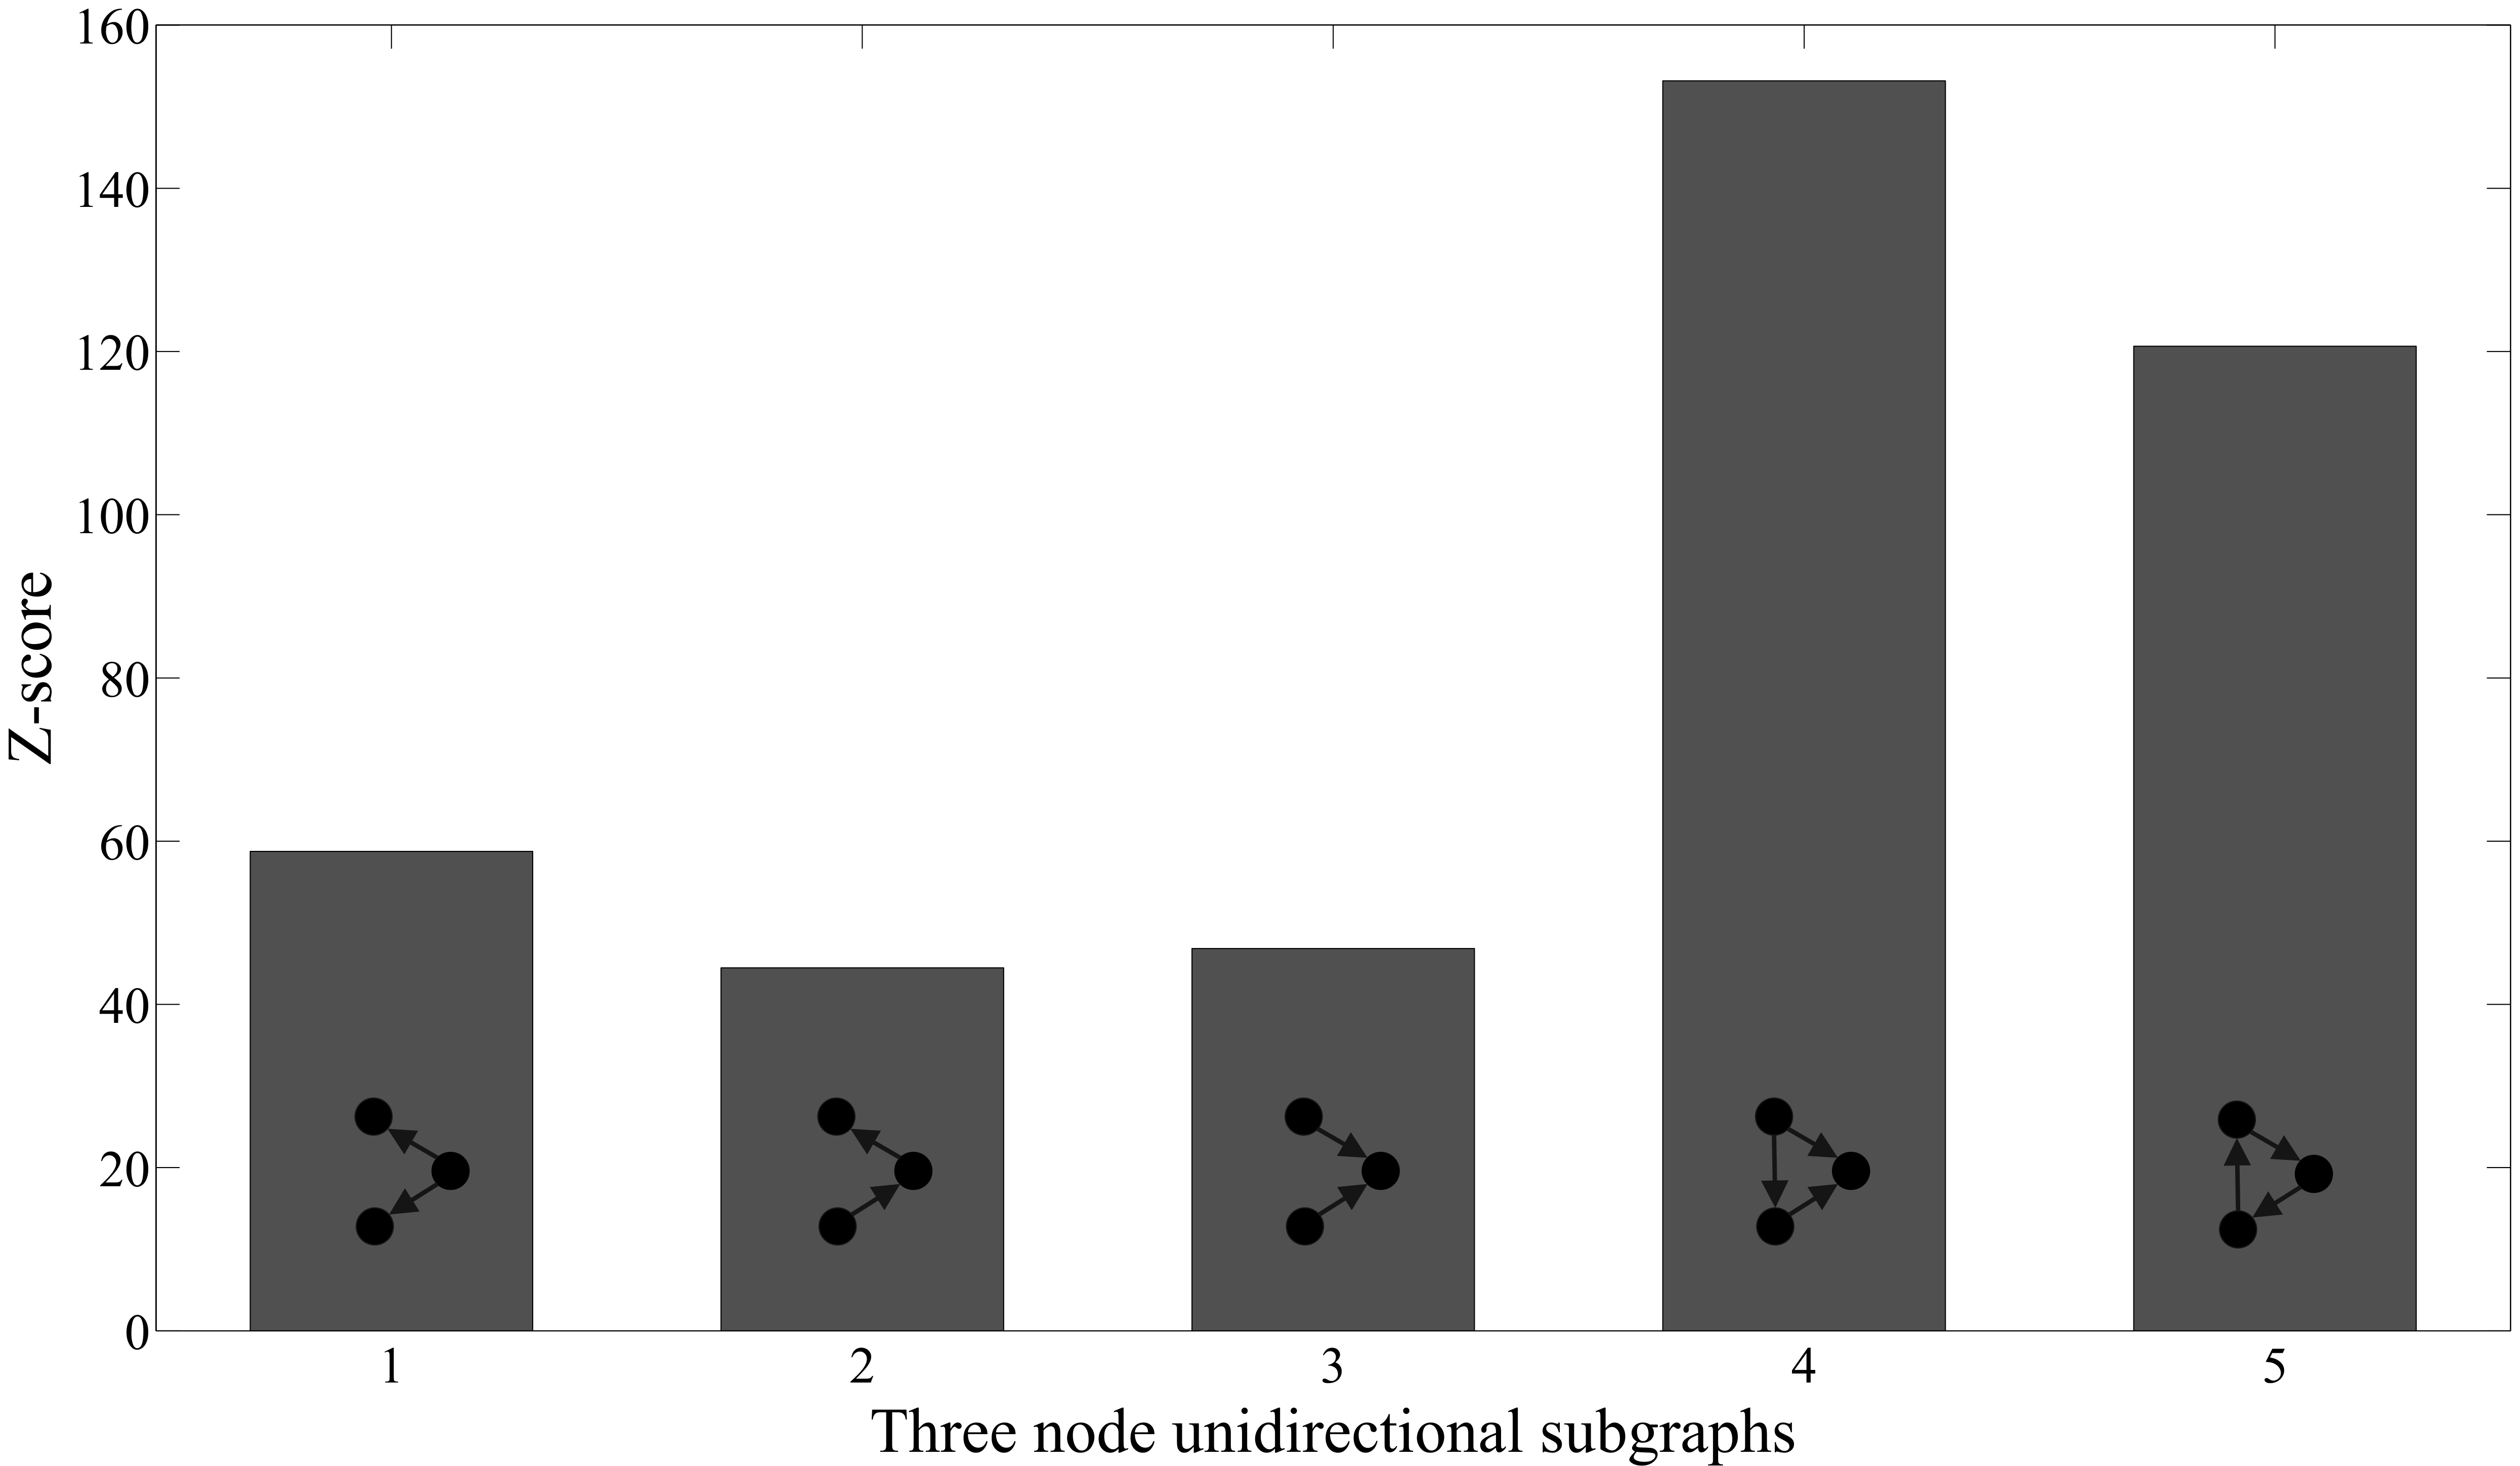
Motifs are patterns of local connectivity among nodes that are present in numbers significantly higher than expected by chance. The pattern of connectivity among 13 three node connected digraphs could be divided into angular motifs and triangular motifs (Figure S1). Angular motifs are linear three node sub-structures, whereas triangular motifs comprise of three nodes subgraphs with either unidirectional or bidirectional edges. For our studies, we computed number of feed forward motifs, , (among unidirectional triangular motifs) that are prevalent in many real world networks including CeNN. In CeNN, feed forward motifs are most prevalent among all unidirectional motifs as shown in Figure S2.
S2 1D ring model of CeNN
Following is an illustration of 1D ring model with 20 nodes and 4 outgoing synapses for every node( and ) (Figure S3).
S3 Response of CeNN 1D ring model to rewiring
Starting from a 1-D regular ring graph maximally saturated with FFMs, we simulated random synaptic rewiring to observe its effect on topological features. In addition FFMs saturation, the regular graph had very high average clustering coefficient (, Figure S4) as well as characteristic path-length (; Figure S5). Figure S6 shows with increasing probability of synaptic rewiring the number of FFMs is unaffected up to before falling sharply. These figures depict non-normalized data corresponding to Figure 3 in the main manuscript.
S4 Degree distribution of CeNN, its controls and distance constrained models
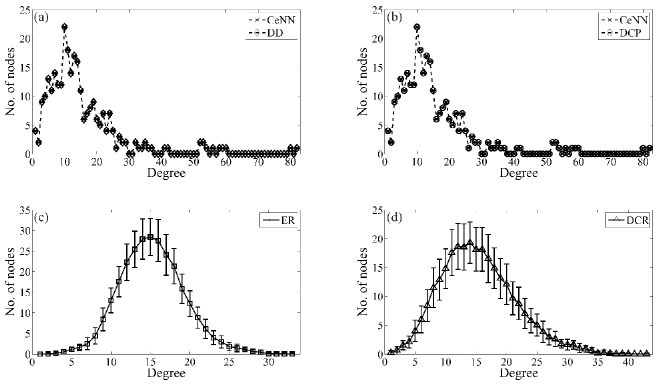
Figure S7 depicts the degree distribution of CeNN in comparison to its random controls (ER and DD) as well as distance constrained models (DCR and DCP).
S5 Topological features of DCR
| Average | Characteristic | Number of | Number of | |
| Exponent | clustering coefficient | path-length | driver neurons | feed forward motifs |
| (ER) | 0.032 0.001 | 2.968 0.007 | 0.26 0.441 | 610.55 37.59 |
| 0.032 0.002 | 3.048 0.026 | 13.75 2.536 | 563.91 29.212 | |
| 0.033 0.001 | 3.068 0.026 | 15.70 2.866 | 612.19 33.902 | |
| 0.039 0.002 | 3.14 0.028 | 15.24 2.934 | 721.21 38.011 | |
| 0.048 0.002 | 3.211 0.042 | 14.66 2.952 | 875.83 40.081 | |
| 0.064 0.003 | 3.334 0.044 | 13.62 2.784 | 1131.84 53.844 | |
| 0.085 0.004 | 3.49 0.07 | 11.82 2.418 | 1447.24 65.112 | |
| 0.108 0.004 | 3.689 0.099 | 9.37 2.299 | 1816.30 73.181 | |
| 0.136 0.005 | 3.931 0.14 | 8.08 2.246 | 2231.32 87.442 | |
| 0.169 0.006 | 4.185 0.266 | 7.23 2.287 | 2719.38 97.224 | |
| 0.196 0.007 | 4.426 0.408 | 5.73 1.89 | 3114.38 108.00 | |
| 0.227 0.008 | 4.589 0.617 | 5.09 1.682 | 3562.71 121.276 | |
| 0.256 0.008 | 4.744 0.661 | 4.98 1.826 | 3985.73 121.322 | |
| 0.28 0.008 | 4.726 0.709 | 4.46 1.72 | 4364.37 118.252 | |
| 0.305 0.008 | 4.976 0.843 | 4.17 1.596 | 4738.90 124.48 | |
| 0.326 0.008 | 5.138 0.856 | 3.93 1.725 | 5035.94 120.082 | |
| Cartesian | 0.624 | 10.394 | 0 | 10153 |
S6 Topological features of DCP
| Average | Characteristic | Number of | Number of | |
| Exponent | clustering coefficient | pathlength | driver neurons | feed forward motifs |
| (DD) | 0.067 0.003 | 2.98 0.018 | 22.38 1.153 | 1699.56 57.496 |
| 0.047 0.002 | 3.116 0.024 | 20.37 2.427 | 1155.70 51.703 | |
| 0.051 0.002 | 3.133 0.034 | 22.37 2.863 | 1379.11 61.456 | |
| 0.058 0.003 | 3.182 0.033 | 23.66 2.503 | 1667.59 66.845 | |
| 0.069 0.003 | 3.286 0.041 | 23.07 2.808 | 2026.05 72.395 | |
| 0.086 0.004 | 3.423 0.055 | 21.51 3.422 | 2402.08 97.428 | |
| 0.107 0.005 | 3.58 0.075 | 19.70 2.333 | 2832.55 89.72 | |
| 0.131 0.005 | 3.79 0.112 | 17.62 2.112 | 3263.43 106.606 | |
| 0.158 0.006 | 4.063 0.16 | 16.36 1.784 | 3726.71 109.069 | |
| 0.186 0.006 | 4.384 0.317 | 15.89 1.377 | 4150.42 106.657 | |
| 0.215 0.007 | 4.615 0.439 | 15.67 1.28 | 4597.74 114.656 | |
| 0.241 0.007 | 4.829 0.576 | 15.55 1.167 | 5025.00 120.231 | |
| 0.266 0.008 | 4.947 0.702 | 15.28 1.092 | 5391.46 114.416 | |
| 0.288 0.009 | 5.256 0.902 | 15.05 0.947 | 5722.95 121.129 | |
| 0.311 0.008 | 5.256 1.046 | 14.95 0.925 | 6084.32 118.954 | |
| 0.328 0.009 | 5.395 1.002 | 15.10 0.959 | 6339.36 131.354 | |
| Cartesian | 0.624 | 10.394 | 0 | 10153 |
S7 List of C. elegans neurons
Table S3 lists all 277 neurons with their X- and Y-coordiantes. Rows depicting the 34 driver neurons identified in this study are shown in grey.
| Neuron Name | X | Y |
|---|---|---|
| ADAL | 0.01106776858176 | 0.00590280993408 |
| ADAR | 0.01420641977856 | 0.00220444444224 |
| ADEL | 0.01623272728896 | 0.00565685948544 |
| ADER | 0.01494123459264 | 0.00930765433152 |
| ADFL | 0.08239338844992 | -0.00098380167552 |
| ADFR | 0.0832790123616 | -0.00318419750784 |
| ADLL | 0.08263933883904 | -0.01303537187328 |
| ADLR | 0.0832790123616 | -0.01151209877376 |
| AFDL | 0.08632859503296 | -0.0027054545184 |
| AFDR | 0.08646320986944 | -0.0009797530656 |
| AIAL | 0.06517685948544 | 0.00934611567936 |
| AIAR | 0.05903012343744 | 0.01151209877376 |
| AIBR | 0.07544098765824 | 0.00612345676416 |
| AIML | 0.0332033058048 | 0.01795438019136 |
| AIMR | 0.0374755555776 | 0.01518617284416 |
| AINL | 0.06197950412928 | -0.0061487603232 |
| AINR | 0.06196938269376 | -0.00342913581888 |
| AIYR | 0.0394350617088 | 0.01518617284416 |
| AIZL | 0.04869818180736 | 0.0027054545184 |
| AIZR | 0.05756049380928 | 0.00318419750784 |
| ALA | 0.09405629632128 | -0.01322666665344 |
| ALML | -0.37848615384768 | -0.01678769230464 |
| ALMR | -0.3815384615232 | -0.00610461541056 |
| ALNL | -0.9800451284544 | -0.04944102563136 |
| ALNR | -0.9862451280576 | -0.04944102563136 |
| AQR | 0.01959506172864 | 0.00416395063296 |
| AS1 | -0.0164108642208 | 0.0247387654272 |
| AS10 | -0.8348061541056 | 0.03357538460928 |
| AS11 | -0.8440584613248 | 0.02330564102208 |
| AS2 | -0.10988307691392 | 0.03968000001984 |
| AS3 | -0.19839999998016 | 0.03968000001984 |
| AS4 | -0.28386461537088 | 0.03968000001984 |
| AS5 | -0.40137846156288 | 0.04273230769536 |
| AS6 | -0.47616 | 0.04273230769536 |
| AS7 | -0.57536000001984 | 0.04273230769536 |
| AS8 | -0.6654030769536 | 0.03968000001984 |
| AS9 | -0.7584984613248 | 0.0351015384768 |
| ASEL | 0.069112066128 | 0.00049190083776 |
| ASER | 0.07176691358784 | -0.00073481481408 |
| ASGL | 0.0779662809696 | -0.00762446283648 |
| ASGR | 0.08009481479424 | -0.01028740739712 |
| ASHL | 0.07550677684032 | 0.00049190083776 |
| ASHR | 0.07838024691456 | -0.0009797530656 |
| ASIL | 0.0769824793536 | -0.01278942148416 |
| ASIR | 0.07715555553792 | -0.01175703702528 |
| ASJL | 0.06345520658304 | 0.00664066116096 |
| ASJR | 0.06270419750784 | 0.00906271602048 |
| ASKL | 0.08854214877312 | -0.01008396696576 |
| ASKR | 0.08866765431168 | -0.00955259258304 |
| Neuron Name | X | Y |
|---|---|---|
| AUAL | 0.06862016529024 | 0.0061487603232 |
| AUAR | 0.06711308639232 | 0.00538864195008 |
| AVAL | 0.08952595038912 | 0.0017216529024 |
| AVAR | 0.09087209875392 | -0.00024493825152 |
| AVBL | 0.069112066128 | -0.0044271074208 |
| AVBR | 0.07176691358784 | -0.0063683950752 |
| AVDL | 0.06173355374016 | -0.00147570245376 |
| AVDR | 0.06637827157824 | -0.00146962962816 |
| AVEL | 0.08288528922816 | 0.00221355374016 |
| AVER | 0.08401382717568 | 0.00318419750784 |
| AVFL | 0.01861530866304 | 0.02277925923648 |
| AVFR | 0.02449382717568 | 0.02253432098496 |
| AVG | 0.00195950619072 | 0.02449382717568 |
| AVHL | 0.07206347109504 | -0.00860826445248 |
| AVHR | 0.07642074072384 | -0.0127367901504 |
| AVJL | 0.06763636361472 | -0.00934611567936 |
| AVJR | 0.07299160496448 | -0.00979753083456 |
| AVKL | 0.02680859503296 | 0.01770842974272 |
| AVKR | 0.03184197531648 | 0.01592098765824 |
| AVL | 0.06098962962816 | 0.00906271602048 |
| AVM | -0.34796307691392 | 0.0228923077152 |
| AWAL | 0.0779662809696 | -0.00295140496704 |
| AWAR | 0.07838024691456 | -0.00538864195008 |
| AWBL | 0.07919603303424 | -0.00393520658304 |
| AWBR | 0.08278913579904 | -0.00685827157824 |
| AWCL | 0.07845818180736 | 0.00491900825856 |
| AWCR | 0.07862518516608 | 0.00416395063296 |
| BAGL | 0.1128912396768 | 0.00049190083776 |
| BAGR | 0.11463111111552 | 0.00318419750784 |
| BDUL | -0.13277538462912 | -0.00152615386752 |
| BDUR | -0.13430153843712 | 0.00457846154304 |
| CEPDL | 0.09419900825856 | -0.01623272728896 |
| CEPDR | 0.09601580245248 | -0.01249185183936 |
| CEPVL | 0.10748033058048 | 0.0113137190304 |
| CEPVR | 0.10507851853248 | 0.01494123459264 |
| DA1 | -0.02302419754752 | 0.02424888886464 |
| DA2 | -0.12819692308608 | 0.03815384615232 |
| DA3 | -0.23350153845696 | 0.04120615382784 |
| DA4 | -0.37390769230464 | 0.04120615382784 |
| DA5 | -0.52652307691392 | 0.03968000001984 |
| DA6 | -0.6989784613248 | 0.03815384615232 |
| DA7 | -0.8409107693376 | 0.03204923074176 |
| DA8 | -0.9039917949888 | 0.0038789743488 |
| DA9 | -0.9077117949888 | 0.00263897436864 |
| DB1 | -0.01224691358784 | 0.02522864198976 |
| DB2 | 0.01175703702528 | 0.02424888886464 |
| DB3 | -0.12056615386752 | 0.03815384615232 |
| DB4 | -0.2731815384768 | 0.03968000001984 |
| Neuron Name | X | Y |
|---|---|---|
| DB5 | -0.46852923078144 | 0.04120615382784 |
| DB6 | -0.657772307616 | 0.03815384615232 |
| DB7 | -0.827175384768 | 0.03204923074176 |
| DD1 | -0.00808296295488 | 0.0247387654272 |
| DD2 | -0.18924307689408 | 0.03815384615232 |
| DD3 | -0.37848615384768 | 0.04120615382784 |
| DD4 | -0.5829907692384 | 0.04120615382784 |
| DD5 | -0.767655384768 | 0.0366276922848 |
| DD6 | -0.895311794592 | 0.00511897438848 |
| DVA | -0.9444984613248 | -0.03786769232448 |
| DVB | -0.939951794592 | -0.03580102561152 |
| DVC | -0.951525128256 | -0.03786769232448 |
| FLPL | 0.02336528922816 | 0.00910016529024 |
| FLPR | 0.02498370367872 | 0.00391901232192 |
| HSNL | -0.53873230767552 | 0.00915692308608 |
| HSNR | -0.54178461541056 | 0.0351015384768 |
| IL1DL | 0.12814016529024 | -0.01451107438656 |
| IL1DR | 0.12687802470336 | -0.0100424691456 |
| IL1L | 0.12641851238784 | -0.00098380167552 |
| IL1R | 0.12418370369856 | 0.00244938269376 |
| IL1VL | 0.12912396696576 | 0.01180561980864 |
| IL1VR | 0.11218172842176 | 0.01322666665344 |
| IL2DL | 0.13674842974272 | -0.0157408264512 |
| IL2DR | 0.137410370352 | -0.01396148146752 |
| IL2L | 0.13158347109504 | -0.00295140496704 |
| IL2R | 0.13030716052224 | -0.00073481481408 |
| IL2VL | 0.13404297522432 | 0.01303537187328 |
| IL2VR | 0.12687802470336 | 0.01224691358784 |
| LUAL | -0.9730184615232 | -0.02050769230464 |
| LUAR | -0.9833517947904 | -0.0180276922848 |
| OLLL | 0.128632066128 | -0.0061487603232 |
| OLLR | 0.1290824691456 | -0.00440888888448 |
| OLQDL | 0.12272925619392 | -0.01598677684032 |
| OLQDR | 0.1217343210048 | -0.01224691358784 |
| OLQVL | 0.11608859503296 | 0.00418115703168 |
| OLQVR | 0.114386172864 | 0.00759308639232 |
| PDA | -0.9300317949888 | -0.00025435895808 |
| PDB | -0.9130851284544 | 0.00305230767552 |
| PDEL | -0.6821907691392 | -0.0122092307616 |
| PDER | -0.6928738460928 | 0.02136615384768 |
| PHAL | -0.958551794592 | -0.01596102563136 |
| PHAR | -0.9606184617216 | -0.01678769230464 |
| PHBL | -0.980871794592 | -0.01513435895808 |
| PHBR | -0.9767384615232 | -0.0180276922848 |
| PHCL | -1.0172451284544 | -0.01637435899776 |
| PHCR | -1.0139384615232 | -0.02381435899776 |
| PLML | -1.0250984615232 | -0.0184410256512 |
| PLMR | -1.0230317949888 | -0.01720102561152 |
| Neuron Name | X | Y |
|---|---|---|
| PLNL | -1.0085651280576 | -0.0143076922848 |
| PLNR | -0.970125128256 | -0.01761435897792 |
| PQR | -0.9903784617216 | -0.0143076922848 |
| PVCL | -0.9767384615232 | -0.0403476922848 |
| PVCR | -0.9899651280576 | -0.03042769232448 |
| PVDL | -0.6959261537088 | -0.0122092307616 |
| PVDR | -0.6989784613248 | 0.01831384617216 |
| PVM | -0.7035569230464 | -0.00915692308608 |
| PVNL | -1.0242717947904 | -0.03249435897792 |
| PVNR | -1.018071794592 | -0.0333210256512 |
| PVPL | -0.895725128256 | 0.00966564100224 |
| PVPR | -0.8783651280576 | 0.01338564100224 |
| PVQL | -0.9630984613248 | -0.01926769232448 |
| PVQR | -0.9531784617216 | -0.02422769230464 |
| PVR | -0.9945117947904 | -0.03869435899776 |
| PVT | -0.8824984617216 | 0.0150389743488 |
| PVWL | -0.9990584615232 | -0.0180276922848 |
| PVWR | -1.0077384613248 | -0.03621435897792 |
| RIAL | 0.08952595038912 | -0.00393520658304 |
| RIAR | 0.08989234568832 | -0.004653827136 |
| RIBL | 0.07034181819264 | 0.0044271074208 |
| RIBR | 0.07103209877376 | 0.00514370369856 |
| RICL | 0.05583074380608 | 0.0061487603232 |
| RICR | 0.05290666667328 | 0.00489876544704 |
| RID | 0.09871012345728 | -0.0164108642208 |
| RIFL | 0.00440888888448 | 0.02449382717568 |
| RIFR | 0.01665580247232 | 0.02302419754752 |
| RIGL | -0.0063683950752 | 0.0247387654272 |
| RIGR | 0.0083279012064 | 0.02302419754752 |
| RIH | 0.07993388432064 | 0.009592066128 |
| RIML | 0.06443900825856 | 0.00245950412928 |
| RIMR | 0.0668681481408 | 0.00342913581888 |
| RIPL | 0.12149950412928 | -0.00664066116096 |
| RIPR | 0.12099950619072 | -0.00318419750784 |
| RIR | 0.0695624691456 | 0.00930765433152 |
| RIS | 0.03453629632128 | 0.01616592590976 |
| RIVL | 0.07304727271104 | -0.01820033058048 |
| RIVR | 0.07617580247232 | -0.01690074072384 |
| RMDDL | 0.07895008264512 | 0.00934611567936 |
| RMDDR | 0.07715555553792 | 0.01224691358784 |
| RMDL | 0.08731239670848 | 0.0051649587072 |
| RMDR | 0.0879328394976 | 0.00514370369856 |
| RMDVL | 0.09419900825856 | -0.00295140496704 |
| RMDVR | 0.09724049382912 | -0.00195950619072 |
| RMED | 0.1155966941952 | -0.01795438019136 |
| RMEL | 0.11264528922816 | -0.00295140496704 |
| RMER | 0.11291654323584 | -0.00024493825152 |
| RMEV | 0.09405629632128 | 0.0173906172864 |
| Neuron Name | X | Y |
|---|---|---|
| RMFL | 0.069112066128 | 0.01278942148416 |
| RMFR | 0.07127703702528 | 0.01224691358784 |
| RMGL | 0.00885421490112 | 0.0034433058048 |
| RMGR | 0.00955259258304 | 0.00171456787968 |
| RMHL | 0.07304727271104 | 0.00910016529024 |
| RMHR | 0.0722567901504 | 0.0100424691456 |
| SAADL | 0.07772033058048 | 0.00934611567936 |
| SAADR | 0.07838024691456 | 0.01151209877376 |
| SAAVL | 0.0944449587072 | -0.00590280993408 |
| SAAVR | 0.09454617282432 | -0.0026943210048 |
| SABD | -0.0026943210048 | 0.02424888886464 |
| SABVL | 0.0247387654272 | 0.02228938273344 |
| SABVR | 0.02032987654272 | 0.02277925923648 |
| SDQL | -0.6898215384768 | -0.01068307689408 |
| SDQR | -0.14651076925824 | -0.00305230767552 |
| SIADL | 0.06837421490112 | 0.01082181819264 |
| SIADR | 0.06147950619072 | 0.01494123459264 |
| SIAVL | 0.05189553716352 | 0.0140191735488 |
| SIAVR | 0.05462123455296 | 0.01126716052224 |
| SIBDL | 0.079687933872 | 0.00688661155008 |
| SIBDR | 0.07984987654272 | 0.0073481481408 |
| SIBVL | 0.07427702477568 | 0.01008396696576 |
| SIBVR | 0.073236543216 | 0.00979753083456 |
| SMBDL | 0.0646849587072 | 0.0140191735488 |
| SMBDR | 0.05731555555776 | 0.01690074072384 |
| SMBVL | 0.05952 | 0.01426512393792 |
| SMBVR | 0.06613333332672 | 0.0127367901504 |
| SMDDL | 0.07255537187328 | 0.01328132232192 |
| SMDDR | 0.07078716052224 | 0.0146962962816 |
| SMDVR | 0.09381135801024 | -0.00489876544704 |
| URADL | 0.1313375206464 | -0.01205157025728 |
| URADR | 0.12491851851264 | -0.0083279012064 |
| URAVL | 0.11658049587072 | 0.00934611567936 |
| URAVR | 0.11340641973888 | 0.01126716052224 |
| URBL | 0.12100760329152 | -0.00295140496704 |
| URBR | 0.12222419750784 | -0.00122469137664 |
| URXL | 0.09223140496704 | -0.01180561980864 |
| URXR | 0.09307654319616 | -0.0100424691456 |
| URYDL | 0.12568066116096 | -0.01205157025728 |
| URYDR | 0.13055209877376 | -0.00955259258304 |
| URYVL | 0.12149950412928 | 0.00221355374016 |
| URYVR | 0.12099950619072 | 0.00710320988928 |
| VA1 | -0.0026943210048 | 0.0247387654272 |
| VA10 | -0.8088615384768 | 0.03357538460928 |
| VA11 | -0.7857784617216 | 0.02785230769536 |
| VA12 | -0.8911784615232 | 0.00842564102208 |
| VA2 | -0.07020307689408 | 0.0366276922848 |
| VA3 | -0.14498461539072 | 0.03815384615232 |
| VA4 | -0.23960615386752 | 0.03968000001984 |
| Neuron Name | X | Y |
|---|---|---|
| VA5 | -0.34338461537088 | 0.04273230769536 |
| VA6 | -0.44563692306624 | 0.04273230769536 |
| VA7 | -0.54636307689408 | 0.04273230769536 |
| VA8 | -0.6257230767552 | 0.03968000001984 |
| VA9 | -0.71424 | 0.0366276922848 |
| VB1 | 0.01494123459264 | 0.02400395061312 |
| VB10 | -0.7386584615232 | 0.0366276922848 |
| VB11 | -0.8180184613248 | 0.03357538460928 |
| VB2 | 0.0293925925632 | 0.02351407405056 |
| VB3 | -0.08088615384768 | 0.0366276922848 |
| VB4 | -0.16024615382784 | 0.03815384615232 |
| VB5 | -0.25181538462912 | 0.04120615382784 |
| VB6 | -0.3693292307616 | 0.04273230769536 |
| VB7 | -0.45632000001984 | 0.04273230769536 |
| VB8 | -0.56315076925824 | 0.04120615382784 |
| VB9 | -0.6364061537088 | 0.04120615382784 |
| VC1 | -0.1663507692384 | 0.03815384615232 |
| VC2 | -0.2609723077152 | 0.04120615382784 |
| VC3 | -0.39680000001984 | 0.04273230769536 |
| VC4 | -0.49752615384768 | 0.03815384615232 |
| VC5 | -0.53262769232448 | 0.04273230769536 |
| VC6 | -0.6531938458944 | 0.04120615382784 |
| VD1 | -0.02179950617088 | 0.02424888886464 |
| VD10 | -0.77376 | 0.0366276922848 |
| VD11 | -0.8485415386752 | 0.03357538460928 |
| VD12 | -0.8684451284544 | 0.01751897436864 |
| VD13 | -0.9147384613248 | 0.0001589743488 |
| VD2 | -0.03086222225088 | 0.02424888886464 |
| VD3 | -0.13430153843712 | 0.03815384615232 |
| VD4 | -0.21976615382784 | 0.04120615382784 |
| VD5 | -0.31438769230464 | 0.04273230769536 |
| VD6 | -0.40595692310592 | 0.04425846156288 |
| VD7 | -0.4883692307616 | 0.04120615382784 |
| VD8 | -0.5967261541056 | 0.04273230769536 |
| VD9 | -0.6882953843712 | 0.03815384615232 |