Solar Wind Charge Exchange contribution to the ROSAT All Sky Survey Maps
Abstract
DXL (Diffuse X-ray emission from the Local Galaxy) is a sounding rocket mission designed to estimate the contribution of Solar Wind Charge eXchange (SWCX) to the Diffuse X-ray Background (DXB) and to help determine the properties of the Local Hot Bubble (LHB). The detectors are large-area thin-window proportional counters with a spectral response similar to that of the PSPC used in the ROSAT All Sky Survey (RASS). A direct comparison of DXL and RASS data for the same part of the sky viewed from quite different vantage points in the Solar system and the assumption of approximate isotropy for the Solar wind allowed us to quantify the SWCX contribution to all 6 RASS bands (R1-R7, excepting R3). We find that the SWCX contribution at , where the DXL path crosses the Galactic plane is for R1, for R2, for R4, for R5, and negligible for R6 and R7 bands. Reliable models for the distribution of neutral H and He in the Solar system permit estimation of the contribution of interplanetary SWCX emission over the the whole sky and correction of the RASS maps. We find that the average SWCX contribution in the whole sky is for R1, for R2, for R4, for R5, and negligible for R6 and R7.
1. Introduction
The ROSAT All-Sky Survey (RASS) provides the best maps of the soft diffuse X-ray background (Snowden et al., 1997). These maps are consistent with previous all-sky measurements of the diffuse background but have far superior statistics and angular resolution, and after more than 20 years are still the benchmark for all diffuse emission studies at energies less than 2 keV.
It was widely accepted that the diffuse X-ray flux observed in the 1/4 keV (R12) band originated largely in a 100 parsec (pc) scale million-degree interstellar plasma in the Local Hot Bubble (LHB) with a significant contribution at high latitudes from patches of million-degree emission in the Galactic Halo (McCammon & Sanders, 1990; Kuntz & Snowden, 2000; Bellm & Vaillancourt, 2005). The 3/4 keV (R45) band arises in K plasma located more extensively throughout the Galactic disk and halo, with 30-50% of the flux at intermediate and high latitudes due to AGN and a modest but poorly-determined contribution due to stars close to the Galactic plane and toward the center (Snowden et al., 1997; Mushotzky et al., 2000). Shadowing studies using molecular clouds located near the outer boundary of the LHB showed that most of the observed R45 flux originated beyond these clouds, and that the several percent that was “local” was concentrated in the OVII lines near the low-energy limit of the band (Snowden, 1993; Smith et al., 2007; Henley & Shelton, 2008; Gupta et al., 2009). The X-ray flux in the R67 bands above 1 keV is thought to be almost entirely from AGN.
During the course of the six-month ROSAT survey it became apparent there was a significant source of background that was strongly variable on a time scale of several hours to a couple of days in the R12 and R45 bands (Snowden et al., 1994). The source was unknown, but since the time variation was short compared to the observing time for each part of the sky, these “long-term enhancements” (LTEs) could be empirically removed. The good agreement with the zero points of earlier surveys gave some confidence that there were no large residuals (Snowden et al., 1995). Much later, after the discovery of X-ray emission from comets (Lisse et al., 1996), it was recognized that the LTEs were largely due to Solar Wind Charge eXchange (SWCX) in the outermost parts of the Earth’s geocorona (Geocoronal SWCX)(Cox, 1998; Cravens et al., 2001). SWCX refers to the process by which the heavy ions of the solar-wind pick up electrons from neutrals (mostly H or He) to emit EUV or low energy X-rays (Cravens, 1997). It was soon realized that there would also be X-rays from SWCX on interstellar neutral H and He passing through interplanetary space (Heliospheric SWCX) (Cox, 1998). However, the much slower time variations in this component due to the extended spatial distribution of the target neutrals largely precluded its being removed in the survey analysis.
Despite numerous efforts, an accurate estimation of the heliospheric SWCX contribution has been hindered by the poorly known cross sections for producing the many X-ray lines from SWCX, limited data on heavy ion fluxes in the Solar wind, and the general spectral similarity of SWCX and thermal emission. The best current calculations show that SWCX could generate anywhere from 25% to 100% of the R12 band emission in directions of the minimum observed flux, e.g., the Galactic plane (Cravens, 2000; Koutroumpa et al., 2009b). As a result, studies of soft X-ray emission from the ISM and beyond were plagued by the uncertainty of an unknown SWCX contribution, and even the existence of the LHB was held by some to be in doubt (e.g., Welsh & Shelton (2009)).
The DXL mission was designed to reduce these uncertainties by direct measurement of the interplanetary SWCX contribution (Galeazzi et al., 2011, 2012; Thomas et al., 2013; Galeazzi et al., 2014; Uprety, 2015). This was done by comparing the X-ray flux measured during a scan across a high density feature in the interstellar neutral distribution called the “helium focusing cone” with observations of the same part of the sky made 22 years and 3 months earlier during the ROSAT survey, when the lines of sight passed through more typical parts of the solar system. Given well-established models for the 3-dimensional distribution of neutral H and He in interplanetary space (Koutroumpa et al., 2006; Lallement et al., 1985a, b, 2004), all of the highly uncertain atomic parameters for production of many X-ray lines by charge exchange and the poorly known fluxes of various heavy ions in the solar wind could be rolled into a single parameter to be fit to the data (see § 3). An additional parameter was introduced to allow for differences in the Solar wind flux between the ROSAT and DXL observations. The model has to assume isotropy of the Solar wind, but both ROSAT and DXL observations were made close to maximum of the Solar cycle where this is not unreasonable, particularly for the small region near the ecliptic plane where the observations were made.
Our initial analysis of these measurements indicates that SWCX contributes about 40% of the R12 band on the Galactic plane near , where the R12 flux is close to its minimum value (Galeazzi et al., 2014). In this paper we extend these results to the other RASS bands, and use the best fit coefficients for the atomic and Solar wind characteristics to predict interplanetary SWCX contributions to the RASS maps over the entire sky. In § 2 we briefly describe the characteristics of the DXL mission, in § 3 we focus on the data analysis, § 4 contains the result of the investigation, and conclusions are discussed in § 5.
2. DXL
The technical details of the DXL mission were extensively described in Galeazzi et al. (2011). To summarize, DXL is a sounding rocket mission designed to measure the contributions of the LHB and SWCX through the spatial signature of their emission. The main instrument on the payload is DXL, which consists of two large area proportional counters mounted on an aluminum frame and supported by the rocket skin. The instrument was inherited and refurbished from the Wisconsin All Sky Survey program (McCammon et al., 1983). The payload also carried the first prototype of a wide field-of-view soft X-ray camera using micropore reflector technology (Collier et al., 2015). DXL was successfully launched from White Sands Missile Range in New Mexico on December 12, 2012.
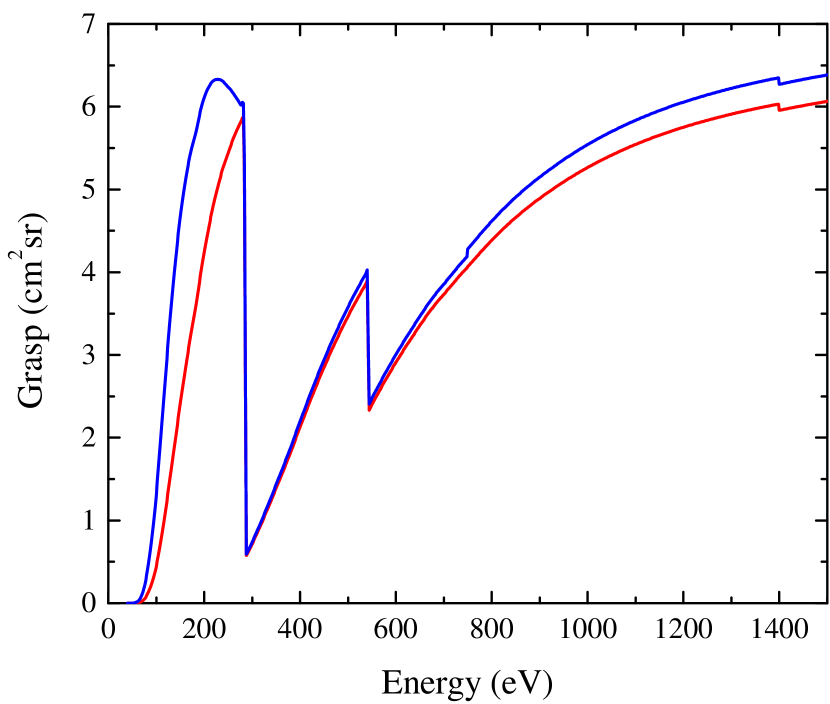
The DXL instrument is composed of two co-aligned, large area ( cm2 physical area per counter) proportional counters (CI and CII) that provide excellent counting statistics when scanning the sky in the limited observing time of a sounding rocket flight. The grasps of the two DXL counters are shown in Figure 1. When coupled with the optics ( FWHM mechanical collimators, electron blocking magnets, and carbon-based thin windows with supporting mesh for the proportional counter gas), the grasp (effective area-solid angle product) of each counter in the 1/4 keV range is 6 cm2 sr.
The counters use a wire-wall design and are filled with P10 gas (90% Argon, 10% methane) at about 800 Torr. The X-rays are mechanically collimated using 2.5 cm thick, 3 mm cell honeycomb. Ceramic magnets embedded in the collimator provide a magnetic field of 150 Gauss within and above the collimators which intercept electrons that could either generate X-rays when impacting the collimator structure, or mimic X-ray events in the detectors. The detector employs a three-sided veto for cosmic-ray rejection using anodes at the sides and back of each main counter.
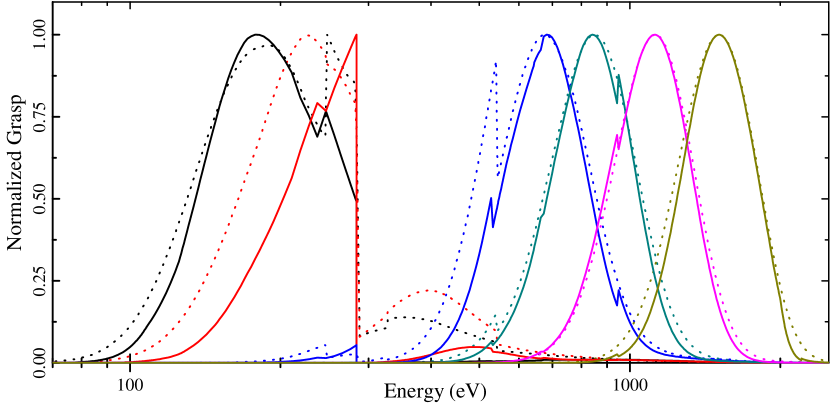
One side of each counter, facing the mechanical collimators, is covered with a thin X-ray window (25 cm 50 cm). For the first DXL flight, we used thin (80-90 mg cm-2) plastic windows supported by a 25 m thick, 100 lines-per-inch nickel mesh to retain the counter gas while allowing soft X-ray photons to enter the counter. The windows are composed of Formvar (the registered trade name of the polyvinyl formal resin produced by Monsanto Chemical Company) with an additive, Cyasorb UV-24 made by American Cyanamide, to absorb stellar ultraviolet photons that could otherwise generate a large non-X-ray background. The windows were originally manufactured for the DXS shuttle mission (Sanders et al., 2001) and DXL used the spares that remained preserved. The windows were completely re-calibrated for the DXL mission. While the energy resolution of the proportional counters is relatively poor, the carbon edge at 0.284 keV in the filter response allows a clear separation of the events into different bands, roughly corresponding to those used for the RASS. Figure 2 shows the normalized DXL (D1-D7) and RASS (R1-R7) bands for comparison.
To separate the SWCX contribution from the other components of the DXB, the DXL mission uses the spatial signature of SWCX emission due to the “He focusing cone”, a higher neutral He density region downwind of the Sun (Michels et al., 2002). Neutral interstellar gas flows at 25 km s-1 through the solar system due to the relative motion of the Sun and the local interstellar cloud. This material, mostly hydrogen atoms with about 15% helium, flows from the Galactic direction (l,b)(3∘,16∘), placing the Earth downstream of the Sun in early December. The trajectories of the neutral interstellar helium atoms are governed primarily by gravity, executing hyperbolic Keplerian orbits and forming a relatively high-density focusing cone downstream of the Sun about 6∘ below the ecliptic plane. Interstellar hydrogen, on the other hand, also experiences significant impact from radiation pressure and ionization, creating a neutral hydrogen cavity around the Sun, with negligible focusing.
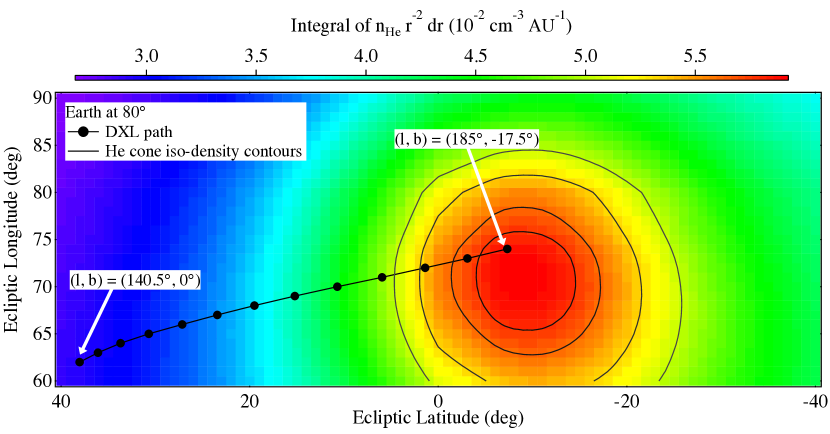
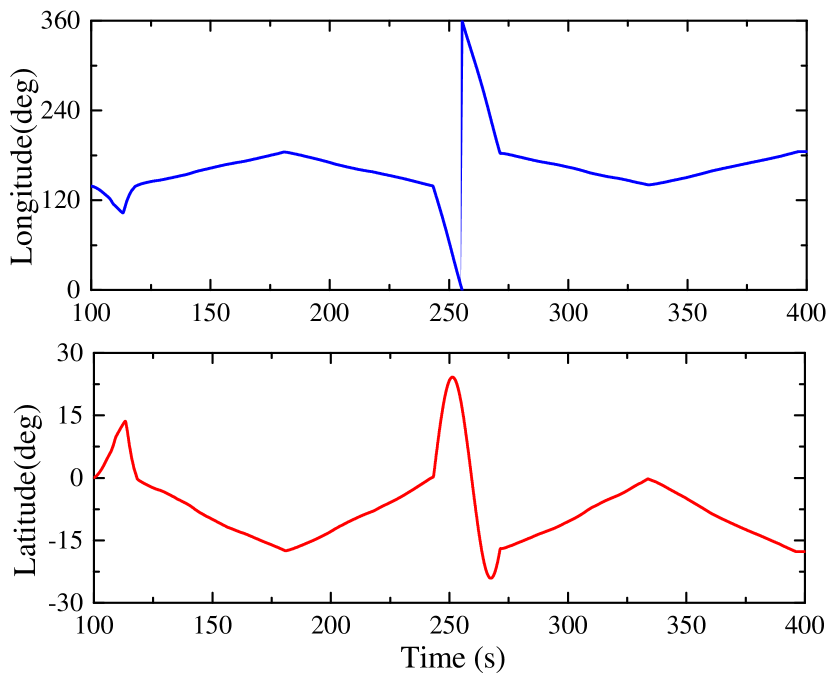
To maximize the signal from SWCX, DXL started scanning from , to and returned, to scan through the predicted location of the He focusing cone twice (Figure 3). It then performed a fast 360 degree scan of the sky to normalize the data outside the cone and to estimate the instrument background (while looking at the Earth). After the fast scan, the mission again performed two slow scans between , and (Galeazzi et al., 2014). Figure 4 shows the center of the DXL scan path as a function of time during launch.
3. Data Analysis
Both DXL and ROSAT measured a combination of SWCX and non-SWCX emission. For the December 2012 DXL observation, the Earth was in the He focusing cone and the line of sight was chosen to pass close the greatest SWCX contribution from the focusing cone, while avoiding bright point sources. The ROSAT observation in the same direction, taken from the RASS occurred in September of 1990, when the Earth-Sun line was perpendicular to the He focusing cone. The RASS line of sight at that time did not pass through the focusing cone (although it did, like all lines of sight include heliospheric SWCX emission). Thus the DXL and ROSAT data contain the same cosmic emission but very different levels of SWCX emission. Given a model of the neutral density distribution in the heliosphere and measurements of the solar wind flux during both observations, one can solve for the true cosmic emission.
The DXL scan path was designed to run close to the Galactic plane to minimize any non-local contribution to the diffuse X-ray emission. For both DXL and ROSAT, the observed flux () contains contributions from the heliospheric SWCX () and the non-SWCX (mostly LHB - ) emission. The ROSAT data may also include residual Geocoronal SWCX (), although Kuntz et al. (2015) has shown that this residual is small. Any Geocoronal contribution to DXL is negligible due to the look direction, which is directly away from the Sun. We can therefore write the flux for each mission as a function of the pointing direction () as:
| (1) |
where the SWCX count rate is the integral along the line of sight of the product of the ion flux, neutral densities, cross sections for producing charge exchange, and the efficiency summed over all of the lines that fall within the bandpass:
| (2) |
where represents the solar wind species and the emission lines for the species, is the neutral-dependent interaction cross sections for individual species, is the neutral-dependent line branching ratio, is the instruments response to line , and is the relative speed between solar wind and neutral flow (the quadrature sum of bulk and thermal velocities). With ion density in terms of the proton density at , and assuming that it scales as one over the distance from the Sun squared and that solar wind ion neutralizations are minimal, we can define the compound cross-section as (Galeazzi et al., 2014) :
| (3) |
In the case of constant solar-wind conditions, the solar-wind flux can be removed from the integrals, and the total charge exchange rate with H and He can be written as:
| (4) |
where is the integrated neutral column density along the line of sight, weighted by one over the distance from the Sun squared to reflect the dilution of the solar wind as it flows outward. Note that in the equation above, the assumed stationarity of the ion flux is an approximation because the flux is known to vary strongly on timescales of about a day. These fluctuations, however, are smoothed when averaging over the few-week transit time through the relevant interplanetary region, as is evident from the very good agreement between sky surveys performed by different missions in different years (Snowden et al., 1995). We can therefore approximate the time dependent parameters and as isotropic and “constant” in time for the duration of each observation, but assume that they can change by a collective adjustable factor over the 20-year interval between the DXL and ROSAT observations.
For simplicity, we can then rewrite Eq. 4 in terms of two parameters:
| (5) |
where
| (6) |
depends on the solar wind properties and the cross section with neutrals, and
| (7) |
depends on the pointing direction and the ratio between cross sections with H and He.
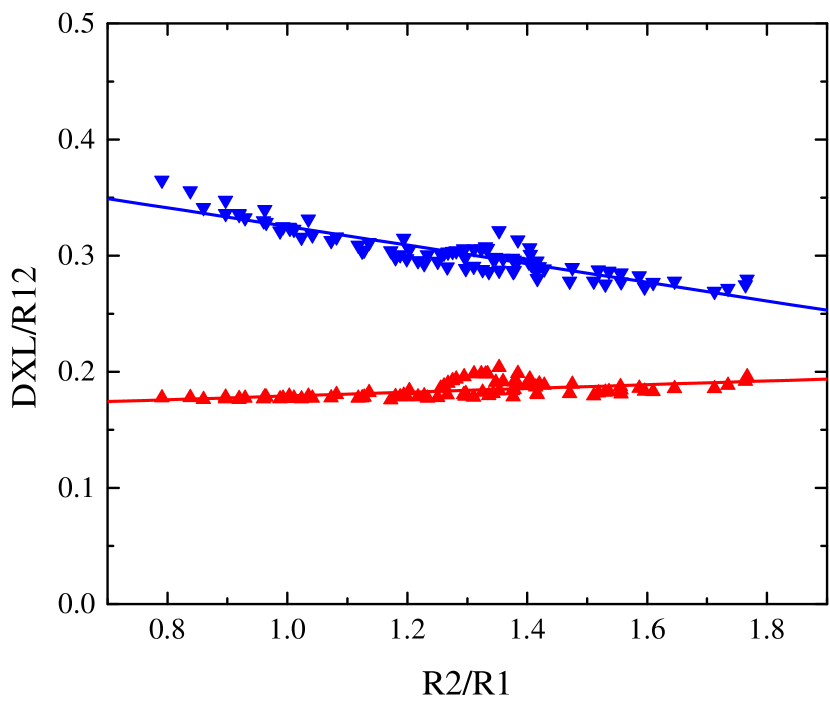
Direct comparison of DXL and RASS count rates would require, in general, detailed instrument responses as well as the spectral shape of the emission. However, because the DXL and RASS responses are very similar, the ratio can be parametrized by a single parameter. For example, the ratio between the DXL D1+D2 and the RASS R1+R2 count rates is adequately parameterized as a function of R2/R1, almost independently of the underlying spectral model or abundance ratios (see Fig. 5). The DXL to RASS count rate ratio shown in Fig. 5 as a function of R2/R1 was calculated from spectral model fits to the RASS data along the DXL scan path. The model included an unabsorbed thermal component (SWCX+LHB), an absorbed thermal component (Galactic halo), and an absorbed power law (unresolved point sources). We evaluated the neutral hydrogen column density value, required to model the absorption coefficient, using the Infrared Astronomy Satellite (IRAS) 100 m data. For the contribution of unresolved point sources, we used a power law with photon index fixed at 1.4 (Masui et al., 2009; Yoshino et al., 2009). For the unabsorbed component, we tested the APEC (Smith et al., 2001), MEKAL (Mewe et al., 1985, 1986; Liedahl et al., 1995) and Raymond-Smith (Raymond & Smith, 1977) thermal models111http://www.atomdb.org/, and Savage & Sembach (1996) and Anders & Grevesse (1989) abundance models. Once we had determined the best fit, we varied the foreground LHB+SWCX component over a wide range of temperatures and abundances to determine the dependence of the conversion function from ROSAT to DXL upon R2/R1 (, shown in Fig. 5). Similar procedures have been used for the individual R1 and R2 band, R4 and R5 (using the R5/R4 ratio), and R6 and R7 (using the R7/R6 ratio).
We can then rewrite Eq. 1 as:
| (8) |
| (9) |
where is a constant parameter to account for differences between the laboratory measured response function and the flight response (should be consistent with 1). Notice that in Eq. 9 the parameter is a function of , , or , depending on the band that is being fit.

For the analysis of the data, we reduced the DXL data for each band as a function of Galactic longitude (a good proxy for scan path) using 1 degree bins along the slow scan path, and 5 degree bins along the fast scan path. We also extracted ROSAT data in the six bands for direct comparison with DXL. The ROSAT rates were weighted over the DXL collimators using the same set of longitude bins used for DXL. Since the RASS data as published no longer contain the point sources, point source count rates were added to the ROSAT rates prior to data fitting to account for the contribution of the point sources to the DXL rates. The point source rates were obtained from the ROSAT bright and faint source catalog in the DXL look direction.222http://www.xray.mpe.mpg.de/rosat/survey/. The source rates were weighted by the DXL collimator response, and corrected for vignetting before adding to the RASS band rates. We found that the point sources contribute between 1% and 5% to the R12 band, and between 2% and 15% to the R45 band along the DXL scan path.
Following the fitting procedure of Galeazzi et al. (2014) we performed a simultaneous fit to both DXL counters using Eqs. 8 and 9. We used, as free parameters, the constants and for each counter, the RASS SWCX parameter , and the ratio . Note that we decided to use instead of as it simplifies the fitting procedure and can be more easily interpreted (it is just a constant accounting for the difference in solar wind flux between the time of the DXL and ROSAT measurements). According to solar wind data from NASA’s multi-source solar wind database OMNI333http://omniweb.gsfc.nasa.gov, should be close or slightly smaller than 1, as solar wind flux was somewhat weaker during the DXL campaign).
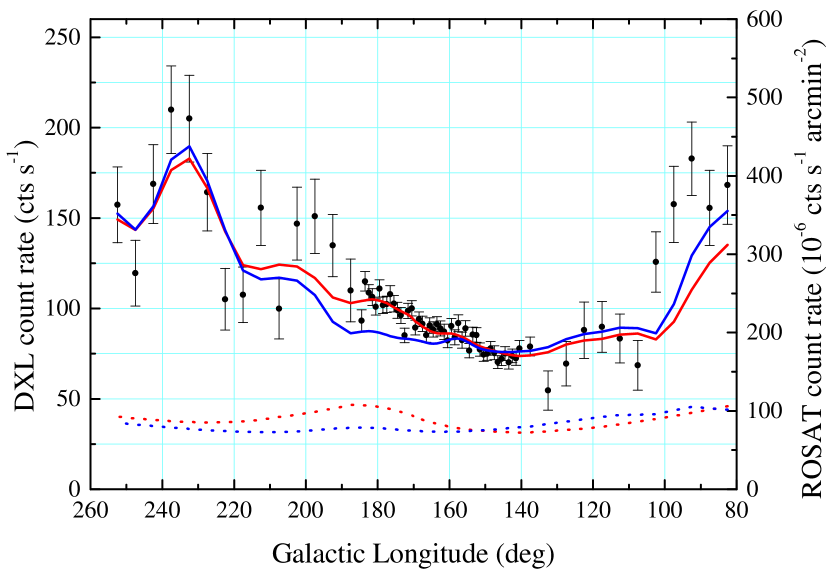
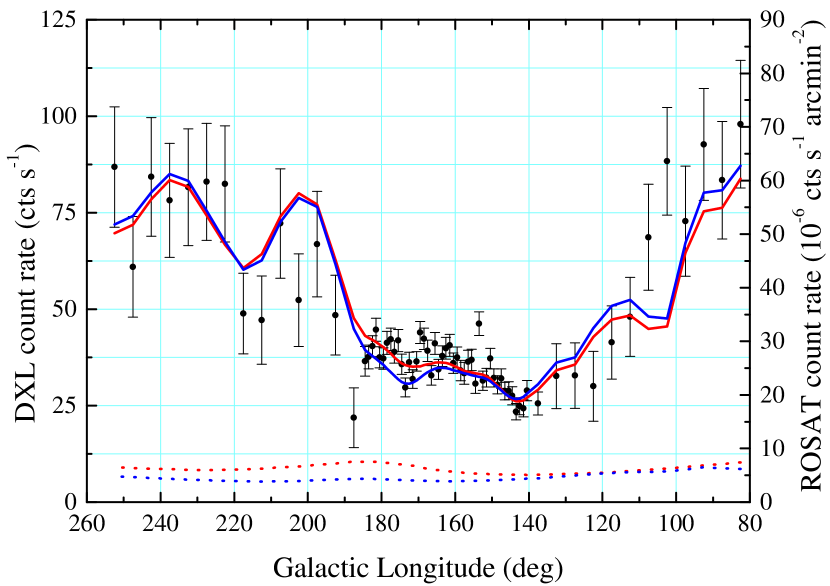
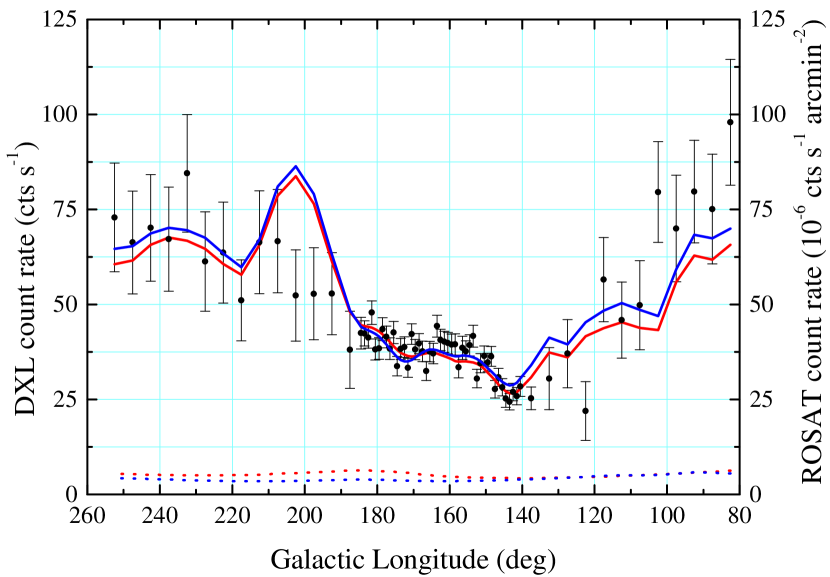
The ROSAT (solid blue line) count rates for R1, R2, R4 and R5 bands, and DXL (black dots) count rates for D1, D2, D4 and D5 bands are plotted against Galactic longitude in figures 6 through figure 9. The respective figures also show the best fit lines (solid red) to DXL data, along with SWCX contributions to DXL (dashed red) and ROSAT (dashed blue) bands.
| Parameter444Errors are 1 sigma | |||||||
|---|---|---|---|---|---|---|---|
| 1 | 1 | 2 | 2 | 4 | 6 | 8 | |
| 0 | 50 | 0 | 50 | 0 | 0 | 0 | |
| 0.900.06 | 0.940.06 | 0.860.07 | 0.910.07 | 0.800.07 | 0.770.07 | 0.760.07 | |
| 0.990.07 | 1.040.07 | 0.950.07 | 1.010.07 | 0.880.08 | 0.850.08 | 0.840.08 | |
| (RU cm3 AU) | 5259764 | 3052721 | 4126494 | 2712465 | 3418423 | 3212536 | 3027564 |
| 0.44 0.09 | 0.650.19 | 0.530.12 | 0.740.19 | 0.700.14 | 0.770.12 | 0.790.11 | |
| (136 d.o.f) | 226 | 215 | 224 | 213 | 221 | 217 | 216 |
| On plane SWCX (RU)555(ROSAT Units = counts s-1 arcmin-2) | 12418 | 12217 | 12315 | 13114 | 14618 | 17930 | 20839 |
| Parameter666Errors are 1 sigma 777The results shown are calculated using =2, RU for the R12 band, RU for the R1 band, RU for the R2 band, and RU for all other bands. | R1 | R2 | R12 | R4 | R5 | R45 |
|---|---|---|---|---|---|---|
| 0.840.10 | 0.860.08 | 0.910.07 | 0.940.08 | 1.030.10 | 1.020.06 | |
| 0.920.11 | 1.10.11 | 1.010.07 | 1.120.09 | 0.910.08 | 1.030.06 | |
| (RU cm3 AU)888Using data from the WIND satellite we calculated the DXL solar wind proton flux . | 1040352 | 1810341 | 2712465 | 12379 | 144113 | 218131 |
| 1.000.48 | 0.760.20 | 0.740.19 | 1.000.51 | 1.000.64 | 1.000.48 | |
| (136 d.o.f) | 184 | 181 | 213 | 238 | 221 | 359 |
| SWCX999Statistical errors are 1 sigma, systematic errors are absolute. 101010The results shown are calculated using =2, RU for the R12 band, RU for the R1 band, RU for the R2 band, and RU for all other bands. | R1 | R2 | R12111111The R12 and R45 results come from independent fits of the data in the two combined bands and are consistent with the sum of the SWCX contribution from the individual bands. | R4 | R5 | R4514 |
| (RU) | 561120 | 79107 | 1311430 | 422 | 443 | 744 |
| (%) | 33612 | 4465 | 3848 | 181211 | 14119 | 1388 |
| SWCX121212Statistical errors are 1 sigma, systematic errors are absolute. 131313The results shown are calculated using =2, RU for the R12 band, RU for the R1 band, RU for the R2 band, and RU for all other bands. 141414The all-sky average were derived from the values of and R from Table 2 and the model of the neutral distribution from Koutroumpa et al. (2006) | R1 | R2 | R12 | R4 | R5 | R45 |
| All-sky average (RU) | 701533 | 1031514 | 1682053 | 534 | 655 | 967 |
| All-sky average (%) | 26613 | 3044 | 2739 | 855 | 765 | 644 |
4. Results
4.1. DXL Results
The result for the combined RASS R12 band has already been reported and discussed in Galeazzi et al. (2014). Here we report our results on all the RASS individual bands and their implications. In Galeazzi et al. (2014), two possible contributions from geocoronal SWCX and two different ratios of H to He compound cross-sections were used. For this work, we also tested different values of the contribution from geocoronal SWCX to the individual R1 and R2 bands, and we tested different values of the H to He compound cross-section ratio from 1 to 8, as there is theoretical indication that the ratio may be higher than the maximum value of 2 considered in the previous analysis. (Vasili Kharchenko, private communication). The comparison between Galeazzi et al. (2014) and Kuntz et al. (2015) also indicates that the ratio may be higher. The fit result depends weakly on the ratio , preventing us from successfully fitting independently for and . For example, in the R12 band, the SWCX contribution on the Galactic plane slowly changes by less than a factor of 2 while the ratio is increased by a factor of 8. Table 1 shows the individual parameters for some of the combinations in R12 band. Similar or weaker trends have been found in all other bands. As a consequence, from here on, we show one nominal set of values and include the variation due to different values of and in the systematic error (up to a ratio of 4). The systematic error also includes uncertainties in the laboratory calibration (represented by and ), differences in the response function between ROSAT and DXL (represented by ), and the effect of the data range used for the fits (for example, using only the slow scan region vs. the full scan, half the data, etc.).
As expected, the SWCX contribution to the RASS R6 and R7 bands was found to be compatible with zero, therefore, for the rest of this paper, we focus only on the R1-R5 bands.
The fitting parameters obtained in all the bands are presented in Table 2. The table shows the representative data for the condition when the ratio of H to He cross-sections was 2 and the geocoronal contribution to the RASS was assumed to be RU (ROSAT Units or counts s-1 arcmin-2) for the R12 band - evenly split between the two bands - and 0 RU for the R45 band. As we previously discussed, changes in the results due to different assumptions are included in the systematic error (up to a ratio =4). Following the same convention used in Galeazzi et al. (2014), the parameters and are the ratios of the fitted DXL response to the nominal value from laboratory conditions for the two DXL counters. The errors in the table are 1 . We note that the values of are larger than optimal. The DXL mission was designed to focus on the slow scan region, as it is the region that constrains the SWCX to LHB ratio near the Galactic plane. In that region the reduced is well within statistically acceptable values for all fits. However, outside the slow scan region, particularly at very low longitude, there are additional effects not included in the model that affect the value of , but do not affect the result of the investigation (this was verified by using different fitting ranges).
To better understand the contribution of SWCX to the RASS bands and, more in general, to the diffuse X-ray emission, we use the parameters from Table 2 to calculate both absolute (in RU) and fractional SWCX rates. In particular, in Table 3 we report the SWCX contribution at , , which is were the DXL scan path intersects the Galactic plane. We point out that, according the the ROSAT maps, this is a point where the total diffuse X-ray emission is close to the minimum across the whole sky, and where we therefore expect the highest relative SWCX contribution. Although we used an independent (and slightly different) procedure to reduce the data, the results in the combined R12 band are consistent with those already reported in Galeazzi et al. (2014). In the R12 band, we find that the total SWCX contribution is RU at the Galactic plane. The combined SWCX contribution is of the ROSAT count rate at the location.
4.2. Extrapolating the DXL Results
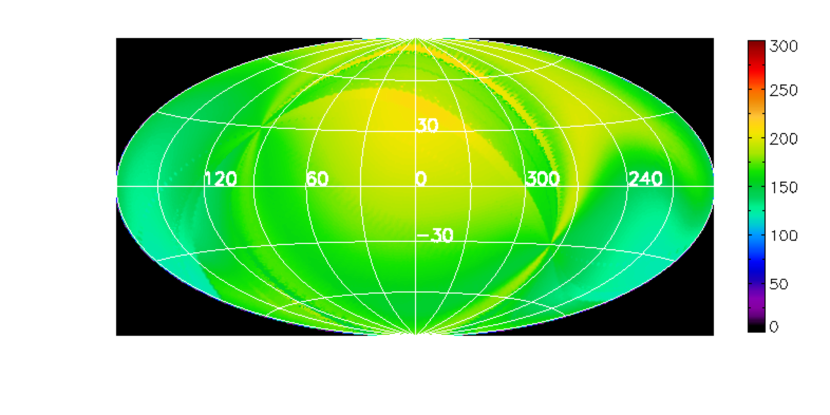
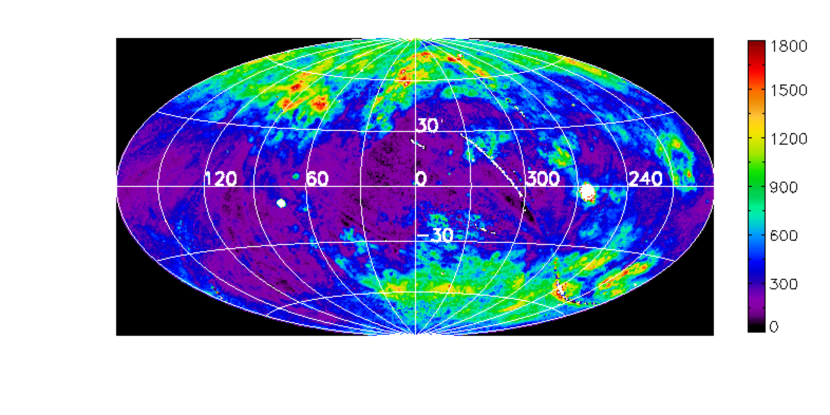
We also used the expected distribution of neutral H and He from Koutroumpa et al. (2006) to estimate the SWCX contribution over the whole sky (Table 4). The composite emission coefficients fit in the area of the DXL scan were used for all directions and for the six month duration of the survey, placing considerably more stress on the assumptions of isotropy and constancy in time of the Solar wind. The systematic uncertainties given for the all-sky averages do not include these additional factors, but since the Solar wind is expected to be most isotropic at Solar maximum when the survey was performed, we estimate that these are small compared to those from the poorly constrained ratio of . The model for the 3-D distribution of neutral H and He over the Solar system has been tested by Solar backscatter and direct in-situ measurements and should not be a major contributor to the uncertainties. Using this method, the Aitoff-Hammer projection of SWCX contribution in the RASS R12 band is presented in Figure 11. The estimated all-sky average emission from SWCX in the R12 band is RU, which is of the total R12 emission. We have also used the estimated SWCX emission of Figure 11 to remove its contribution from RASS. The “cleaned” ROSAT R12 map is shown in Figure 11.
Similarly, in the R45 band, the SWCX contributions at , is RU, or of the observed ROSAT counts. As most charge exchange models indicate that the SWCX contribution to the R45 band is dominated by oxygen emission (mostly OVII), we also used this result to get upper limits on the SWCX OVII+OVIII emissions. Specifically, if we assume that all the R45 SWCX emission is due to OVII+OVIII, we can set an upper limit on the emission of LU. This is consistent with predictions from Koutroumpa et al. (2009a) and with observations in the shadows of nearby molecular clouds (Gupta et al., 2009; Henley & Shelton, 2013) showing that the small residual contribution to the R45 band from less than the 150 pc distances to these clouds is dominated by OVII line emission. Both the apparent variability of these lines in multiple observations of the same cloud and the very small OVII fluxes predicted by the best emission model fits to the LHB suggest that this is largely SWCX emission. Using the average temperature of 0.0903 keV for the LHB, and an emission measure of cm-6 pc from Liu et. al. (in preparation - see also Snowden et al. (2014)), we calculated that the LHB contributes about 0.37 LU to OVII+OVIII, or 3 RU to the R45 on the Galactic plane, which is 4% of the average ROSAT rate on the plane. The bulk of the R45 flux must come from non-local emission, identified with Galactic Halo or non-Galactic emission at high latitude. The origin of the bulk of R45 emission on the Galactic plane (where Galactic Halo and non-Galactic emission are absorbed) remains an open question. It seems that an additional, not yet identified source of X-rays must be responsible for about 90% of the total emission on the Galactic plane in the R45 band. This is a long-standing issue in X-ray astronomy, pre-dating the discovery of SWCX (McCammon & Sanders, 1990).
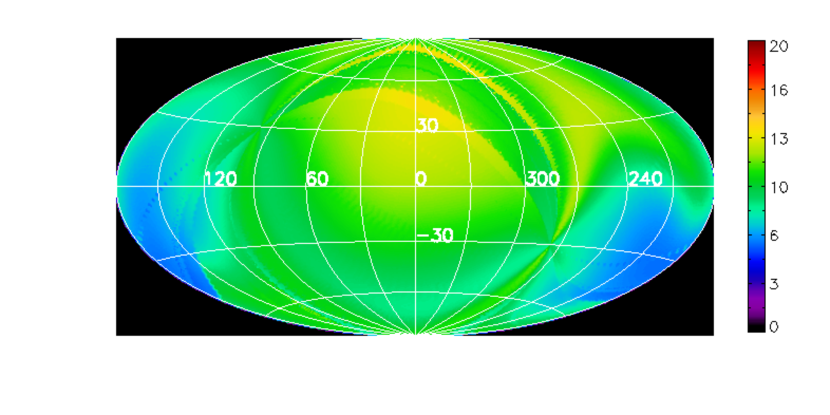
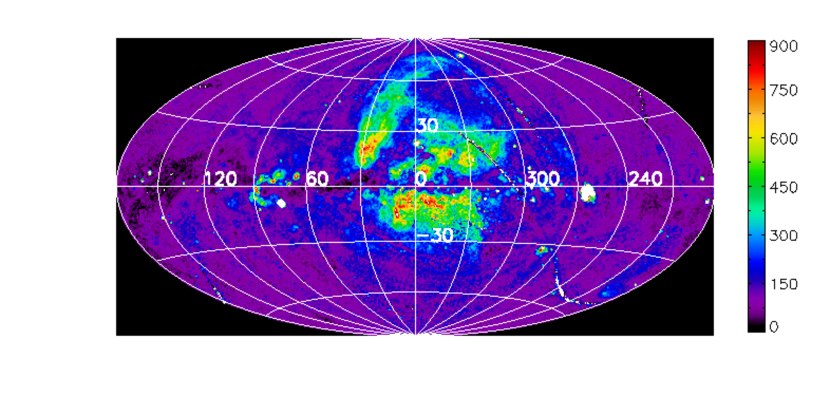
The Aitoff-Hammer projection of the SWCX contribution to the RASS R45 band is presented in Figure 13. We updated the ROSAT R45 map by removing the SWCX emission as shown in Fig. 13. Notice that the contribution from SWCX is very small, and its effect on the RASS map is barely noticeable. When extrapolated over the whole sky, the average SWCX contribution is RU, or of the total observed rate.
We also used the “AtomDB Charge Exchange (ACX)” model (Smith et al., 2014) to compare our result with the analysis performed by Smith et al. (2014) using data from the mission (Sanders et al., 2001). Specifically, we performed a global fit to our estimated all-sky SWCX contribution to the R1-R5 bands with “solar wind temperature” (i.e., the temperature of the solar corona responsible for the solar wind) and normalization as free parameters. We find a solar wind temperature of K, within the range of temperatures obtained by Smith et al. (2014). However, we note that Smith et al. (2014) find that SWCX is the main contributor to the total 0.1-0.4 keV flux, with the LHB contributing only 26%4%, which is inconsistent with the results reported here and in Galeazzi et al. (2014). Smith et al. (2014) relied on an extremely approximate model of the charge exchange spectrum (due to the lack of good atomic data), and errors in the underlying model could have caused the discrepancy.
5. Conclusions
Using data from the DXL sounding rocket mission, we have made quantitative estimates of the SWCX contribution to the RASS maps of the diffuse X-ray background. This contribution was removed from the RASS maps to produce “clean” maps of the interstellar and extragalactic diffuse emission. Averaged over the sky, we found about 27% of the observed flux in R12 and 6% in R45 is due to SWCX. Even at a point in the Galactic plane where the observed fluxes are near their absolute minimum values, SWCX accounts for 38% of the R12 band and 13% of R45.
References
- Anders & Grevesse (1989) Anders, E., & Grevesse, N. 1989, Geochim. Cosmochim. Acta, 53, 197
- Bellm & Vaillancourt (2005) Bellm, E. C., & Vaillancourt, J. E. 2005, ApJ, 622, 959
- Collier et al. (2015) Collier, M. R., Porter, F. S., Sibeck, D. G., et al. 2015, Review of Scientific Instruments, 86, 071301
- Cox (1998) Cox, D. P. 1998, in Lecture Notes in Physics, Berlin Springer Verlag, Vol. 506, IAU Colloq. 166: The Local Bubble and Beyond, ed. D. Breitschwerdt, M. J. Freyberg, & J. Truemper, 121–131
- Cravens (1997) Cravens, T. E. 1997, Geophys. Res. Lett., 24, 105
- Cravens (2000) —. 2000, ApJ, 532, L153
- Cravens et al. (2001) Cravens, T. E., Robertson, I. P., & Snowden, S. L. 2001, J. Geophys. Res., 106, 24883
- Galeazzi et al. (2011) Galeazzi, M., Chiao, M., Collier, M. R., et al. 2011, Experimental Astronomy, 32, 83
- Galeazzi et al. (2012) Galeazzi, M., Collier, M. R., Cravens, T., et al. 2012, Astronomische Nachrichten, 333, 383
- Galeazzi et al. (2014) Galeazzi, M., Chiao, M., Collier, M. R., et al. 2014, Nature, 512, 171
- Gupta et al. (2009) Gupta, A., Galeazzi, M., Koutroumpa, D., Smith, R., & Lallement, R. 2009, ApJ, 707, 644
- Henley & Shelton (2008) Henley, D. B., & Shelton, R. L. 2008, ApJ, 676, 335
- Henley & Shelton (2013) —. 2013, ApJ, 773, 92
- Koutroumpa et al. (2009a) Koutroumpa, D., Collier, M. R., Kuntz, K. D., Lallement, R., & Snowden, S. L. 2009a, ApJ, 697, 1214
- Koutroumpa et al. (2006) Koutroumpa, D., Lallement, R., Kharchenko, V., et al. 2006, A&A, 460, 289
- Koutroumpa et al. (2009b) Koutroumpa, D., Lallement, R., Raymond, J. C., & Kharchenko, V. 2009b, ApJ, 696, 1517
- Kuntz & Snowden (2000) Kuntz, K. D., & Snowden, S. L. 2000, ApJ, 543, 195
- Kuntz et al. (2015) Kuntz, K. D., Collado-Vega, Y. M., Collier, M. R., et al. 2015, ApJ, 808, 143
- Lallement et al. (1985a) Lallement, R., Bertaux, J. L., & Dalaudier, F. 1985a, A&A, 150, 21
- Lallement et al. (1985b) Lallement, R., Bertaux, J. L., & Kurt, V. G. 1985b, J. Geophys. Res., 90, 1413
- Lallement et al. (2004) Lallement, R., Raymond, J. C., Vallerga, J., et al. 2004, A&A, 426, 875
- Liedahl et al. (1995) Liedahl, D. A., Osterheld, A. L., & Goldstein, W. H. 1995, ApJ, 438, L115
- Lisse et al. (1996) Lisse, C. M., Dennerl, K., Englhauser, J., et al. 1996, Science, 274, 205
- Masui et al. (2009) Masui, K., Mitsuda, K., Yamasaki, N. Y., et al. 2009, PASJ, 61, S115
- McCammon et al. (1983) McCammon, D., Burrows, D. N., Sanders, W. T., & Kraushaar, W. L. 1983, ApJ, 269, 107
- McCammon & Sanders (1990) McCammon, D., & Sanders, W. T. 1990, ARA&A, 28, 657
- Mewe et al. (1985) Mewe, R., Gronenschild, E. H. B. M., & van den Oord, G. H. J. 1985, A&AS, 62, 197
- Mewe et al. (1986) Mewe, R., Lemen, J. R., & van den Oord, G. H. J. 1986, A&AS, 65, 511
- Michels et al. (2002) Michels, J. G., Raymond, J. C., Bertaux, J. L., et al. 2002, ApJ, 568, 385
- Mushotzky et al. (2000) Mushotzky, R. F., Cowie, L. L., Barger, A. J., & Arnaud, K. A. 2000, Nature, 404, 459
- Raymond & Smith (1977) Raymond, J. C., & Smith, B. W. 1977, ApJS, 35, 419
- Sanders et al. (2001) Sanders, W. T., Edgar, R. J., Kraushaar, W. L., McCammon, D., & Morgenthaler, J. P. 2001, ApJ, 554, 694
- Savage & Sembach (1996) Savage, B. D., & Sembach, K. R. 1996, ARA&A, 34, 279
- Smith et al. (2001) Smith, R. K., Brickhouse, N. S., Liedahl, D. A., & Raymond, J. C. 2001, ApJ, 556, L91
- Smith et al. (2014) Smith, R. K., Foster, A. R., Edgar, R. J., & Brickhouse, N. S. 2014, ApJ, 787, 77
- Smith et al. (2007) Smith, R. K., Bautz, M. W., Edgar, R. J., et al. 2007, PASJ, 59, 141
- Snowden (1993) Snowden, S. L. 1993, Advances in Space Research, 13, doi:10.1016/0273-1177(93)90102-H
- Snowden et al. (1994) Snowden, S. L., McCammon, D., Burrows, D. N., & Mendenhall, J. A. 1994, ApJ, 424, 714
- Snowden et al. (1995) Snowden, S. L., Freyberg, M. J., Plucinsky, P. P., et al. 1995, ApJ, 454, 643
- Snowden et al. (1997) Snowden, S. L., Egger, R., Freyberg, M. J., et al. 1997, ApJ, 485, 125
- Snowden et al. (2014) Snowden, S. L., Chiao, M., Collier, M. R., et al. 2014, ApJ, 791, L14
- Thomas et al. (2013) Thomas, N. E., Carter, J. A., Chiao, M. P., et al. 2013, in Proc. SPIE, Vol. 8859, UV, X-Ray, and Gamma-Ray Space Instrumentation for Astronomy XVIII, 88590Z
- Uprety (2015) Uprety, Y. 2015, PhD thesis, University of Miami
- Welsh & Shelton (2009) Welsh, B. Y., & Shelton, R. L. 2009, Ap&SS, 323, 1
- Yoshino et al. (2009) Yoshino, T., Mitsuda, K., Yamasaki, N. Y., et al. 2009, PASJ, 61, 805