2 Centro de Astrobiología, Departamento de Astrofísica, CSIC-INTA, Cra. de Ajalvir km.4, 28850 - Torrejón de Ardoz (Madrid) Spain
11email: bellochie@cab.inta-csic.es; enrica.bellocchi@gmail.com
Distinguishing disks from mergers: tracing the kinematic asymmetries in local (U)LIRGs using kinemetry-based criteria
Abstract
Context. The kinematic characterization of different galaxy populations is a key observational input to distinguish between different galaxy evolutionary scenarios, since it helps to determine the number ratio of rotating disks to mergers at different cosmic epochs. Local (U)LIRGs offer a unique opportunity to study at high linear resolution and S/N extreme star forming events and compare them with those observed at high–z.
Aims. Our goal is to analyze in detail the kinematics of the H ionized gas of a large sample of 38 local (z 0.1) (U)LIRGs (50 individual galaxies) applying kinematic criteria able to characterize the evolutionary status of these systems.
Methods. We obtained Very Large Telescope (VLT) VIMOS optical integral field spectroscopy (IFS) data of a sample of 38 (U)LIRGs. The ‘unweighted’ and ‘weighted’ kinemetry–based methods are used to kinematically classify our galaxies in ‘disk’ and ‘merger’. We simulate our systems at z=3 to evaluate how a loss of angular resolution affects our results.
Results. From the kinemetry-based analysis we are able classify our local (U)LIRGs in three distinct kinematic groups according to their total kinematic asymmetry values (Ktot) as derived when using the weighted (unweighted) method: 1) 25 out of 50 galaxies are kinematically classified as ‘disk’, with a K 0.16 (0.14); 2) 9 out of 50 galaxies are kinematically classified as ‘merger’, with a K 0.94 (0.66); 3) 16 out of 50 galaxies lie in the ‘transition region’, in which disks and mergers coexist, with 0.16 (0.14) Ktot 0.94 (0.66). When we apply our criteria to the high–z simulated systems, a lower total kinematic asymmetry frontier value (Ktot 0.16 ( 0.14)) is derived with respect to that found locally. The loss of angular resolution smears out the kinematic features, thus making objects to appear more kinematically regular than actually they are.
Key Words.:
galaxies – kinematics – luminous infrared galaxies – integral field spectroscopy1 Introduction
In the standard model of hierarchical galaxy assembly mergers are the dominant source of mass accretion and growth in massive high-redshift (high-z) galaxies (i.e., Cole et al. 2000; Somerville et al. 2001). In this scenario, galaxies are assumed to form at the center of the dark matter halos as the baryonic gas cools (e.g., Baugh 2006), and their subsequent evolution is controlled by the merging histories of the halos containing them (e.g., Cole et al. 1994). As derived from the observations, major merging is undoubtedly taking place at high-z (e.g., Tacconi et al. 2006, 2008). More recently, Kartaltepe et al. (2012), studying a sample of ULIRGs at z 2, found that the majority of the sources show signs of major mergers. These mechanisms support the hypothesis that gas-rich late-type galaxies can transform into gas-poor early-type E/S0 galaxies, as predicted using detailed simulations (Mihos & Hernquist 1996; Combes 2004; Conselice 2006). As a result of this framework, we expect to find galaxies characterized by complex and disturbed kinematics, such as distorted and asymmetric velocity fields, as a proof of a strong ongoing interaction.
On the other hand, hydrodynamical simulations (Robertson et al. 2006; Governato et al. 2007, 2009; Hopkins et al. 2009a, b) have shown that the gas fraction at fusion time and the amount of dissipation in a major merger of disk galaxies is a key parameter to generate a bulge dominated/elliptical (i.e., through dry merger) or a spiral galaxy (i.e., through gas-dominated merger). Indeed, according to this scenario a disk can be reformed in the remnant when the fraction of gas at the fusion time is higher than 50% (e.g., Hammer et al. 2009; Puech et al. 2012).
In the last few years many works found that most of the high–z galaxies show as a disk-like rotating velocity field pattern, although they appear to be turbulent (i.e., Lehnert et al. 2009; Burkert et al. 2010) as given by their high velocity dispersion (i.e., = 30 – 100 km s-1) and low dynamical ratio (v/ 1; Genzel et al. 2008; Förster Schreiber et al. 2009; Wisnioski et al. 2011). In order to explain their kinematic patterns in new models of disk formation at high–z, recent theoretical works (i.e., Kereš et al. 2005; Davé 2008; Genel et al. 2008; Dekel et al. 2009a; Ceverino et al. 2010), based on semi-analytical approaches and hydrodynamical simulations, have invoked a rapid but more continuous gas accretion via cold flows and/or minor mergers, which likely play an important role in driving the mass growth of massive star forming galaxy at high–z (e.g., Daddi et al. 2007; Elbaz et al. 2007; Noeske et al. 2007), able to supply gas directly to the center of the galaxies (i.e., Kereš et al. 2005; Ocvirk et al. 2008; Dekel et al. 2009a). One of the first evidences of the ‘clumpy disk’ picture came from the work of Förster Schreiber et al. (2006), observing the H emission of a sample of 14 BM/BX galaxies. They confirmed the presence of a significant fraction of galaxies with rotation fields characteristic of disks, large enough to be resolved in 0.5 arcsec seeing. Then, a large portion of the strongly star-forming galaxies (SFGs) at z = 1 – 3 does not show the disturbed kinematics expected according to the hierarchical model but is characterized by regularly rotating disks (e.g., Cresci et al. 2009; Epinat et al. 2009; Förster Schreiber et al. 2009; Gnerucci et al. 2011). This result has suggested that even stronger star formation may be fueled by the accretion of pristine gas from the halo and by dynamical instabilities within the massive gaseous disks (Genel et al. 2008; Dekel et al. 2009b; Bouché et al. 2010; Cresci et al. 2010).
The discrepancies between morphological and kinematical results have increased the importance of kinematic studies, since objects photometrically irregular in broad-band HST images show ‘regular’ kinematic maps (i.e., Bournaud et al. 2008; van Starkenburg et al. 2008; Puech 2010; Jones et al. 2010; Förster Schreiber et al. 2011; Genzel et al. 2011). Thus, the aforementioned results emphasize the crucial role of spatially- and spectrally-resolved investigations of galaxies at different redshifts, such as those based on integral field spectroscopy (IFS), in order to map their morphology and kinematics.
A useful way to figure out which is the dominant scenario that drives the galaxy evolution at different cosmic epochs is to estimate the number ratio of (rotating) disks to mergers (i.e., disk/merger fraction). Some discrepancies can raise in classifying several kinds of galaxies in disks/mergers when applying different techniques. The first and most widely used technique was the visual morphological classification (e.g., Dasyra et al. 2008; Kartaltepe et al. 2010; Zamojski et al. 2011); then other classification methods, as the estimate of the asymmetry and clumpiness parameters (e.g., Conselice et al. 2003) and the use of the Gini-M20 plane (e.g., Lotz et al. 2008), have been considered as well. In the last decade, measures of galaxy kinematics (e.g., Genzel et al. 2008; Förster Schreiber et al. 2006, 2009) have increased their importance: in order to kinematically classify the systems, a visual (kinematic) classification has been applied at intermediate redshift (i.e., 0.4 z 0.7) by Flores et al. (2006) and Yang et al. (2008) and locally by Bellocchi et al. (2013) to investigate the properties of the velocity fields of galaxies observed with IFS.
The kinematic characterization of different galaxy populations (Glazebrook 2013 review) is a key observational input to distinguish between different galaxy evolutionary scenarios, since it helps us to determine the number ratio of rotating disks to mergers at different cosmic epochs. This provides a way of constraining the relative role of major mergers and steady cool gas accretion in shaping galaxies, which remains a topic of discussion (e.g. Genzel et al. 2001; Tacconi et al. 2008; Dekel et al. 2009b; Förster Schreiber et al. 2009; Lemoine-Busserolle & Lamareille 2010; Lemoine-Busserolle et al. 2010; Bournaud et al. 2011; Epinat 2011).To this aim several authors have already analyzed the velocity fields and velocity dispersion maps of different galaxy samples (e.g., Lyman break analogs LBAs, Sub-mm galaxies SMGs, (U)LIRGs, H emitters, high–z simulated SINGS spiral galaxies) using the kinemetry methodology111Kinemetry is a tool able to quantify kinematic asymmetries in the velocity field and velocity dispersion maps of the systems with respect to those characterizing an ideal rotating disk. It will be described in the Sect. 3. (Krajnović et al. 2006, hereafter, K06) with the aim of discerning merging and non-merging systems on the base of their kinematic properties (e.g., Shapiro et al. 2008; Gonçalves et al. 2010; Alaghband-Zadeh et al. 2012; Bellocchi et al. 2012; Swinbank et al. 2012; Hung et al. 2015).
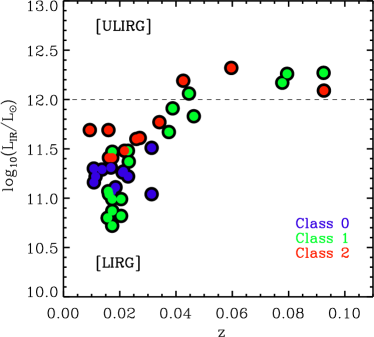
LIRG (LIR = [8 - 1000 m] = 1011 - 1012 L⊙) and ULIRG (ULIRGs, LIR 1012 L⊙) galaxy populations are particularly relevant to the study of galaxy evolution since, although rare in the local universe, they are far more numerous at high–z and responsible for a significant fraction of previous star formation prior to redshift z 1 (e.g., Le Floc’h et al. 2005; Pérez-González et al. 2005, 2008). Several authors have suggested that high–z LIRGs are scaled-up versions of low–z LIRGs (e.g., Pope et al. 2006; Papovich et al. 2007; Elbaz et al. 2010, 2011; Nordon et al. 2010, 2012; Takagi et al. 2010), finding that in the local universe (U)LIRGs cover a similar SFR range than normal high–z SFGs (e.g., Wuyts et al. 2011). Therefore, low–z (U)LIRGs offer a unique opportunity to study at high linear resolution and S/N extreme star forming events and compare them with those observed at high–z.
In this paper we present the results from applying the kinemetry method to a large sample of 38 local (U)LIRG systems (51 individual galaxies) observed with the VIMOS/VLT integral field unit (IFU). The same approach as in Bellocchi et al. (2012) will be taken into account considering both locally observed and high–z simulated (U)LIRGs systems. Thus, this study will allow us to constrain the disk/merger fraction in the local universe as well as to compare such ratio with that derived for high–z populations.
The paper is structured as follows. In Sect. 2, we present the sample giving details about the observations, data reductions, line fitting and map construction. Sect. 3 is devoted to the description of the kinemetry analysis and its potential in distinguishing disks from mergers when applying two different methods (i.e., Shapiro et al. 2008; Bellocchi et al. 2012, hereafter, S08 and B12) to a sample of local and high–z simulated galaxies. Finally, the main results and conclusions are summarized in Sect. 4. Throughout the paper we will consider H0 = 70 km s-1 Mpc-1, = 0.3 and = 0.7.
2 Observations, data reduction and data analysis
2.1 The sample and the morphological class
The (U)LIRG sample analyzed in this work is the same than that analyzed in Bellocchi et al. (2013) (hereafter, B13) in which the 2D kinematic properties of the ionized gas (H) are discussed. To summarize, it contains a total of 38 (U)LIRGs systems (51 individual galaxies) of the southern hemisphere drawn from the Revised Bright Galaxy Sample (RBGS, Sanders et al. 2003). Of these systems 31 are LIRGs (i.e., L = 2.9 1011 L⊙) with a mean redshift of 0.024 (corresponding to D 100 Mpc), and the remaining seven are ULIRGs (i.e., L =1.6 1012 L⊙) with a mean redshift of 0.069 (D 300 Mpc; see Tab. 1 and Arribas et al. (2008), hereafter A08, for details). This sample thus includes a good representation of the relatively less studied LIRG luminosity range. It also encompasses a wide variety of morphological types, suggesting different dynamical phases (isolated spirals, interacting galaxies, and ongoing- and post-mergers), and nuclear excitations (HII, Seyfert, and LINER). Eleven out of 51 galaxies show evidence in their optical nuclear spectra of hosting an AGN, showing high [NII]/H values and/or broad H emission lines (e.g., IRAS F07027-6011N, IRAS F05189-2524, IRAS F12596-1529, IRAS F21453-3511; see Monreal-Ibero et al. 2010; Arribas et al. 2012, 2014 hereafter, MI10, A12, A14, respectively). Most of these objects (46 out of 51) show outflows of ionized gas, studied in A14, while a smaller fraction (22 out of 40) show outflows of neutral gas, studied in Cazzoli et al. (2014, 2016). The sample is not complete either in luminosity or in distance. However, it covers well the relevant luminosity range and is representative of the different morphologies within the (U)LIRG phenomenon (see Fig. 1).
The morphological class was derived using Digital Sky Survey (DSS) ground-based images and, when available, additional archival Hubble Space Telescope (HST) images. Except for one case, the morphological classification according to the DSS images is in good agreement with that derived by using the HST images222For 19 out of 38 of the systems in our sample DSS and HST images are available. Only for IRAS F06206-6315 the HST image reveals more features than those shown in the DSS image, morphologically classifying this galaxy as type 1 vs. type 2/0 when using, respectively, HST and DSS images.. The sources have been morphologically classified following a simplified version of the scheme proposed by Veilleux et al. (2002), with three main classes instead of five (see Rodríguez-Zaurín et al. 2011, hereafter RZ11, and references therein for further details). We refer to the images published in B13 (in their Appendix A) in which the H kinematic maps are shown for each galaxy and to their DSS/HST images published in RZ11. Briefly, we remind the three morphological classes defined as follows:
-
•
Class 0: objects that appear to be single isolated galaxies, with a relatively symmetric disk morphology and without evidence for strong past or ongoing interaction (hereafter, ).
-
•
Class 1: objects in a pre-coalescence phase with two well-differentiated nuclei separated a projected distance 1.5 kpc. For these objects, it is still possible to identify the individual merging galaxies and, in some cases, their corresponding tidal structures due to the interaction (hereafter, ).
-
•
Class 2: objects with two nuclei separated a projected distance 1.5 kpc or a single nucleus with a relatively asymmetric morphology suggesting a post-coalescence merging phase (hereafter, ).
In Tab. 1 we present the main properties of the sample. In some cases the properties of individual galaxies in multiple systems could be inferred separately and were therefore treated individually (see B13 for details).
2.2 Observations and data reduction
The observations have been described in detail in previous papers (i.e., A08, MI10, RZ11, B13). In brief, they were carried out using the Integral Field Unit of VIMOS (Le Fèvre et al. 2003), at the Very Large Telescope (VLT), covering the spectral range Å with the high resolution grating GG435 (‘HR-orange’ mode) and a mean spectral resolution of 3470 (dispersion of 0.62 Å pix-1). The effective field of view (FoV) in this configuration is 29.5″ 29.5″, with a spaxel scale of 0.67″per fiber (i.e., 1936 spectra are obtained simultaneously from a 44 44 fibers array).
The VIMOS data are reduced with a combination of the pipeline Esorex (versions 3.5.1 and 3.6.5) included in the pipeline provided by ESO, and different customized IDL and IRAF scripts. The basic data reduction (i.e., bias subtraction, flat field correction, spectra tracing and extraction, correction of fiber and pixel transmission and relative flux calibration) is performed using the Esorex pipeline. The four quadrants per pointing are reduced individually and then combined into a single data cube. Then, the four independent dithered pointing positions are combined together to end up with the final ‘super-cube’, containing 44 44 spaxels for each object (i.e., 1936 spectra). For the wavelength calibration description we refer to A08 and RZ11.
2.3 Data analysis
The observed H and [NII]6548, 6583 Å emission lines of the individual spectra are fitted to Gaussian profiles using an IDL routine (i.e., MPFITEXPR, implemented by C. B. Markwardt). This algorithm derives the best set of lines that match the available data. In case of adjusting multiple lines, the line flux ratios and wavelengths of the different lines are fixed according to the atomic physics. The widths are constrained to be equal for all the lines and greater than the instrumental contribution (). The results of the fit have been presented in the Appendix A in B13, in which the H maps are shown (i.e., flux intensity, velocity field and velocity dispersion maps).
As largely described in B13, a narrow (or systemic) and broad components333The distinction between narrow and broad components has been done according to their line widths. have been identified in most of the systems to properly fit the spectra. In this analysis we will focus on the kinematic maps of the systemic component, assumed to be the narrow component of the emission line, since the spatial distribution and kinematic properties of this component represent those of the entire galaxy.
2.4 Simulated high–z observations: the resolution effects
In order to investigate how a decreasing angular resolution affects our results, we simulate observations at z = 3 with a typical pixel scale of 0.1′′ (the same pixel scale as the IFU NIRSpec/JWST) as done in B12, just considering resolution effects. Since the angular distance evolves less than 10% in the redshift range z = 2 – 3, our simulated observations at z = 3 are relevant for a direct comparison to observations at z 2.
The ‘simulated’ FoV of the maps ranges between 1′′1′′ up to 5′′5′′ with the scale of about 7.7 kpc arcsec-1 assuming the CDM cosmology considered in this work.
| ID1 | ID2 | D | scale | log LIR | Class | Notes | |
| IRAS | Other | (Mpc) | (pc/′′) | (L⊙) | |||
| (1) | (2) | (3) | (4) | (5) | (6) | (7) | (8) |
| F01159–4443 S | ESO 244–G012 | 0.022903 | 99.8 | 462 | - | 1 | a,d |
| F01159–4443 N | ESO 244–G012 | 0.022903 | 99.8 | 462 | 11.48 | 1 | a,d |
| F01341–3735 S | ESO 297–G012 | 0.017305 | 75.1 | 352 | 10.72 | 1 | a,d |
| F01341–3735 N | ESO 297–G011 | 0.017305 | 75.1 | 352 | 10.99 | 1 | a,d |
| F04315–0840 | NGC 1614 | 0.015983 | 69.1 | 325 | 11.69 | 2 | |
| F05189–2524 | 0.042563 | 188.2 | 839 | 12.19 | 2 | ||
| F06035–7102 | 0.079465 | 360.7 | 1501 | 12.26 | 1 | ||
| F06076–2139 S | 0.037446 | 165 | 743 | - | 1 | a,d | |
| F06076–2139 N | 0.037446 | 165 | 743 | 11.67 | 1 | a,d | |
| F06206–6315 | 0.092441 | 423.3 | 1720 | 12.27 | 1 | ||
| F06259–4780 S | ESO 255–IG007 | 0.038790 | 171.1 | 769 | - | 1 | b,d |
| F06259–4780 C | ESO 255–IG007 | 0.038790 | 171.1 | 769 | - | 1 | b,d |
| F06259–4780 N | ESO 255–IG007 | 0.038790 | 171.1 | 769 | 11.91 | 1 | b,d |
| F06295–1735 | ESO 557–G002 | 0.021298 | 92.7 | 431 | 11.27 | 0 | |
| F06592–6313 | 0.022956 | 100 | 464 | 11.22 | 0 | ||
| F07027–6011 S | AM 0702–601 | 0.031322 | 137.4 | 626 | 11.51 | 0 | a,d |
| F07027–6011 N | AM 0702–601 | 0.031322 | 137.4 | 626 | 11.04 | 0 | a,d |
| F07160–6215 | NGC 2369 | 0.010807 | 46.7 | 221 | 11.16 | 0 | |
| 08355–4944 | 0.025898 | 113.1 | 521 | 11.60 | 2 | ||
| 08424–3130 S | ESO 432–IG006 | 0.016165 | 70.1 | 329 | 11.04 | 1 | a,d |
| 08424–3130 N | ESO 432–IG006 | 0.016165 | 70.1 | 329 | - | 1 | a,d |
| F08520–6850 E | ESO 60–IG016 | 0.046315 | 205.4 | 909 | 11.83 | 1 | |
| F08520–6850 W | ESO 60–IG016 | 0.046315 | 205.4 | 909 | 11.83 | 1 | |
| 09022–3615 | 0.059641 | 267 | 1153 | 12.32 | 2 | ||
| F09437+0317 S | IC 563 | 0.020467 | 89 | 415 | 10.82 | 1 (0) | a,c,d |
| F09437+0317N | IC 564 | 0.020467 | 89 | 415 | 10.99 | 1 (0) | a,c,d |
| F10015–0614 | NGC 3110 | 0.016858 | 73.1 | 343 | 11.31 | 0 | |
| F10038–3338 | ESO 374–IG032 | 0.034100 | 149.9 | 679 | 11.77 | 2 | |
| F10257–4339 | NGC 3256 | 0.009354 | 40.4 | 192 | 11.69 | 2 | |
| F10409-4556 | ESO 264-G036 | 0.021011 | 91.4 | 425 | 11.26 | 0 | |
| F10567–4310 | ESO 264–G057 | 0.017199 | 74.6 | 350 | 11.07 | 0 | |
| F11255–4120 | ESO 319–G022 | 0.016351 | 70.9 | 333 | 11.04 | 0 | |
| F11506–3851 | ESO 320–G030 | 0.010781 | 46.6 | 221 | 11.30 | 0 | |
| F12043–3140 S | ESO 440–IG058 | 0.023203 | 101.1 | 468 | 11.37 | 1 | a,d |
| F12043–3140 N | ESO 440–IG058 | 0.023203 | 101.1 | 468 | - | 1 | a,d |
| F12115–4656 | ESO 267–G030 | 0.018489 | 80.3 | 375 | 11.11 | 0 | |
| 12116–5615 | 0.027102 | 118.5 | 545 | 11.61 | 2 (0) | ||
| F12596–1529 | MCG 02–33–098 | 0.015921 | 69.0 | 324 | 11.07 | 1 | |
| F13001–2339 | ESO 507–G070 | 0.021702 | 94.5 | 439 | 11.48 | 2 (0/1) | |
| F13229–2934 | NGC 5135 | 0.013693 | 59.3 | 280 | 11.29 | 0 | |
| F14544–4255 E | IC 4518 | 0.015728 | 68.2 | 320 | 10.80 | 1 | a,d |
| F14544–4255 W | IC 4518 | 0.015728 | 68.2 | 320 | 10.80 | 1 | a,d |
| F17138–1017 | 0.017335 | 75.2 | 352 | 11.41 | 2 (0) | ||
| F18093–5744 S | IC 4689 | 0.017345 | 75.3 | 353 | - | 1 | b,d |
| F18093–5744 C | IC 4686 | 0.017345 | 75.3 | 353 | 10.87 | 1 | b,d |
| F18093–5744 N | IC 4687 | 0.017345 | 75.3 | 353 | 11.47 | 1 | b,d |
| F21130–4446 | 0.092554 | 423.9 | 1722 | 12.09 | 2 | ||
| F21453–3511 | NGC 7130 | 0.016151 | 70.0 | 329 | 11.41 | 2 | |
| F22132–3705 | IC 5179 | 0.011415 | 49.3 | 234 | 11.22 | 0 | |
| F22491–1808 | 0.077760 | 352.5 | 1471 | 12.17 | 1 | ||
| F23128–5919 | AM 2312–591 | 0.044601 | 197.5 | 878 | 12.06 | 1 |
3 Kinemetry analysis
We investigate the power of the kinemetry methodology in studying the kinematic asymmetries in (U)LIRG systems. In particular, the same approach described in B12 (i.e., using the S08 and B12 criteria, hereafter, ‘unweighted’ and ‘weighted’ methods respectively) is applied to i) the entire observed local sample555The final total number of galaxies analyzed in this work with kinemetry is 50 instead of 51, since the galaxy F08424-3130 N is located in the edge of the VIMOS FoV and then excluded from this analysis. and then to ii) the simulated high–z kinematic maps. In this section the results derived from applying these two methodologies are discussed.
3.1 The method
The kinemetry method comprises a decomposition of the moment maps into Fourier components using ellipses. We briefly describe the main steps presented in K06 to achieve a clearer understanding of this analysis.
The Fourier analysis is the most straightforward way to characterize any periodic phenomenon: the periodicity of a kinematic moment can easily be seen by expressing the moment in polar coordinates where K (x, y) K (r, ). The map K(r, ) can be expanded as follows to a finite number (N+1) of harmonic terms (frequencies)
| (1) |
where is the azimuthal angle in the plane of the galaxy (measured from the major axis) and is the radius of a generic ellipse. The amplitude and the phase coefficients (, ) are easily calculated from the , coefficients as and .
For an ideal rotating disk the term dominates the velocity profile, representing the circular velocity in each ring while the term dominates the velocity dispersion profile giving gives the systemic velocity of each ring. Thus, higher order terms (, ) indicate deviations from symmetry. In the kinemetry analysis we assume for each ellipse a covering factor = 0.7, a position angle () and a flattening (q) free to vary and the peak of the VIMOS continuum emission as the center of the ellipse.
The covering parameter represents the minimum percentage of the points along an ellipse needed to start the analysis. In our case 0.7 means that if fewer than 70% of the points along an ellipse are not covered by data the program stops. The position angle of the velocity field () identifies the angle where the velocity field peaks with respect to the North coordinate. The flattening () is defined as the ratio of the semi-minor (b) to the semi-major (a) axes of the ellipse, i.e., q= b/a. When let free to vary it allows us to consider general cases, such as tilted/wrapped disks. For further details on these assumptions see B12.
3.2 The kinematic criteria: the ‘unweighted’ and ‘weighted’ methods
We have considered different kinematic criteria with the aim of distinguishing systems who have suffered recent major merger events (i.e., mergers) and those without any signs of interacting or merger activity (i.e., disks).
As a first approach we apply the S08 method (‘unweighted’ method) where the kinematic asymmetries of the velocity field and velocity dispersion maps are defined, respectively, as follows:
| (2) |
where and .
On the other hand, the method presented in B12 (‘weighted’ method) has been applied as well. This revised method is based on the results that indicate that in a post-coalescence merger the inner regions are dominated by rotation while the outer parts retain larger kinematic asymmetries (e.g., Kronberger et al. 2007). With this criterion the importance of the kinematic asymmetries at larger radii is enhanced. Indeed, instead of simply averaging the asymmetries over all radii (as in S08), they are weighted according to the number of data points used in their determination. The number of data points is to first approximation proportional to the circumference of the ellipse; the circumferences (Cn) of the ellipses are computed as shown in Eq. 5 in B12. The asymmetries found in the outer ellipses contribute more significantly to the average when deriving v and . We remind the final formulas to compute the weighted velocity and velocity dispersion asymmetries:
| (3) |
| (4) |
where N is the total number of radii considered, Cn the value of the circumference for a given ellipse, the different kn (k and k) are the deviations concerning respectively the velocity field and velocity dispersion maps, and is the rotational curves.
This is the first attempt in applying the kinemetry method along with kinematic criteria to a large sample local (z 0.1) SFGs. This is crucial to understand what is the fraction of disks and mergers locally in such systems allowing us to compare such a ratio with those derived for high–z SFGs.
3.3 Morphological definition of disks and mergers
As previously described in Sect. 2, our sample consists of 50 individual galaxies covering a large LIR range and encompasses a wide variety of morphologies which allow us to discuss the kinematic asymmetries as a function of the galaxy properties (e.g., infrared luminosity LIR, morphological class).
In order to better interpret and discuss our data we recall the Veilleux et al. (2002) classification, according to which the Interacting (type 1) galaxies can be sub-classified as Wide– or Close–Interacting according to their projected nuclear separation. The presence (or not) of tidal tails and/or other structures interconnecting the nuclei is considered using DSS continuum maps and, when available, HST images since it could help us to better distinguish their structure. In particular, if the nuclear projected separation is 10 kpc, the emission of the two galaxies can be well separated in the VIMOS maps, and there is no presence of tidal tails and/or other structures between the nuclei in their continuum (DSS, HST) maps, the sources are considered as Wide–Interacting pairs (or paired–disks). A few systems (i.e., IRAS F06035–7102, IRAS F06206–6315, IRAS F12596–1529, IRAS F22491–1808, IRAS F23128–5919) are classified as Close–Interacting pairs (or ongoing mergers), since their projected nuclear separation is smaller than 10 kpc (but larger than 1.5 kpc, at which the limit for the coalescence phase is defined), their individual contributions cannot be disentangled in the VIMOS maps666The galaxy IRAS F08520–6850 is considered as wide–pair because the two galaxies can be well separated in the VIMOS maps although their nuclear separation is slightly smaller than 10 kpc. and they also show the presence of tidal tail structures in their continuum maps. These galaxies have a common envelope, and they are likely in a more advanced merger phase than the wide-interacting pairs. Therefore, we have distinguished four dynamical phases, where the first two are referred as ‘disk’, while the second two as ‘mergers’ (case I):
![[Uncaptioned image]](/html/1603.03441/assets/x2.png)
We propose such a simplified morphological (‘disk–merger’) classification to characterize in some way the evolutive status of the galaxies in our sample, which show a large variety of dynamical phases. In particular, as ‘merger’ we refer to those systems where the interacting galaxies are close enough to share a common envelope as well as similar kinematics (which suggests they are probably going to merge), thus considering them as a single system. As ‘disk’ we include the ‘pure’ (isolated) disk galaxies as well as the ‘paired’ galaxies which, for definition, do not share a common envelope as due to their large projected separation. In this case, we cannot surely conclude that these galaxies are going to merge and, if they do, it will be in a more advanced phase.
A similar morphological classification for the class 1 (interacting) systems has been considered in A14, in which the systems have been distinguished as ‘total system’ or ‘individual object’.
However, for the isolated disks (class 0) and post–coalescence mergers (class 2) a clearer dynamical status can be inferred with respect to that derived for the interacting systems (class 1), as a result of their diversified interaction stages, something in between the two aforementioned classes. To this respect, we also discuss the kinemetry results derived in the case where only ‘isolated disks’ are considered as ‘true disks’ (case II). In this case, we exclude the ‘paired disk’ galaxies from such a group as due to their supposed different dynamical status (i.e., interacting) with respect to the isolated disks. However, following our ‘merger’ definition, these ‘paired disks’ are also kept out from the ‘true merger’ group.
3.4 Kinematic distinction between disks and mergers
Similarly to S08 (‘unweighted’ method) and what done in B12 (‘weighted’ method) we quantify the total kinematic asymmetry degree Ktot of each galaxy as the combination of both the kinematic asymmetry contributions of the velocity field (vasym) and velocity dispersion () maps, i.e., Ktot = (see Eqs. 2, 3, 4). We find that the ongoing merging systems have the largest kinematic asymmetry (Ktot), while (isolated and paired) disks and post-coalescence mergers are characterized by lower Ktot values. In a similar way, ULIRGs show higher Ktot with respect to LIRGs. The mean (median) Ktot values for the different groups are shown in Tab. 2.
| Systems | Ktot | # objects | |
| (1) | (2) | (3) | |
| class 0 (Isolated disk) | 0.13 0.03 (0.11) | 13/50 | |
| class 1 (Paired disk) | 0.14 0.03 (0.10) | 21/50 | |
| class 1 (Ongoing merger) | 1.9 0.47 (1.95) | 5/50 | |
| class 1 (Pair disk & Ongoing merger) | 0.48 0.16 (0.12) | 26/50 | |
| class 2 (Post-coalescence merger) | 0.64 0.22 (0.29) | 11/50 | |
| LIRGs | 0.27 0.08 (0.11) | 43/50 | |
| ULIRGs | 1.37 0.42 (1.03) | 7/50 | |
| (U)LIRG | 0.43 0.10 (0.16) | 50 | |
| AGN (LIRGs) | 0.43 0.25 (0.22) | 4/11 | |
| AGN (ULIRGs) | 1.73 0.67 (1.97) | 7/11 | |
| AGN (U)LIRG | 0.91 0.34 (0.29) | 11 |
Col (1): System. Col (2): Mean (and median) total kinematic asymmetry. Col (3): Fraction of galaxies in each subsample.
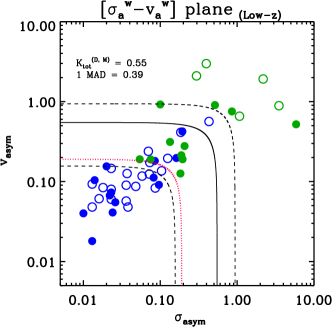
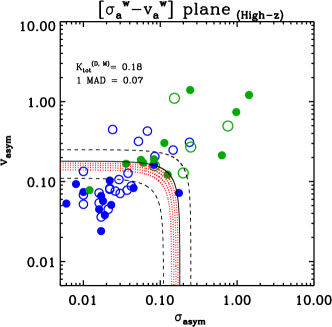
The kinematic asymmetry results (i.e., vasym and ) derived for the whole local sample are shown in Fig. 2 when applying, respectively, the unweighted (left panels, [-va]) and weighted (right panels, [-v]) criteria. The same general trend is found in both the planes, where disks (isolated and paired disks) are characterized by lower kinematic asymmetries than mergers (ongoing and post-coalescence mergers).
In order to distinguish disks from mergers in the two kinematic asymmetry planes we try to find out a value of the frontier applying the following approach. Since a quite large scatter is found in the asymmetry values of each kinematic class (i.e., disk and merger populations), the median value (instead of the mean) of each Ktot distribution is considered (hereafter, K and K). Then, the total kinematic asymmetry for the frontier (K) is computed as the mean value of these two quantities:
| (5) |
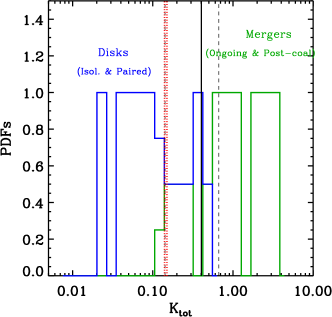
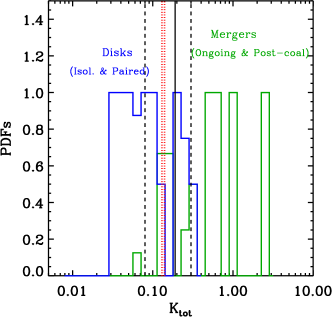
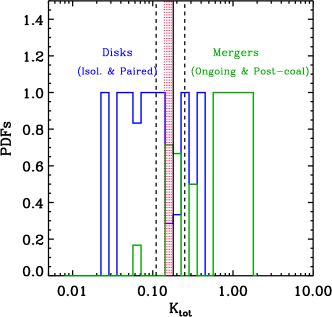
The uncertainty associated to this value has been computed as the mean value of each Median Absolute Deviation (or MAD)777The respective uncertainty associated to the value of the total kinematic asymmetry has been computed as median-absolute-deviation (hereafter, MAD). It returns a data set’ s median absolute deviation from the median, that is median(—data - median(data)—). It is a proxy for the standard deviation, but is more resistant against outliers. estimate associated to each distribution. As shown in Fig. 2, for Ktot K - 1 MAD no mergers are found, while for Ktot K + 1 MAD disks do not exist (dashed black frontiers). Indeed, the more disturbed objects are those classified as ongoing-mergers (i.e., IRAS F06035–7102, IRAS F06206–6315, IRAS F12596–1529, IRAS F22491–1808, IRAS F23128–5919)888These sources may appear as such either because they are actually in the early phase of merging or because the limited angular resolution of VIMOS does not allow to separate the contribution of each galaxy. along with some post-coalescence sources which show high asymmetries (i.e., IRAS F05189–2524, IRAS 09022–3615, IRAS F10257–4339, IRAS F13001–2339), characterized by very disturbed kinematic maps. There is a ‘transition region’ (i.e., K - 1 MAD Ktot K + 1 MAD) where the distinction between disk/merger is difficult. The large dispersion and overlapping in the kinemetry results derived for our isolated, pre- and post-coalescence systems highlight the uncertainty in deriving a clear value of Ktot able to clearly separate disks from mergers. The middle panels in the same figure show the corresponding probability distribution functions (PDFs) of each morphological class normalized to the number of objects in each bin.
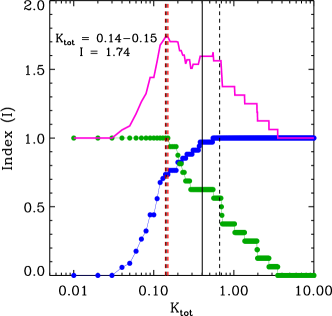
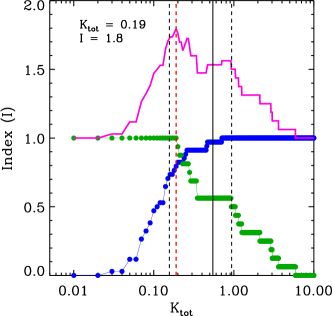
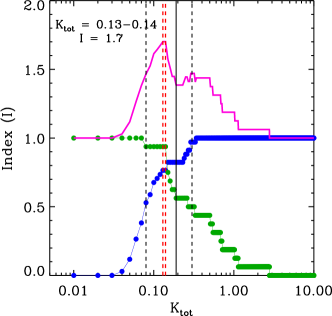
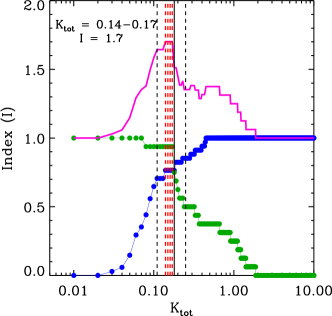
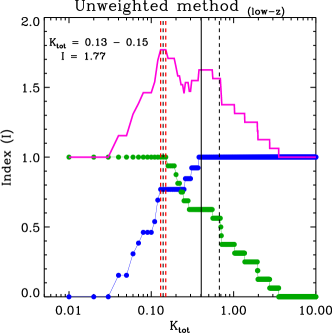
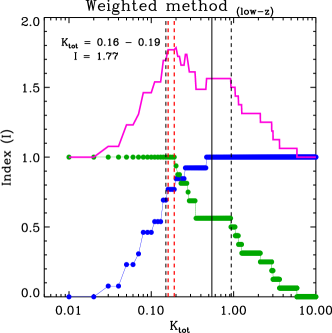
Both the unweighted and weighted methods give similar results, although the weighted one allows to distinguish slightly better disks from mergers. This is better visible if, apart from the statistical approach, we determine the ‘optimal’ value of the frontier able to classify our local sources in disk and merger galaxies (dashed red frontier): to this aim, the number of well classified galaxies as a function of the Ktot is derived. Since in our sample the number of disks dominates on the number of mergers, we then define an ‘index’ parameter (I) as the sum of the respective fractions of well classified systems in each morphological class (i.e., Idisk for disks and Imerger for mergers). In particular, I is defined in Eq. 6:
| (6) |
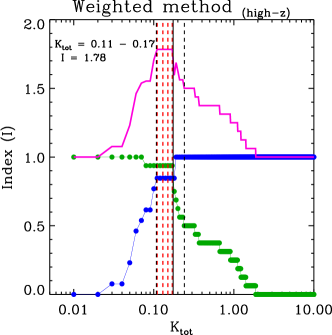
The results are shown in the bottom panels of Fig. 2 in the two cases (i.e., unweighted and weighted methods): the disk contribution is represented in blue, the merger one is shown in green and the total one in magenta. The total observed distribution allows to determine the optimal Ktot frontier value for which the largest fraction of well classified systems (Imax) is achieved: this value is also shown in the figure. In each distribution two peaks are found and we refer to them as ‘main’ and ‘secondary’ peaks. The main peak Imax identifies the Ktot value(s) which well classifies the largest fraction of systems, where K 0.15 and 0.19, in the unweighted and weighted planes, respectively. As visible in the figure, the statistical Ktot values (i.e., Ktot 1 MAD) approximate well the main and secondary peaks, also defining the region where the distinction between disk/merger is difficult.
Thus, at low–z the largest value of I is derived when the weighted method is applied (i.e., Imax = 1.8, Ktot(Imax) = 0.19), although it is only slightly larger than that derived in the unweighted plane (Imax 1.7). The relative disk/merger fraction derived locally according to the weighted frontier in our sample is 27/23, implying that the number of disks almost equals that of mergers. When considering the frontier adopted by S08 (Ktot = 0.5) the index I reaches the value of 1.6, clearly lower than our optimal value and close to the secondary peak. If we consider this frontier half of the post-coalescence mergers are misclassified as disks, leading to an overestimation of the disk/merger ratio. Indeed, according to their frontier the disk/merger fraction is 40/10, implying that the 80% of our objects would be classified as disks.
However, a good agreement is found between the morphology and the kinematic classification: in particular, the Idisk and Imerger fractions for the low–z sample are, respectively, 79% (74%) vs. 100% for the weighted (unweighted) plane when isolated and paired disks are considered as ‘true disks’.
If only isolated disk galaxies are considered as ‘true disks’, the distribution of the total number of well classified galaxies (index I) as a function of Ktot in the unweighted and weighted planes (Fig. 4) follows the same trend than that found in the former case (bottom panels in Figs. 2, 3).
In Tab. 3 a comparison of the different (morphological and kinematic) classifications of the (U)LIRG sample is summarized.
| ID1 | Morphological | Visual kinematic | Kinemetry | Kinemetry |
| IRAS | classification | classification | value of Ktot | classification |
| (1) | (2) | (3) | (4) | (5) |
| F01159-4443 S | 1 | PD | 0.25 | Disk⋆ |
| F01159-4443 N | 1 | PD | 0.12 | Disk |
| F01341-3735 S | 1 | PD | 0.14 | Disk |
| F01341-3735 N | 1 | PD | 0.06 | Disk |
| F04315-0840 | 2 | CK | 0.2 | Disk⋆ |
| F05189-2524 | 2 | CK | 1.14 | Merger |
| F06035-7102 | 1 (ongoing) | CK | 2.91 | Merger |
| F06076-2139 S | 1 | PD | 0.1 | Disk |
| F06076-2139 N | 1 | PD | 0.09 | Disk |
| F06206-6315 | 1 (ongoing) | PD | 1.26 | Merger |
| F06259-4780 S | 1 | RD | 0.09 | Disk |
| F06259-4780 C | 1 | RD | 0.10 | Disk |
| F06259-4780 N | 1 | RD | 0.13 | Disk |
| F06295-1735 | 0 | PD | 0.20 | Disk⋆ |
| F06592-6313 | 0 | PD | 0.13 | Disk |
| F07027-6011 S | 0 | RD | 0.14 | Disk |
| F07027-6011 N | 0 | PD | 0.06 | Disk |
| F07160-6215 | 0 | PD (CK) | 0.47 | Disk⋆ |
| 08355-4944 | 2 | PD | 0.27 | Disk⋆ |
| 08424-3130 S | 1 | PD | 0.17 | Disk |
| 08424-3130 N | 1 | – | – | – |
| F08520-6850 E | 1 | RD | 0.45 | Disk⋆ |
| F08520-6850 W | 1 | PD (RD) | 0.07 | Disk |
| 09022-3615 | 2 | CK | 1.04 | Merger |
| F09437+0317 S | 1 (0) | RD | 0.08 | Disk |
| F09437+0317N | 1 (0) | RD | 0.06 | Disk |
| F10015-0614 | 0 | PD | 0.10 | Disk |
| F10038-3338 | 2 | CK | 0.35 | Disk⋆ |
| F10257-4339 | 2 | PD | 5.88 | Merger |
| F10409-4556 | 0 | RD | 0.16 | Disk |
| F10567-4310 | 0 | RD | 0.05 | Disk |
| F11255-4120 | 0 | PD | 0.07 | Disk |
| F11506-3851 | 0 | RD | 0.08 | Disk |
| F12043-3140 S | 1 | PD | 0.13 | Disk |
| F12043-3140 N | 1 | PD (CK) | 0.71 | Merger⋆ |
| F12115-4656 | 0 | RD | 0.02 | Disk |
| 12116-5615 | 2 (0) | PD | 0.28 | Disk⋆ |
| F12596-1529 | 1 (ongoing) | - | 3.01 | Merger |
| F13001-2339 | 2 (0/1) | CK | 0.93 | Merger⋆ |
| F13229-2934 | 0 | CK | 0.25 | Disk⋆ |
| F14544-4255 E | 1 | PD | 0.15 | Disk |
| F14544-4255 W | 1 | CK (PD) | 0.23 | Disk⋆ |
| F17138-1017 | 2 (0) | PD | 0.22 | Disk⋆ |
| F18093-5744 S | 1 | RD | 0.06 | Disk |
| F18093-5744 C | 1 | CK (PD) | 0.19 | Disk⋆ |
| F18093-5744 N | 1 | RD | 0.05 | Disk |
| F21130-4446 | 2 | CK | 0.34 | Disk⋆ |
| F21453-3511 | 2 | PD | 0.20 | Disk⋆ |
| F22132-3705 | 0 | RD | 0.04 | Disk |
| F22491-1808 | 1 (ongoing) | CK (PD) | 0.95 | Merger |
| F23128-5919 | 1 (ongoing) | CK | 3.62 | Merger |
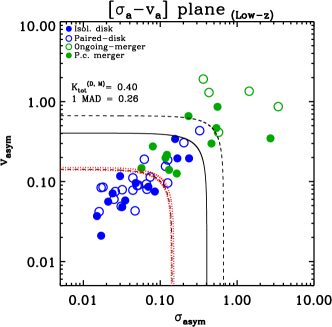
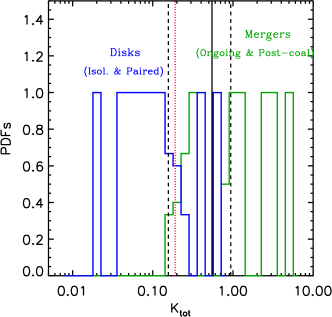
In all the panels we represent the following lines: the red dashed line(s) represents the ‘optimal’ frontier which gives us the Ktot value for which the maximum index I is derived; in solid black line the K value derived according to Eq. 5 while the two dashed black lines represent the statistical frontiers (K 1 MAD).
In all the panels we represent the following lines: the red dashed lines represent the ‘optimal’ frontiers which give us the Ktot values for which the maximum index I is derived; in solid black line the K value derived according to Eq. 5 while the two dashed black lines represent the statistical frontiers (K 1 MAD).
3.5 Total kinematic asymmetries of high–z simulated (U)LIRGs
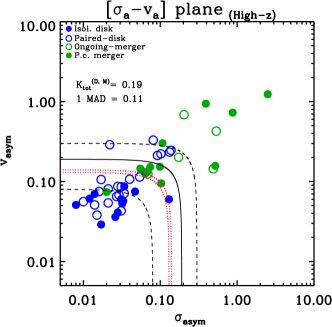
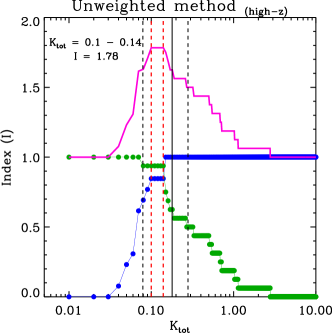
We apply kinemetry to the high–z simulated kinematic maps (see Sect.2.4) and the results are shown in Fig. 3, respectively, for the unweighted (left panels, [-va]High-z) and weighted (right panels, [-v]High-z) planes. As expected, the results are characterized by lower kinematic asymmetries than those obtained locally (e.g., Gonçalves et al. 2010, B12). This result is due to the fact that when lowering the linear resolution the kinematic deviations are smoothed, making objects to appear more symmetric than they actually are. However, a few sources among the ongoing- (i.e., IRAS F06035–7102, IRAS F2249–1808, IRAS F23128–5919) and post-coalescence (i.e., IRAS F09022–3615, IRAS F05189–2524, IRAS F10257–4339, IRAS F13001–2339) mergers still preserve quite high values.
Thus, the distribution of the number of well classified objects as a function of the Ktot is considered (bottom panels in Fig. 3). The main and secondary peaks are identified as well. The maximum index I of 1.7 is reached in both the planes where the Ktot assumes the (average) value of 0.14 and 0.16 in the unweighted and weighted planes, respectively. We derive a disk/merger ratio at high–z of 26/24, which is approximately the same ratio found locally. The value adopted by S08 would imply an index I of 1.4, clearly lower than the optimal value derived by us. In this case about two thirds of our ‘mergers’ would be classified as ‘disks’, largely overestimating the disk/merger ratio in our sample. In such a case the total number of disks would largely exceed the number of mergers by a factor of 7 (44 disks – 6 mergers, 12% mergers).
For the high–z simulated sample the derived Idisk and Imerger fractions result, respectively, in 76% and 94% (for both the methods) when isolated and paired disks are considered as ‘true disks’. If we exclude the paired disks from the ‘true disk’ group, similar results are derived as well (i.e., 85% and 94%; Tab. 4).
3.6 Comparison between low– and high–z kinemetry results in our (U)LIRG sample
As a result, the comparison between local and high–z results obtained using both the unweighted and weighted methods allows to draw the following conclusions:
-
•
At low–z similar results are found for the unweighted and the weighted methods, although for the weighted one ‘disks’ are slightly better separated from ‘mergers’. The optimal Ktot value able to classify the largest number of objects is 0.19: according to this result the derived disk/merger fraction found locally is 27/23 (54% disks, 46% mergers).
-
•
A ‘transition region’ ( Ktot - K 1 MAD) where the disk/merger classification in uncertain is found in the asymmetry plane with the total kinematic values (at low–z) in the range 0.16 (0.14) Ktot 0.94 (0.66) for the weighted (unweighted) plane(s). Outside this range ( Ktot - K 1 MAD) we are able to well classify disks and mergers.
-
•
At high–z, a trend similar to that found locally is obtained but characterized by lower total kinematic asymmetries Ktot as a consequence of the resolution effects. Slightly better results are derived when using the weighted method, in which the main peak in the I distribution is better defined, with a Ktot 0.16 and a resulting disk/merger ratio of 26/24 (52% disks, 48% mergers);
-
•
If the frontier obtained by S08 (Ktot = 0.5) is considered, the fraction of well classified objects (I) would be clearly lower down to 1.6 – 1.4 with respect to our optimal values (I 1.8 – 1.7), respectively, at low– and at high–z. The S08 limit implies that at least half of the post-coalescence mergers would be misclassified as disks thus leading to an overestimation of the disk/merger ratio, with more than 80% of the sources classified as ‘disk’.
-
•
If only isolated disks are considered as ‘true disks’, the index distribution I as a function of Ktot in both the planes, at low– and at high–z, follows the same general trend than that derived when isolated and paired disks are considered as ‘true disks’. In both the cases, the derived fractions of ‘well classified disks’ vs. ‘well classified mergers’ according to the two methods give similar results both locally (80% vs. 100%) and at high–z (75–85% vs. 94%; Tab. 4).
| Method | Idisk (%) | Imerger (%) | Ktot | Idisk (%) | Imerger (%) | Ktot |
|---|---|---|---|---|---|---|
| (1) | (2) | (3) | (4) | (5) | (6) | (7) |
| [case I] | [case II] | |||||
| S08 (obs) low–z | 25/34 (74) | 16/16 (100) | 0.14 – 0.15 | 10/13 (77) | 16/16 (100) | 0.13 – 0.15 |
| B12 (obs) low–z | 27/34 (79) | 16/16 (100) | 0.19 | 10/13 (77) | 16/16 (100) | 0.16 – 0.19 |
| S08 (sim) high–z | 26/34 (76) | 15/16 (94) | 0.13 – 0.14 | 11/13 (85) | 15/16 (94) | 0.1 – 0.14 |
| B12 (sim) high–z | 26/34 (76) | 15/16 (94) | 0.14 – 0.17 | 11/13 (85) | 15/16 (94) | 0.11 – 0.17 |
Col (1): Method used: S08 and B12 stands for ‘unweighted’ and ‘weighted’ methods. ‘Obs’ and ‘sim’ stand for observed and simulated samples. Col (2): Fraction of well classified disks over total number of disks as defined in Eq. 6. when isolated and paired disks are considered as ‘true disks’. The corresponding percentage is in brackets. Col (3): Fraction of well classified mergers over total number of mergers as defined in Eq. 6. when isolated and paired disks are considered as ‘true disks’. The corresponding percentage is in brackets. Col (4): Value of the total (optimal) kinematic asymmetry derived when isolated and paired disks are considered as ‘true disks’. Col (5, 6, 7): Respectively, the same values as in Col (2, 3, 4) when only isolated disks are considered as ‘true disks’.
3.7 Comparison between low– and high–z kinemetry–based results in the literature
In this section we discuss the results obtained in this work with those derived in Hung et al. (2015) (hereafter, H15) for an overlapped subsample of 8 interacting systems101010The overlapped subsample is composed by the following galaxies: F06076–2139 (type 1), 08355–4944 (type 2), F10038–3338 (type 2), F10257–4339 (type 2), F12043–3140 (type 1), F17138–1017 (type 2), F18093–5744 (type 1), F23128–5919 (type 1).. The H15 analysis is based on the application of the unweighted and weighted kinemetry–based methods to a sample of local (U)LIRGs observed with Wide Field Spectrograph (WiFeS) and artificially redshifted to z=1.5 degrading spatial resolution and sensitivity.
Two of these systems (F06076–2139 and F12043–3140) clearly show in the HST and DSS images, respectively, the presence of two merging galaxies in each system, which could not be resolved when simulated at high–z in H15. Their simulated kinematic maps show a complex and irregular pattern and are classified as ‘merger’ according to the B12 criteria. Excluding these two systems, our kinematic classification of the 6 remaining systems (8 galaxies) is in good agreement with their findings. We only find disagreement for 2 of these galaxies (F10257–4339 and F18093–5744 S), classified as ‘merger’ and ‘disk’, respectively, in this work. Thus, for these 8 galaxies, the same disk/merger fraction (2/6) is derived in both the works according to the frontier considered in H15 and that derived in this analysis. If we consider the results derived for our simulated subsample at z=3 the derived disk/merger ratio becomes 3/5, since F17138–1017 shows more ordered kinematic maps at high–z than locally, classified as ‘disk’ according to this analysis.
For this subsample the fractions of correctly identified disks and mergers according to our analysis are Idisk = 2/3 and Imerger = 5/5; according to the H15 analysis, Idisk = 0/1, Imerger = 5/7, since IRAS F17138–1017 is the only galaxy morphologically classified as isolated disk but kinematically classified as merger. Thus, a larger number of well classified disks and mergers is derived according to our analysis (67% and 100%) with respect to that derived in H15 (0% and 71%).
A smaller fraction of mergers at high–z has been also derived by Gonçalves et al. (2010), observing a set of Lyman Break Analogs (LBAs) at z 0.2 and redshifted their sample at z = 2.2. The worse resolution of their simulated maps let decrease the fraction of mergers from low– to high–z, respectively, from 70% to 30% according to the S08 limit.
The angular resolution at which a sample is observed plays a key role in classifying galaxies as ‘disk’ or ‘merger’. On the one hand, the loss of angular resolution, when simulating individual galaxies at high–z, tends to smooth the asymmetries in their kinematic maps, making objects to appear more ‘disky’; on the other hand, when simulating close interacting systems at high–z, it could result in unresolved systems which show more complicated kinematics than if resolved.
3.8 The relationships between the Ktot versus LIR, v∗/ and the projected nuclear separation
In this section the relations between the total kinematic asymmetry Ktot and some kinematical and dynamical parameters are considered. In particular, some trends are found when considering the Ktot as a function of the infrared luminosity LIR, the dynamical ratio v∗/111111The v∗/ is the intrinsic dynamical ratio defined as the ratio of the intrinsic velocity shear to the mean velocity dispersion. See B13 for further details on how these parameters have been computed. and the projected nuclear separation. Since at low–z the Ktot values for the unweighted and weighted planes are only slightly different and the same general trend is conserved, we take into account the unweighted values (i.e., Ktot = 0.145) for a possible comparison with other previous works (e.g., Gonçalves et al. 2010; Alaghband-Zadeh et al. 2012; Swinbank et al. 2012).
3.8.1 The Ktot – LIR relation
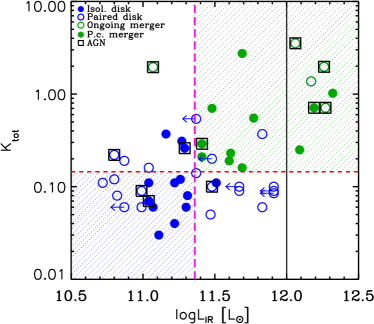
In Fig. 5 the linear trend between the total kinematic asymmetries Ktot as a function of the infrared luminosity LIR is shown. This plot clearly shows the (morphological and kinematical) results summarized in Tab. 2. The majority of the objects with a luminosity L 11.4 L⊙ show high total kinematic asymmetries (19 out of 28 galaxies with Ktot 0.14, green dashed area) and are classified as mergers. On the other hand, most of the less luminous ones (L 11.4 L⊙, 15 out of 22 galaxies with Ktot 0.14, blue dashed area) have lower kinematic asymmetries and are classified as disks. Thus, the luminosity value of log L 11.4 L⊙ seems to suggest it could be considered as a threshold value able to distinguish disks from mergers, but a sample complete in luminosity is needed to confirm this result.
A correlation between the morphology and the LIR has been already found in Veilleux et al. (2002): they derived that LIRGs are generally spirals which show a morphology much less disturbed than that shown in ULIRGs in the early phase of the interaction.
3.8.2 The Ktot – v∗/ relation
A clear correlation between the different phases of the merging process and the mean kinematic properties inferred from the kinematic maps has been found in our sample. In particular, isolated disks, interacting galaxies, and merging systems define a sequence of increasing mean velocity dispersion and decreasing velocity field amplitude, which is characterized by intrinsic average dynamical ratios (v∗/) of 4.7, 3.0, and 1.8, respectively (see B13).
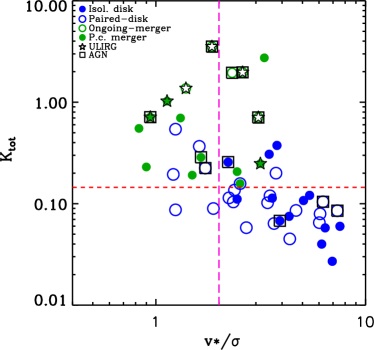
In a similar way, the total kinematic asymmetry Ktot quantifies the kinematic asymmetry degree in a galaxy with respect to the ideal rotating disk case. In Fig. 6 the relation between (unweighted) Ktot and v∗/ for each source is considered. A (linear log – log) inverse trend is found: the more rotation-dominated objects (v∗/ 2) generally show lower values of the total kinematic asymmetries (Ktot 0.14) with respect to those derived for dispersion-dominated systems (i.e., v∗/ 2, Ktot 0.14), as expected. In order to quantify how well the 1D parameter v∗/ classifies disks and mergers in our sample with respect to the kinemetry results, we compute the fraction of well classified objects as before (i.e., Sect. 3.4 and 3.5) deriving an index I = 1.4. This value is smaller than the one obtained using the total kinematic asymmetry Ktot, which is indicative that when the full 2D information is taken into account to study the kinematic asymmetries a better classification is obtained. All the ULIRGs are well classified as mergers according to our kinemetry frontier while only a small fraction (3 out of 7) is classified as such according to the v∗/ parameter. This confirms the importance of the 2D kinematic analysis in unveiling the real status of these systems.
Our dynamical ratio threshold (v∗/ = 2) is in good agreement with that derived by Kassin et al. (2012). Indeed, studying the kinematics of a large sample of 544 blue galaxies over the last 8 billion years (0.2 z 1.2), they found that such systems become progressively more ordered with time as distorted motions decrease and rotation velocities increase. They define a kinematically ‘settled disk’ as having a ratio of ordered/random motions larger than three (v/ 3), also deriving that the fraction of settled disks increases with time (decreases with z) since z = 1.2 for galaxies with stellar mass over 8 log M⋆ 10.7. The kinematic disk settling has be explained as due to: 1) a high frequency of merging at high–z and 2) higher gas fraction at early times. Since both these factors decrease with time, a general kinematic settling is expected with time (‘kinematic downsizing’). According to their work, the galaxies settle to become the rotation-dominated disks found in the universe today, with the most massive galaxies being the most evolved at any time. Furthermore, at all redshifts they found that the most massive galaxies are on average the most kinematically settled while the least massive galaxies the least kinematically settled.
In our analysis we derived a similar trend: the most massive (logMdyn = 10.71 M⊙, median value 10.69 M⊙) and (morphologically) regular objects (class 0 isolated galaxies) show the highest dynamical ratio (v∗/ = 4.7) while the less massive pre- and post-coalescence galaxies (logMdyn = 10.68 M⊙, median value 10.54 M⊙ and 10.67 M⊙, median value 10.23 M⊙, respectively; see Tab.2 in B13) are characterized by lower v∗/, of 3.0 and 1.8, respectively.
If we apply a threshold value of v∗/ = 3 to our data (see Fig. 5), it also suggests a good frontier to distinguish our systems in ‘disks’ and ‘mergers’. In such a case, 21 out of 34 objects are well classified as ‘disks’, while 13 out of 16 are well classified as ‘mergers’, deriving an index parameter I = 1.43. This value is larger than the one derived when using the v∗/ = 2, but still lower with respect to that derived when using kinemetry, which gives the largest number of well classified ‘disks’ and ‘mergers’.
3.8.3 Kinematic asymmetries as a function of the nuclear separation along the merger process
We analyze the relation between the projected nuclear separation and the total kinematic asymmetry Ktot for those pair of galaxies for which a nuclear separation can be computed. In particular, the nuclear separation can be estimated for 19 systems121212We refer to the type 0 system IRAS F07027–6011, type 1 systems IRAS F01159–4443, IRAS F01341–3735, IRAS F06035–7102, IRAS F06076–2139, IRAS F06206–6315, IRAS F06259–4780, IRAS 08424–3130, IRAS F08520–6850, IRAS F09437+0317, IRAS F12043–3140, IRAS 12596–1529, IRAS F14544–4255, IRAS F18093–5744, IRAS F22491–1808, IRAS F23128–5919 and to a few type 2 objects IRAS 08355–4944, IRAS F10038–3338 and IRAS F21453–3511.. An upper limit has been computed for the majority of the type 2 galaxies (assuming a nuclear separation smaller than the resolution element of the image considered). The HST and VIMOS continuum images have been used to derive the projected nuclear separation. In three cases (i.e., IRAS F01341–3735, IRAS F09437+0317, IRAS F14544–4255) the DSS images have been used since a larger FoV was needed to cover the whole system.
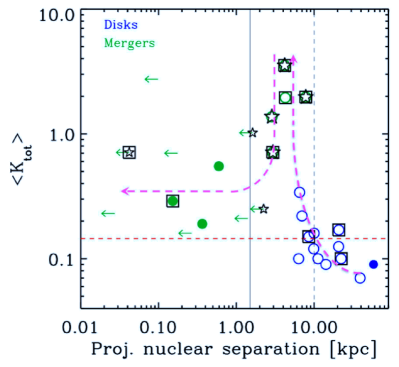
In Fig. 7 the mean value of the (unweighted) Ktot () of each system is related to its nuclear projected separation. This plot highlights the fact that, during the first phases of the merging process, the smaller the nuclear separation of a system the higher its total kinematic asymmetry. Moreover, the maximum asymmetry value Ktot is reached for the ongoing mergers with nuclear separation 2-5 kpc, in which the merger phase is currently taking place. Then, a more unclear trend is shown for the post-coalescence mergers (i.e., type 2; nuclear separation less than 1.5 kpc), although their values are generally lower than those characterizing ongoing mergers. The virialization of the inner parts of these objects explains such results. The pink dashed line in Fig. 7 helps to highlight the possible average evolutionary sequence obtained when a galaxy goes through the wide-interacting to the post-coalescence phases.
As shown in this plot, a trend is found between the interaction stage (based on a morphological classification) and the kinematic asymmetries of our systems. Our results are in agreement with those presented in H15 (Fig. 3 in their work), where the fraction of disk/merger galaxies classified using the kinemetry criteria is shown as a function of the interaction stage. The agreement between our and their results can be explained as follows. A galaxy with a low value of the total kinematic asymmetry Ktot (0.16) results in a ‘disk’-like (regular) kinematics while a high Ktot value (0.9) corresponds to a more disturbed and complex kinematics. Thus, Ktot can be considered as a proxy of the fraction of mergers. In their work, going through the different interaction stages, from isolated to post-coalescence objects (from S to M4 stages), the maximum merger fraction is reached in the case of merged galaxies which still show two distinct nuclei (M3): their M3 galaxies correspond to our close-interacting systems, that show the highest Ktot values. In particular, the mean Ktot values (see Tab. 2) as a function of the interaction stage (isolated and paired disks, ongoing- and post-coalescence mergers) reproduce a trend similar to that derived by H15.
4 Summary
We have carried out a kinemetry-based classification for a large sample of 38 local (z 0.1) (U)LIRG systems observed with VIMOS/VLT with IFS. The sample covers a wide range of morphological types (i.e., spirals, interacting systems and merger remnants) and it is therefore well suited to study how the kinemetry–based criteria are able to distinguish disks and mergers in our objects. The disk/merger fraction allow us to constrain different evolutionary scenarios. Specifically we have applied the S08 (‘unweighted’) and B12 (‘weighted’) criteria to derive the total kinematic asymmetry (Ktot) to our observed sample as well as to simulated data, ‘redshifting’ our sample at z=3. From our analysis we draw the following conclusions:
Kinematic distinction between disks/mergers
-
1.
The kinematic properties derived using the kinemetry–based methods are consistent with their morphological classification. The results obtained using the weighted and unweighted methods are similar when the whole sample is considered.
-
2.
We can distinguish our sample in three kinematic groups according to the total kinematic asymmetry value Ktot when using the weighted (unweighted) method: 1) 25 out of 50 galaxies are kinematically classified as ‘disk’, with a Ktot 0.16 (0.14); 2) 9 out of 50 galaxies are kinematically classified as ‘merger’, with a Ktot 0.94 (0.66); 3) 16 out of 50 galaxies lie in the ‘transition region’, in which ‘disks’ and ‘mergers’ coexist, with 0.16 (0.14) Ktot 0.94 (0.66).
-
3.
The Ktot frontier value that better classifies the highest numbers of ‘disks’ and ‘mergers’, according to the morphology is Ktot = 0.19 (0.15): we obtain 27 (25) ‘disks’ and 23 (25) ‘mergers’ according to this value.
The percentages of ‘correctly identified’ disks and mergers at low–z result in, respectively, 79% (74%) – 100%. If only isolated disk galaxies are considered as ‘true disks’, similar fractions are obtained with both the methods.
-
4.
When we apply our criteria to our systems simulated at z=3 just considering resolution effects, a lower total kinematic asymmetry frontier (Ktot 0.16 (0.14)) with respect to that found locally is derived when using the weighted (unweighted) method. We obtain 26 ‘disks’ and 24 ‘mergers’ according to this value.
However, the ‘correctly identified’ disks and merger fractions for the simulated high–z objects is 76% – 94% with both the methods. If only isolated disk galaxies are considered as ‘true disks’, these values become, respectively, 85% and 94%.
The loss of angular resolution makes objects to appear more kinematically regular (‘disky’) than actually they are as a consequence of the smearing of the kinematic features.
Relationships between the kinemetry–based Ktot and morpho–kinematic parameters
-
5.
A trend is found between the Ktot and the infrared luminosity LIR, with the most luminous objects (ULIRGs) showing the highest total kinematic asymmetries. Furthermore, the luminosity value log L 11.4 L⊙ suggests that it could be considered as a threshold value able to separate these two morphological classes. To confirm this, a sample complete in luminosity is needed.
-
6.
An inverse trend is derived between the Ktot and the intrinsic dynamical ratio v∗/: morphologically classified disks show higher dynamical ratio (v∗/ 2) and lower total kinematic asymmetry Ktot ( 0.14). Contrary, for the mergers v∗/ is lower ( 2) while Ktot is higher ( 0.14).
Our results support the ‘kinematic downsizing’ scenario proposed by Kassin et al. (2012), where systems become progressively more ordered with time as distorted motions decrease and rotation velocities increase, where the most massive galaxies are on average the most kinematically settled.
-
7.
An interesting trend is also found between the Ktot and the projected nuclear separation (as a proxy of the galaxy interaction stage) along the merger process. The smaller the nuclear separation the larger the Ktot, which reaches its maximum value during the ‘ongoing merging phase’ (nuclear separation between the galaxies of 2–5 kpc) and then decreases during the post-coalescence merging phase, although with a relatively large dispersion. Our results are in agreement with those derived in Hung et al. (2015), who found that the merger fraction (as a proxy of the Ktot parameter) shows a strong trend with the galaxy interaction stage.
The robustness of the Ktot frontier determination in classifying disks and mergers
-
8.
From our results, the kinematic frontier we derive to distinguish ‘disks’ from ‘mergers’ is well determined. Indeed, when type 1 (interacting) objects are included (case I) or not (case II) in the ‘disk’ group, the derived fractions of ‘well classified’ disks and merger in both the cases are very akin, 80% and 100%, respectively.
This result can also confirm that the ‘paired disk’ objects can actually be considered as ‘disks’ according to their kinematic asymmetries. -
9.
The Ktot limit derived by Shapiro et al. (2008) (Ktot = 0.5) to separate ‘disks’ from ‘mergers’ at high–z is 65% larger, respectively, than the one found by us for the whole sample (observed locally and simulated at high–z) with both the weighted and unweighted methods. The use of this frontier would imply that the number of ‘disks’ in our sample would be largely overestimated (classifying the 85% of the galaxies as ‘disk’), since only the ongoing– and some of the post–coalescence mergers with more complex kinematics would be classified as ‘mergers’. This, together with the effects of resolution on high–z samples, suggests that the fraction of disks at high–z inferred from similar kinematic criteria may be overestimated.
-
10.
The value of the frontier derived using the kinemetry–based methods strongly depends on the morphological classification which is key when analyzing high–z SGFs. Such systems may be dominated by several mechanisms and characterized by different gas and dust content, stellar mass and interaction stage. Thus, the combination of high resolution morphology (such as those coming from HST or AO–assisted imaging) along with spatially resolved kinematics will allow one to reveal the dynamical state of such systems (Neichel et al. 2008). Multi-wavelength morphological observations are needed to study the molecular gas phase (closely related to star formation) as well as the stars to better constrain the disk/merger fraction of SFGs at high–z.
Acknowledgements.
We acknowledge the anonymous referee for useful comments and suggestions, that helped us to improve the quality and presentation of the paper. This work was funded in part by the Marie Curie Initial Training Network ELIXIR of the European Commission under contract PITN-GA-2008-214227. This work has been supported by the Spanish Ministry of Science and Innovation (MICINN) under grant ESP2007-65475-C02-01, PNAYA2010-21161-C02-01, AYA2010-21697-C05-01, PNAYA2012-32295, PNAYA2012-39408-C02-01. Based on observations carried out at the European Southern observatory, Paranal (Chile), Programs 076.B-0479(A), 078.B-0072(A) and 081.B-0108(A). This research made use of the NASA/IPAC Extragalactic Database (NED), which is operated by the Jet Propulsion Laboratory, California Institute of Technology, under contract with the National Aeronautic and Space Administration.References
- Alaghband-Zadeh et al. (2012) Alaghband-Zadeh, S., Chapman, S. C., Swinbank, A. M., et al. 2012, ArXiv e-prints
- Arribas et al. (2012) Arribas, S., Colina, L., Alonso-Herrero, A., et al. 2012, A&A, 541, A20
- Arribas et al. (2014) Arribas, S., Colina, L., Bellocchi, E., Maiolino, R., & Villar-Martin, M. 2014, ArXiv e-prints
- Arribas et al. (2008) Arribas, S., Colina, L., Monreal-Ibero, A., et al. 2008, A&A, 479, 687
- Baugh (2006) Baugh, C. M. 2006, Reports on Progress in Physics, 69, 3101
- Bellocchi et al. (2012) Bellocchi, E., Arribas, S., & Colina, L. 2012, A&A, 542, A54
- Bellocchi et al. (2013) Bellocchi, E., Arribas, S., Colina, L., & Miralles-Caballero, D. 2013, A&A, 557, A59
- Bouché et al. (2010) Bouché, N., Dekel, A., Genzel, R., et al. 2010, ApJ, 718, 1001
- Bournaud et al. (2011) Bournaud, F., Chapon, D., Teyssier, R., et al. 2011, ApJ, 730, 4
- Bournaud et al. (2008) Bournaud, F., Daddi, E., Elmegreen, B. G., et al. 2008, A&A, 486, 741
- Burkert et al. (2010) Burkert, A., Genzel, R., Bouché, N., et al. 2010, ApJ, 725, 2324
- Cazzoli et al. (2014) Cazzoli, S., Arribas, S., Colina, L., et al. 2014, A&A, 569, A14
- Cazzoli et al. (2016) Cazzoli, S., Arribas, S., Maiolino, R., & Colina, L. 2016, ArXiv e-prints
- Ceverino et al. (2010) Ceverino, D., Dekel, A., & Bournaud, F. 2010, MNRAS, 404, 2151
- Cole et al. (1994) Cole, S., Aragon-Salamanca, A., Frenk, C. S., Navarro, J. F., & Zepf, S. E. 1994, MNRAS, 271, 781
- Cole et al. (2000) Cole, S., Lacey, C. G., Baugh, C. M., & Frenk, C. S. 2000, MNRAS, 319, 168
- Combes (2004) Combes, F. 2004, in Astrophysics and Space Science Library, Vol. 319, Penetrating Bars Through Masks of Cosmic Dust, ed. D. L. Block, I. Puerari, K. C. Freeman, R. Groess, & E. K. Block, 57
- Conselice (2006) Conselice, C. J. 2006, MNRAS, 373, 1389
- Conselice et al. (2003) Conselice, C. J., Chapman, S. C., & Windhorst, R. A. 2003, ApJ, 596, L5
- Cresci et al. (2009) Cresci, G., Hicks, E. K. S., Genzel, R., et al. 2009, ApJ, 697, 115
- Cresci et al. (2010) Cresci, G., Mannucci, F., Maiolino, R., et al. 2010, Nature, 467, 811
- Daddi et al. (2007) Daddi, E., Dickinson, M., Morrison, G., et al. 2007, ApJ, 670, 156
- Dasyra et al. (2008) Dasyra, K. M., Yan, L., Helou, G., et al. 2008, ApJ, 680, 232
- Davé (2008) Davé, R. 2008, MNRAS, 385, 147
- Dekel et al. (2009a) Dekel, A., Birnboim, Y., Engel, G., et al. 2009a, Nature, 457, 451
- Dekel et al. (2009b) Dekel, A., Sari, R., & Ceverino, D. 2009b, ApJ, 703, 785
- Elbaz et al. (2007) Elbaz, D., Daddi, E., Le Borgne, D., et al. 2007, A&A, 468, 33
- Elbaz et al. (2011) Elbaz, D., Dickinson, M., Hwang, H. S., et al. 2011, A&A, 533, A119
- Elbaz et al. (2010) Elbaz, D., Hwang, H. S., Magnelli, B., et al. 2010, A&A, 518, L29
- Epinat (2011) Epinat, B. 2011, ArXiv e-prints
- Epinat et al. (2009) Epinat, B., Contini, T., Le Fèvre, O., et al. 2009, A&A, 504, 789
- Flores et al. (2006) Flores, H., Hammer, F., Puech, M., Amram, P., & Balkowski, C. 2006, A&A, 455, 107
- Förster Schreiber et al. (2009) Förster Schreiber, N. M., Genzel, R., Bouché, N., et al. 2009, ApJ, 706, 1364
- Förster Schreiber et al. (2006) Förster Schreiber, N. M., Genzel, R., Lehnert, M. D., et al. 2006, ApJ, 645, 1062
- Förster Schreiber et al. (2011) Förster Schreiber, N. M., Shapley, A. E., Genzel, R., et al. 2011, ApJ, 739, 45
- Genel et al. (2008) Genel, S., Genzel, R., Bouché, N., et al. 2008, ApJ, 688, 789
- Genzel et al. (2008) Genzel, R., Burkert, A., Bouché, N., et al. 2008, ApJ, 687, 59
- Genzel et al. (2011) Genzel, R., Newman, S., Jones, T., et al. 2011, ApJ, 733, 101
- Genzel et al. (2001) Genzel, R., Tacconi, L. J., Rigopoulou, D., Lutz, D., & Tecza, M. 2001, ApJ, 563, 527
- Glazebrook (2013) Glazebrook, K. 2013, PASA, 30, 56
- Gnerucci et al. (2011) Gnerucci, A., Marconi, A., Cresci, G., et al. 2011, A&A, 528, A88
- Gonçalves et al. (2010) Gonçalves, T. S., Basu-Zych, A., Overzier, R., et al. 2010, ApJ, 724, 1373
- Governato et al. (2009) Governato, F., Brook, C. B., Brooks, A. M., et al. 2009, MNRAS, 398, 312
- Governato et al. (2007) Governato, F., Willman, B., Mayer, L., et al. 2007, MNRAS, 374, 1479
- Hammer et al. (2009) Hammer, F., Flores, H., Puech, M., et al. 2009, A&A, 507, 1313
- Hopkins et al. (2009a) Hopkins, P. F., Cox, T. J., Younger, J. D., & Hernquist, L. 2009a, ApJ, 691, 1168
- Hopkins et al. (2009b) Hopkins, P. F., Hernquist, L., Cox, T. J., Keres, D., & Wuyts, S. 2009b, ApJ, 691, 1424
- Hung et al. (2015) Hung, C.-L., Rich, J. A., Yuan, T., et al. 2015, ApJ, 803, 62
- Jones et al. (2010) Jones, T., Ellis, R., Jullo, E., & Richard, J. 2010, ApJ, 725, L176
- Kartaltepe et al. (2012) Kartaltepe, J. S., Dickinson, M., Alexander, D. M., et al. 2012, ApJ, 757, 23
- Kartaltepe et al. (2010) Kartaltepe, J. S., Sanders, D. B., Le Floc’h, E., et al. 2010, ApJ, 721, 98
- Kassin et al. (2012) Kassin, S. A., Weiner, B. J., Faber, S. M., et al. 2012, ApJ, 758, 106
- Kereš et al. (2005) Kereš, D., Katz, N., Weinberg, D. H., & Davé, R. 2005, MNRAS, 363, 2
- Krajnović et al. (2006) Krajnović, D., Cappellari, M., de Zeeuw, P. T., & Copin, Y. 2006, MNRAS, 366, 787
- Kronberger et al. (2007) Kronberger, T., Kapferer, W., Schindler, S., & Ziegler, B. L. 2007, A&A, 473, 761
- Le Fèvre et al. (2003) Le Fèvre, O., Saisse, M., Mancini, D., et al. 2003, in Presented at the Society of Photo-Optical Instrumentation Engineers (SPIE) Conference, Vol. 4841, Society of Photo-Optical Instrumentation Engineers (SPIE) Conference Series, ed. M. Iye & A. F. M. Moorwood, 1670–1681
- Le Floc’h et al. (2005) Le Floc’h, E., Papovich, C., Dole, H., et al. 2005, ApJ, 632, 169
- Lehnert et al. (2009) Lehnert, M. D., Nesvadba, N. P. H., Le Tiran, L., et al. 2009, ApJ, 699, 1660
- Lemoine-Busserolle et al. (2010) Lemoine-Busserolle, M., Bunker, A., Lamareille, F., & Kissler-Patig, M. 2010, MNRAS, 401, 1657
- Lemoine-Busserolle & Lamareille (2010) Lemoine-Busserolle, M. & Lamareille, F. 2010, MNRAS, 402, 2291
- Lotz et al. (2008) Lotz, J. M., Jonsson, P., Cox, T. J., & Primack, J. R. 2008, MNRAS, 391, 1137
- Mihos & Hernquist (1996) Mihos, J. C. & Hernquist, L. 1996, ApJ, 464, 641
- Monreal-Ibero et al. (2010) Monreal-Ibero, A., Arribas, S., Colina, L., et al. 2010, A&A, 517, A28+
- Neichel et al. (2008) Neichel, B., Hammer, F., Puech, M., et al. 2008, A&A, 484, 159
- Noeske et al. (2007) Noeske, K. G., Weiner, B. J., Faber, S. M., et al. 2007, ApJ, 660, L43
- Nordon et al. (2012) Nordon, R., Lutz, D., Genzel, R., et al. 2012, ApJ, 745, 182
- Nordon et al. (2010) Nordon, R., Lutz, D., Shao, L., et al. 2010, A&A, 518, L24
- Ocvirk et al. (2008) Ocvirk, P., Pichon, C., & Teyssier, R. 2008, MNRAS, 390, 1326
- Papovich et al. (2007) Papovich, C., Rudnick, G., Le Floc’h, E., et al. 2007, ApJ, 668, 45
- Pérez-González et al. (2005) Pérez-González, P. G., Rieke, G. H., Egami, E., et al. 2005, ApJ, 630, 82
- Pérez-González et al. (2008) Pérez-González, P. G., Rieke, G. H., Villar, V., et al. 2008, ApJ, 675, 234
- Pope et al. (2006) Pope, A., Scott, D., Dickinson, M., et al. 2006, MNRAS, 370, 1185
- Puech (2010) Puech, M. 2010, MNRAS, 406, 535
- Puech et al. (2012) Puech, M., Hammer, F., Hopkins, P. F., et al. 2012, ApJ, 753, 128
- Robertson et al. (2006) Robertson, B., Bullock, J. S., Cox, T. J., et al. 2006, ApJ, 645, 986
- Rodríguez-Zaurín et al. (2011) Rodríguez-Zaurín, J., Arribas, S., Monreal-Ibero, A., et al. 2011, A&A, 527, A60+
- Sanders et al. (2003) Sanders, D. B., Mazzarella, J. M., Kim, D.-C., Surace, J. A., & Soifer, B. T. 2003, AJ, 126, 1607
- Sanders & Mirabel (1996) Sanders, D. B. & Mirabel, I. F. 1996, ARA&A, 34, 749
- Shapiro et al. (2008) Shapiro, K. L., Genzel, R., Förster Schreiber, N. M., et al. 2008, ApJ, 682, 231
- Somerville et al. (2001) Somerville, R. S., Primack, J. R., & Faber, S. M. 2001, MNRAS, 320, 504
- Swinbank et al. (2012) Swinbank, A. M., Sobral, D., Smail, I., et al. 2012, MNRAS, 426, 935
- Tacconi et al. (2008) Tacconi, L. J., Genzel, R., Smail, I., et al. 2008, ApJ, 680, 246
- Tacconi et al. (2006) Tacconi, L. J., Neri, R., Chapman, S. C., et al. 2006, ApJ, 640, 228
- Takagi et al. (2010) Takagi, T., Ohyama, Y., Goto, T., et al. 2010, A&A, 514, A5
- van Starkenburg et al. (2008) van Starkenburg, L., van der Werf, P. P., Franx, M., et al. 2008, A&A, 488, 99
- Veilleux et al. (2002) Veilleux, S., Kim, D.-C., & Sanders, D. B. 2002, ApJS, 143, 315
- Wisnioski et al. (2011) Wisnioski, E., Glazebrook, K., Blake, C., et al. 2011, MNRAS, 417, 2601
- Wright (2006) Wright, E. L. 2006, PASP, 118, 1711
- Wuyts et al. (2011) Wuyts, S., Förster Schreiber, N. M., van der Wel, A., et al. 2011, ApJ, 742, 96
- Yang et al. (2008) Yang, Y., Flores, H., Hammer, F., et al. 2008, A&A, 477, 789
- Zamojski et al. (2011) Zamojski, M., Yan, L., Dasyra, K., et al. 2011, ApJ, 730, 125