Channel Decorrelation For Stereo Acoustic Echo Cancellation In High-Quality Audio Communication
Abstract
In this paper, we address an important problem in high-quality audio communication systems. Acoustic echo cancellation with stereo signals is generally an under-determined problem because of the generally important correlation that exists between the left and right channels. In this paper, we present a novel method of significantly reducing that correlation without affecting the audio quality. This method is perceptually motivated and combines a shaped comb-allpass (SCAL) filter with the injection of psychoacoustically masked noise. We show that the proposed method performs significantly better than other known methods for channel decorrelation.
I Introduction
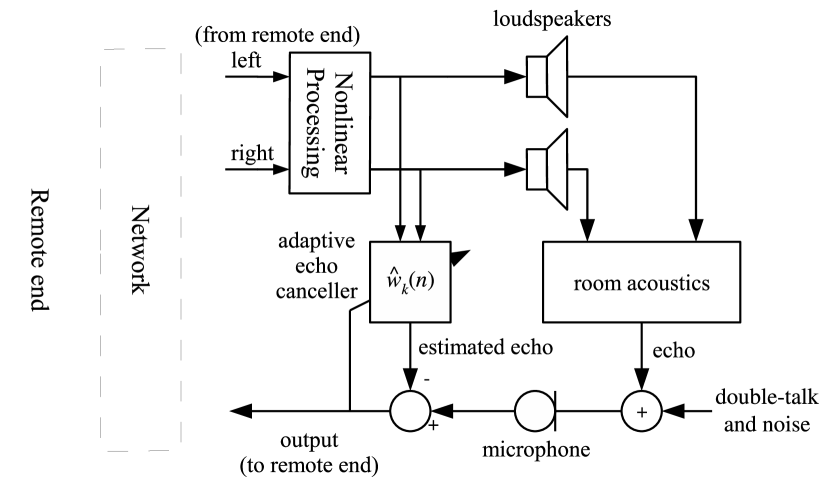
One of the main problems encountered by videoconference users is the presence of acoustic echo. Sound produced by the loudspeakers is received by the microphones and sent back to the remote users. This creates an echo, as users hear the sound of their own voice with a delay. As videoconferencing applications incorporate higher sampling rates and multiple channels, the problem of cancelling acoustic echo becomes harder. One of the main difficulty in stereo echo cancellation is the strong correlation that exists between the left and right channel, making it harder or even impossible to estimate the echo filter.
For that reason, it is necessary to reduce the correlation between channels [1]. This can be done by altering the signals using some form of non-linear transformation, as illustrated in Fig. 1. Most of the methods proposed so far to reduce inter-channel correlation tend to introduce too much audible distortion to the signal, especially for music. In this paper, we propose a non-linear processing that closely matches human perception to maximise decorrelation while minimising the negative impact on audio quality.
The paper is divided as follows. Section II presents an overview of the stereo acoustic echo cancellation problem. Sections III and IV describe the two different parts of the algorithm, respectively the all-pass filtering and the noise injection. Section V presents the result of comparison with other algorithms and Section VI concludes this paper.
II Overview And Motivations
In a multi-channel audio system, there usually exists a correlation between channels (loudspeakers) that causes the filter optimisation problem to be under-determined. This means that it can be impossible to determine the exact contribution of each loudspeaker in the captured echo because there are an infinity of solutions. It is desirable to maximise the audio quality, while minimising the inter-channel coherence. The square coherence is defined as [2]:
| (1) |
where denotes the cross-spectrum operator. Assuming there is no linear transformation involved in the process, the equivalent frequency-dependent signal-to-noise ratio (SNR) can be expressed as:
| (2) |
Many of the approaches proposed so far to reduce inter-channel coherence have focused on using memoryless non-linearities [2]. The main advantage of memoryless non-linearities is that they are easy to compute. However, non-linearities of this kind introduce inter-modulation distortion, which quickly degrades sound quality. Also, there is little control regarding how much perturbation is caused as a function of frequency.
Another popular approach is to alter of the phase of the signal in a time varying way [3, 4]. The time-varying aspect of the transformation is important because the transformation would otherwise be linear and thus unable to reduce inter-channel coherence. The phase of an audio can be altered either through the use of an all-pass filter, or in the short-term Fourier transform (STFT) domain.
The algorithm we propose in this work was designed to reach the following goals:
-
•
Minimising inter-channel coherence
-
•
Maintaining good quality audio
-
•
Not altering stereo image in an unpleasant way
-
•
Not introducing additional delay
Because latency is a very important aspect in the perception of acoustic echo, it is not acceptable for the proposed algorithm to introduce additional latency. However, it is still possible to use block-based processing because it is assumed that the transmission and coding (if any) is performed on blocks.
The strategy we propose for decorrelating the audio is illustrated in Fig. 2 and is divided into two steps:
-
•
Time-varying phase alteration (mainly at high frequencies)
-
•
Addition of psychoacoustically-masked noise (mainly at low frequencies)

III Shaped Comb-Allpass (SCAL) Filtering
Allpass filters have a flat frequency response with non-linear phase and can be represented by the general form:
| (3) |
The transfer function in Eq. 3 can be made causal by adding a constant delay, which leads to:
| (4) |
A filter of the form of Eq. 4 is generally hard to design. However, it is possible to alter the phase similarly across all frequencies by using a simple comb-allpass filter:
| (5) |
The filter in Eq. 5 combines an all-pole comb filter to a maximum-phase all-zero comb filter, so the poles and zeros are equally spread along the frequency axis.
For the processing to be non-linear, it is required to vary the parameter controlling the filter. This is achieved through using overlapping windows with a constant for each window. We use both an analysis window and a synthesis window to prevent any blocking artifacts. The signal is then reconstructed using weighted overlap-add (WOLA). Because all-pass filtering is a time-domain process, no extra delay is added because at any given time, we do not need to apply the allpass filter on whole window. For the analysis-synthesis WOLA process, we choose the Vorbis window [5], which meets the Princen-Bradley criterion [6] and is defined as:
| (6) |
When using a filter of order , there are points on the unit-circle where the phase response is zero, regardless of . In other words, there are frequencies where no decorrelation occurs. For this reason, it is necessary to also vary the order of the filter in so that the “nulls” in the phase response change as a function of time.
Interaural phase difference (IPD) is an important localisation cue at lower frequencies, so the human ear is more sensitive to phase distortion in the low frequencies. For that reason, it is important to “shape” the phase modulation as a function of frequency. It is desirable to introduce less distortion to the phase at lower frequencies than at higher frequencies. To do so, we propose a shaped comb-allpass (SCAL) filter of the form:
| (7) |
where controls the depth of the filter and controls the tilt. Stability is guaranteed (sufficient condition) as long as
| (8) |
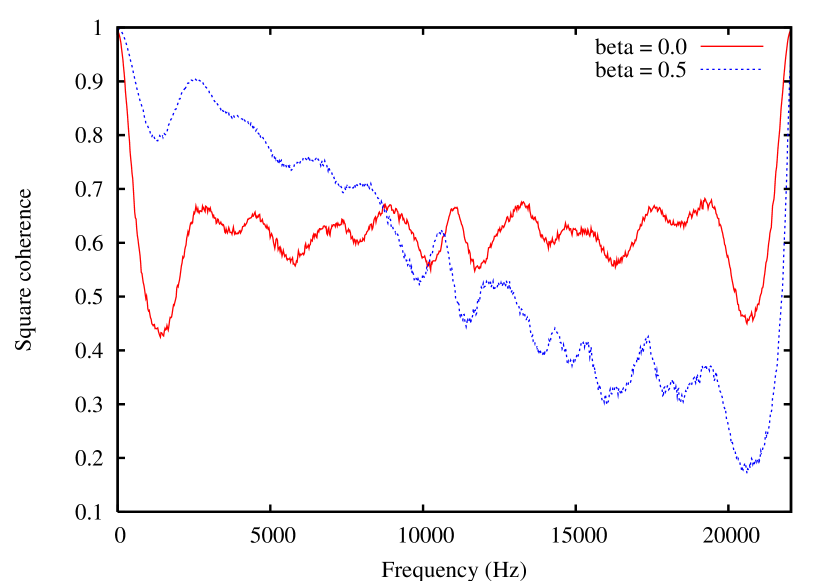
The effect of the tilt parameter demonstrated in Fig. 3 and can be explained by the fact that as increases, the poles and zeros of the all-pass filter move closer to the unit circle at high frequencies and away from the unit circle at lower frequencies.
For each new window, once the order is determined, we choose for each frame as:
| (9) |
where is a uniformly-distributed random variable chosen in the range (typically ) and controls the distance to the unit circle of the high frequency poles. The SCAL filter has an overall complexity of only 23 operations per sample, which is negligible when compared to the complexity of the adaptive filtering used to cancel the echo.
IV Psychoacoustically-Masked Noise
The SCAL processing in Section III is mainly effective for frequencies above 2 kHz. For lower frequencies, the ear is more sensitive to phase distortion (altering stereo image), so it is preferable to inject noise that is uncorrelated to the audio signal. In this work, we use the psychoacoustic model from the Vorbis audio codec, as described in [7]. The output of the psychoacoustic model determines the amount and spectral shape of the noise that can be added without significantly altering perceptual audio quality. The psychoacoustic model is also tuned to introduce less noise in higher frequencies because those are already decorrelated by the SCAL filter.
The noise to be added is generated in the frequency domain. Again, we make use of weighted overlap-and-add to reconstruct the time-domain signal. To avoid adding a delay to the signal of interest, only the noise is delayed and added to the (non-delayed) input signal. This is made possible because of the temporal masking effect. The amount of decorrelation is controlled by the gain applied to the noise before adding it to the signal.
Because we are adding a random signal during the WOLA process, it is the power that is added and not amplitude. For that reason, we again need to use a window that satisfies the Princen-Bradley criterion, and choose the window in Eq. 6.
In practice, this step can be made very simple if an audio codec is already used in the system. If the codec has a low bit-rate, then it already introduces correlation. Otherwise, it is usually possible to recover the masking curve from the bit-stream and use it to generate the noise. This makes it possible to keep the complexity low, again not contributing significantly to the total complexity of the echo cancellation process.
V Evaluation And Results
In this evaluation, we compare three different decorrelation algorithms:
-
•
Proposed algorithm
-
•
Smoothed absolute value
-
•
First-order, time varying all-pass filter
First, the smoothed absolute value non-linearity is defined as:
| (10) |
with as recommended in [2]. We compare with this method because it was shown in [2] to be among the best memoryless non-linearity. The time-varying first order all-pass filter is implemented as described by [3] but using to account for the different sampling rate used in this work.
The block-based phase alteration method proposed in [4] was excluded from the comparison because the boundary artifacts caused by the block processing at high sampling rate causes major quality degradation, even for very small amounts of decorrelation. While a WOLA approach could be used, it would involve additional delay, something which is not acceptable in this context.
In both the proposed algorithm and the first-order all-pass filter, there is a random component, so it is possible to independently process each channel with the algorithm. On the other hand, applying the same memoryless nonlinearity (smoothed absolute value in this case) to each channel would not reduce the coherence. For that reason, we invert the sign of the used for each channel.
V-A Methodology
We evaluate the algorithms by considering the amount of de-correlation they provide and the degradation in quality they cause. The coherence in Eq. 1 is defined as a function of frequency, which makes it hard to compare different algorithms. For this reason, we propose the Bark-weighted square coherence, which we define as:
| (11) |
where is the derivative of the Bark scale function , defined as:
| (12) |
The use of the Bark scale means that each critical band is given the same weight when computing the coherence value.
In order to evaluate quality, we use the ITU-R BS.1387 Perceptual Evaluation of Audio Quality (PEAQ) recommendation [8]. We use the basic version implementation by Kabal [9]111Source code for the software is available from McGill University at: http://www-mmsp.ece.mcgill.ca/Documents/Software/ with eight different audio excerpts. Six of them (piano, female speech, male speech, glockenspiel, castanets, quartet) are taken from EBU Tech 3253 - Sound Quality Assessment Material (SQAM), while the other two (guitar, Suzanne Vega) are from popular music. We consider the worst-case scenario of a mono signal going through both loudspeakers, so the initial coherence is (by definition) equal to 1. All excerpts are sampled at 44.1 kHz.
The algorithms are tested in six configurations:
-
•
P1: Proposed algorithm, ,
-
•
P2: Proposed algorithm, ,
-
•
P3: Proposed algorithm, ,
-
•
P4: Smoothed absolute value,
-
•
P5: Smoothed absolute value,
-
•
P6: First-order all-pass filter,
V-B Quality and Coherence
PEAQ quality results in Table I show clearly that P4 and P5 alter quality in an unacceptable (values below -1.5) way for most samples, while P6 has very unequal quality. Outside of the obvious results (e.g. P1 outperforms P2, which outperforms P3), a (paired) Student’s t-test reveals with 95% confidence, that all configurations of the proposed algorithm (P1, P2, P3) outperforms all other algorithm configurations (P4, P5, P6). The only exception is that P3 is considered to outperform P6 with only 80% confidence.
| Excerpt | P1 | P2 | P3 | P4 | P5 | P6 |
|---|---|---|---|---|---|---|
| Piano | -0.50 | -1.36 | -2.72 | -3.14 | -3.78 | -3.88 |
| Female speech | -0.31 | -0.51 | -0.83 | -2.63 | -3.62 | -0.72 |
| Guitar | -0.30 | -0.36 | -0.54 | -0.60 | -1.94 | -0.30 |
| Male speech | -0.42 | -0.71 | -1.16 | -1.29 | -2.77 | -0.53 |
| Glockenspiel | -0.69 | -1.41 | -2.16 | -3.88 | -3.90 | -3.91 |
| Suzanne Vega | -0.34 | -0.50 | -0.86 | -1.59 | -3.06 | -0.63 |
| Castanets | -0.59 | -0.62 | -0.86 | -3.81 | -3.89 | -0.67 |
| Quartet | -0.14 | -0.57 | -1.07 | -2.23 | -3.53 | -1.87 |
Inter-channel coherence for the same samples is shown in Table II. Based on these results, we can conclude that P3 provides better decorrelation (lower coherence) than any other algorithm configuration. P2 is considered to also decorrelate more than all other algorithms, with the exception of P5. P1 decorrelates more than P6 (only 80% confidence) and less than other configurations.
| Excerpt | P1 | P2 | P3 | P4 | P5 | P6 |
|---|---|---|---|---|---|---|
| Piano | 0.69 | 0.52 | 0.38 | 0.48 | 0.38 | 0.711 |
| Female speech | 0.78 | 0.63 | 0.43 | 0.73 | 0.51 | 0.91 |
| Guitar | 0.78 | 0.63 | 0.42 | 0.73 | 0.36 | 0.92 |
| Male speech | 0.77 | 0.65 | 0.37 | 0.77 | 0.51 | 0.91 |
| Glockenspiel | 0.66 | 0.45 | 0.35 | 0.69 | 0.67 | 0.35 |
| Suzanne Vega | 0.78 | 0.66 | 0.44 | 0.80 | 0.46 | 0.91 |
| Castanets | 0.77 | 0.64 | 0.41 | 0.77 | 0.72 | 0.81 |
| Quartet | 0.79 | 0.63 | 0.44 | 0.64 | 0.39 | 0.86 |
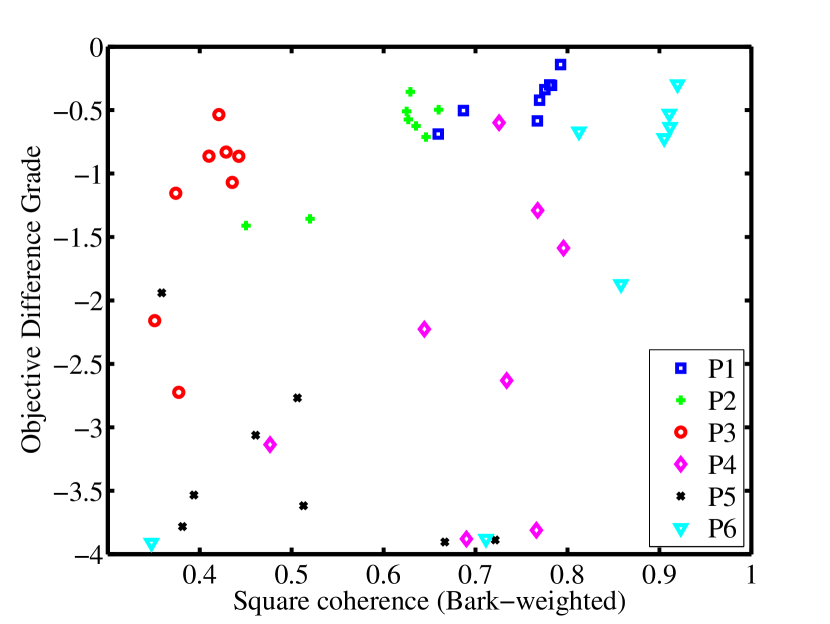
The quality and coherence results are summarised in Fig. 4. It can be clearly observed that the proposed algorithm not only performs better than the other algorithms, but is also much more constant across all audio excerpts, both in terms of quality and inter-channel coherence.
Subjective evaluation conducted informally with three listeners based on the MUltiple Stimuli with Hidden Reference and Anchor (MUSHRA) [10] methodology are consistent with the PEAQ results and also show a preference for the proposed algorithm (P1, P2 and P3 ranked higher than any of the others on average).
V-C Analysis of Individual Algorithms
Listening to the samples makes it possible to identify the various artifacts caused by the different algorithms and make the following remarks.
V-C1 Proposed algorithm
While at low levels (P1), the output of the algorithm is difficult to distinguish from the original, higher levels (P3) are characterised by a “flanging” effect that is also reflected in the stereo image. In some samples, some harshness can also be perceived (effect of noise injection). It can be observed from the equivalent SNR (see Eq. 2) in Fig. 5 that the proposed algorithm is able to introduce a large amount of distortion in the signal while still maintaining good audio quality (objective difference grade of -0.36 for the example shown).

V-C2 Smoothed absolute value
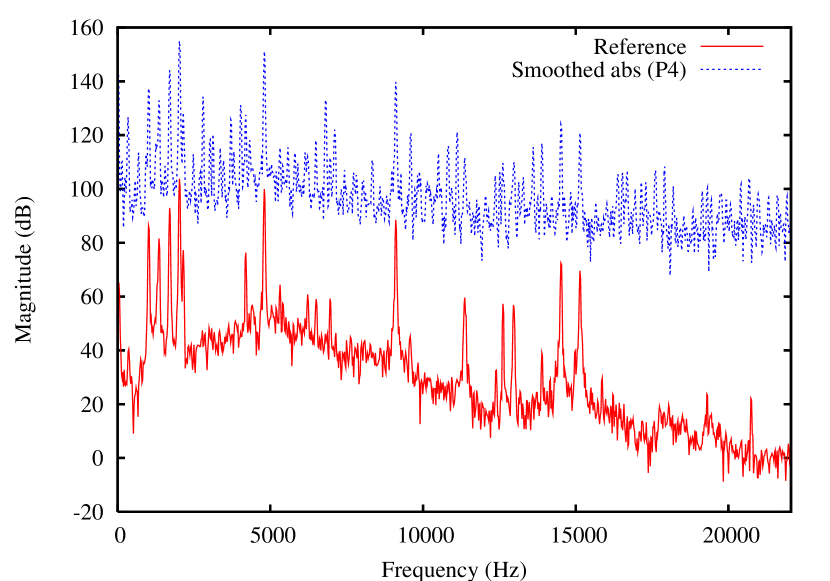
Being a non-linear function, the smoothed absolute value produces inter-modulation distortion. On harmonic signals such as speech, the distortion is perceived as additional harshness. However, on tonal non-harmonic signals such as the glockenspiel, the inter-modulation distortion effect causes new tones to appear in some regions of the spectrum. The spectra in Fig. 6 show that the tones may even appear at low frequencies, which has the effect of changing the perceived fundamental frequency.
The last artifact can be observed in the castanets sample. Because castanets have strong time-domain impulses, the smoothed absolute value causes one of the channels to be amplified more than the other depending on the sign of each impulse. This results in a very disturbing “bouncing” stereo image, especially for P5.
V-C3 First-order all-pass filter
The main artifact introduced by the first-order all-pass filter is a nearly white noise that is the result of varying the filter coefficient from one sample to another. For most samples, the noise is masked at lower frequency, so it is usually perceived as a high-frequency crackling noise. It is mainly perceivable on very tonal samples, that do not leave much room for masking noise components.
VI Conclusion
In this paper, we have demonstrated that it is possible to decorrelate the left and right channels in a video-conference application without significantly affecting the audio quality. The proposed method includes a shaped comb-allpass (SCAL) filter to decorrelate the higher frequencies and psychoacoustically masked noise injection at lower frequencies.
The proposed method was shown to outperform other existing methods both in terms of quality and amount of decorrelation provided. Moreover, the total complexity of the proposed algorithm is kept small so that it does not significantly increase the complexity of a complete echo cancellation system.
References
- [1] M. Sondhi, D. Morgan, and J. Hall, “Stereophonic acoustic echo cancellation-an overview of the fundamental problem,” IEEE Signal Processing Letters, vol. 2, no. 8, pp. 148–151, 1995.
- [2] D. Morgan, J. Hall, and J. Benesty, “Investigation of several types of nonlinearities for use in stereo acoustic echo cancellation,” IEEE Transactions on Speech and Audio Processing, vol. 9, no. 6, pp. 686–696, 2001.
- [3] M. Ali, “Stereophonic acoustic echo cancellation system using time-varyingall-pass filtering for signal decorrelation,” in Proceedings IEEE International Conference on Acoustics, Speech, and Signal Processing, pp. 3689–3692, 1998.
- [4] M. Wu, Z. Lin, and X. Qiu, “A frequency domain nonlinearity for stereo echo cancellation,” IEICE Transactions on Fundamentals of Electronics, Communications and Computer Sciences – Letters, pp. 1757–1759, 2005.
- [5] C. Montgomery, “Vorbis I specification,” 2004. http://www.xiph.org/vorbis/doc/Vorbis_I_spec.html.
- [6] J. Princen and A. Bradley, “Analysis/synthesis filter bank design based on time domain aliasing cancellation,” IEEE Transactions on Acoustics, Speech, and Signal Processing, vol. 34, no. 5, pp. 1153 – 1161, 1986.
- [7] J.-M. Valin and C. Montgomery, “Improved noise weighting in celp coding of speech – applying the vorbis psychoacoustic model to speex,” in Proc. 120th AES Convention, 2006.
- [8] ITU-R, Recommendation BS.1387: Perceptual Evaluation of Audio Quality (PEAQ) recommendation, 1998.
- [9] P. Kabal, “An examination and interpretation of ITU-R BS.1387: Perceptual evaluation of audio quality,” tech. rep., 2002. http://www-mmsp.ece.mcgill.ca/Documents/Reports/2002/KabalR2002v2.pdf.
- [10] ITU-R, Recommendation BS.1534-1: Method for the subjective assessment of intermediate quality level of coding systems, 2001.