Superconductivity at 9 K in Mo5PB2with evidence for multiple gaps
Abstract
Superconductivity is observed with critical temperatures near 9 K in the tetragonal compound Mo5PB2. This material adopts the Cr5B3 structure type common to supercondcuting Nb5Si3-xBx, Mo5SiB2, and W5SiB2, which have critical temperatures of 5.87.8 K. We have synthesized polycrystalline samples of the compound, made measurements of electrical resistivity, magnetic susceptibility, and heat capacity, and performed first principles electronic structure calculations. The highest value (9.2 K) occurs in slightly phosphorus rich samples, with composition near Mo5P1.1B1.9, and the upper critical field Hc2 at T = 0 is estimated to be 17 kOe. Together, the measurements and band structure calculations indicate intermediate coupling ( = 1.0), phonon mediated superconductivity. The temperature dependence of the heat capacity and upper critical field below suggest multiple superconducting gaps may be present.
I Introduction
The tetragonal Cr5B3 structure type is adopted by a wide variety of binary and ternary compounds with examples incorporating at least 47 different elements spanning the main group, transitions metals, and rare-earth metals P. Villars and K. Cenzual, Pearson’s Crystal Dta - Crystal STructure Database fo rInorganic Compounds, Releast 2013/14, ASM International, Materials Park, Ohio, USA. . One of the more interesting subsets of these compounds is the ternary borides with stoichiometries B2, with X = P,Si. These are reported to form with many transition metals (M) including the 3d transition metals from V to Co, the 4d transition metals Nb and Mo, and the 5d transition metal W. Mn5SiB2 and Mn5PB2 are ferromagnets with Curie temperatures near room temperature and are of interest for magnetocaloric applications de Almeida et al. (2009); Xie et al. (2010). Fe5SiB2 and Fe5PB2 are uniaxial ferromagnets with high Curie temperatures, and a low temperature spin-reorientation in the case of the silicide, and have been studied as potential permanent magnet materials Blanc et al. (1967); Wäppling et al. (1976); McGuire and Parker (2015); Lamichhane et al. (2016). In striking contrast to these high temperature ferromagnets, the 4d and 5d compounds Nb5SiB2, Mo5SiB2, and W5SiB2 are superconductors with transition temperatures of 7.2, 5.8, and 5.8 K, respectively Pesliev et al. (1986); Machado et al. (2011); Fukuma et al. (2011). The occurrence of superconductivity in these borosilicide compounds brings to mind other well known boron-containing, phonon-mediated superconductors, including the borocarbides B2C ( = rare-earth element, = Ni, Pd, Pt) Tagaki et al. (1997) and magnesium diboride MgB2 Nagamatsu et al. (2001).
The observation of superconductivity in several examples of Cr5B3-type compounds with the 512 stoichiometry suggests that further examination may produce more examples in this relatively new group of superconductors Machado et al. (2011). In the present work, we have studied the analogous Mo5PB2, and find that it too is a superconductor. The superconducting critical temperature () is determined to be as high as 9.2 K. This is the highest yet reported for superconductors in this structure type. In addition to measurements of resistivity, magnetic susceptibility, and heat capacity, we report results of first principles calculations that reveal the presence of multiple bands crossing the Fermi level in this borophosphide and the related borosilicides, as seen in, for example, the iron-based superconductors including the phosphide LaFePO Lebégue et al. (2009), as well as MgB2 Mazin and Antropov (2003). Calculations indicate the coupling in Mo5PB2 is in the intermediate limit (i.e. the electron-phonon coupling ). Analysis of the heat capacity and upper critical field data suggests the presence of two distinct energy gaps. Together the experimental and theoretical results indicate that Mo5PB2 may be a multiband superconductor.
II Procedures
Polycrystalline samples with nominal compositions Mo5P0.9B2.1, Mo5PB2, and Mo5P1.1B1.9 were prepared from hydrogen-reduced molybdenum powder (99.999%), phosphorus pieces (99.999%), and boron powder (99.5%). The elements were reacted together at 1050∘C for 1624 hours, and the resulting powders were pressed into cylindrical pellets and heated at 11001150∘C for a total duration of up to eight days, with intermediate grinding and re-pelletizing. Crystals of the isostructural Fe5PB2 have been grown from an Fe-P melt Lamichhane et al. (2016); however, there is no liquid region on the Mo-rich side of the Mo-P phase diagram below about 1700∘C. The optical floating zone method has been used to grow crystals of Mo5SiB2 Ihara et al. (2002); however, arc-melting experiments in our lab indicate that Mo5PB2 does not melt congruently, and the volatility of phosphorus may preclude this type of crystal growth. The most likely route to single crystal Mo5PB2 may be the molten metal flux technique Canfield and Fisk (1992); Kanatzidis et al. (2005), if a suitable flux can be identified.
Powder X-ray diffraction was performed using monochromatic Cu Kα1 radiation with a PANalytical X’Pert Pro diffractometer and analyzed using the Rietveld technique with the Fullprof software package J. Rodriguez-Carvajal, FullProf.2k, version 5.30, March 2012, ILL. . Magnetization measurements were performed with a Quantum Design Magnetic Property Measurement System (MPMS) and Physical Property Measurement System (PPMS). The PPMS was also used for measurements of electrical resistivity and heat capacity. The heat capacity data were analyzed using both the conventional relaxation method employing small heat pulses (temperature rise of 2% of the sample temperature) and slope-analysis Riegel and Weber (1986) of large heat pulse data (temperature rise of 30% of the sample temperature).
First principles density functional theory calculations of the electronic structure of Mo5PB2 were performed using the linearized augmented plane-wave (LAPW) code WIEN2K Blaha et al. (2001), employing the generalized gradient approximation of Perdew, Burke and Ernzerhof Perdew et al. (1996). LAPW sphere radii of 2.41, 2.08 and 1.7 Bohr, respectively for Mo, P, and B were chosen with an RKmax of 7.0, where RKmax is the product of the smallest sphere radius and the largest plane-wave expansion wavevector. Internal coordinates were relaxed until forces on the ions were less than 2 mRy/Bohr.
III Results and Discussion
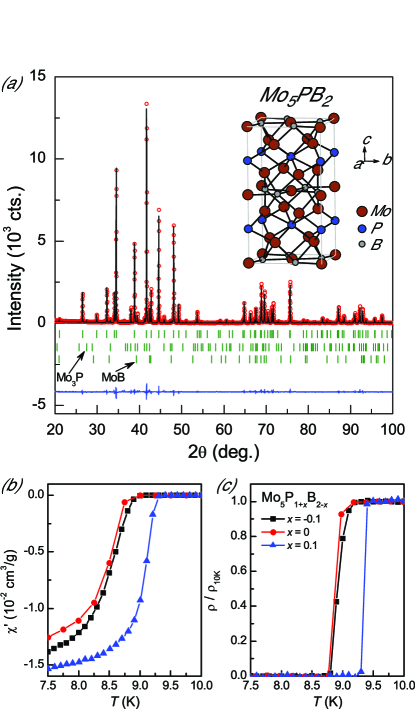
Rietveld analysis showed the resulting purity of the samples to be 92, 89, and 92% by weight for samples with nominal compositions Mo5P0.9B2.1, Mo5PB2, and Mo5P1.1B1.9, respectively. Mo3P and MoB were observed as impurity phases in all samples. Refinement results are shown for Mo5P1.1B1.9 in Figure 1a, where the crystal structure is shown in the inset. Table 1 contains the refined crystallographic properties of the Mo5PB2 phase in each sample. Allowing mixed occupation of P and B on their respective sites suggested some P may reside on the B site, but did not indicate any mixing of B onto the P site. The compositions determined from the refined occupancies are listed in the Table. Adding excess P (relative to Mo5PB2) appears to significantly increase the P content of the main phase, as indicated by both the refined composition as well as the increase in the unit cell volume. Addition of excess B had no detectable effect on the atomic site occupancies (relative to Mo5PB2) and produced only a small decrease in the unit cell volume. These observations indicate that there is some phase width in Mo5PB2 with respect to the P and B ratio, a common feature in this structure-type Brauner et al. (2009); Lamichhane et al. (2016); Häggström et al. (1975); Pesliev et al. (1986); Rawn et al. (2001), and that in this case excess P is favored.
Figure 1b and 1c show the ac magnetic susceptibility and resistivity measured below 10 K. All of the samples are superconducting. Values of are determined by the onset of diamagnetism (Fig. 1b) and the temperature at which the resistivity reaches zero (Fig. 1c). These are listed for each sample in Table 1. Similar values of = 8.78.9 K are seen in the Mo5P0.9B2.1 and Mo5PB2 samples, which have similar stoichiometries as discussed above. A higher value of = 9.2 K is seen in Mo5P1.1B1.9. This demonstrates the sensitivity of the superconductivity to the chemical composition of the Mo5PB2 phase. Further experimental analysis presented here will focus primarily on the Mo5P1.1B1.9 sample. The values seen in these materials are the highest yet reported in this class of ternary superconductors, which include Mo5SiB2 ( = 5.8 K)Machado et al. (2011), Nb5SiB2 ( = 7.2 K)Machado et al. (2011), W5SiB2 ( = 5.8 K)Fukuma et al. (2011), W5-xTaxSiB2 ( = 6.5 K)Fukuma et al. (2012), and the closely related Nb5Si2.4B0.6 ( = 7.8 K)Brauner et al. (2009).
| Nominal comp. | Mo5P0.9B2.1 | Mo5PB2 | Mo5P1.1B1.9 |
|---|---|---|---|
| Refined comp. | Mo5P1.07(4)B1.93(4) | Mo5P1.07(4)B1.93(4) | Mo5P1.12(3)B1.88(3) |
| a (Å) | 5.9726(1) | 5.97303(7) | 5.97633(6) |
| c (Å) | 11.074(3) | 11.076(1) | 11.0813(2) |
| V () | 395.04(2) | 395.142(7) | 395.784(8) |
| 0.1663(3) | 0.1659(3) | 0.1661(2) | |
| 0.1409(2) | 0.1410(2) | 0.1409(2) | |
| 0.619(5) | 0.618(4) | 0.620(3) | |
| (K) | 8.7(1) | 8.8(2) | 9.2(1) |
| (K) | 8.9(1) | 8.7(2) | 9.2(1) |
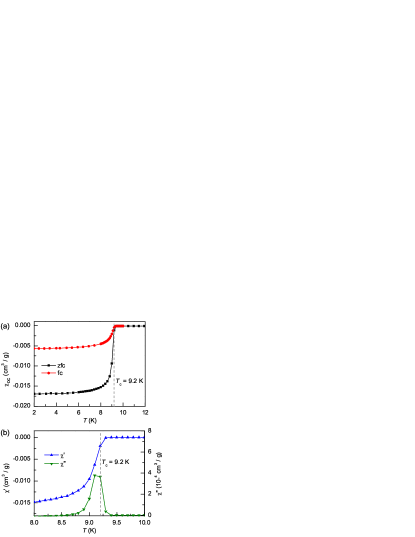
Figure 2 shows the results of magnetization measurements on Mo5P1.1B1.9. The dc measurements were conducted in 10 Oe field, and the ac magnetization measurements were conducted in a dc field of 10 Oe using a frequency of 1 kHz and an ac excitation field of 5 Oe. The superconducting transition is marked by the onset of diamagnetism in the dc susceptibility () and the real part of the ac susceptibility (), while the imaginary part () peaks just below . The large diamagnetic signal in both field-cooled (fc) and zero field cooled (zfc) measurements demonstrates the bulk nature of the superconductivity. Complete magnetic flux exclusion corresponds to a volume susceptibility of -1/4 in the units used here. This corresponds to a mass susceptibility of 0.0089 cm3/g using the single crystal density of 8.97 g/cm3 determined from the structure refinements presented above. Thus, the shielding fraction indicated by the data in Figure 2a exceeds unity by almost a factor of two. This may be attributed to geometrical and demagnetization effects in these samples, which were loosely compacted powders in irregular shapes. A shielding volume fraction of 120% was observed (with no demagnetization correction) for a denser sample that was cold pressed at high pressure between tungsten carbide anvils.
Resistivity data for polycrystalline Mo5P1.1B1.9 are shown in Figure 3. The residual resistivity ratio is = 11, relatively high considering the polycrystalline nature of the sample. The resistivity varies like above up to about 60 K. Above about 100 K, displays a negative curvature rather than the linear behavior expected for most metals. The normal state temperature dependence is similar to that reported for Mo5SiB2 Machado et al. (2011) and W5SiB2 Fukuma et al. (2011), and the negative curvature at higher temperatures has been observed as a common feature in a variety of chemically related compounds, based on Mo (x = Si, B, C) Ito et al. (2004). This behavior is also seen in the A15-type superconductors, where Fisk and Webb concluded that resistivity saturation results from the approach to the Mott-Ioffe-Regel limit Fisk and Webb (1976). This occurs when the electron mean free path reaches a minimum value defined by the lattice constant Riegel and Weber (1960); Mott (1974). Gurvitch Gurvitch (1981) cast the resulting relationship between the saturation resistivity in cm, the carrier concentration n in cm-3, and lattice parameter a in Å (assuming cubic symmetry) into the following useful form: cm. Hall effect measurements on Mo5P1.1B1.9 give a Hall coefficient of -3.1 cm3/C. From this, in a simple one band model, a carrier concentration of 21022 electrons per cm3 is inferred. Using this value of n and the average lattice constant of Å gives = 230 cm. The resistivity data in Figure 3 exceed this value by about 60% at room temperature, which may be attributed to the polycrystalline nature of the sample with resistive grain boundaries. However, this estimated does compare well with data reported for several isostructural SiB2 compounds that have been measured up to 1000 K Ito et al. (2004).
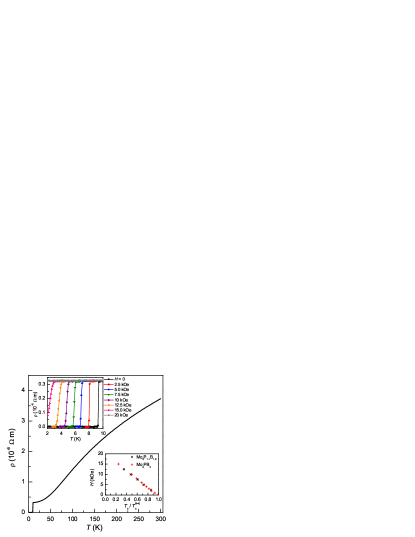
Resistivity data collected in applied magnetic fields are shown in the upper inset of Figure 3. In zero field the resistive transition is very sharp, with a width of 0.1 K. The transition broadens as magnetic field is applied, with the width increasing to 0.7 K at 12.5 kOe. This is typical behavior of a type II superconductor. From the resistivity data, the field dependence of is obtained, where is defined as the temperature at which . The results are shown in the lower inset of Fig. 3, which also include results from the same analysis applied to the sample of nominal composition Mo5PB2. From this data, an upper critical field (0) of 17 kOe can be estimated. This is significantly larger than in the closely related superconductors Mo5SiB2 and W5SiB2, for which values of 6 kOe and 5 kOe, respectively, are reported Machado et al. (2011); Fukuma et al. (2011). Nearly linear behavior, with a slight positive curvature near , is observed up to fields of 12.5 kOe in Figure 3. Fitting this range gives a slope of -2.1 kOe/T. From this value, the WHH expression gives = 13 kOe. This is not compatible with the resistivity data collected at H = 15 kOe (Fig. 3), for which 1.5 K can be estimated (Fig. 3). This discrepancy is a direct result of the nearly linear relationship between magnetic field and over a wide range of fields. A similar shape of vs is seen in W5SiB2 Fukuma et al. (2011), but reports for Mo5SiB2 show clear negative curvature over most of the temperature range Machado et al. (2011), more consistent with expectations based on the WHH theory. The observed temperature dependence of the upper critical field in polycrystalline Mo5PB2 may be an indication of contributions from multiple superconducting gaps arising from underlying crystalline anisotropy or from multiple superconducting bands. Similar shapes have been observed in several multigap superconductors including polycrystalline MgB2 Bud’ko et al. (2001) and LaFeAsO0.89F0.11 Hunte et al. (2008), and single crystals of borocarbides Shulga et al. (1998), dichalcogenides Suderow et al. (2005); Tissen et al. (2013), and more recently TlNi2Se2 Wang et al. (2013).
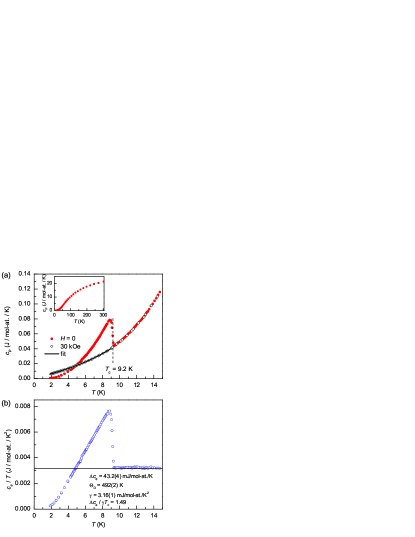
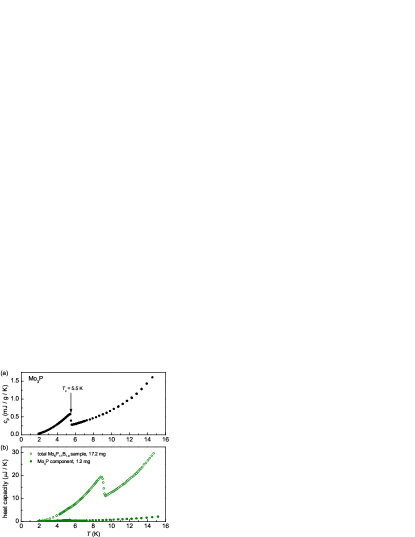
Results of heat capacity measurements on Mo5P1.1B1.9 are shown in Figure 4. Rietveld refinement of the powder x-ray diffraction data shows that this sample contains 7 wt. % of Mo3P, which is a superconductor with reported of 57 K Matthias et al. (1954); Blaugher et al. (1965); Shirotani et al. (2001). For this study, an Mo3P sample was synthesized and its heat capacity was measured and subtracted from the total heat capacity measured for the Mo5P1.1B1.9 sample after scaling by the x-ray diffraction determined concentration. The measured for the Mo3P sample was 5.5 K. See Appendix for additional data and information.
At 300 K the heat capacity of Mo5P1.1B1.9 reaches 86% of the Dulong-Petit limit (Fig. 4a, inset). The increase in heat capacity upon cooling into the superconducting state is centered at = 9.2 K. The magnitude of the heat capacity jump is determined to be 43.2 mJ/mol-at./K. Data collected at 30 kOe show that this field is sufficient to suppress the superconductivity to below 2 K, consistent with the resistivity results above that show kOe. Figure 4b shows the electronic portion of the heat capacity, determined by subtracting the data collected at 30 kOe. The 30 kOe data is well described up to 9 K by , as shown by the black line through the data in Figure 4a. This fit gives a normal state Sommerfield coefficient of = 3.16(1) mJ/mol-at./K2 and a Debye temperature of 492(2) K. Similar values were obtained from the same analysis of heat capacity data (not shown) for the Mo5PB2 sample. These values are compared with other isostructural superconductors in Table 2.
| Composition | Mo5P1.1B1.9 | Mo5PB2 | Mo5SiB2 Machado et al. (2011) | W5SiB2 Fukuma et al. (2011) |
|---|---|---|---|---|
| (K) | 9.2 | 8.8 | 5.8 | 5.8 |
| (mJ/mol-at./K2) | 3.16 | 3.07 | 2.12 | 1.60 |
| (K) | 492 | 501 | 515 | 470 |
| (mJ/mol-at./K) | 43.2 | 35 | 17.1 | 13.8 |
| 1.49 | 1.30 | 1.39 | 1.49 |
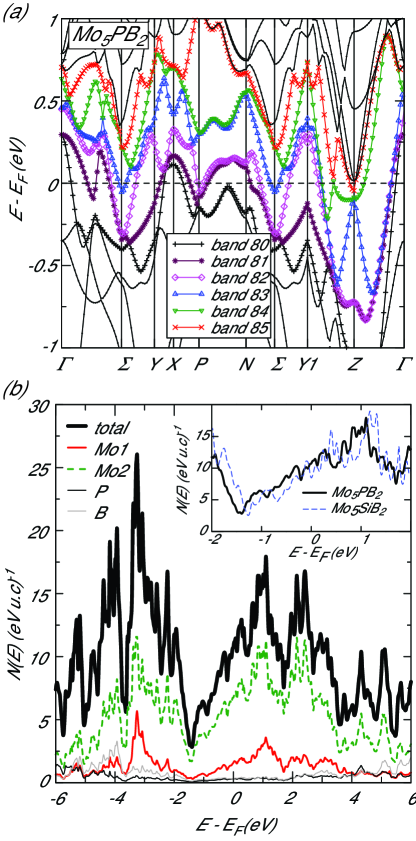
Results of electronic band structure calculations are shown in Figure 5a. Six bands are observed to cross the Fermi level, with several bands contributing strongly to the the total density of states (DOS). The partial Fermi-level DOS in these bands (per unit cell per eV, both spins) is found to be 2.06, 4.66, 1.90, 1.10, 0.96, and 0.04, for a total Fermi level DOS of 10.7 per eV per unit cell. With 10 Mo per unit cell and the majority of the DOS being Mo (Fig. 5b), is somewhat enhanced relative to elemental Mo itself, which has of 0.65 / eV Janak (1977), but not to a degree that would suggest a magnetic instability. This argues in favor of a phononic pairing mechanism.
The value of determined from the calculated band structure (Fig. 5a) is 1.57 mJ/mol-at./K2. This is significantly lower than the observed value of 3.16 mJ/mol-at./K2. This enhancement by a factor of 2.01 (= 1+) gives an electron-phonon coupling constant of approximately 1, indicating intermediate coupling. For a single-band s-wave scenario, Eliashberg theory Carbotte (1990) gives a reduced specific heat jump of approximately 2 for elemental Nb, which has a similar . The observed value of in Mo5PB2 is 1.49, close to the weak-coupling BCS value, but only 75% of the value expected based on the estimated electron-phonon coupling strength for this compound.
In general, such a reduced specific heat jump can result from two factors. The first of these is gap anisotropy, including nodal behavior as observed in the superconducting cuprates Van Harlingen (1995) or more recently in LaFePO, a structural relative of the high iron-based superconductors Fletcher et al. (2009); Hicks et al. (2009). For example, the BCS weak-coupling theory, applied to a single band two dimensional d-wave material Won and Maki (1994), predicts a reduced specific heat jump of 0.95. However, there is little evidence for nodal superconductivity in Mo5PB2. For example, the electronic specific heat in the superconducting state in Figure 4b at 1.9 K, or approximately 20 percent of , is only 2 percent of the normal state value at , consistent with BCS predictions for a gapped s-wave superconductor.
The second possibility for such a reduced specific heat jump is multiband superconductivity, as observed in MgB2 Nagamatsu et al. (2001). Strictly speaking this can be considered a form of anisotropy, but here we follow the historical context and treat it separately from the Fermi surface gap anisotropy described above. In MgB2, well established to be an intermediate coupling multiband s-wave superconductor Liu et al. (2001), the largest specific heat jump was observed Bouquet et al. (2001) to be 1.32, less than the BCS s-wave value. The band structure calculations for Mo5PB2 support the possibility of multiband superconductivity, since several bands contribute significant DOS at the Fermi level.
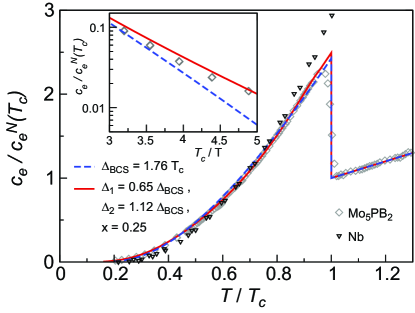
Further evidence suggesting potential multiband behavior is seen in the temperature dependence of the heat capacity measured below . In Figure 6 we depict the heat capacity data of Mo5PB2, along with two calculated curves: a single band BCS fit where the T = 0 gap value has been taken as the canonical BCS weak-coupling value, 1.76 kBTc, and a two band fit with two gaps. The smaller gap is weighted at one third the weight of the larger and the two gap fitting yields one gap of 0.65 times the BCS value and the other gap 1.12 times the BCS value. The relative weighting of the two band fit is in rough agreement with the highest two Fermi-level DOS values from the band structure calculations.
Experimental data from Nb, which has a similar electron-phonon coupling as well as similar Tc, is included in in Fig. 6 for comparison. The data was taken from Ref. Daams and Carbotte, 1980. If Mo5PB2 is a single band superconductor, as Nb is known to be, one would expect a similar electronic specific heat curve. Instead, one finds a specific heat jump only slightly above the weak coupling BCS value. In addition, the low-temperature specific heat is enhanced relative to the BCS value, as indicated in the inset. The low-T enhancement of the specific heat was found, in the case of MgB2 Bouquet et al. (2001), to result from having one gap much smaller than the BCS value. Often the specific heat at low temperature is taken to vary exponentially in , where is the smallest energy gap in the system, but the data (red diamonds) in the logarithmic plot in the inset of Fig. 6 show a substantial curvature demonstrating excitations across at least two gaps. The two band fit significantly improves upon the BCS fit, generating better agreement at both low temperatures and temperatures near Tc, though measurements on single crystals would be desirable to support this. This is consistent with the electronic structure calculations, finding multiple bands crossing .
It is of interest to compare the experimental and theoretical results for Mo5PB2 to the isostructural compound Mo5SiB2, which is itself a superconductor with a somewhat lower Tc of 5.8 K Machado et al. (2011). From a comparison of our calculated of 1.22 mJ/mol-atom-K2 for the Si compound with the of 2.12 mJ/mol-atom-K2 measured in Ref. Machado et al., 2011, an electron-phonon coupling constant of 0.73 is determined, significantly lower than the value of 1.0 we infer for the P compound. Given that the Debye temperatures of these two materials are quite similar, the lower value of for the Si compound immediately translates to a lower .
Our calculations also provide insight into the source of this change in . Presented in the inset of Figure 5b are the calculated total densities-of-states of the two compounds in a window of width approximately 4 eV, centered on EF. It is apparent that the densities-of-states can nearly be superimposed upon each other in a “rigid-band” manner , with a shift of approximately 0.2 eV corresponding directly to the 2 fewer valence electrons of the Si compound. Since the calculated densities-of-states both generally increase with energy around the respective Fermi energies, the effective hole doping associated with the substitution of Si for P lowers the Fermi level DOS. We note that this DOS reduction from 10.7 to 8.30 per eV per unit cell, or 22 percent, parallels the inferred 27 percent reduction from the P compound to the Si compound. This suggests that the electron phonon matrix element V (recalling that in BCS theory ) is similar in the two compounds, as is reasonable. In addition, the calculations are consistent with the observation that the P-rich sample Mo5P1.1B1.9 has a higher than the Mo5PB2 sample (Table 1), since the DOS at (Fig. 5b) would be increased by the substitution of P for B.
Our first principles calculations and analysis of the experimental data thus suggest that Mo5PB2 is an intermediate coupling, phonon-mediated, and potentially multiband superconductor. We note that it is possible that the superconductors Mo5SiB2 and additionally Nb5SiB2 are also multiband materials as our calculations (depicted in the Appendix) find each of these materials to have several bands crossing EF.
IV Summary and Conclusions
We have discovered a new superconductor, Mo5PB2, with critical temperature as high as 9.2 K. It crystallizes in a tetragonal Cr5B3 structure shared by a number of superconductors, such as Mo5SiB2 and Nb5SiB2, and W5SiB2, and has the highest transition temperature and upper critical field reported for this family of compounds. Electron doping is may be expected to increase further. Based on analysis of the specific heat data as well as our first principles calculations, Mo5PB2 appears to be an intermediate-coupling, multi-gap, phonon-mediated superconductor.
Acknowledgements
Research sponsored by the US Department of Energy, Office of Science, Basic Energy Sciences, Materials Sciences and Engineering Division (M.A.M. and D.S.P., synthesis of samples with varying stoichiometry, experimental characterization, theory, and analysis). In addition, M.A.M. acknowledges support for the initial synthesis of the material from U.S. Department of Energy, Office of Energy Efficiency and Renewable Energy, Vehicle Technologies Office, Propulsion Materials Program. The authors thank B.C. Sales and J.Q. Yan for helpful discussions throughout the course of this work.
Appendix
IV.1 Electronic structure of Mo5SiB2 and Nb5SiB2
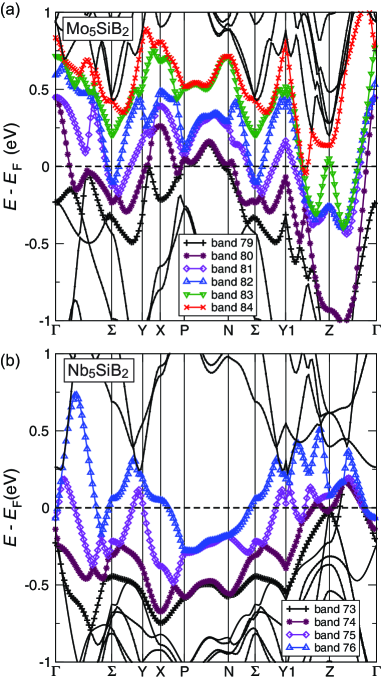
Figure 7 shows results from first principles calculations for the superconductors Mo5SiB2 and Nb5SiB2, isostructural to Mo5PB2. These calculations were also carried out using the LAPW method, with an RKmax of 7.0 and all internal coordinates relaxed, and approximately 1000 -points in the full Brillouin zone used for all calculations; spin-orbit coupling was not included. As is apparent, both these compounds have multiple bands cutting the Fermi level, with 6 such bands for Mo5SiB2 and 4 for Nb5SiB2. This is indicative of a potential multiband superconductivity in these materials, although definitive resolution of this issue would require further investigation.
IV.2 Heat capacity of Mo3P
Results of low temperature heat capacity measurements on a polycrystalline sample of Mo3P are shown in Figure 8a. The sample was prepared by reacting hydrogen-reduced Mo powder with red phosphorus pieces in an evacuated silica ampoule at 850∘C, then pelletizing the product and firing again at 1150∘C. This data was used to calculate the Mo3P contribution to the measured heat capacity of the Mo5P1.1B1.9 sample. Figure 8b shows the total heat capacity measured from the Mo5P1.1B1.9 sample with a total mass of 17.2 mg. Using the x-ray diffraction determined concentration of 7 wt. % Mo3P, the heat capacity of the Mo3P component (1.2 mg), was determined, and is also shown in the Figure. These datasets were subtracted using OriginPro to determine the heat capacity of 15 mg of Mo5P1.1B1.9, which is shown in Figure 4.
References
- (1) P. Villars and K. Cenzual, Pearson’s Crystal Dta - Crystal STructure Database fo rInorganic Compounds, Releast 2013/14, ASM International, Materials Park, Ohio, USA., .
- de Almeida et al. (2009) D. M. de Almeida, C. Bormio-Nunes, C. A. Nunes, A. A. Coelho, and G. C. Coelho, Journal of Magnetism and Magnetic Materials 321, 2578 (2009).
- Xie et al. (2010) Z. G. Xie, D. Y. Geng, and Z. D. Zhang, Applied Physics Letters 97 (2010), 10.1063/1.3518064.
- Blanc et al. (1967) A. M. Blanc, E. Fruchart, and R. Fruchart, Annales De Chimie France 2, 251 (1967).
- Wäppling et al. (1976) R. Wäppling, T. Ericsson, L. Häggström, and Y. Andersson, J. Phys. Colloques 37, C6 (1976).
- McGuire and Parker (2015) M. A. McGuire and D. S. Parker, J. Appl. Phys. 118, 163903 (2015).
- Lamichhane et al. (2016) T. N. Lamichhane, V. Taufour, S. Thimmaiahb, D. S. Parker, S. L. Budko, and P. C. Canfield, J. Magn. Magn. Mater. 401, 525 (2016).
- Pesliev et al. (1986) P. Pesliev, G. Gyurov, and R. Soyanchev, Izv. Khim. 19, 267 (1986).
- Machado et al. (2011) A. J. S. Machado, A. M. S. Costa, C. A. Nunes, C. A. M. Dos Santos, T. Grant, and Z. Fisk, Solid State Commun. 151, 1455 (2011).
- Fukuma et al. (2011) M. Fukuma, K. Kawashima, M. Maruyama, and J. Akimitsu, J. Phys. Soc. Jpn. 80, 024702 (2011).
- Tagaki et al. (1997) H. Tagaki, M. Nohara, and R. J. Cava, Physica B 237-238, 292 (1997).
- Nagamatsu et al. (2001) J. Nagamatsu, N. Nakagawa, T. Muranaka, Y. Zenitani, and J. Akimitsu, Nature 410, 63 (2001).
- Lebégue et al. (2009) S. Lebégue, Z. P. Yin, and W. E. Pickett, New. J. Phys. 11, 025004 (2009).
- Mazin and Antropov (2003) I. I. Mazin and V. P. Antropov, Physica C 385, 49 (2003).
- Ihara et al. (2002) K. Ihara, K. Ito, K. Tanaka, and M. Yamaguchi, Mater. Sci. Eng.: A 329-331, 222 (2002).
- Canfield and Fisk (1992) P. C. Canfield and Z. Fisk, Phil. Mag. B 65, 1117 (1992).
- Kanatzidis et al. (2005) M. G. Kanatzidis, R. Pöttgen, and W. Jeitschko, Angew. Chem. Int. Ed. 44, 6996 (2005).
- (18) J. Rodriguez-Carvajal, FullProf.2k, version 5.30, March 2012, ILL., .
- Riegel and Weber (1986) S. Riegel and G. Weber, J. Phys. E: Sci. Instrum. 19, 790 (1986).
- Blaha et al. (2001) P. Blaha, K. Schwarz, G. Madsen, D. Kvasnicka, and J. Luitz, WIEN2k, An Augmented Plane Wave + Local Orbitals Program for Calculating Crystal Properties (K. Schwarz, Tech. Univ. Wien, Austria) (2001).
- Perdew et al. (1996) J. P. Perdew, K. Burke, and M. Ernzerhof, Phys. Rev. Lett. 77, 3865 (1996).
- Brauner et al. (2009) A. Brauner, C. A. Nunes, A. D. Bortolozo, G. Rodrigues, and A. J. S. Machado, Solid State Commun. 149, 467 (2009).
- Häggström et al. (1975) L. Häggström, R. Wäppling, T. Ericsson, Y. Andersson, and S. Rundqvist, Journal of Solid State Chemistry 13, 84 (1975).
- Rawn et al. (2001) C. J. Rawn, J. H. Schneibel, C. M. Hoffmann, and C. R. Hubbard, Intermetallics 9, 209 (2001).
- Fukuma et al. (2012) M. Fukuma, K. Kawashima, and J. Akimitsu, J. Phys.: Conf. Ser. 391, 012090 (2012).
- Ito et al. (2004) K. Ito, T. Hayashi, and H. Nakamura, Intermetallics 12, 443 (2004).
- Fisk and Webb (1976) Z. Fisk and G. W. Webb, Phys. Rev. Lett. 36, 1084 (1976).
- Riegel and Weber (1960) S. Riegel and G. Weber, Prog. Semicond. 4, 237 (1960).
- Mott (1974) N. F. Mott, Metal-Insulator Transitions (Taylor and Francis, London, 1974).
- Gurvitch (1981) M. Gurvitch, Phys. Rev. B 24, 7404 (1981).
- Bud’ko et al. (2001) S. L. Bud’ko, C. Petrovic, G. Lapertot, C. E. Cunningham, P. C. Canfield, M.-H. Jung, and A. H. Lacerda, Phys. Rev. B 63, 220503(R) (2001).
- Hunte et al. (2008) F. Hunte, J. Jaroszynski, A. Gurevich, D. C. Larbalestier, R. Jin, A. S. Sefat, M. A. McGuire, B. C. Sales, D. K. Christen, and D. Mandrus, Nature 453, 903 (2008).
- Shulga et al. (1998) S. V. Shulga, S.-L. Drechsler, G. Fuchs, K.-H. Müller, K. Winzer, M. Heinecke, and K. Krug, Phys. Rev. Lett. 80, 1730 (1998).
- Suderow et al. (2005) H. Suderow, V. G. Tissen, J. P. Brison, J. L. Martínez, and S. Vieira, Phys. Rev. Lett. 95, 117006 (2005).
- Tissen et al. (2013) V. G. Tissen, M. R. Osorio, J. P. Brison, N. M. Nemes, M. García-Hernández, L. Cario, P. Rodière, S. Vieira, and H. Suderow, Phys. Rev. B 87, 134502 (2013).
- Wang et al. (2013) H. Wang, C. Dong, Q. Mao, R. Khan, X. Zhou, C. Li, B. Chen, J. Yang, Q. Su, and M. Fang, Phys. Rev. Lett. 111, 207001 (2013).
- Matthias et al. (1954) B. T. Matthias, E. Corenzwit, and C. E. Miller, Phys. Rev. 93, 1415 (1954).
- Blaugher et al. (1965) R. D. Blaugher, J. K. Hulm, and P. N. Yocom, J. Phys. Chem. Solids 26, 2037 (1965).
- Shirotani et al. (2001) I. Shirotani, M. Takaya, I. Kaneko, C. Sekine, and T. Yagi, Physica C 357-360, 329 (2001).
- Janak (1977) J. F. Janak, Phys. Rev. B 16, 255 (1977).
- Carbotte (1990) J. P. Carbotte, Rev. Mod. Phys. 62, 1027 (1990).
- Van Harlingen (1995) D. J. Van Harlingen, Rev. Mod. Phys. 67, 515 (1995).
- Fletcher et al. (2009) J. D. Fletcher, A. Serafin, L. Malone, J. G. Analytis, J.-H. Chu, A. S. Erickson, I. R. Fisher, and A. Carrington, Phys. Rev. Lett. 102, 147001 (2009).
- Hicks et al. (2009) C. W. Hicks, T. M. Lippman, M. E. Huber, J. G. Analytis, J.-H. Chu, A. S. Erickson, I. R. Fisher, and K. A. Moler, Phys. Rev. Lett. 103, 127003 (2009).
- Won and Maki (1994) H. Won and K. Maki, Phys. Rev. B 49, 1397 (1994).
- Liu et al. (2001) A. Y. Liu, I. I. Mazin, and J. Kortus, Phys. Rev. Lett. 87, 087005 (2001).
- Bouquet et al. (2001) F. Bouquet, R. A. Fisher, N. E. Phillips, D. G. Hinks, and J. D. Jorgensen, Phys. Rev. Lett. 87, 047001 (2001).
- Daams and Carbotte (1980) J. Daams and J. P. Carbotte, J. Low Temp. Phys. 40, 135 (1980).