(020.2930) Hyperfine structure; (300.6420) Spectroscopy, nonlinear; (300.6210) Spectroscopy, atomic; (140.0140) Lasers and laser optics
Doppler-free approach to optical pumping dynamics in the electric quadrupole transition of Cesium vapor
Abstract
The electric quadrupole transition is investigated in Cesium vapor at room temperature via nonlinear Doppler-free -- three-level spectroscopy. Frequency-resolved studies of individual E2 hyperfine lines allow one to analyze optical pumping dynamics, polarization selection rules and line intensities. It opens the way to studies of transfer of light orbital angular momentum to atoms, and the influence of metamaterials on E2 line spectra.
doi:
http://dx.doi.org/10.1364/OL.41.002005With the appearance of laser sources, nonlinear Doppler-free Laser Spectroscopy (DFLS) has undergone a very fast development. It has been utilized for atomic and molecular spectral analyses, collisional studies in the vapor phase and investigation of fundamental processes [1, 2]. Up to now, in atomic physics, DFLS has been mainly performed by using laser sources resonant for electric-dipole (E1) transitions. Dipole-forbidden transitions, particularly electric quadrupole (E2) transitions, are important in new avenues of atomic physics for fundamental studies like parity violation [3] or devising of ultra-high-accuracy optical clocks [4, 5, 6]. Spectroscopic studies of E2 transitions in vapors are generally hindered by Doppler-broadening, and in most cases averaged over the internal structure of the E2 transition (e.g. hyperfine multiplets) [7, 8]. A noteworthy exception is the early work by Weber and Sansonetti [9] who performed resonantly enhanced stepwise excitation to high lying states of Cesium, using the level as the intermediates state. In this way, they have been able to get Doppler-free spectra and resolve the hyperfine lines of the E2 transition. Recent studies include Doppler-free 5p-6p transitions in Rubidium [10] and magnetic-field-mixing of forbidden hyperfine transitions of Cs D2 line [11]. Another well-explored approach to study the internal structure of highly-excited D levels of alkalis and measure their energy makes use of Doppler-free two-photon spectroscopy [12, 13]. In this letter we analyze Doppler-free hyperfine spectral lines of the Cs E2 transition, as observed via three-level Raman-type nonlinear spectroscopy [14, 15, 16] on the -- coupled system. We investigate polarization properties and optical pumping processes responsible for the E2 spectral line intensities, demonstrating the important role played by transit time relaxation. This work should pave the way to investigate such specific properties as transfer of non-zero e.m. orbital angular momentum to atomic systems [17, 18], vapor-surface physics [7, 8] and atomic gas combined with nanostructured interface [19, 20, 21].
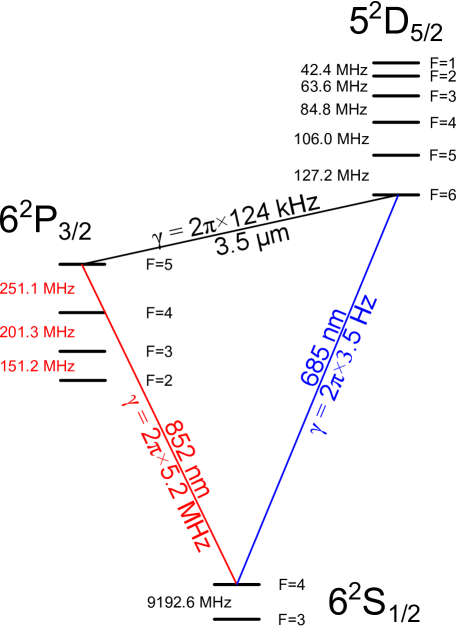
To investigate Doppler-free spectroscopic characteristics on an E2 transition, we address the transition of Cesium at nm (Fig. 1). This E2 line has a transition rate of Hz [8]. Considering solely fluorescence decay, the saturation intensity behaves like Wcm-2, where kHz is the fluorescence rate of state which almost exclusively comes from the E1 line at 3.5 µm [22]. The 685 nm laser has an output power of 11 mW and a minimum beam waist around µm. So the maximum laser intensity attainable is Wcm-2 which should be above the saturation intensity of the transition. However one should note that the transit time broadening, added to radiative relaxation, increases the total relaxation rate of the state by more than a factor of 2, and thus by a factor of . To monitor Doppler-free lines at 685 nm, we have adopted a pump-probe three-level spectroscopy approach [14, 15] in which population changes induced in the ground state by a 685 nm laser are monitored on the line transmission at nm (Fig. 1). The radiative linewidth of the 852 nm transition is MHz. As it corresponds to the fastest characteristic time of the system, this linewidth imposes the ultimate spectral resolution on the E2 transition resonances. Taking into account the difference in wavenumbers between wavelengths at 685 nm and at 852 nm, we find an ultimate spectral resolution on the E2 transition resonances of MHz[14, 15]. Hence, our pump/probe spectroscopy technique would not give information on the bare linewidth of the E2 transition but it is able to resolve the hyperfine structure of the transition.
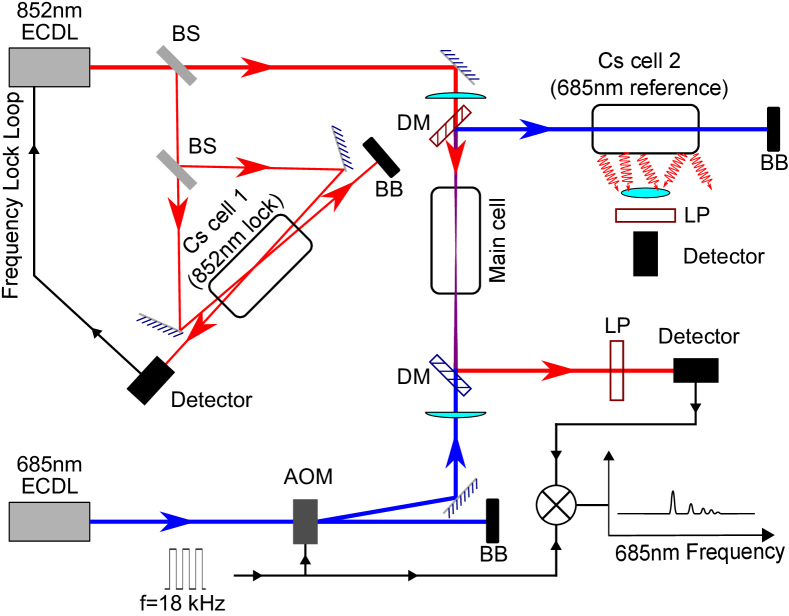
The schematic of the experiment setup is depicted in figure 2. The 852 nm External Cavity Diode Laser (ECDL) is frequency locked onto one of the hyperfine transition of the line, thanks to a saturated absorption side-experiment performed on an auxiliary room-temperature Cs Vapor cell (cell 1 of Fig. 2). We also address the 685 nm transition using an ECDL. The 685 nm laser beam is amplitude-modulated at 18 kHz using an Acousto-Optic Modulator (AOM) operating at 80 MHz. It is focused and counter propagates with the similarly focused 852 nm laser beam inside a 5 cm long room-temperature main Cs vapor cell. Inside this cell, the 852 nm peak laser intensity is 2 mW/cm2, i.e. below saturation intensity. The 18 kHz modulation amplitude, induced on the 852 nm transmission via three-level saturation spectroscopy, is then extracted using a lock-in amplifier. These transmission spectra are recorded as functions of the frequency of the 685 nm laser. The 685 nm frequency scan over the Doppler profile is monitored by collecting the fluorescence at 852 nm in a second auxiliary vapor cell operated at temperature, C (Cell 2 in Fig. 2). The 685 nm frequency scale is calibrated by comparing the fluorescence spectra obtained with zeroth and first order AOM diffracted beams.
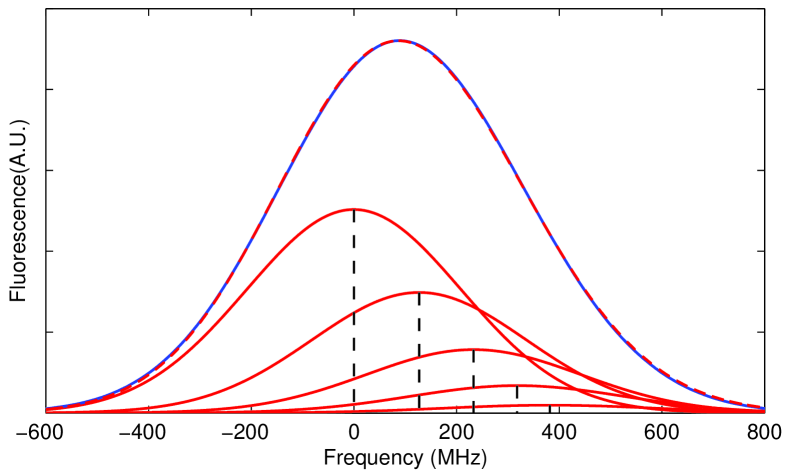
With only the 685 nm light, the fluorescence signal at 852 nm comes from the radiative cascade . An example of a fluorescence spectrum is shown in Fig. 3. The 685 nm laser is tuned from the hyperfine ground state. Thus according to the selection rules of a quadrupole transition, the lines can be observed. Those transitions are not resolved in Doppler spectroscopy due to the small hyperfine splitting of the state. However the asymmetry of the fluorescence spectrum is a clear signature of the presence of several transitions. Moreover, we calculate the transitions relative intensities, based only on the E2 absorption line strengths [23]:
| (1) |
with . We now place a Gaussian profile for each hyperfine transition at its correct relative frequency separation (see Fig. 3) with a relative weight, given by (1). Using a global frequency shift and an identical width for the Gaussians as the two free fitting parameters, we are able to recover the experimental profile of the fluorescence signal at 852 nm with an excellent agreement.
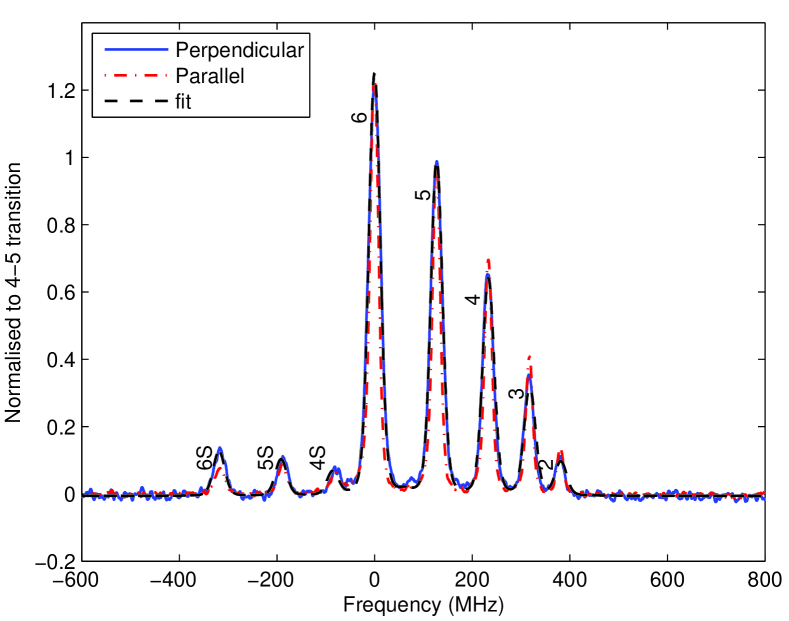
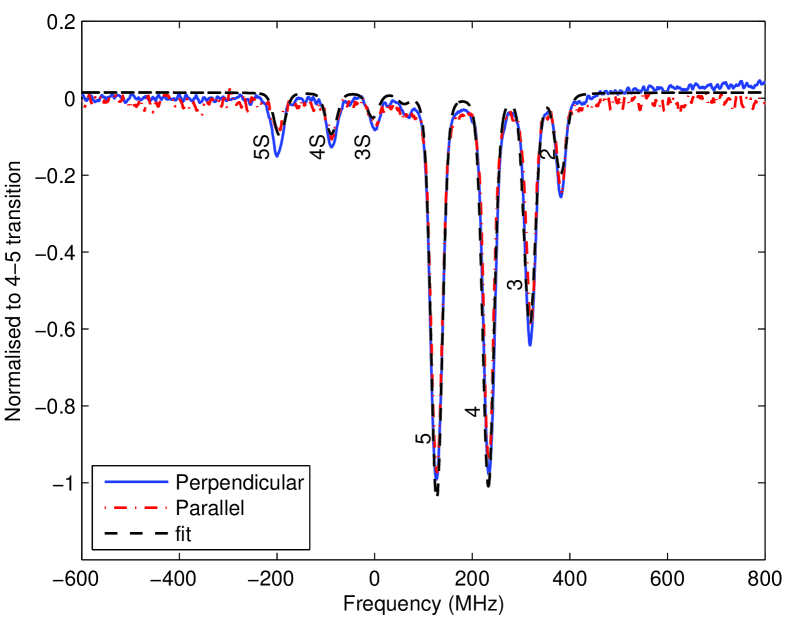
Figures 4 and 5 shows two typical Doppler-free pump-probe spectra. Here the 852 nm laser is frequency locked to the transition whereas the 685 nm laser is scanned across either the to multiplet for fig. 4 or the to multiplet for fig. 5. These experimental spectra call for some remarks concerning selection rules, amplitudes, sideband resonances and linewidths.
-
(i).
The 685 nm light couples the hyperfine transitions satisfying the quadrupole transition selection rules, i.e. . In figure 4, excitation spectra on the lines are indeed observed. Since the lasers at 685 nm and 852 nm are sharing the same ground state, the signal is revealed mainly through optical de-pumping of this state. Thus the transmission signal at 852 nm will be in-phase with the 18 kHz modulation leading to a positive, i.e. emission-like spectrum, as seen in figure 4. On the contrary, if the lasers are not sharing the same ground state, the transmission signal at 852 nm will originate in an optical re-pumping scheme and be out-of-phase with the 18 kHz modulation leading to a negative, i.e. absorption-like spectrum. This situation is illustrated on figure 5. Here the optical pumping from the ground state to the ground state is done through a 685 nm absorption event followed by a radiative cascade event. Both events have the same selection rules. Thus only the four lines of the E2 transition are observed, whereas the transition is missing since it cannot decay back to the state.
-
(ii).
The different line intensities depend on the hyperfine levels involved in the optical pumping process, and eventually on the relative polarizations of the 685 nm and 852 nm lasers. However, one should note that due to fast transit time in the beam, the 852 nm irradiation does not induce optical pumping between magnetic sublevels in the ground state. Also, for a transition, a linearly polarized irradiation is nearly equivalent to an isotropic light probe. This explains why the spectra are similar for parallel and perpendicular polarizations, as seen in figs 4 and 5. One may thus calculate the line intensities, based only on ((1)), and E1 emission line strengths (for both and as given by:
(2) Line amplitudes will depend on the de-population and re-population in the level. The signal strength can be written as
(3) where is the usual Kronecker delta. The sum is over the hyperfine levels (F indicates the pumped hyperfine state) and
(4) is a re-pumping ratio which takes into account the transit relaxation rate, described phenomenologically by an exponential decay rate . This transit relaxation is mainly effective in the long-lived 5D state. By increasing the 5D relaxation rate, it diminishes the re-pumping back to the ground state (second term in (3)). The transit relaxation rate may be approximated roughly by . With the transverse mean thermal velocity across the laser beam, ms-1, and the beam waist, µm, we predict 0.4. This is a quite approximate prediction because transit time broadening is mainly governed by a Gaussian probability distribution. If (same hyperfine ground state), the line intensity depends on both de-population and re-population pumping, as well as on the transit time relaxation. As shown in figure 4, a very good match is obtained for (i.e. ) a value not far from the rough estimate above. Note the major role of transit broadening. In its absence (), the repopulation in the ground state [after E2 excitation to the level] should exactly cancel the depopulation pumping (inside the close three-level system, ). The observation of the resonance (Fig. 4) is a direct evidence for the transit time influence responsible for losses in the optical pumping process. On the other hand, for the cross resonances (Fig. 5), there is no similar effect. Only the overall spectrum amplitude will depend on .
-
(iii).
Small amplitudes transmission peaks, appearing on the red side of the main resonances (Figs. 3–5) are sideband resonances. They correspond to the transition resonantly excited for a non-zero atomic velocity group[14, 15]. Taking into account the different Doppler shifts, we find a frequency shift between the two sets of resonances of MHz,where MHz is the hyperfine splitting of the excited state. Since the laser beams are counter propagating, the sidebands lie on the red side of the resonances. With co-propagating beams, the shift would be on the blue side of the main resonances.
-
(iv).
The ultimate resonance linewidth is MHz. The experimental linewidths are larger, about 15 MHz. The extra broadening may be due to the 852 nm power broadening, collisions and the 685 nm laser jitter.
In conclusion, we have observed Doppler-free spectral lines on the Cs transition and analyzed some of their properties, like selection rules and saturation intensities. This work paves the way for further investigations like the general polarization characteristics of E2 absorption, or the influence of near-field surface potentials on E2 line emission. Angular momentum conservation in matter-light interaction involves photon spin only in Gaussian light beams. In the work presented here, one thus expects to induce transitions in E2 absorption at 685 nm. If instead one uses focused Laguerre-Gauss (LG) beams, one expects that orbital angular momentum of light can be absorbed and thus produce transitions[17, 18]. These could be observed via E2 Zeeman transitions in applied magnetic fields. E2 transitions can be monitored in zero-electric-field regions of LG beams and should allow one to map their spatial intensity distributions[18]. Another prospect lies in the analysis of atom-metamaterial hybrid systems. Engineering of atom-surface interactions in such hybrid devices have been recently demonstrated by monitoring the atom response on E1 transitions[24]. Similar work on E2 transitions will allow exploring e.m. field gradients in the vicinity of metamaterials.
FUNDING. This work was supported by the Singapore Ministry of Education(501100001459) Academic Research Fund Tier 3 (Grant No. MOE2011-T3-1-005).
ACKNOWLEDGEMENT. The authors thank A. Laliotis for work in initial setting up of the experiment.
References
- [1] V. S. Letokhov and V. P. Chebotayev, Nonlinear laser spectroscopy (Springer-Verlag, 1977).
- [2] W. Demtröder, Laser spectroscopy : basic concepts and instrumentation, Advanced texts in physics (Berlin ; New York : Springer, 2003).
- [3] K. Tsigutkin, D. Dounas-Frazer, A. Family, J. E. Stalnaker, V. V. Yashchuk, and D. Budker, Phys. Rev. Lett. 103, 071601 (2009).
- [4] C. Tamm, D. Engelke, and V. Bühner, Phys. Rev. A 61, 053405 (2000).
- [5] W. H. Oskay, S. A. Diddams, E. A. Donley, T. M. Fortier, T. P. Heavner, L. Hollberg, W. M. Itano, S. R. Jefferts, M. J. Delaney, K. Kim, F. Levi, T. E. Parker, and J. C. Bergquist, Phys. Rev. Lett. 97, 020801 (2006).
- [6] T. Rosenband, D. B. Hume, P. O. Schmidt, C. W. Chou, A. Brusch, L. Lorini, W. H. Oskay, R. E. Drullinger, T. M. Fortier, J. E. Stalnaker, S. A. Diddams, W. C. Swann, N. R. Newbury, W. M. Itano, D. J. Wineland, and J. C. Bergquist , Science 319, 1808 (2008).
- [7] S. Tojo, M. Hasuo, and T. Fujimoto, Phys. Rev. Lett. 92, 053001 (2004).
- [8] S. Tojo, T. Fujimoto, and M. Hasuo, Phys. Rev. A 71, 012507 (2005).
- [9] K. H. Weber and C. J. Sansonetti, Phys. Rev. A 35, 4650 (1987).
- [10] F. Ponciano-Ojeda, S. Hernández-Gómez, O. López-Hernández, C. Mojica-Casique, R. Colín-Rodríguez, F. Ramírez-Martínez, J. Flores-Mijangos, D. Sahagún, R. Jáuregui, and J. Jiménez-Mier, Phys. Rev. A 92, 042511 (2015).
- [11] A. Sargsyan, A. Tonoyan, G. Hakhumyan, A. Papoyan, E. Mariotti, and D. Sarkisyan, Laser Phys. Lett. 11, 055701 (2014).
- [12] F. Nez, F. Biraben, R. Felder, and Y. Millerioux, Opt. Comm. 102, 432 (1993).
- [13] P. V. Kiran Kumar and M. V. Suryanarayana, Pramana 83, 189 (2014).
- [14] M. S. Feld and A. Javan, Phys. Rev. 177, 540 (1969).
- [15] M. Ducloy, J. R. R. Leite, and M. S. Feld, Phys. Rev. A 17, 623 (1978) and references therein.
- [16] P. Thoumany, T. Hänsch, G. Stania, L. Urbonas, and T. Becker Opt. Lett. 34, 1621 (2009).
- [17] V. Klimov, D. Bloch, M. Ducloy, and J. R. Rios Leite, Opt. Exp. 17, 9718 (2009).
- [18] V. V. Klimov, D. Bloch, M. Ducloy, and J. R. Rios Leite, Phys. Rev. A 85, 053834 (2012).
- [19] K. Deguchi, M. Okuda, A. Iwamae, H. Nakamura, K. Sawada, and M. Hasuo, J. Phys. Soc. Jap. 78, 024301 (2009).
- [20] A. M. Kern and O. J. F. Martin, Phys. Rev. A 85, 022501 (2012).
- [21] V. Yannopapas and E. Paspalakis, J. Mod. Opt. 62, 1435 (2015).
- [22] D. DiBerardino, C. E. Tanner, and A. Sieradzan, Phys. Rev. A 57, 4204 (1998).
- [23] M. Weissbluth, Atoms and molecules (Academic Press, New York, 1978) Chapter 23.
- [24] S. A. Aljunid, E. A. Chan, G. Adamo, M. Ducloy, D. Wilkowski, and N. I. Zheludev, Nano Lett. 16, 3137 (2016).